
Dielectric properties of paraffin wax emulsion/copper azole compound system treated wood
iForest - Biogeosciences and Forestry, Volume 12, Issue 2, Pages 199-206 (2019)
doi: https://doi.org/10.3832/ifor2879-012
Published: Apr 10, 2019 - Copyright © 2019 SISEF
Research Articles
Abstract
In order to investigate the interactions among the waterproof agent, preservative and wood, the dielectric relaxation was measured for untreated wood and wood samples treated with different paraffin wax emulsion/copper azole (CA) compound systems at oven-dried and air-dried state, respectively. The Cole-Cole plot analysis was then conducted and the results were as follow. At oven-dried state (-60 °C), the dielectric characteristics of paraffin wax emulsion treated wood were basically the same as those of untreated wood; CA treatment increased the dielectric constant but decreased the dielectric loss factor and the trends of these two characteristic parameters were more remarkable at higher CA concentration; the dielectric properties of compound system treated wood under C4A grade were similar to those of CA treated wood but an increase in impregnation of paraffin wax emulsion gave rise to decreased dielectric constant and increased loss factor. At air-dried state (20 °C, 65% RH), compared with untreated samples, both the dielectric constant and loss factor were lower in waterproofing agent treated wood and these parameters reduced with increasing waterproofing agent concentration; for CA treated samples, the values of dielectric parameters increased and the trend was similar to those treated with the compound system under C4A grade.
Keywords
Wood, Paraffin Wax Emulsion, Copper Azole, Dielectric Properties
Introduction
As a kind of biomass materials, wood is easily subjected to biological deterioration caused by microorganisms and termites. At the same time, the fluctuation of daily temperature and humidity inevitably gives rise to the deformation (cracks, warps, etc.) on wood products. Therefore, both decay resistance and water repellent performance should be taken into consideration for wooden materials applied in the outdoors, which can not only extend their service time, but also improve their usability. Waterproofing agent has been introduced into water-borne preservatives during wood treatment to obtain wood products with both effective decay resistance and dimensional stability. Wang et al. ([17]) found that the mixture of alkaline copper quaternary (ACQ) and paraffin emulsion prepared by certain natural surfactants, such as tween and span, could dramatically promote the resistance against water for treated wood. Later in our previous works, the compound system of paraffin wax emulsion and copper azole (CA) was developed with high stability, and the treated wood performed well in waterproofing ([18]), anti-mould and anti-blue stain tests ([22]), and decay fungi resistance ([8]). However, there is a lack of research on the micro-mechanism of the interaction among paraffin wax emulsion, CA and wood molecules.
Dielectric relaxation has been proved to be an effective method to reveal the physical and chemical interaction between wood and small molecules such as water, formaldehyde and acetic acid ([20], [21], [1], [7], [6], [13], [15], [19]). The process of dielectric relaxation reflects how the polarization intensity of sample varies with the frequency and temperature change of alternating electric field. The main parameters of dielectric properties are dielectric constant (ε′) and dielectric loss factor (ε″). ε′ is defined as a measure of the material’s ability to become polarized and to store charge when an external electric field is applied to it through parallel plates; ε″ is defined as the measure of the electrical energy which is converted into heat ([14]). The two parameters are both related to the reorientation of dipoles. For oven-dried wood, the most important dipole of wood was the methylol groups in amorphous region of wood cell wall, while for air-dried wood, the adsorbed water dominated. There are many factors affecting both ε′ and ε″. The most important two factors are frequency and temperature. At low frequency, complete orientation of the dipoles are possible leading to high ε′. However, at high frequency, the molecular vibrations are high and hence complete orientation of dipoles does not take place and therefore the ε′ decreases as frequency increases. For ε″, the situation is complex. At low frequency, dipoles are possible to be aligned directly to the electron field and low heat is produced. At high frequency, dipoles fail to orient and the heat is still low. Therefore, as frequency increases, a peak of ε″ exists where there is the phase lag of dipoles orientation against the electron field change. The temperature affects the motivation of dipole molecules. With the increase of temperature, the motivation of dipole molecules becomes easier. Thus, the ε′ increases while ε″ decreases.
The objective of this study was to use dielectric relaxation approach to further analyse the interactions among the waterproof agent, preservative and wood, as well as the mutual effect between these two chemicals in treated wood on their penetration and existing condition under oven-dried and air-dried conditions, respectively. The results were expected to shed some lights on the various macroscopic properties of the compound system treated wood at a microscopic level, and to provide favourable scientific evidences and theoretical supports for the manufacture of waterproofing preservative-treated wood. Besides, the results of this study could found a relationship between dielectric property and other properties of modified wood, such as the durability. Therefore, in practice, the durability of the wood could be quickly known by calculating the dielectric parameters without destroying the wood.
Materials and methods
Materials
Defect-free sapwood from Southern pine (Pinus spp.) was selected as the test material and cut into samples with a size of 10 mm (L) × 10 mm (R) × 3 mm (T) after air-drying. The samples were divided into nine groups according to different treatments (Tab. 1). Wood preservative was CA-B, with mass fraction of two effective components of copper and triazole at 10.4%, purchased from the Guangzhou Xingyue Wood Preservative Ltd. Co., China. Paraffin wax emulsion waterproofing agent was prepared in the laboratory by natural surfactants of alkyl glycoside and span with a solid content of 25%.
Tab. 1 - Group of wood samples according to the treatment applied.
| No. | Group | Concentration / % | |
|---|---|---|---|
| Paraffin wax emulsion |
CA | ||
| 1 | control | 0 | 0 |
| 2 | 0.5%W | 0.5 | 0 |
| 3 | 1.0%W | 1.0 | 0 |
| 4 | 0.3%C | 0 | 0.3 |
| 5 | 0.5%C | 0 | 0.5 |
| 6 | 0.5%W/0.3%C | 0.5 | 0.3 |
| 7 | 1.0%W/0.3%C | 1.0 | 0.3 |
| 8 | 0.5%W/0.5%C | 0.5 | 0.5 |
| 9 | 1.0%W/0.5%C | 1.0 | 0.5 |
Wood treatment by compound systems
According to use categories C3 and C4A, two concentrations of 0.3% and 0.5% for CA were determined to reach the corresponding minimal retention levels, which were labelled as 0.3%C and 0.5%C, respectively. In addition, the concentrations of paraffin wax emulsions used in this study were 0.5% and 1.0%, marked as 0.5%W and 1.0%W, respectively. Sample grouping and the formula for each treatment group are listed in Tab. 1. Wood samples were impregnated via a full-cell process. Specifically, the samples were first exposed to a vacuum condition at -0.01 MPa for 30 min, then submerged in treated liquid under a pressure of 0.5 MPa for 1 h. After impregnation, the pressure was released and the samples were collected, wiped with tissue papers, covered by plastic films, and kept at room temperature for 2 days.
Moisture content control
Oven-dried condition
Treated samples were placed in the open air for one week. After that, they were dried in the oven at 103 ± 2 °C until constant weight. The samples were move into a desiccator at room temperature, waiting for the dielectric test.
Air-dried condition
In order to reach air-dried moisture content, these treated samples were placed in a hermetic jar filled with saturated solution of sodium bromide in a temperature chamber maintained at 20 ± 2 °C, which corresponds to the relative humidity of 65 ± 2%. The average moisture contents of different treated samples at air-dried state are shown in Tab. 2.
Tab. 2 - Average moisture content of wood samples at air-dried state (20 °C, 65%).
| No. | Group | Average moisture content (%) |
|---|---|---|
| 1 | control | 10.81 |
| 2 | 0.5%W | 10.59 |
| 3 | 1.0%W | 10.21 |
| 4 | 0.3%C | 12.21 |
| 5 | 0.5%C | 12.81 |
| 6 | 0.5%W/0.3%C | 11.96 |
| 7 | 1.0%W/0.3%C | 11.53 |
| 8 | 0.5%W/0.5%C | 12.72 |
| 9 | 1.0%W/0.5%C | 12.49 |
Measurement of dielectric properties
Dielectric properties of specimens were measured with the Agilent 4294A® Precision Impedance Analyser (Agilent Technologies, Santa Clara, CA, USA) with plate electrodes at a diameter of 32 mm (image is shown in Fig. S1 - Supplementary material). The measurement was performed within a temperature range from -60 to 20 °C at an interval of 20 °C. Because of the very short testing time (few minutes), the change in the original moisture of the wood samples could be ignored. The selected frequencies were 100 Hz, 316 Hz, 1 kHz, 3.16 kHz, 10 kHz, 31.6 kHz, 100 kHz, 316 kHz and 1 MHz, respectively, as they corresponded to 2.0, 2.5, 3.0, 3.5, 4.0, 4.5, 5.0, 5.5, and 6.0 on a logarithm scale, respectively. The capacitance value (Cp) and the dielectric loss factor (ε″) were directly obtained, and the dielectric constant (ε′) was acquired according to the following formula (eqn. 1):
where ta is the mean thickness of specimens, Cp is the capacitance value, A is the contact area between the wood sample and the electrode plates, ε0 is the permittivity of vacuum (8.845·10-12 F/m).
Cole-Cole plot analysis ([4]) was applied to investigate the dielectric relaxation strength of studied samples, based on the following equation (eqn. 2)
where ε* is the complex dielectric constant; εs is the static dielectric constant, that is, the dielectric constant at extreme low frequency; ε∞ is the optic dielectric constant, namely the dielectric constant at extreme high frequency; (εs - ε∞) is thus defined as the relaxation strength, representing the magnitude of relaxation; ω is the angular frequency, ω = 2πf · τ0 represents average relaxation time; β (0 < β ≤ 1) is the parameter which characterizes the relaxation time distribution: the broader relaxation time distribution is, the less β value becomes ([16]).
In this work, Originpro™ 2016 (OriginLab Corp., Northampton, MA, USA) was used during plotting by reconstructing eqn. 2 into y = [R2 - (x-a)2]0.5+b, with a, b being the centre coordinate and R as radius of the arc.
Results and discussion
Dielectric relaxation under oven-dried condition
Dielectric parameters of untreated wood
Dielectric frequency and temperature spectra for oven-dried untreated wood are compared in Fig. 1. As shown in Fig. 1a, the ε′ value decreases with increasing frequency. ε′ denotes the amount of dipoles participating in reorientation ([10], [5]), and the primary dipoles in the untreated oven-dried wood samples are methylol groups in the amorphous region of wood cell walls. With increasing frequency, these dipoles were difficult to reorient in alternating electric field, thereby reducing the value of dielectric constant ([9]). Fig. S2a (Supplementary material) shows the sketch image of methylol groups reorientation in oven-dried untreated wood in the alternating electric field. There is only a peak for dielectric loss factor at -60 °C (Fig. 1b) and this peak disappears with increasing temperature, because the peak moves to a higher frequency with increasing temperature, which is beyond the testing scope. It was suggested that this peak was caused by the reorientation of the dipoles that cannot completely synchronize with the changing electric fields as presented in the introduction part ([9]). Therefore, for a better investigation, dielectric relaxation process of oven-dried samples at -60 °C was chosen.
Fig. 1 - The frequency (a,b) and temperature spectra (c,d) of ε′ (a, c) and ε″ (b, d) for untreated wood at oven-dried state.
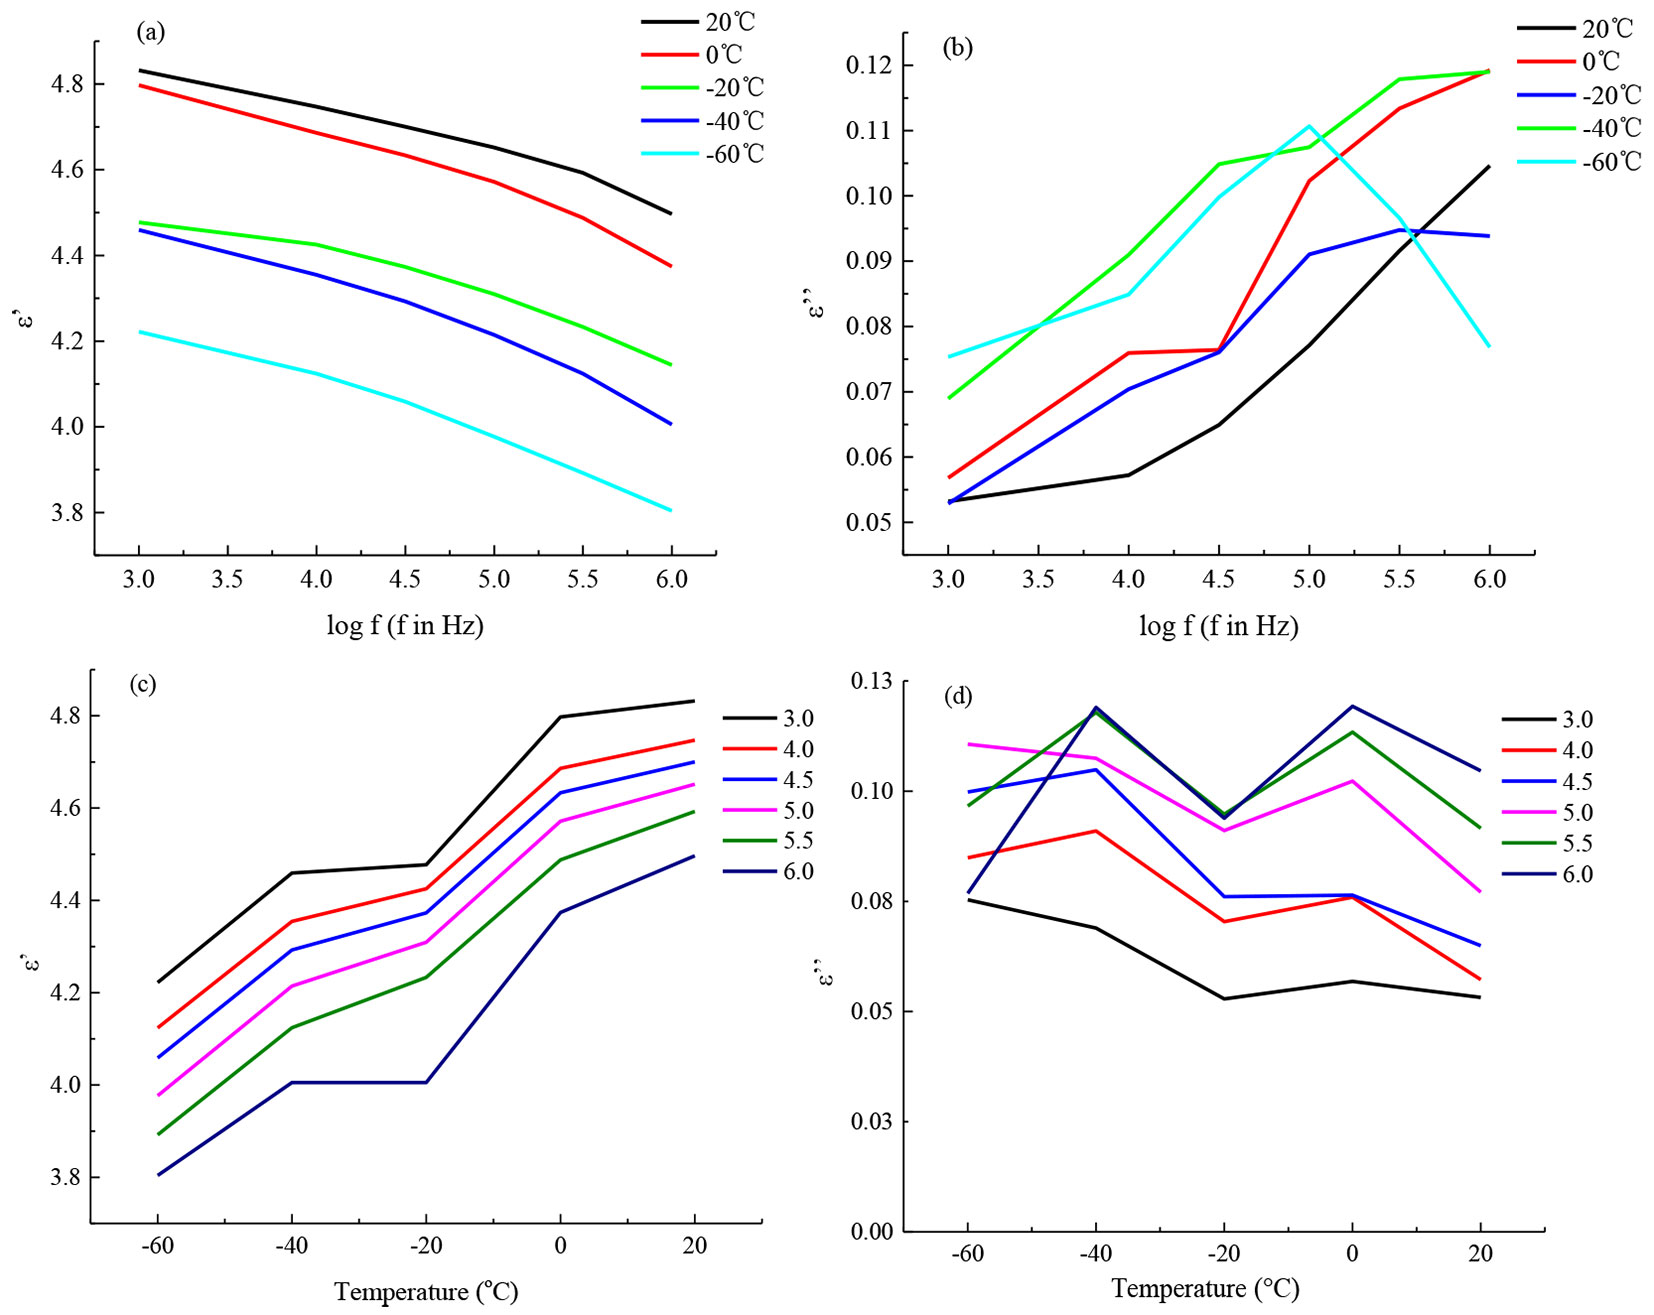
On the other hand, as shown in Fig. 1c, the ε′ increases with increasing temperature, from 3.8-4.2 when the temperature is -60 °C to 4.5-4.8 when the temperature reaches 20 °C. This is because the higher temperature would intensify the movement of wood molecules, giving rise to more reorientation of dipoles in alternating electric field and a higher value of dielectric constant ([9]). It can be seen from Fig. 1d that there are two obvious peaks in the spectrum, representing two types of dielectric relaxation processes which are designated here as relaxation process R-I and relaxation process R-II, respectively. R-I appears in the low temperature region with the peak at around -40 °C. This had been previously reported and was attributed to reorientation the of methylol groups ([12], [11]) described above. R-II occurs at 0 °C, which was not observed on wood in the literature. The reason may be related to the method of sample preparation. In their researches, samples were extracted to remove wood extractives prior to dielectric measurement. Therefore, it is reasonable to relate R-II to the contribution of the solvent removable extractives present in wood ([2]).
Dielectric parameters of paraffin wax emulsion treated samples
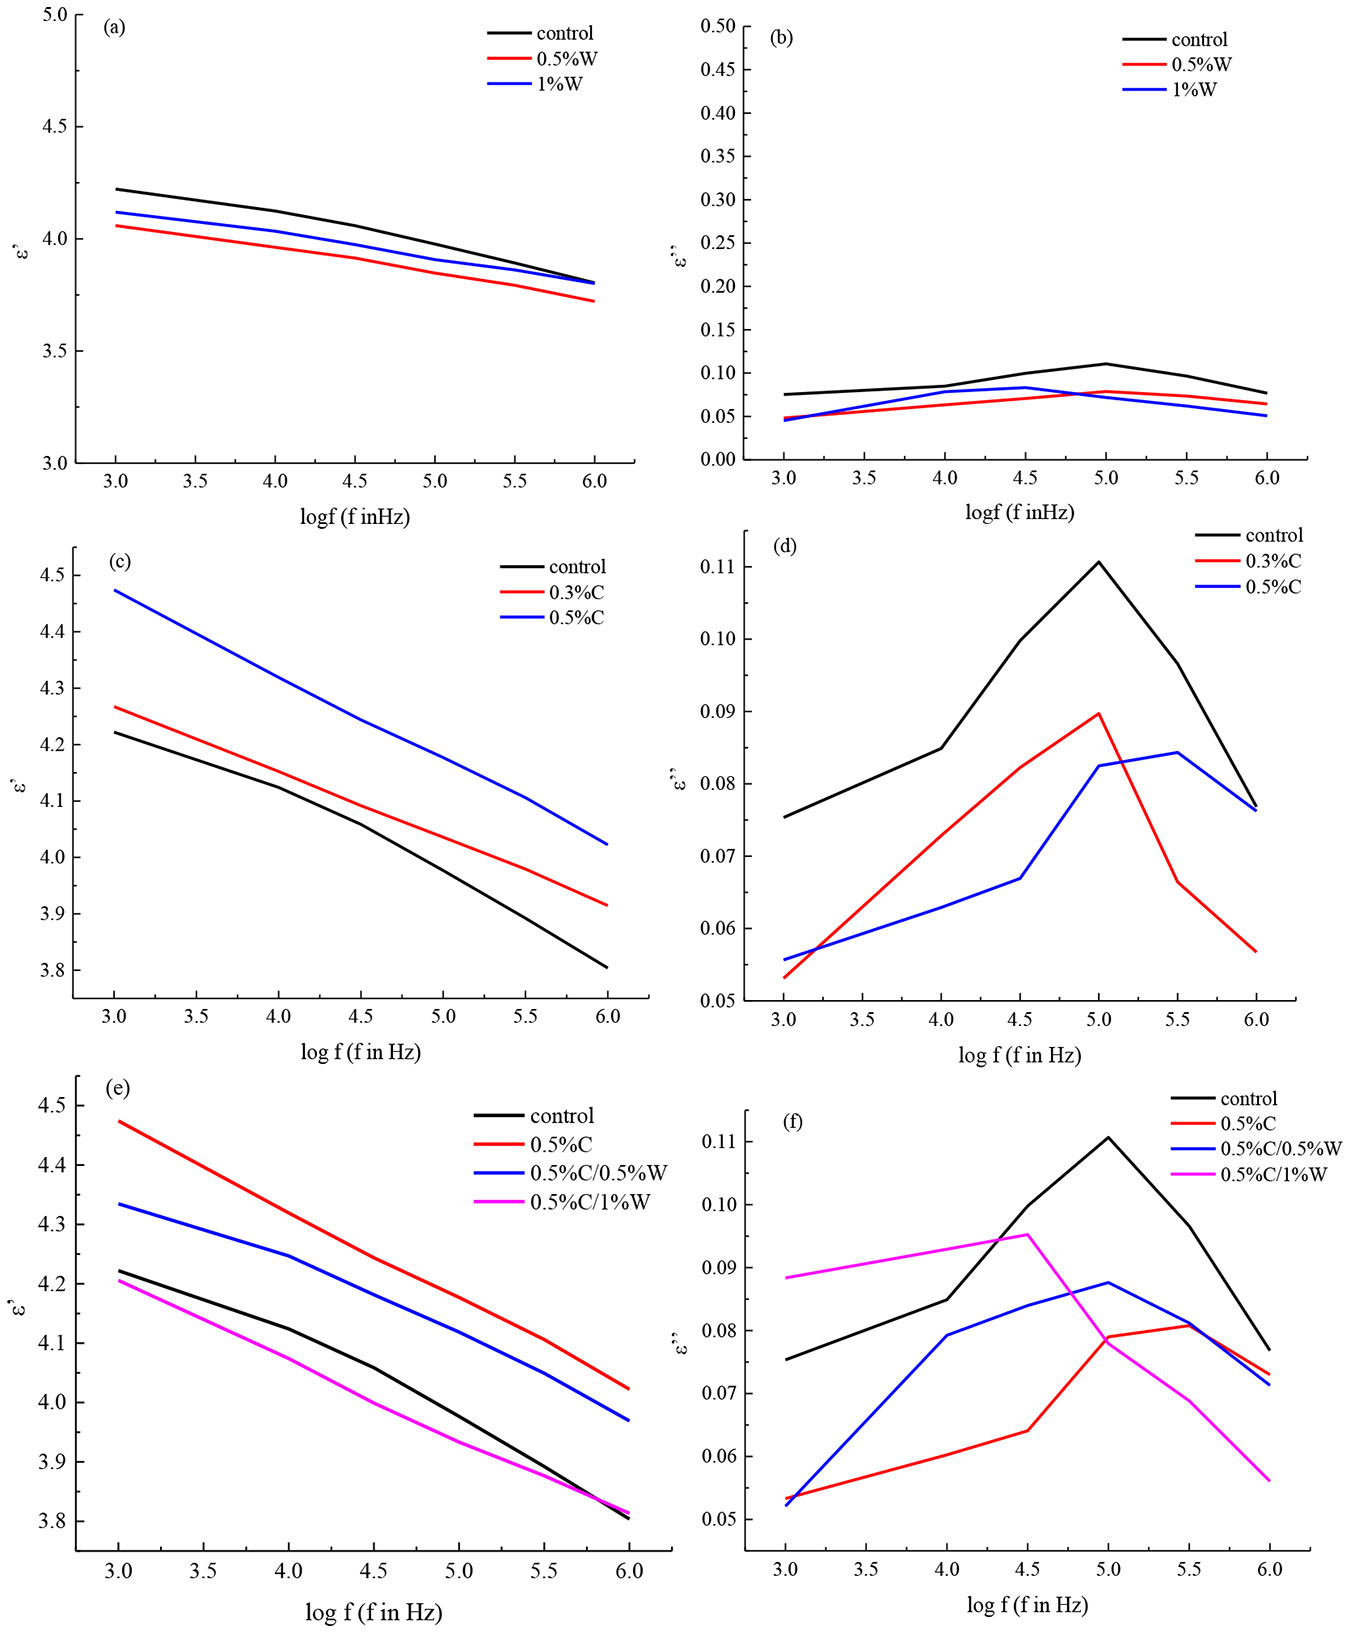
The frequency spectra of ε′ and ε″ for paraffin wax emulsion treated samples at oven-dried state (-60 °C) are presented in Fig. 2a and Fig. 2b. The dielectric curves of ε′ and ε″ for paraffin wax emulsion treated samples are roughly the same as those of untreated samples. It is apparent that the ε′ for all the three groups decreases with increasing frequency and their maximal dielectric loss factors are nearly the same, peaking around 100 kHz. Slightly decreased ε′ and ε″ values are observed in paraffin wax emulsion treated samples for all frequencies. This is because primarily the paraffin is physically adsorbed on the internal surface of wood cell walls instead of chemically reacting with the hydroxyls in wood substances, which hindered little to the diopoles of methyoxyl ([22]). Therefore, waterproofing agent almost had little influence on the dielectric properties of wood under anhydrous state.
Fig. 2 - The frequency spectra of ε′ (a, c, e) and ε″ (b, d, f) for samples treated with paraffin wax emulsion (a, b), CA (c, d), and the compound systems under C4A grade (e, f) at oven-dried state (-60 °C).
Dielectric constant and dielectric loss factor of CA treated samples
Fig. 2c shows that, at a given frequency, the value of ε′ for CA treated samples is higher than that of untreated ones and this trend becomes greater as the concentration of the preservative rises. It can be speculated there was ionic polarization caused by a portion of copper ions of CA in the alternating electric field, leading to a higher dielectric constant for CA treated wood and this value of ε′ would increase with the increase of copper ions (sketch images are shown in Fig. S2b - Supplementary material).
Fig. 2d compares the ε′ between untreated and CA treated samples under anhydrous state (-60 °C). The ε″ values of 0.3%C and 0.5%C groups are lower than that of the control. Besides, although the maximum value of ε″ of 0.3% CA treated group shows the same location at 100 kHz, 0.5% CA increases to high frequency region. According to earlier research ([22]), the number of copper ions in CA treated wood would react with methylol groups in the amorphous region of wood cell walls, causing less reorientation of methylol groups. On the other hand, copper ions would exert steric hindrance on the methylol groups around which had difficulties in reorientation as a result. The higher content of copper ions, the more difficult of reorientation of methylol groups took place. These are the reasons why decreased value of ε″ and shifted maximum value at high frequency region are obtained in CA treated groups.
Dielectric constant and dielectric loss factor of compound system treated samples
As shown in Fig. 2e, compared with untreated samples, the ε′ of 0.5%C/0.5%W is higher. This is in accordance with the presence of copper ions. However, increase of paraffin wax emulsion concentration slightly reduced the ε′ value of sample treated with the compound system. Based on the results from a previous study ([18]), the impregnation of waterproofing agent would prevent a few copper ions from penetrating into wood cell walls. In Fig. 2e, it can be seen that the dielectric constant of compound system treated wood is basically the same as that of the control when the concentration of paraffin wax emulsion is 1%. This can be interpreted as the impregnation of waterproofing agent gave rise to a decrease of the concentration of copper ions in treated samples, weakening the intensity of ionic polarization.
In Fig. 2f, compared with the ε″ between untreated and compound system treated samples, the peak of the samples with compound system treatment is a little lower than that of untreated samples, which was caused by the decreased reorientation of methylol groups that had been bonded with the copper ions in the compound system to form complex. On the other hand, the impregnation of paraffin wax emulsion at higher concentration blocked the formation of complex between copper ions and methylol groups to some extent and thus the peak value of compound system treated wood become greater with more addition of paraffin wax emulsion.
Dielectric relaxation under air-dried condition
Dielectric constant and dielectric loss factor of paraffin wax emulsion treated samples
The frequency spectra of ε′ and ε″ of paraffin emulsion treated samples at air-dried state (20 °C, 65% RH) are illustrated in Fig. 3a and Fig. 3b. In air-dried state, the dipoles in wood are not only the methylol groups but also adsorbed water (a sketch image is given in Fig. S3a - Supplementary material). The decreased amplitude of paraffin wax emulsion treated samples at air-dried state is much larger than that at oven-dried state. This was because the impregnation of paraffin wax emulsion endowed treated wood with water-resistant ability by filling up wood cell lumen and forming wax membrane on the surface of wood cell walls, which could not only hinder the movement of water molecules in cell lumen, but also prevent the moisture from being adsorbed into cell walls ([3]). Therefore, the moisture content of paraffin wax emulsion treated wood is lower than that of untreated wood after being air-dried (Tab. 2), and fewer dipoles participated in the reorientation.
Fig. 3 - The frequency spectra of ε′ (a, c, e) and ε″ (b, d, f) for samples treated with paraffin wax emulsion (a, b), CA (c, d), and the compound systems under C4A grade (e, f) at air-dried state (20 °C, 65% RH).
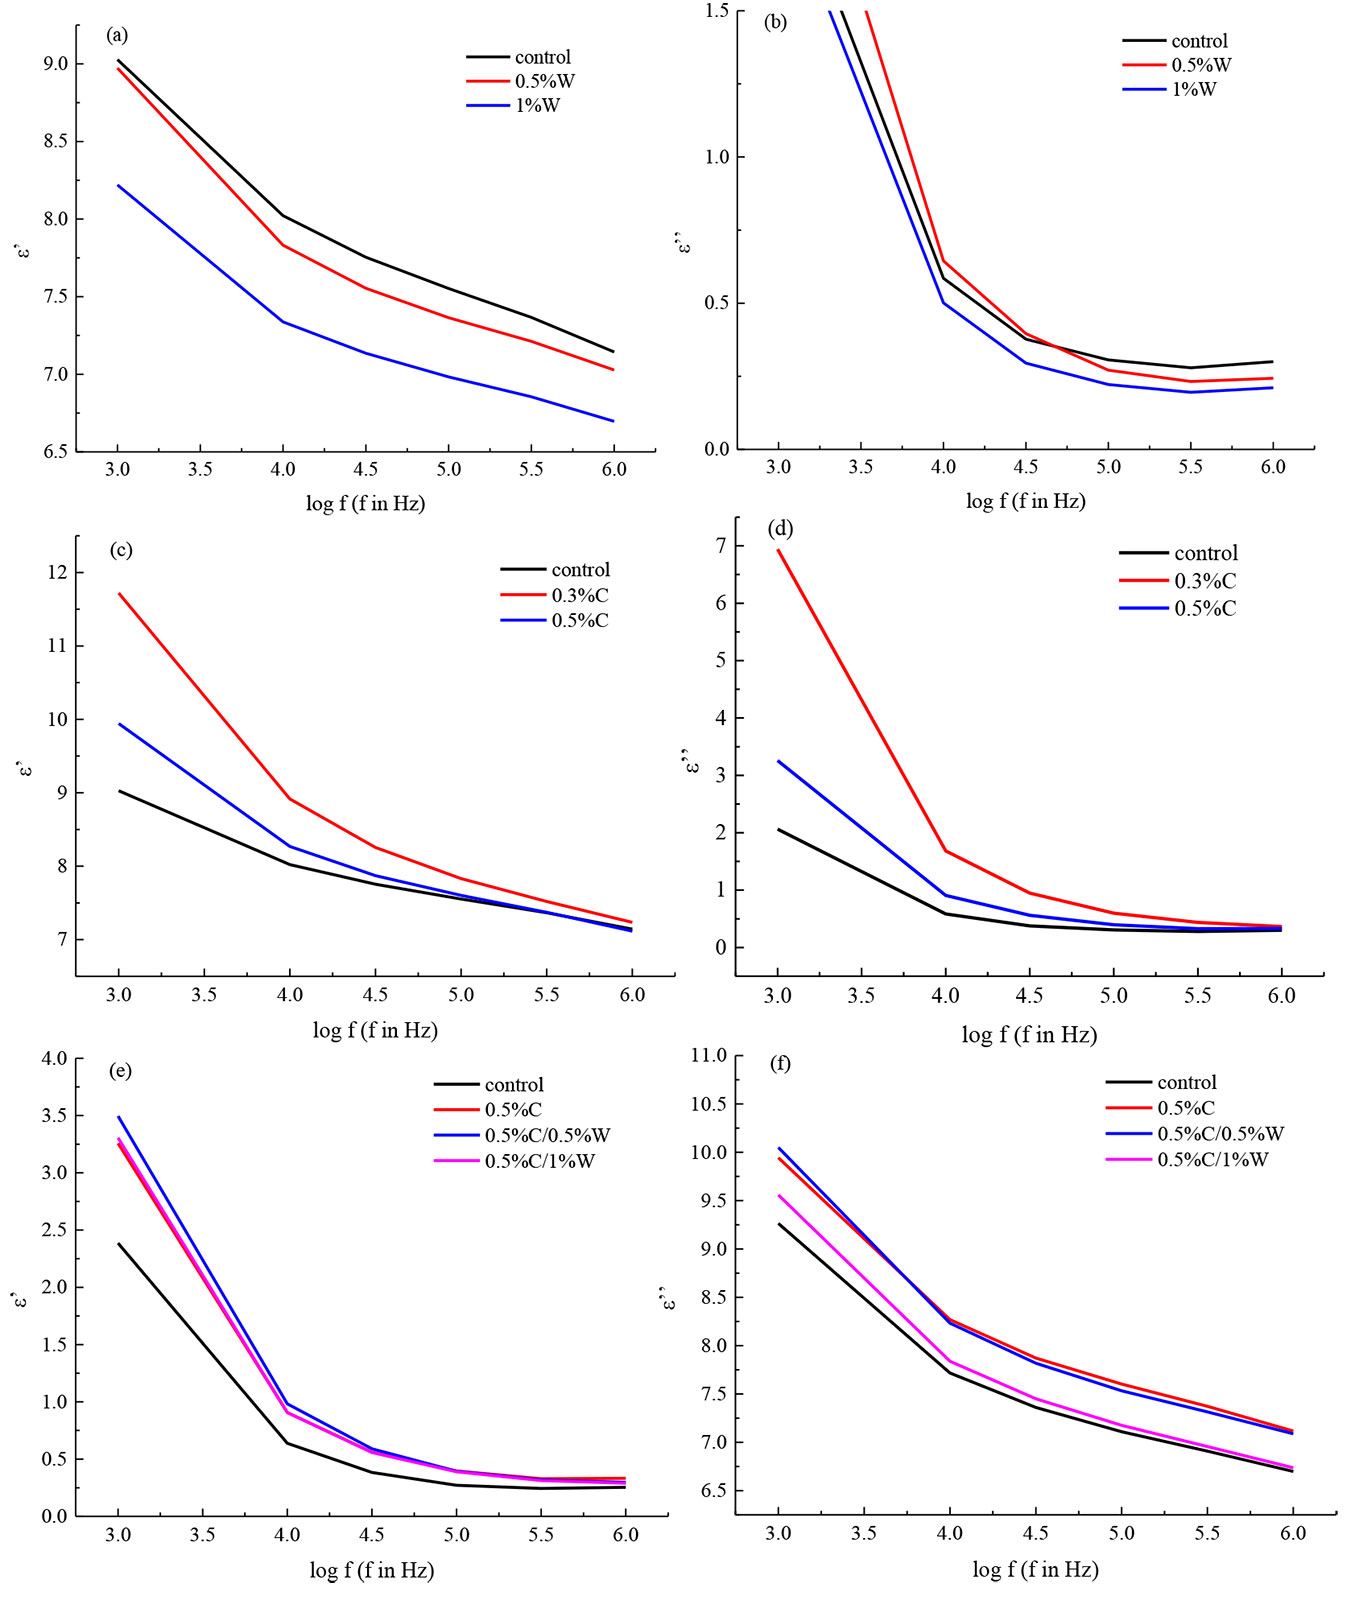
Further, in Fig. 3b the ε″ of paraffin wax emulsion treated wood declines with increasing frequency, as well as that of untreated samples. It can be suggested that the increasing frequency made it difficult for dipoles to keep up with the changes in alternating electric field, leading to a lower value of ε″. Because the moisture content decreased after treating with paraffin wax emulsion, the ε″ of the treated groups at 1%W is lower than that of the control.
Dielectric constant and dielectric loss factor of CA treated samples
In Fig. 3c, apparently, ε′ of CA treated wood is higher than that of untreated wood at a specific frequency, but this value declines with increasing concentration of the preservative. Another distinct difference with the oven-dried state is that at air-dried condition, there was certain amount of adsorbed water molecules in the samples in addition to the interactions between methylol groups and CA. Based on a previous study ([18]), with CA treatment, these treated groups owned a higher moisture content than the control, producing more adsorbed water molecules in CA treated wood, which means more dipoles taking part in reorientation. Interestingly, as shown in Tab. 2, the CA treated samples at 0.3% and 0.5% concentration have similar moisture content, which indicates that their numbers of adsorbed water molecules are almost the same. However, the more copper ions in CA would compete with the adsorbed water simultaneously reduce the accessible primary hydroxyl groups in wood cell walls, leading to a lower number of methylol groups participating in reorientation (see the grey line in the sketch image - Fig. S3b in Supplementary material). Thus the ε′ of samples treated with 0.5% CA was lower than that of wood treated with 0.3% one.
Fig. 3d shows that, compared with the control, the preservative treated wood obviously possesses a high value of ε″, although this value drops as the concentration of CA increases. The reason for the decreased ε″ was the same to that of ε′, i.e., more copper ions in CA reduce the accessible primary hydroxyl groups in wood cell walls. Therefore, the generated heat of dipoles was lower.
Dielectric constant and dielectric loss factor of compound system treated samples
As shown in Fig. 3e, compared with untreated wood, samples treated with compound system have higher ε′ because of their higher moisture content (Tab. 2). The trend is similar to the samples treated with the preservative agent only as mentioned above (Fig. 3c). However, compared with CA treated groups, the compound system treated samples have lower value of ε′. Two reasons might account for this phenomenon: (i) the impregnation of waterproofing agent enhanced the water-resistant ability of compound system treated wood, leading to a lower number of adsorbed water molecules; (ii) the impregnation also reduced the amount of copper ions existing in wood cell walls and thus resulted in a decrease of orientation polarization inside.
In Fig. 3f, as expected, after being treated with CA, the samples have higher ε″ than untreated group due to more energy lost when more dipoles participated in the reorientation. However, the values of ε″ in the compounds were slight lower than that in the CA treated sample (0.5%C). This might occur because the amount of copper ions existing in wood cell walls was reduced.
Cole-Cole plots
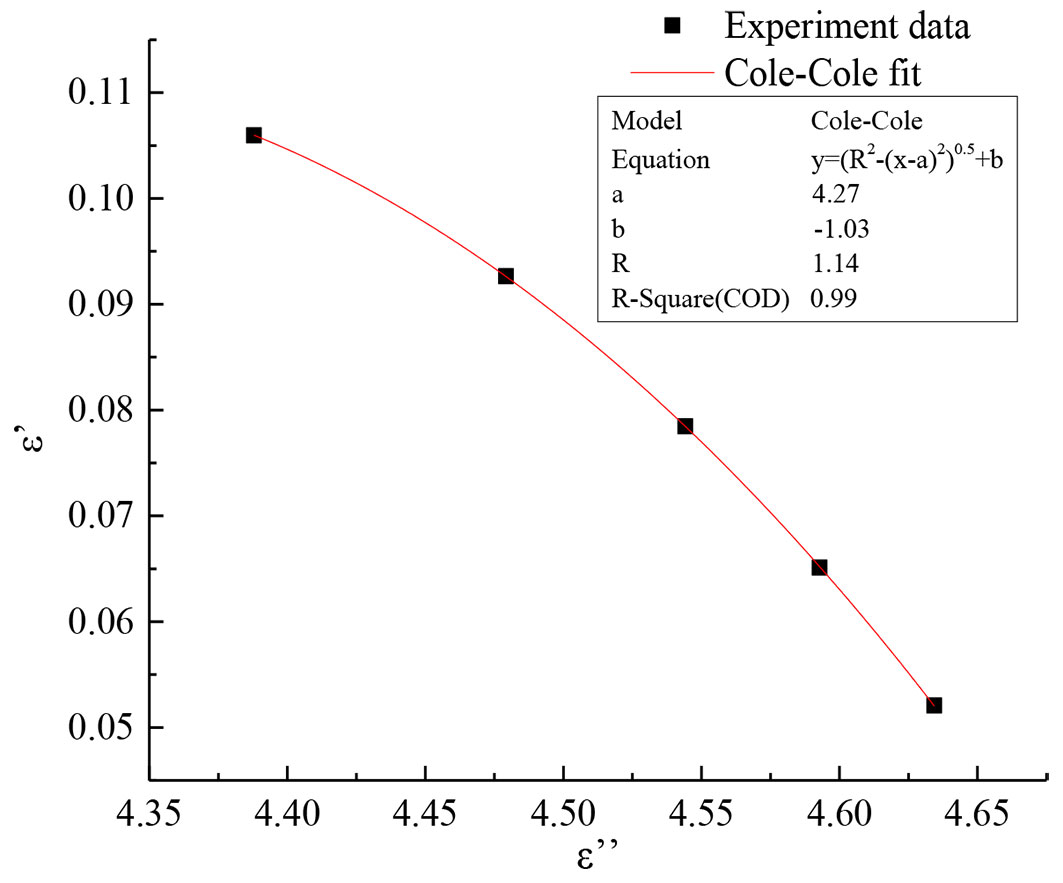
The Cole-Cole plots for paraffin wax emulsion (1%) treated wood under oven-dried state at 20 °C, as an example, is shown in Fig. 4. The Cole-Cole parameters for other dielectric data under oven-dried and air-dried states at 20 °C are summarized in Tab. 3. It can be seen that fitting result is good as the value of R2 is near to 0.99. Clearly, the value of (εs - ε∞) for all the samples at air-dried state is much higher than that at anhydrous state. This happened because there were much more adsorbed water molecules in air-dried samples participating in reorientation as dipoles.
Fig. 4 - The Cole-Cole plot for paraffin wax emulsion (1%) treated samples under oven-dried state at 20 °C.
Tab. 3 - Dielectric characteristic parameters of the control and different kinds of treated samples under oven-dried state and air-dried state, respectively at 20 °C.
| Parameter | Treatment | control | 0.5%W | 1.0%W | 0.3%C | 0.5%C | 0.5%W/ 0.3%C | 1.0%W/ 0.3%C | 0.5%W/ 0.5%C | 1.0%W/ 0.5%C |
|---|---|---|---|---|---|---|---|---|---|---|
| a | oven-dried | 4.43 | 4.15 | 4.27 | 4.30 | 4.45 | 4.39 | 4.48 | 4.12 | 4.50 |
| air-dried | 45.43 | 29.03 | 25.06 | 117.13 | 70.25 | 73.64 | 41.95 | 63.36 | 56.90 | |
| b | oven-dried | -0.95 | -0.91 | -1.03 | -1.28 | -1.66 | -0.99 | -0.87 | -1.42 | -0.86 |
| air-dried | -26.53 | -19.41 | -15.33 | -57.80 | -70.63 | -49.06 | -47.41 | -39.35 | -49.56 | |
| R | oven-dried | 1.06 | 1.02 | 1.14 | 1.39 | 1.77 | 1.11 | 0.96 | 1.53 | 0.96 |
| air-dried | 46.24 | 29.23 | 23.94 | 123.56 | 94.70 | 82.44 | 58.94 | 68.34 | 70.44 | |
| R 2 | oven-dried | 0.99 | 0.99 | 1.00 | 0.99 | 1.00 | 0.99 | 0.99 | 0.99 | 0.99 |
| air-dried | 0.98 | 0.99 | 0.98 | 0.98 | 0.98 | 0.98 | 0.98 | 0.99 | 0.99 | |
| ε∞ | oven-dried | 3.93 | 3.69 | 3.77 | 3.76 | 3.83 | 3.88 | 4.03 | 3.63 | 4.07 |
| air-dried | 7.56 | 7.17 | 6.84 | 7.92 | 7.17 | 7.38 | 6.93 | 7.48 | 6.85 | |
| εs | oven-dried | 4.86 | 4.62 | 4.76 | 4.84 | 5.06 | 4.89 | 4.88 | 4.79 | 4.92 |
| air-dried | 83.30 | 50.88 | 43.27 | 226.33 | 133.32 | 139.89 | 76.96 | 119.23 | 106.95 | |
| εs - ε∞ | oven-dried | 0.93 | 0.93 | 0.99 | 1.08 | 1.23 | 1.01 | 0.85 | 1.16 | 0.85 |
| air-dried | 75.74 | 43.71 | 36.43 | 218.41 | 126.15 | 132.51 | 70.03 | 111.75 | 101.10 |
The comparison of relaxation strength (εs - ε∞) among different kinds of treated groups at oven-dried state (20 °C) is demonstrated in Fig. 5. It can be obtained from Fig. 5a that the relaxation strength of paraffin wax emulsion treated wood is similar to that of untreated samples. In Fig. 5b, the (εs - ε∞) of CA treated samples is higher than that of untreated wood and this difference is intensified at higher concentration of CA treatment. As for Fig. 5c, compared with the control, values of (εs - ε∞) of samples after being treated with preservative increase but there is a light decrease in compound system treated wood as the concentration of waterproofing agent rises. These results are in accordance with those of the dielectric constant at oven-dried state as discussed above.
Fig. 5 - The (εs - ε∞) comparison among (a) paraffin wax emulsion treated samples, (b) CA treated samples and (c) the samples treated with the compound systems at C4A grade under oven-dried state at 20 °C.
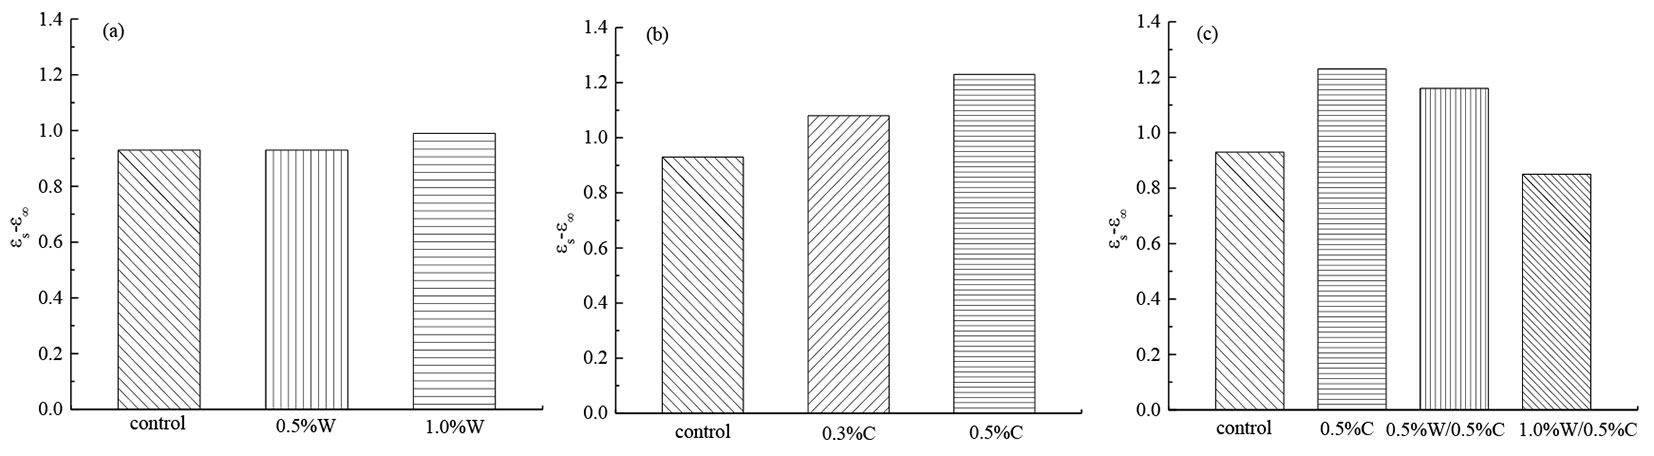
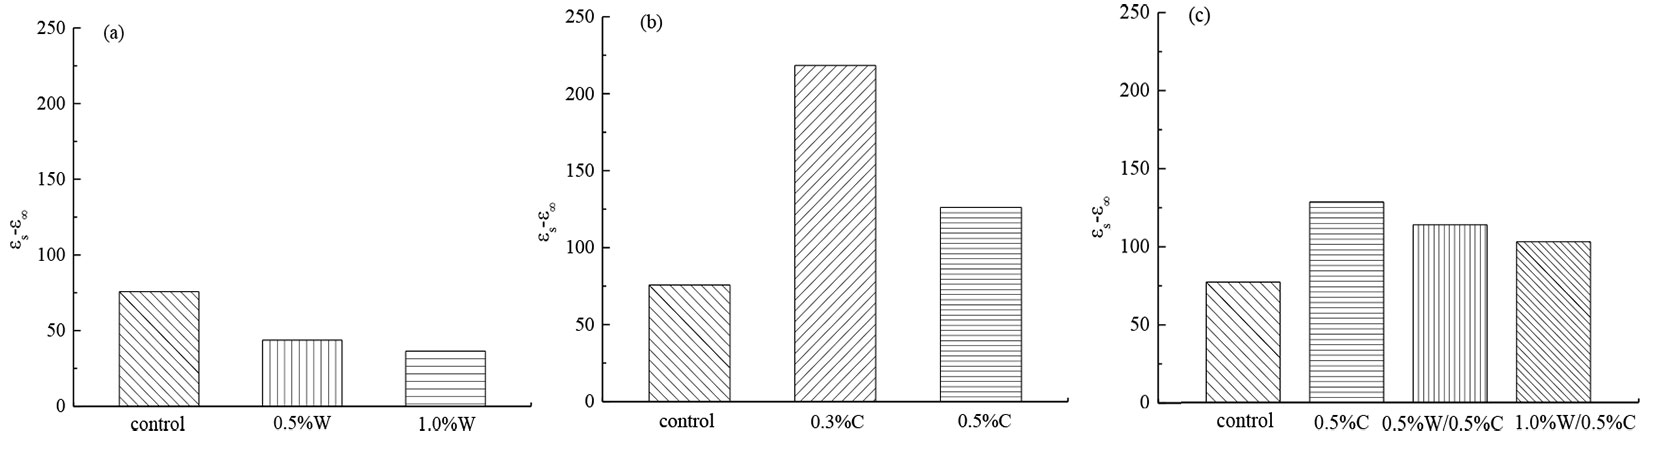
Fig. 6 gives the comparison of relaxation strength (εs - ε∞) among different kinds of treated groups at air-dried state (20 °C). Compared with the control, paraffin wax emulsion treated wood exhibits a lower (εs - ε∞) and it decreases with increasing concentration of waterproofing agent (Fig. 6a). In Fig. 6b, it can be seen that CA treated samples have a higher relaxation strength than untreated samples, but their values reveal a downward trend with a higher CA concentration. Further in Fig. 6c, the samples treated by CA or compound system under C4A grade have stronger relaxation strength than the control group; however, the (εs - ε∞) values of compound system treated groups decrease with increasing concentration of paraffin wax emulsion. Similarly, these results agree with those of the dielectric constant at air-dried state analysed above.
Fig. 6 - The (εs - ε∞) comparison among (a) paraffin wax emulsion treated samples, (b) CA treated samples and (c) the samples treated with the compound systems at C4A grade under air-dried state at 20 °C.
Conclusion
The dielectric relaxation of wood (Pinus spp.) with paraffin wax emulsion, CA and compound system treatments were investigated at both oven-dried (-60 °C) and air-dried states (20 °C, 65% RH) and further analysed by Cole-Cole plots. The dielectric relaxation parameters were highly related to the decay resistance of the treated wood. Due to more adsorbed water molecules participating in reorientation, the dielectric constant and relaxation strength were much higher at air-dried condition than those at oven-dried state. Because the paraffin primarily physically adsorbed on the surface of wood cells, leading to a lower moisture content of paraffin wax emulsion treated wood, the dielectric constant of waterproofing agent treated wood was lower than that of untreated samples at air-dried state. On the other hand, CA would react with methylol groups in the amorphous region of wood cell walls at oven-dried state, resulting in a reduced value of loss factor. When samples treated with the compound systems, the dielectric parameters (dielectric constant, loss factor and relaxation strength) were lower than those of CA treated samples under the same grade, which means that the impregnation of paraffin wax decreased the number of copper ions and the moisture content in compound system treated wood. Therefore, the durability of the wood in the compound system could be reduced. As a result, this study provided a non-destroyed dielectric testing method to quickly know the durability of preservative treated wood in practice.
Acknowledgements
This study was financially supported by Fundamental Research Funds for the central Universities of China (No. 2015ZCQ-CL-01).
References
Gscholar
Gscholar
Gscholar
Gscholar
Authors’ Info
Authors’ Affiliation
Erni Ma 0000-0001-9774-9779
MOE Key Laboratory of Wooden Material Science and Application, Beijing Forestry University, Qinghua East Road 35, Haidian 100083, Beijing (China)
Research Institute of Wood Industry, Chinese Academy of Forestry, Haidian 100091, Beijing (China)
Corresponding author
Paper Info
Citation
Liao Y, Ma E, Liu R (2019). Dielectric properties of paraffin wax emulsion/copper azole compound system treated wood. iForest 12: 199-206. - doi: 10.3832/ifor2879-012
Academic Editor
Giacomo Goli
Paper history
Received: Jun 03, 2018
Accepted: Jan 23, 2019
First online: Apr 10, 2019
Publication Date: Apr 30, 2019
Publication Time: 2.57 months
Copyright Information
© SISEF - The Italian Society of Silviculture and Forest Ecology 2019
Open Access
This article is distributed under the terms of the Creative Commons Attribution-Non Commercial 4.0 International (https://creativecommons.org/licenses/by-nc/4.0/), which permits unrestricted use, distribution, and reproduction in any medium, provided you give appropriate credit to the original author(s) and the source, provide a link to the Creative Commons license, and indicate if changes were made.

Web Metrics
Breakdown by View Type
Article Usage
Total Article Views: 46697
(from publication date up to now)
Breakdown by View Type
HTML Page Views: 38399
Abstract Page Views: 3855
PDF Downloads: 3517
Citation/Reference Downloads: 0
XML Downloads: 926
Web Metrics
Days since publication: 2634
Overall contacts: 46697
Avg. contacts per week: 124.10
Article Citations
Article citations are based on data periodically collected from the Clarivate Web of Science web site
(last update: Mar 2025)
(No citations were found up to date. Please come back later)
Publication Metrics
by Dimensions ©
Articles citing this article
List of the papers citing this article based on CrossRef Cited-by.
Related Contents
iForest Similar Articles
Technical Notes
Improving impregnation properties of fir wood to acid copper chromate (ACC) with microwave pre-treatment
vol. 8, pp. 89-94 (online: 01 April 2014)
Research Articles
NIR-based models for estimating selected physical and chemical wood properties from fast-growing plantations
vol. 15, pp. 372-380 (online: 05 October 2022)
Short Communications
Effect of intensive planting density on tree growth, wood density and fiber properties of maple (Acer velutinum Boiss.)
vol. 9, pp. 325-329 (online: 22 October 2015)
Research Articles
Physical, chemical and mechanical properties of Pinus sylvestris wood at five sites in Portugal
vol. 10, pp. 669-679 (online: 11 July 2017)
Research Articles
Mechanical and physical properties of Cunninghamia lanceolata wood decayed by brown rot
vol. 12, pp. 317-322 (online: 06 June 2019)
Research Articles
Kinetic analysis of poplar wood properties by thermal modification in conventional oven
vol. 11, pp. 131-139 (online: 07 February 2018)
Research Articles
Characterization of technological properties of matá-matá wood (Eschweilera coriacea [DC.] S.A. Mori, E. odora Poepp. [Miers] and E. truncata A.C. Sm.) by Near Infrared Spectroscopy
vol. 14, pp. 400-407 (online: 01 September 2021)
Technical Advances
Technical properties of beech wood from aged coppices in central Italy
vol. 8, pp. 82-88 (online: 04 June 2014)
Research Articles
Density, extractives and decay resistance variabilities within branch wood from four agroforestry hardwood species
vol. 14, pp. 212-220 (online: 02 May 2021)
Research Articles
Identification of wood from the Amazon by characteristics of Haralick and Neural Network: image segmentation and polishing of the surface
vol. 15, pp. 234-239 (online: 14 July 2022)
iForest Database Search
Search By Author
Search By Keyword
Google Scholar Search
Citing Articles
Search By Author
Search By Keywords
PubMed Search
Search By Author
Search By Keyword


