
Rewilding beech-dominated temperate forest ecosystems: effects on carbon stocks and biodiversity indicators
iForest - Biogeosciences and Forestry, Volume 18, Issue 1, Pages 1-9 (2025)
doi: https://doi.org/10.3832/ifor4600-017
Published: Feb 02, 2025 - Copyright © 2025 SISEF
Research Articles
Abstract
Maximising carbon stock and habitat availability is a critical objective of contemporary forest management, with primary forests serving a crucial function due to their substantial carbon storage potential and biodiversity values. Given the limited extent and fragmentation of primary (mature and old-growth with minimal prior management) forests in Europe, there is a growing interest in understanding how rewilding (long-term management cessation) affects carbon stock and habitat provisioning. Further, little is known about the conditions required for secondary old-growth forests to achieve the carbon volumes and late-successional habitat features associated with primary forests if designated as rewilding areas. Rewilding of forest ecosystems in Europe is still a widely debated strategy, highlighting the importance of evidence-based examples. We compared some of the best-preserved primary old-growth forests with adjacent secondary old-growth forests which have been allowed to undergo self-development for an extended period of seven decades in the ecologically and socially important beech-dominated forests of the Carpathian Mountains. Statistical analysis showed no significant differences in carbon stock and structural biodiversity indicators between the two forest categories. Mean aboveground carbon stock was 207 Mg ha-1 in primary and 213 Mg ha-1 in secondary old-growth plots, which contrasts with values of 107 Mg ha-1 found in managed beech forest stands from the same region. The aboveground biomass carbon increment was 4.3 Mg ha-1 year-1 in primary and 4.5 Mg ha-1 year-1 in secondary plots, respectively. Notably, deadwood volume exhibited the most substantial variation among forest types along with tree microhabitat diversity. Our findings underscore the vital role of protecting and restoring old-growth forest ecosystems for effective carbon stock and biodiversity conservation. We emphasise that forest heterogeneity, encompassing factors such as tree age and diameter, canopy layer, species composition, and growth patterns, are important for enabling managed forests to reach peak carbon storage capacity. Although 70 years is insufficient for secondary old-growth forests to fully recover primary forest characteristics, our study demonstrates that similar structures and functions can develop within less than a century of protection in productive temperate regions of Europe. This study supports rewilding as an effective conservation strategy and Natural Climate Solution.
Keywords
Carbon Stock, Tree Ring Increment, Carpathian Mountains, Secondary Old-growth Forests, Deadwood, Tree Microhabitats, Restoration, Large Trees
Introduction
Optimising carbon sequestration and habitat provision represents a pivotal aim in modern forest management practices. Primary forests, in particular, play an essential role in delivering these aims, owing to their significant capacity for carbon storage and their high biodiversity value ([36], [24]). Considering the scarce and fragmented nature of primary forests across Europe, there is an increasing focus on investigating the impacts of rewilding on carbon sequestration and habitat provision. The objective of rewilding is the ecological restoration of native habitats, encompassing a comprehensive array of species spanning all trophic levels, with a concomitant reduction in human influence and pressures with recognition of the dynamic nature of habitats, acknowledging their continuous and evolving state ([10]). The lack of insights regarding the conditions necessary for secondary old-growth forests to achieve the carbon volumes and late-successional habitat features characteristic of primary forests when designated as rewilding areas highlights the importance of understanding changes in carbon storage and biodiversity indicators under rewilding scenarios for effective implementation of these nature-based solutions.
Biodiversity conservation and carbon sequestration are interconnected processes that work synergistically ([5]). Structural parameters typically found in carbon-rich primary forests, such as high volumes of coarse woody debris (CWD) and snags, tree-related microhabitats (TreM) diversity, and variability in tree heights, age, diameter and deadwood decomposition stages, are important for preserving biodiversity and should be considered in conservation management plans ([25]). Specifically, aboveground carbon stocks are influenced by tree size heterogeneity, in particular, by the presence of large (habitat) trees, which simultaneously enhance species richness ([30], [24]). Habitat trees can also enrich the productivity and long-term resilience of carbon stocks in forest ecosystems ([6]). Additionally, there is some evidence suggesting that large trees are pivotal in regulating microclimate and nutrient cycling, further supporting the resilience of forest ecosystems by facilitating tree regeneration through shared assimilates and water ([16]). In addition to large living trees, primary forests contain high quantities and variation of deadwood objects. The size, decay stage and density of deadwood significantly influence both biodiversity and carbon stocks ([39]): for example, the presence of decomposing deadwood and litter play crucial roles in carbon dynamics and are essential components of forest carbon stocks. Further, deadwood abundance and decomposition status are keystones for the existence of saproxylic species ([33]) and cavity use by vertebrates ([21]). The occurrence of tree microhabitats is closely related to both large trees and deadwood ([25]). Despite these vital structural qualities, the protection of primary forests in Europe have been an ongoing challenge for many years and their area has been dramatically reduced ([43]).
To attain the carbon sequestration and biodiversity advantages characteristic of primary forests in this region, the primary recourse frequently lies in restoring previously managed forests to secondary old-growth forest ecosystems. Secondary old-growth forests, which have experienced some level of human disturbance but have since regenerated naturally and have developed for a considerable time ([11]), possess several characteristics that make them valuable in terms of carbon stock and sequestration. They often exhibit different heterogeneous structures, with varying tree ages and canopy openings leading to a mosaic of habitats that support both early- and later-seral biodiversity as well as habitat generalists. Seral mosaics also contribute to enhancing net carbon uptake and stock at landscape scales ([36]). Recent studies suggest that cessation of management leads to a progressive rise in biomass accumulation over extended timeframes, highlighting unmanaged forest regions as ongoing carbon sinks with sustained tree biomass accrual ([37], [28]). Nonetheless, there is a paucity of knowledge regarding the prerequisites for secondary old-growth forests to attain comparable levels of carbon storage and habitat characteristics as those found in primary forests.
The mountain forests of Central Europe exhibit remarkable ecological resilience, demonstrating the ability to progress towards old-growth conditions, despite past management practices and ongoing natural disturbances ([2]) and it is an ideal location to investigate forest rewilding. While many studies have explored differences in managed and unmanaged forests, there is a scarcity of research that comprehensively examines aspects such as dead wood, carbon stock, large trees, and tree microhabitats simultaneously in primary and secondary old-growth forests ([48], [21], [2]). Understanding the nuances of these forests becomes imperative as global efforts intensify to address climate change, protect ecosystems, and restore forests through rewilding.
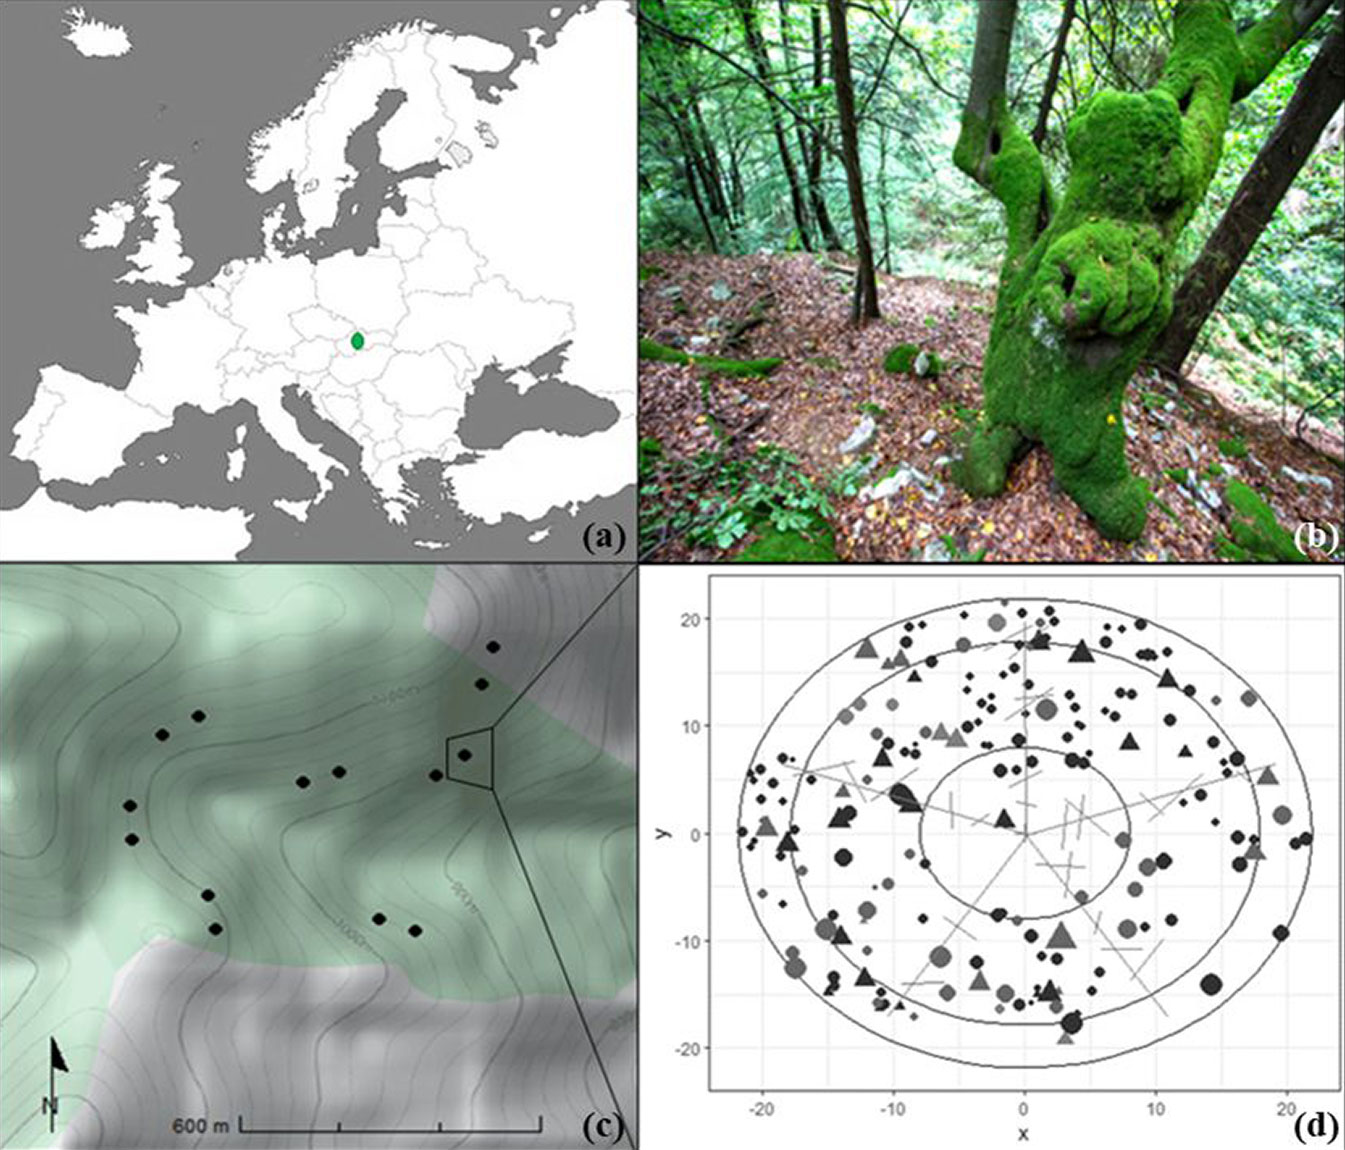
This study informs ongoing policy discussions of rewilding and climate mitigation by comparing carbon stock and structural indicators of biodiversity in primary and secondary old-growth, uneven-aged forests (Tab. 1). The paper addresses principal research questions related to ecologically and socially important beech-dominated temperate forests, using sites in the Carpathian Mountains in Central Europe (Slovakia - Fig. 1a): (i) Does forest structure differ between primary and rewilded secondary old-growth forests? (ii) How do carbon stock and aboveground biomass carbon increment compare between primary and secondary old-growth forests? (iii) How do structural biodiversity indicators (deadwood, large trees and microhabitats) vary between primary and secondary old-growth forests?
Tab. 1 - The age estimation of the surveyed primary and secondary old-growth plots for the year 2023. (Std): standard deviation.
| Parameter | Primary | Secondary old-growth | ||
|---|---|---|---|---|
| Mean | Std | Mean | Std | |
| Plot tree age | 125 | 43.83 | 128 | 39.94 |
| Minimum plot tree age | 46 | 30.22 | 53 | 20.93 |
| Maximum plot tree age (oldest tree) | 260 (345) | 54.21 | 233 (313) | 64.02 |
| Age of five oldest trees | 225 | 51.46 | 194 | 62.25 |
Fig. 1 - Study site description. (a) The study area in Slovakia, Central Europe; (b) an example of a forest plot structure with a microhabitat tree; (c) an example of plot locations; and (d) an example arrangement of trees and deadwood within one plot, different shadows of the grey represent different species.
Methods
This study analysed data obtained from permanent research plots established in the Western Carpathian Mountain region dominated by European beech (Fagus sylvatica L.) in the southern part of the Malá Fatra Mountain range in Slovakia (Tab. 2). Slovakia holds significant prominence within the Western Carpathian Mountains, as well as within European forests, belonging to countries with very low forest fragmentation index. This region harbours some of the last vestiges of European temperate primary forests ([43]) but represents only 0.5% of the total forested area in the country ([35]).
Tab. 2 - Basic plot characteristics. The plot seasonal mean temperatures (05/01 - 10/31) were obtained by downscaling the Worldclim gridded data. For precipitation, we used data from Climate Explorer, and we extracted geological structure and soil type data from the Landscape Atlas of the Slovak Republic.
| Parameter | Primary | Secondary old-growth |
|---|---|---|
| Year of data collection | 2019 | 2021 |
| Altitude range (m a.s.l.) | 769-1142 | 579-1213 |
| Slope range (°) | 23-40 | 25-41 |
| Seasonal mean temperature (°C) | 10.0 | 10.1 |
| Annual mean rainfall (mm) | 1080 | 994 |
| Dominant species | Fagus sylvatica L. | |
| Number of plots | 26 | 17 |
| Longitude E (dec deg) | 19.0818-19.1103 | 18.9430-19.1289 |
| Latitude N (dec deg) | 49.1713-49.1922 | 49.1615-49.2225 |
| Geological structure | Granites to granodiorites | |
| Soil type | Cambisols and umbrisols | |
Study area
Based on a national inventory of primary forests in Slovakia between 2009 and 2015 ([35]), we selected primary forest plots (n = 26) in Šútovská Valley and Šrámková Nature Reserves (Fig. 1c), strictly protected since 1967. The plots are part of a comprehensive, long-term project investigating natural forest dynamics ([42]). Disturbance events in these primary forests are mostly moderate severity but also include very high severity effects, including the most recent wind disturbance in 2002 that removed 72% of the canopy area on one plot ([15]). In the survey, the classification of primary forests was exclusively reserved for plots where no human activity directly impacted the tree layer.
Selection criteria for secondary old-growth forest plots (n = 17) involved careful consideration of the current forest spatial distribution. Forest plots were selected within the proposed Zone A of the Malá Fatra National Park, designated for heightened future protection. Furthermore, the selected forests were required to be without historical intensive management due to their inaccessibility, great distance from roads, and rugged terrain with steep slopes. They all fall into the category of forests with a protective function, with an age of more than 100 years old (average age of 128 years) and situated between existing nature reserves. To achieve consistent site conditions (such as soil type and altitude) and meet the selection criteria for secondary old-growth plots, it was essential to address the substantial fragmentation of these sites. We determined the location suitability through the analysis of orthophoto maps from the 1940s, 1950s, and 2019 prepared by the Slovak Topographic Institute ([19]). Orthophotos were utilised to demarcate forest stands characterised by the presence of natural composition and tree canopy coverage. Subsequently, we leveraged data obtained from the National Forest Centre encompassing fundamental stand attributes, including the rotation period (ranging from 150 to 200 years), regeneration cycle (99 years), mean stand age (130 to 170 years), intended functions (e.g., hydrological regulation, erosion mitigation, avalanche shielding), and prescribed management practices (e.g., small shelterwood harvesting). The secondary old-growth forest stands did receive selective harvesting or small shelterwood cutting over a long time in the past. Grazing also had a significant impact on these forests in the past. This can be observed through pollarded beech trees in some areas. The forests were first protected in 1953, the year of management abandonment, and later by the announcement of the Protected Landscape Area (1967) and National Park (1988).
In each of the forest plots (primary and secondary old-growth), for the selection of permanent study plots, plot centres were determined using a stratified random design ([15], [26]) from a network of 10 hectare polygons and verified on-site during direct field assessments to avoid rock cliffs, river streams, forest roads, etc.
Data collection
The permanent research plots consisted of three nested circular sub-plots, including the forest internal sub-plot with a radius of 7.98 m from the plot centre (200 m2), the middle sub-plot with a radius of 17.84 m (1000 m2), and the external sub-plot with a radius of 21.85 m (1500 m2 - Fig. 1d). We utilised electronic and laser devices (Field-Map) integrated with a Geographic Information System to locate the position of all live trees with a diameter at breast height (DBH) ≥ 6 cm, as well as dead trees (snags) with height ≥ 1.3 m for biomass calculation and tree microhabitats identification, and additionally stumps with height <1.3 m and DBH at least of 20 cm in height 0.3 m above the ground, and freshly uprooted trees with a DBH of at least 20 cm for TreM determination. For each live and dead tree (n = 4380) in the area of 1500 m2, we recorded the position, status (live/dead), growth conditions (suppressed/released), canopy stratum (crown level), decomposition stages and 47 types of tree microhabitats ([29]). For downed wood volume calculation we used the Line Intersect Method ([49]). CWD data were collected on five 20-m transects with azimuths of 0°, 72°, 144°, 216°, and 288° from the plot centre with DBH ≥ 6 cm, including species, DBH, and decomposition stage. We counted tree regeneration in three height classes (50-130 cm, 130-250 cm, and > 250 cm) as the number of individuals with DBH < 6 cm and subsequently calculated the number of individuals per ha. Dendrochronological samples from primary forests were collected in 2014 and from secondary old-growth in 2021. Cores were obtained from trees using a Pressler increment borer based on the positions of individual trees within the three circular sub-plots described above. In the internal sub-plot, we cored all living trees with DBH ≥ 6 cm. In the middle sub-plot, we cored all living trees with DBH ≥ 20 cm plus a random selection of 25% of released trees with DBH between 10 and 20 cm DBH, and in the external sub-plot, we cored all living trees with DBH ≥ 60 cm.
Data analysis
Stand structure data
Total live biomass, including aboveground biomass (sum of the stem, branch and foliage of the living trees with DBH ≥ 6 cm) and belowground biomass (root biomass of the living trees with DBH ≥ 6 cm), was calculated according to Forrester et al. ([13]) using species-specific allometric equations. Each biomass component was estimated using a specific allometric formula that applies the DBH of the tree, combined with empirical constants and scaling factors tailored for each component (see Tab. S1 in Supplementary material). The total deadwood necromass included the necromass of CWD with DBH ≥ 6 cm (data collected by transects) and the necromass of snags with DBH ≥ 6 cm and height > 1.3 m based on volume and species-specific wood density and decomposition stage-specific density reduction factor (Tab. S2 in Supplementary material). Wood densities were obtained from the appendix of Forrester et al. ([13]), with densities of taxonomically similar species used for any missing data. Densities for Ulmus glabra, Sambucus sp., and Corylus avellana were taken from Zanne et al. ([50]), and density reduction factors were taken from Harmon et al. ([17]). The calculations did not include the necromass of uprooted trees and snags under 1.3 m.
Tree ring data
Dendrochronological data were used to estimate tree aboveground biomass increment and tree age. Individual tree ring widths were measured on the sliding table LintabTM with an accuracy of 0.01 mm using TSAP-WinTM software (Rinntech, Heidelberg). Subsequently, the master chronology was created from a set of well cross correlating samples. Every sample was then controlled with the help of the master chronology in the program CDendro ([20]). Ambiguous or damaged chronologies were excluded from further analysis.
Carbon stock and aboveground biomass carbon increment data
Carbon stock data include aboveground and belowground biomass, as well as deadwood, consisting of snags and CWD necromass. The aboveground biomass carbon increment was calculated based on the aboveground biomass increment (Trotsiuk et al. 2016) for the last ten years according to the increase determined from annual rings and converted to biomass according to allometric equations. Due to different years of collecting data, we set 2013 as the final year for analysis. Values across ten years were averaged to estimate the annual increase in biomass. Values for each plot’s annual ring increments of uncored trees were estimated according to neighbouring trees of the same size and species using an Extreme Gradient Boosting regression model (R2 = 0.64, MSE = 211.31). Biomass data were converted to carbon by species-specific carbon percentage content ([32] - see also Tab. S3 in Supplementary material).
Structural indicators of biodiversity
We used selected parameters of large trees, deadwood, and TreM for the calculation of biodiversity indicators. We used the Shannon diversity index for the alpha diversity of selected groups. We used two thresholds for identifying large trees: the number of trees with DBH ≥ 70 cm and the number of largest trees on the plot contributing to 50% of the aboveground carbon stock ([30]). We set up five classes of deadwood decomposition stages according to the level of decay, varying from recently dead, completely covered with bark (1) to very soft wood that disintegrates when lifted (5) ([44]). We pooled TreM data identified on the dead (including uprooted trees and snags under 1.3m) and live trees into 11 groups: (i) woodpecker cavities - woodpecker breeding cavities; (ii) rot holes - trunk rot holes, semi- or completely opened trunks, hollow branches; (iii) insect galleries - insect galleries or bore holes; (iv) concavities - dendrotelms, woodpecker foraging excavations, root buttress or trunk bark-lined concavities; (v) injuries and exposed wood - bark loss, bark shelters or pockets, breakages (stem, branches), cracks, scars (lightning, fire) or fork split at insertions; (vi) crown deadwood - dead branches, dead tree top, remaining broken limb; (vii) twig tangles - epicormic shoots, witch broom; (viii) burrs and cankers - the proliferation of cell growth or decayed canker; (ix) saproxylic fungi - perennial or annual polypores, pulpy agaric, large pyrenomycetes or myxomycetes; (x) epiphytic and epixylic structures - bryophytes, lichens, ferns, vertebrate or invertebrate nests, bark or crown microsoil; (xi) exudates - sap run or heavy resinosis. TreM richness was calculated as the number of tree microhabitats found on a given live or dead tree.
Statistical analyses
We employed Generalised Linear Models (GLMs - [34]) to investigate the influence of forest category (primary vs. secondary old-growth) as a predictor of various ecological response variables (Tab. 3). GLMs with a Poisson distribution and logarithmic link function were employed to model count data. The count variables that did not conform to the unit mean-variance ratio were modelled using GLMs with a negative binomial distribution and a logarithmic link function ([18]). Finally, non-negative continuous variables were treated as gamma responses, and a logarithmic link function was used instead of the canonical inverse one to facilitate interpretation. The performance of all models was assessed using diagnostic plots of residuals and spatial correlograms ([7]), and no violations of model assumptions were detected. The statistical significance of the models was evaluated using the likelihood ratio tests. The analysis was conducted in R version 4.2.0 ([40]) using the libraries DHARMa, MASS, ncf and xgboost.
Tab. 3 - Summary statistics of studied plots. Mean and standard deviation of structural characteristics, carbon stock and structural biodiversity indicators and the results of GLMs (F and P) testing for the differences between primary and secondary old-growth forest plots.
| Group | Variables | Unit | Primary plots | Secondary old-growth plots | F | P | |||||||
|---|---|---|---|---|---|---|---|---|---|---|---|---|---|
| Mean | Min | Max | Std | Mean | Min | Max | Std | ||||||
| Structural plot characteristics | Basal area of live trees | m² ha-1 | 43.54 | 6 | 58 | 11.79 | 44.53 | 20 | 58 | 10.41 | 0.04 | 0.837 | |
| Basal area of dead trees | m² ha-1 | 5.38 | 0 | 18 | 4.09 | 3.89 | 0 | 10 | 2.71 | 1.70 | 0.200 | ||
| Max DBH of live trees | cm | 84.92 | 34.7 | 129.2 | 18.14 | 87 | 63.2 | 109.6 | 16.26 | 0.13 | 0.719 | ||
| Mean DBH of live trees | cm | 24.7 | 9.3 | 38.8 | 7.44 | 29 | 20.6 | 44 | 6.38 | 3.29 | 0.077 | ||
| Mean DBH of dead trees | cm | 37.3 | 8.4 | 70.2 | 17.11 | 31.4 | 17.8 | 51.4 | 11.6 | 1.32 | 0.258 | ||
| Density of live trees | N ha-1 | 653 | 260 | 1440 | 294.11 | 505 | 213 | 853 | 209.22 | 3.48 | 0.069 | ||
| Density of dead trees | N ha-1 | 38 | 7 | 80 | 19.57 | 47 | 13 | 180 | 50.11 | 0.96 | 0.333 | ||
| Mean regeneration density in height: |
50 - 130 cm | N ha-1 | 677 | 0 | 3347 | 742.7 | 625 | 13 | 3520 | 832.86 | 0.05 | 0.826 | |
| 130 - 250 cm | N ha-1 | 557 | 0 | 3060 | 818.05 | 181 | 0 | 673 | 187.47 | 5.18 | 0.028 | ||
| over 250 cm | N ha-1 | 448 | 0 | 2787 | 689.63 | 225 | 0 | 1767 | 408.75 | 1.62 | 0.210 | ||
| Carbon stock | Total carbon | Mg ha-1 | 225.12 | 70.49 | 280.00 | 50.42 | 227.61 | 133.5 | 301.46 | 41.69 | 0.02 | 0.895 | |
| Snag carbon (standing dead trees) | Mg ha-1 | 3.66 | 0.02 | 25.11 | 5.12 | 3.02 | 0.41 | 11.23 | 2.77 | 0.28 | 0.601 | ||
| CWD carbon (downed deadwood) | Mg ha-1 | 14.73 | 1.18 | 48.74 | 12.34 | 11.84 | 0.52 | 36.3 | 9.19 | 0.54 | 0.465 | ||
| Biomass carbon (stem, branches, foliage, root of living trees) | Mg ha-1 | 206.79 | 20.91 | 269.6 | 55.74 | 212.74 | 126.06 | 286.74 | 43.63 | 0.06 | 0.802 | ||
| Necromass carbon (standing dead trees, downed dead wood) | Mg ha-1 | 18.39 | 1.92 | 49.58 | 13.10 | 14.87 | 1.39 | 37.27 | 9.99 | 0.17 | 0.421 | ||
| Aboveground biomass increment carbon |
Mg ha-1 year-1 | 4.26 | 0.13 | 6.14 | 1.36 | 4.47 | 2.19 | 6.71 | 1.27 | 0.11 | 0.745 | ||
| Structural biodiversity indicators | The density of the largest trees on the plot contributes to half of the aboveground carbon | N ha-1 | 8 | 3 | 17 | 3 | 9 | 4.0 | 16 | 3 | 1.02 | 0.202 | |
| The density of trees with a DBH ≥ 70 cm | N ha-1 | 23 | 0 | 53 | 17 | 17 | 0.0 | 53 | 15 | 1.61 | 0.438 | ||
| Shannon diversity index of downed deadwood decomposition stages | - | 1.03 | 0.36 | 1.37 | 0.28 | 0.93 | 0.0 | 1.44 | 0.41 | 0.77 | 0.386 | ||
| Shannon diversity index of standing tree deadwood decomposition stages | - | 0.59 | 0.0 | 1.55 | 0.48 | 0.57 | 0.0 | 1.04 | 0.34 | 0.02 | 0.890 | ||
| Shannon diversity index of living trees microhabitat groups | - | 1.57 | 1.25 | 1.99 | 0.17 | 1.46 | 1.04 | 1.85 | 0.25 | 3.18 | 0.083 | ||
| Shannon diversity index of dead trees microhabitat groups | - | 1.31 | 0.0 | 1.72 | 0.43 | 1.48 | 0.61 | 1.86 | 0.29 | 2.63 | 0.111 | ||
| Density of live tree microhabitats | N ha-1 | 784 | 207 | 1907 | 407 | 837 | 393 | 1447 | 314 | 0.19 | 0.668 | ||
| Density of dead tree microhabitats | N ha-1 | 291 | 47 | 580 | 163 | 275 | 47 | 720 | 168 | 0.08 | 0.776 | ||
| The volume of downed deadwood, snag | m³ ha-1 | 157.88 | 12.0 | 414.00 | 111.19 | 111.0 | 10.0 | 281.0 | 77.78 | 0.80 | 0.187 | ||
| Gini coefficient of the living trees DBH | 0-1 | 0.36 | 0.18 | 0.46 | 0.08 | 0.36 | 0.22 | 0.44 | 0.06 | 0.01 | 0.938 | ||
Results
Based on the GLM analysis, there is insufficient evidence to conclude that the forest category significantly affects the response carbon stock and biodiversity indicators variables (Tab. 3), except for the regeneration cover in the height of 130-250 cm (p = 0.028).
Structural characteristics
The structural characteristics of primary and secondary old-growth plots were very similar (Tab. 3). Average tree cover comprised of 88% for live trees and 12% for dead trees in both forest categories. The volume of dead wood approximately composed of 17% of snags and 83% of downed deadwood. Although forest structures were similar, tree composition varied with forest category; primary plots had a higher abundance of Abies alba Mill. (22%) compared to secondary old-growth plots, where this species decreased (6%) in favour of Picea abies (L.) H. Karst. (11%) and Fagus sylvatica L. (74%), indicating a legacy of past land use. While the basal area of live trees in both forest categories was almost the same, the basal area of dead trees was higher in primary plots than in secondary old-growth plots. The regeneration data fluctuated across the forest categories and also between the observed plots. The primary plots had two-thirds more individuals per hectare than secondary old-growth, with a significant difference in height class 130-250 cm. This demonstrates that the forest deadwood accumulation and regeneration dynamics still differ substantially between the two forest categories.
Carbon stock and aboveground biomass carbon increment
Similar to forest structure, estimated carbon values were very similar between the two forest categories (Tab. 3), although there was a more symmetrical distribution in primary compared to secondary old-growth forest plots. Mean aboveground live carbon biomass comprised 114 (range: 9-161) Mg ha-1 of stem carbon in primary forests and 117 (54-165) Mg ha-1 in secondary old-growth, and 59 (8-94) Mg ha-1 of foliage carbon (foliage and branches) in primary and 61 (31-83) Mg ha-1 in secondary old-growth plots. Additionally, root carbon in primary and secondary forests was 33 (4-51) Mg ha-1 and 35 (18-50) Mg ha-1, respectively. The dead-to-total carbon stock ratio was approximately 7% (2% for snag and 5% for CWD carbon) in all plots, except for two primary plots after a recent natural disturbance, which reached 53%. In these disturbed plots, the mean total carbon was 72 (70 and 74) Mg ha-1 and the aboveground biomass carbon increment 0.5 (0.1 and 0.9) Mg ha-1 year-1, which resulted in slightly higher total values in secondary old-growth compared to primary plots (Tab. 3).
Structural indicators of biodiversity
The count of trees exceeding a diameter of 70 cm (the first large-tree threshold) was higher in primary compared to secondary old-growth plots. These trees contributed to 32% of aboveground carbon biomass in primary and 27% in secondary old-growth plots on average. Mean threshold for large-diameter trees responsible for half of the overall carbon stock (the second large-tree threshold) was 58.2 (range: 12.6-81.5) cm in primary and 56.2 (39.7-89.6) cm in secondary forests. The largest 10% of all the trees (second threshold) in primary forests contributed to half of the total carbon stock, increasing to 13% in secondary forests. A lower percentage implies a lower number of large trees contributing to half of the carbon stock. The Gini coefficient for the diameter distribution of live trees exhibited comparable values in primary and secondary forests (Tab. 3).
Deadwood volume was different between forest categories, primary plots having higher values. Snags occupied a volume of 26 (range: 0-112) m3 ha-1 in primary and 20 (2-51) m3 ha-1 in secondary forests, while downed coarse woody debris measured 131 (7-408) m3 ha-1 in primary and 91 (8-269) m3 ha-1 in secondary forests, respectively. The distribution of deadwood according to the degree of decomposition was mostly concentrated in the middle stages (2nd, 3rd, and 4th) in both forest categories, with the 5th stage being less prevalent (in CWD) or totally absent (in snags) in secondary old-growth plots. Diversity index for deadwood (snags and CWD) decomposition stages fluctuated between the plots in both forest categories (Tab. 3).
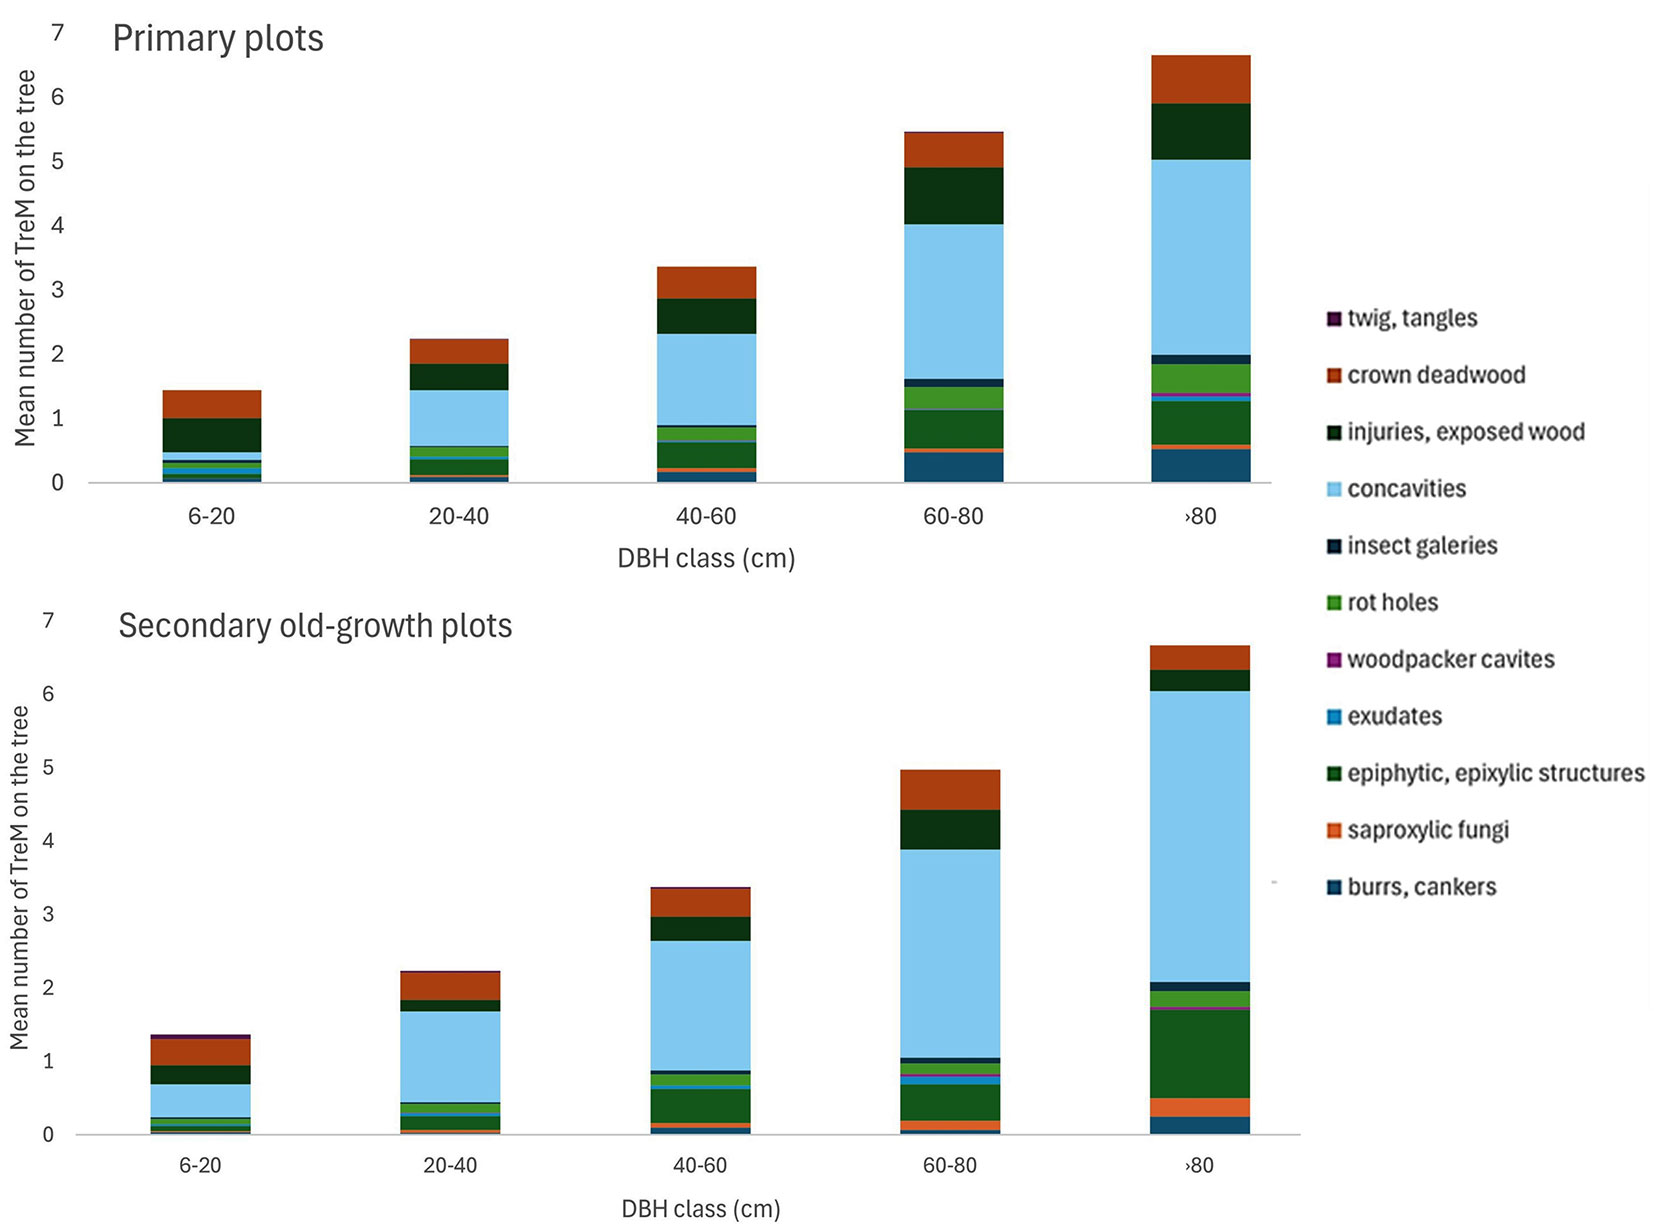
The total number of trees containing at least one tree microhabitat was similar between the primary and secondary old-growth forests - 404 (7-653) and 385 (13-613) trees ha-1, respectively. The richness of the TreM group per tree increased with the tree DBH in both forest categories (y = 0.0022x, R2 = 0.7351 in primary and y = 0.0049x, R2 = 0.7092 in secondary old-growth). More variations in TreM were associated with tree live/dead status (Tab. S4 and Tab. S5 in Supplementary material). The ratio of live to dead TreM was 84% to 16% in primary and 77% to 23% in secondary forests. The density of the observed live trees for TreM identification was in primary plots 653 ha-1 and 505 ha-1 in secondary old-growth plots, on average. The number of live tree microhabitats was 781 (207-1907) ha-1 in primary and 837 (393-1447) ha-1 in secondary old-growth. The predominant microhabitats in both forest categories were concavities (with the most root-buttress concavity - Fig. 2). The density of the observed dead trees for TreM identification was in primary plots 90 ha-1 and 72 ha-1 in secondary old-growth plots, on average. Dead trees with microhabitats numbered 221 (20-547) ha-1 in primary and 270 (80-720) ha-1 in secondary forests. Epiphytic and epixylic structures were prevalent on dead trees in primary forests, while tree injuries and exposed wood (bark loss, bark shelter, and pocket) dominated in secondary forests. Excrescences (burrs, canker, or witch broom) and sap/resin run were less common. Insect galleries ranked fourth in both forest categories. Secondary forests had only 4% fewer saproxylic fungi and slime moulds (including most perennial and annual polypores) compared to primary.
Fig. 2 - Average number of TreM observed per living tree by analysed TreM groups across the DBH gradient in primary and secondary old-growth plots.
Discussion
Comparing carbon pools in primary and secondary old-growth forests within European reserves
One of the pivotal revelations of this study is the remarkable similarity in carbon stock and aboveground biomass carbon increment between primary and secondary old-growth forests. Interestingly, the carbon stock in strictly protected primary and secondary old-growth forests in this study is approximately two times higher compared to the average carbon biomass values of managed forests in Slovakia ([45]). In comparison to our results, a recent study from Swiss forest reserves ([28]) found that even 100 years after management abandonment, the forest did not reach the peak of biomass accumulation. This outcome contrasts with our result, where the secondary old-growth plots exhibit higher values of biomass (431 Mg ha-1) compared to primary plots (419 Mg ha-1) already after 70 years. However, the values of live biomass for elevation 850 m a.s.l., which the authors predicted, fit our results for mean elevation of 1000 m a.s.l. Additionally, the German strict forest reserves ([37]) contained less carbon than the secondary and primary forests in the Carpathians (152 Mg ha-1 - 170 Mg ha-1 in oldest stands - of carbon in aboveground biomass, 30 Mg ha-1 in belowground biomass, and 14 Mg ha-1 in deadwood), on average. Though the values are lower, it is probably because of the relatively low age and homogeneity of the strict reserves in Germany. Mean aboveground carbon in mature stands in the Black Forest reached 184 Mg ha-1 ([3]), more comparable with our results. Studies by Keith et al. ([24]) from primary forest sites sampled across 27 European countries found that trees with a diameter at breast height of 60 cm (50 cm in the Carpathians) account for 50% of the total carbon stock in living biomass. These findings correspond with our results, which show a threshold of 58 cm in primary and 56 cm in secondary old-growth plots. In contrast, carbon stock in deadwood in old-growth forests of the Austrian Alps ([2]) was surprisingly five times lower than our observations in both primary and secondary forests. The ratio of the distribution of live (tree stems) and dead (snags and CWD) carbon in Austria varied between forests less than 100 years since management abandonment (95:5:0) and old-growth forests (97:1:2) ([2]). In our case, the ratio was the same for both forest categories (89:2:9). Similar low values of deadwood carbon were also reported by Paletto et al. ([39]).
Aboveground biomass carbon increment in secondary old-growth forests
In addition to similar carbon stock in biomass pools, we found similar rates of aboveground biomass carbon increment in primary and secondary old-growth forests, demonstrating the compatibility of rewilding strategies with long-term carbon uptake and stock ([31], [41]). In other systems, significant declines in aboveground biomass carbon increment with increasing forest age may result from the primarily even-aged forests consisting of similar competitors ([14]). Our mean values of biomass carbon increment (4.5 Mg ha-1 year-1, which is approximately 9 Mg ha-1 year-1 of biomass increment) from both forest categories are near the high range of values (9.5 Mg ha-1 year-1) observed in Swiss forest reserves ([28]), where the plots had three times higher stem density and double the basal area. Our findings underscore that old-growth forests can still substantially impact carbon fixation rate through the sequestration in coarse wood production, contributing significantly to mitigating climate change.
Biodiversity indicators and habitat recovery in secondary old-growth forests
Primary forests are recognised for providing habitats for rare and endangered species, and our findings suggest that secondary old-growth forests, through rewilding, can offer similar benefits over time. Deadwood volume exhibited substantial variation, with recently disturbed primary forests having higher volumes, providing microhabitat diversity. Deadwood serves as a key habitat legacy for various forest organisms such as saproxylic beetle, fungi, or lichens ([25], [33]), though the development of such structured habitats in secondary old-growth forests is a long-term process ([8]). The abundance and proportion of deadwood in the studied secondary old-growth forests already surpass those observed in commercially managed forests. Natural disturbances are stochastic, resulting in episodic introductions of deadwood habitats. This underscores the irreplaceable role of primary forests in biodiversity conservation.
In addition, our findings validate earlier hypotheses regarding the positive correlation between deadwood stocks and natural forest function ([39], [1], [38]). Our results from uneven-aged forests exhibited more structural diversity compared to Bavarian Forest National Park in Germany, where the mature forest has low structural diversity (one canopy layer, lower age variations) and associated standing snag basal area (3.4 m2 ha-1) and downed deadwood (26 m3 ha-1 - [46]). Our results also showed that most snags were in the second stage in both forest categories, which differed from observations of primarily first and third decomposition stages in a Mediterranean oak forest ([39]). In addition, our study found similar results for average total deadwood volume in primary (142.71 m3 ha-1) and secondary (111 m3 ha-1) forests compared to nine Slovakian beech forest reserves (133 m3 ha-1) and European beech forests (130 m3 ha-1 - [12]). By comparison, the mean values of deadwood volume of forest reserves in lowland Europe ([48]) were 130 m3 ha-1 in the northwest and 65 m3 ha-1 in the Central region. However, the volume from deadwood pools in the Czech mountain beech-dominated reserve ([27]) differs in that the snag volume was 1.6 times higher and the CWD volume was 2.5 times lower than our results. This difference is likely attributable to the different time since management abandonment and the different natural disturbance dynamics in observed areas. Our findings indicate that the presence of high volumes of deadwood with diverse decomposition stages is influenced by the time since management cessation and is typically observed in old-growth forests. This aligns with the study by Nagel et al. ([38]), which shows that old-growth reserves in Slovenia display multiple stages of decomposition and a higher average deadwood volume of 165 m3 ha-1 compared to younger reserves. Collectively, results from our study and these other studies show that the accumulation process of downed deadwood widely varies in unmanaged European forests depending on previous management intensity and age diversity.
In our study, primary forests exhibited higher abundance of large trees, and secondary old-growth forests had a slightly greater TreM density but still lower diversity of TreM groups compared. The average number of TreMs at the individual tree scale in unmanaged forests was 2.1-2.5 per tree ([22], [4]), which corresponds well with our study (2.5 per tree in primary, 3.5 per tree in secondary). Consistent with prior reports ([22]), our study found that root-buttress concavities were the most abundant TreM in old-growth beech forests. Our results also show that mean cavity densities were higher in secondary old-growth than in primary plots (488 and 310 ha-1, respectively) which contrasts with the much lower densities (184 ha-1) observed in secondary old-growth forests with ages between 40-80 years ([21]). This confirms that the relative importance of cavity density as a structural wildlife indicator in temperate forests depends on tree age ([26]). Finally, our results confirmed that TreM richness increases with tree size, consistent with many previous publications ([25], [26], [22], [4]).
Given the limitations of this study, our results show that all observed parameters recovered relatively quickly (within 70 years of the cessation of human disturbance), but the timeframe for recovering to the old-growth conditions of primary forests will take more time. Old-growth forest recovery hinges on many factors, particularly the legacies of past management practices, age diversity, and natural disturbance dynamics. The similarity in the abundance of large trees, variations in tree diameter, and TreM between both forest categories in our study is inconsistent with the claim that these parameters require a substantial amount of time for recovery ([2]). We note, however, that the diversity of tree microhabitats and the deadwood accumulation requires a prolonged (more than 70 years) duration for restoration.
Limitations of the study
While our statistical model and covariation analyses relied on established approaches, our study has some limitations that warrant discussion. First, for carbon assessment, our results are solely based on DBH and tree species and the allometric equations of Forrester et al. ([13]) and carbon content figures of Matthews ([32]). Although allometric equations ([13]) are a practical and non-destructive method for estimating tree biomass, they have limitations, such as species-specific variability, site-specific environmental conditions (e.g., topography and soil properties), and measurement errors. We selected this approach using the allometric equation solely based on DBH because an equation based on both DBH and height would be more complicated. Measuring tree height on steep slopes and rugged terrain, especially in beech-dominated forests where it is often difficult to see the top of the tree crown, could introduce bias in the height measurement. Sampling the biomass with laser scanning could provide even better and more precise biomass estimates, as currently, the total biomass numbers might need to be underestimated ([9]). Additionally, the accuracy of belowground biomass estimates is generally lower than that of aboveground biomass due to the substantial variability in root systems among different species and individual trees, which complicates the development of generalised allometric models. Despite these challenges, allometric equations remain one of the most viable methods for large-scale biomass estimation in protected forest ecosystems. Second, the study was conducted using a limited number of plots, which provides valuable insights but may not capture the full extent of spatial variability. While this approach offers detailed plot-level analysis, it serves as a foundation for understanding broader landscape-level processes that influence carbon dynamics and ecosystem functioning. Further research with expanded plot numbers can build on these findings to enhance our understanding comprehensively. Third, the assessment lacked a comprehensive evaluation of soil carbon content, which is crucial for understanding the overall carbon balance of forests. An intensive soil sampling of the study area would address this issue but was beyond the scope and capacity of the current study. Therefore, the difference in carbon stocks between primary and secondary old-growth forests could be pronounced because including soil data might reveal longer-term increases in total carbon. Despite its limitations, this study highlights the critical importance of accounting for variability in forest ecosystems and provides a strong foundation for future research aimed at enhancing our understanding of carbon dynamics and ecosystem functioning on a broader scale.
Conclusion
Conserving primary and secondary old-growth forests supports the broader goals of natural climate solutions and biodiversity protection. Our results indicate that primary and secondary old-growth forests exhibit similar structural characteristics, carbon stock, and habitat diversity, suggesting comparable effectiveness in the provisioning of ecosystem services including climate change mitigation and critical habitats. This conclusion aligns with existing research emphasising primary forests’ substantial carbon storage potential ([23], [28]) and highlights the importance of rewilding (management cessation) for carbon stock and biodiversity conservation. Recognising the potential of rewilding in restoring forests is important for adaptive conservation practices in the context of achieving climate targets.
Acknowledgements
KM carried out the conceptualisation, data curation, formal analysis, project administration, methodology, visualisation, writing original draft; MMi, MS carried out the conceptualisation, supervision, methodology; GWM, WSK, DR, JH, DK, JP, RG, MFe, MS, MMi, MS carried out the writing review and editing; DK, MS carried out the data curation; KM, MK, MFr, DD, MMe, DK, JP, RG, MFe carried out the field data collection; MD, AV, TK carried out the laboratory measurement; MS carried out the funding acquisition, resources.
This work was supported by the Czech University of Life Sciences (Internal Grant Agency: A_18_22 - 43110/1312/3108), Czech Science Foundation (Grant GACR no. 22-31322S), WildE (101081251) and CLIMB-FOREST Horizon Europe (101059888)
projects. We thank Marián Jasík and NP Malá Fatra for their support and cooperation in the research. We also thank people who contributed to the laboratory and field data acquisition.
References
CrossRef | Gscholar
CrossRef | Gscholar
CrossRef | Gscholar
CrossRef | Gscholar
CrossRef | Gscholar
CrossRef | Gscholar
CrossRef | Gscholar
CrossRef | Gscholar
CrossRef | Gscholar
CrossRef | Gscholar
CrossRef | Gscholar
Gscholar
CrossRef | Gscholar
CrossRef | Gscholar
CrossRef | Gscholar
CrossRef | Gscholar
CrossRef | Gscholar
Gscholar
Authors’ Info
Authors’ Affiliation
Martin Mikoláš 0000-0002-3637-3074
Marek Svitok 0000-0003-2710-8102
Daniel Kozák 0000-0002-2622-370X
Jakob Pavlin 0000-0001-8514-3446
Rhiannon Gloor
Matej Ferenčík 0009-0002-6235-6873
Dheeraj Ralhan 0000-0003-2813-7685
Michal Frankovič 0000-0003-2772-3738
Jenýk Hofmeister 0000-0002-3915-5056
Daniela Dúhová 0009-0004-2275-1304
Marek Mejstrík
Martin Dušátko 0000-0002-3463-607X
Antonín Veber 0009-0001-4937-7779
Tomáš Knír
Miroslav Svoboda 0000-0003-4050-3422
Department of Forest Ecology, Faculty of Forestry and Wood Sciences, Czech University of Life Sciences Prague, Kamýcká 129, 165 21 Praha 6 - Suchdol (Czech Republic)
Washington State Department of Natural Resources, 1111 Washington Street SE, Olympia, WA 98504 (USA)
College of Forestry, Oregon State University, 3100 SW Jefferson Way, Corvallis, OR 97331 (USA)
Rubenstein School of Environment and Natural Resources, University of Vermont, 81 Carrigan Drive, Burlington, VT, 05405 (USA)
Department of Biology, Ecology and Environment, Faculty of Natural Sciences of Matej Bel University in Banská Bystrica, Tajovského 40, 974 01, Banská Bystrica (Slovakia)
Administration of the Malá Fatra National Park, Hrnčiarska 197, 013 03 Varín (Slovakia)
Corresponding author
Paper Info
Citation
Markuljaková K, Mikoláš M, Svitok M, Meigs GW, Keeton WS, Kozák D, Pavlin J, Gloor R, Kalaš M, Ferenčík M, Ralhan D, Frankovič M, Hofmeister J, Dúhová D, Mejstrík M, Dušátko M, Veber A, Knír T, Svoboda M (2025). Rewilding beech-dominated temperate forest ecosystems: effects on carbon stocks and biodiversity indicators. iForest 18: 1-9. - doi: 10.3832/ifor4600-017
Academic Editor
Gianluca Piovesan
Paper history
Received: Mar 10, 2024
Accepted: Nov 05, 2024
First online: Feb 02, 2025
Publication Date: Feb 28, 2025
Publication Time: 2.97 months
Copyright Information
© SISEF - The Italian Society of Silviculture and Forest Ecology 2025
Open Access
This article is distributed under the terms of the Creative Commons Attribution-Non Commercial 4.0 International (https://creativecommons.org/licenses/by-nc/4.0/), which permits unrestricted use, distribution, and reproduction in any medium, provided you give appropriate credit to the original author(s) and the source, provide a link to the Creative Commons license, and indicate if changes were made.

Web Metrics
Breakdown by View Type
Article Usage
Total Article Views: 12959
(from publication date up to now)
Breakdown by View Type
HTML Page Views: 5900
Abstract Page Views: 3297
PDF Downloads: 3437
Citation/Reference Downloads: 6
XML Downloads: 319
Web Metrics
Days since publication: 506
Overall contacts: 12959
Avg. contacts per week: 179.27
Article Citations
Article citations are based on data periodically collected from the Clarivate Web of Science web site
(last update: Mar 2025)
(No citations were found up to date. Please come back later)
Publication Metrics
by Dimensions ©
Articles citing this article
List of the papers citing this article based on CrossRef Cited-by.
Related Contents
iForest Similar Articles
Research Articles
Factors affecting the quantity and type of tree-related microhabitats in Mediterranean mountain forests of high nature value
vol. 14, pp. 250-259 (online: 21 May 2021)
Research Articles
Effect of restoration methods on natural regeneration in the Brazilian Atlantic Forest
vol. 18, pp. 23-29 (online: 15 February 2025)
Review Papers
The role of spatial criteria in enhancing forest restoration actions: a systematic review
vol. 19, pp. 157-167 (online: 11 May 2026)
Research Articles
Can the dynamics of forest restoration reduce landscape fragmentation in the Atlantic forest?
vol. 18, pp. 61-68 (online: 04 April 2025)
Research Articles
The Habitat-Trees experiment: using exotic tree species as new microhabitats for the native fauna
vol. 8, pp. 464-470 (online: 22 October 2014)
Review Papers
Shaping the multifunctional tree: the use of Salicaceae in environmental restoration
vol. 6, pp. 37-47 (online: 21 January 2013)
Research Articles
Interactions between thinning and bear damage complicate restoration in coast redwood forests
vol. 13, pp. 1-8 (online: 08 January 2020)
Review Papers
Linking deadwood traits with saproxylic invertebrates and fungi in European forests - a review
vol. 11, pp. 423-436 (online: 18 June 2018)
Research Articles
Early responses of biodiversity indicators to various thinning treatments in mountain beech forests
vol. 11, pp. 609-618 (online: 25 September 2018)
Research Articles
Biodiversity conservation and wood production in a Natura 2000 Mediterranean forest. A trade-off evaluation focused on the occurrence of microhabitats
vol. 12, pp. 76-84 (online: 24 January 2019)
iForest Database Search
Search By Author
- K Markuljaková
- M Mikoláš
- M Svitok
- GW Meigs
- WS Keeton
- D Kozák
- J Pavlin
- R Gloor
- M Kalaš
- M Ferenčík
- D Ralhan
- M Frankovič
- J Hofmeister
- D Dúhová
- M Mejstrík
- M Dušátko
- A Veber
- T Knír
- M Svoboda
Search By Keyword
Google Scholar Search
Citing Articles
Search By Author
- K Markuljaková
- M Mikoláš
- M Svitok
- GW Meigs
- WS Keeton
- D Kozák
- J Pavlin
- R Gloor
- M Kalaš
- M Ferenčík
- D Ralhan
- M Frankovič
- J Hofmeister
- D Dúhová
- M Mejstrík
- M Dušátko
- A Veber
- T Knír
- M Svoboda
Search By Keywords
PubMed Search
Search By Author
- K Markuljaková
- M Mikoláš
- M Svitok
- GW Meigs
- WS Keeton
- D Kozák
- J Pavlin
- R Gloor
- M Kalaš
- M Ferenčík
- D Ralhan
- M Frankovič
- J Hofmeister
- D Dúhová
- M Mejstrík
- M Dušátko
- A Veber
- T Knír
- M Svoboda
Search By Keyword


