Method for classifying sites to Atlantic Rainforest restoration aiming to increase basin’s streamflows
iForest - Biogeosciences and Forestry, Volume 14, Issue 1, Pages 86-94 (2021)
doi: https://doi.org/10.3832/ifor3658-013
Published: Feb 19, 2021 - Copyright © 2021 SISEF
Research Articles
Abstract
We propose a method to classify priority sites for Atlantic Rainforest restoration aiming to increase basin streamflows. The Rainfall Forest to Water Production (RFWP) method uses multicriteria analysis supported by GIS techniques and hydrological modeling. The method was applied to the Itapemirim River Basin, southeastern Brazil. The application of RFWP provided a map of areas with different priority for forest restoration by overlapping standardized numerical criteria with different weights (climatological, soil type/land use, and relief). The results indicated the influence of the wide distribution of the restoration sites on the streamflows. The RFWP proved to be suitable for the spatial analysis of the effect of different restoring areas on streamflows. Based on simulated scenarios, an increase in the native forest cover by restoration up to 27.6% of the basin area is expected to significantly enhance water production. The priority areas where forest restoration could better contribute to increase streamflows were delineated, especially at high altitude and in pastures, which are mostly in degraded conditions.
Keywords
Introduction
The community seeks to restore the forest cover to improve the supply of ecosystem services ([27]). The Atlantic Forest biome covers 111 Mha (13% of the Brazilian territory - [51]) in highly heterogeneous environmental conditions. This biome is one of the Earth’s richest biodiversity hotspots (richer than most of the Amazon forests), with high endemism levels ([37], [44], [43]). However, it is the Brazilian biome that suffered the most extensive, human-induced land use and land cover change in the past ([37]). Isolated forest fragments cover 7 to 10% of the biome; most of these fragments are old secondary growth, surrounded by croplands, pasture, forest plantation, cities, and infrastructure ([51]). The high degree of human interference in this biome has affected regional water systems, causing sedimentation at water bodies, water pollution, loss of biodiversity, and reduced streamflows ([14]). The water scarcity and the pollution caused by the accelerated landscape alteration at Atlantic Rainforest point out the need to establish adequate policies for environmental management, especially of the water resources.
The potential for maintenance of water quality and regularization of water flow is one of the main ecosystem services offered by the forests ([20], [19]). Forest cover is associated with water quality improvement, although its relationship in terms of quantity is still controversial ([19], [21], [3]). Previous research showed that in most cases the forest is more related to the regulation of streamflows, rather than being directly linked to the increase or decrease in average annual streamflow ([8], [20], [7], [26]).
Forests have the positive hydrologic impact of increasing water infiltration, with a consequent reduction in overland flow and erosion, associated with more significant recharge from aquifers and higher subsurface flow ([8], [19]). On the other hand, the increase in forest cover is usually associated with the increase in evapotranspiration and rainfall interception ([19], [21]). The potential impact of forest restoration in the basin streamflow is, in a simplified way, the final balance between the positive effects (increasing infiltration) and the adverse effects (increasing evapotranspiration and rainfall interception).
The variables that control the basin hydrology are often interdependent, and their magnitude varies in importance among different basins. The combination of soil and climatic conditions, associated with the wide distribution of land uses, are factors affecting the hydrology of catchments ([16], [25], [31]). In this respect, assessing the impacts of forest restoration on streamflows must be careful and take into account the wide distribution of the afforested sites, since the land-use change can present a positive, negative or null effect to water production. Therefore, the seek for consistent ways to identify priority areas for forest restoration aiming to improve water availability is a problem that needs investigation ([16], [1]).
Intending to provide support for territorial planning, some multicriterial approach techniques associated with Geographic Information Systems (GIS) have been applied in the identification of “best” sites to a specific goal. This kind of approach, mainly due to the association with GIS, can combine several spatial factors in a single map obtained by overlapping different criterion maps ([33], [5], [53]). Regarding forest sites, these techniques were used to identify priority areas aiming to increase aquifers recharge ([41], [5], [42]), forest conservation ([53], [52], [28]), or to improve water quality ([34]). However, there is still a lack of studies focused on identifying sites where forest restoration is most suitable to increase streamflows of catchments, i.e., to increase the basin water availability.
As a premise of this paper, we assume that the application of multicriteria analysis in a GIS environment intending to select areas to achieve a specific objective - such as the water availability - can present more accurate results when supported by simulation models able to predict the effects of land-use changes in the environment, such as basin streamflows. In this sense, hydrological models are useful tools to predict spatial patterns of hydrological processes with land-use changes. Thus, these models configure outstanding support for environmental planning and decision-making that provides quick and low-cost responses.
The main objective of this paper was to propose and apply a method to identify sites with different levels of priority for the restoration of the Atlantic Rainforest, aiming to increase the basin’s water availability (streamflows). The multicriteria analysis supported by GIS and hydrological modeling was taken as the pathways to achieve this goal.
Material and methods
The present paper is divided into three parts. The first comprises the presentation of the method named “Rainfall Forest to Water Production” (RFWP), proposed to identify sites with different levels of priority for the Atlantic Rainforest restoration to increase the water availability (streamflows) of basins. The RFWP requires some spatial information on the basin, which are supported by GIS techniques. The second part describes the application of RFWP to a specific basin. Finally, the third part describes the hydrological modeling of an Atlantic Rainforest basin, conduced by simulating streamflows of different forest restoration scenarios, as built from the RFWP results.
Rainfall Forest to Water Production (RFWP)
The RFWP was developed considering multiple criteria (or factors) for allocating specific land use (Atlantic Forest), identifying the sites where environmental conditions are more or less favorable to improve the recharge of aquifers and increase water availability. The definition of the sites’ priority levels passed through the elaboration and overlay of gridded maps containing the spatial information for each criterion. The following steps were taken: (i) identifying the most relevant set of criteria related to water production; (ii) obtaining a significant set of ratings and weights for each criterion; (iii) identifying an adequate technique to combine the gridded maps of criteria that reflect the relationship between the factors and the objective.
Selection of the criteria (factors) related to water production
Three simple spatial characteristics were chosen as criteria to identify the most suitable locations for forest restoration to increase water availability: one climatological, one related to soil and land use, and one related to the relief. Gridded data sets of each criterion were created. Subsequently, the following procedures were taken with the gridded datasets to achieve the objectives of the RFWP: standardization, definition hierarchy, and overlapping.
The selected climatological criterion was the difference between historical annual averages of precipitation and the potential evapotranspiration (P - PET). The reason of this choice was that water production is enhanced in sites with more water input (higher precipitation depth) and lower water “consumption” (lower evapotranspiration depth - [22], [40]). Thus, with few input variables, this criterion represents an initial estimate of the water depth available to be converted into water availability. P - PET is not an exact representation of water depth to be converted into streamflow. PET itself is not reached throughout the year, and actual evapotranspiration (ET) would be a better estimator. However, ET is not as simple to be determined as PET, depending on a large amount of meteorological, edaphic, and vegetational information which are not always available, especially at the Atlantic Rainforest biome ([11]).
Soil class and vegetation are determinant factors in assessing water availability ([9]), being incorporated into the RFWP as another criterion. The Curve Number (CN) parameter of the Curve Number Method was selected to reflect soil and land use attributes, as it intrinsically represents the potential infiltration of the area. The higher the CN (which varies between 0 and 100), the lower the potential infiltration, as it is dependent on factors related to the soil, the surface, and the preparation and management of the soil ([47]). Since forests increase water infiltration ([13], [16], [31], [32]), the inclusion of this criterion allow the selection of areas where the change of land use from the original vegetation to the native forest will potentially increase the infiltration capacity as a consequence of afforestation.
The premise of using a criterion related to the relief is to reflect the distance to the nearest stream and the water table. RFWP considers that the further away from both, the more appropriate the site. Often crops with deeper roots (such as species from the Atlantic Forest) can uptake water from the aquifers ([4]). Therefore, in sites distant from surface and groundwater, the root system of trees uses mostly water from the soil’s unsaturated zone, leaving the water table to increase its contribution to the streamflow. It should be made clear that the RFWP is proposed to Atlantic Rainforest biome, where the distance from surface and groundwater sources does not limit forest growth due to the abundant rainfall. In mountainous sites, where the soil drains faster thus limiting groundwater storage, the forest is responsible for maintaining more significant infiltration and, consequently, the aquifer recharge ([13], [16], [31], [32]).
RFWP uses a unique criterion that reflects the depth of the water table and the proximity to surface water together with the topography. To quantify the influence of relief on physical processes, such as the movement of water in the subsoil, we used topographic indexes ([29], [49]), namely, the topographic wetness index (TWI - eqn. 1):
where TWIj is the topographic wetness index of the cell j, αj is the specific contribution area upslope cell j (m m-2), βj is the average slope upslope cell j (°). This index characterizes the surface water saturation zones and the water content in soils, spatially identifying the sites most suitable to saturation ([17], [18]). The sites located along the streams and around the springs are saturated zones that do not allow significant infiltration gains, contributing more to surface flow ([6]).
Sites with higher TWI are those at lower altitudes, close to streams, where the water table is shallower, while the sites with lower TWI are drier and located on mountain top, where the water table tends to be deeper ([50], [30]). Thus, it is preferred to restore the Atlantic Forest in sites with lower TWI.
Criteria standardization
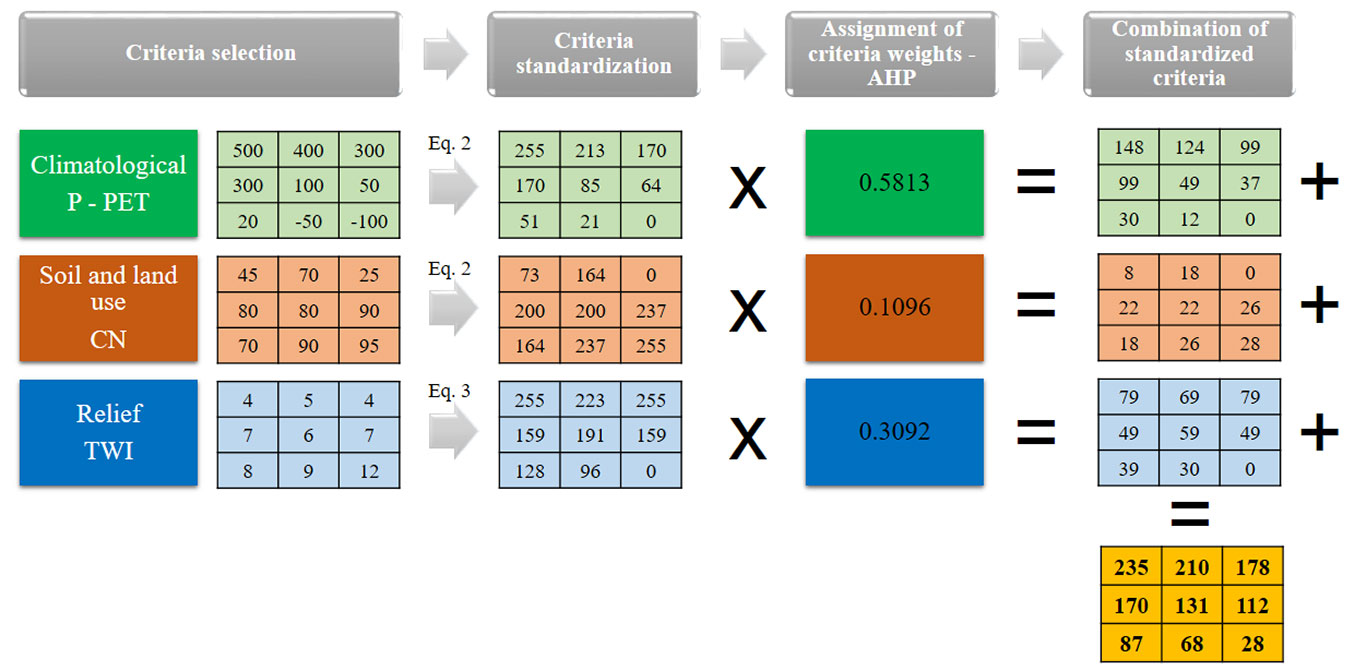
In the multicriteria analysis, numerical values of each criterion are standardized over a normal range and then aggregated through a linear function of the product of weights and criteria values ([5]). To this purpose, we standardized the gridded dataset using a common scale of 256 levels which maintains the intrinsic characteristics of the original grid values ([34]) using the following equantions ([53] - eqn. 2, eqn. 3):
where xi,j is the standardized value of criterion i at cell j, Rj,i is the original value of criterion i at cell j, Ri,max and Ri,min are the maximum and minimum observed values of the criterion i. Eqn. 2 was applied to both P - PET and CN, where the highest values indicate the desired conditions according to the study’s objective (increase water availability), while eqn. 3 was applied to the TWI criterion, where the lowest values is the desired condition. After standardization, the grid values for each criterion ranged between 0 (unwanted conditions) and 255 (desired conditions).
Assignment of the criteria’s weights
The weight expresses the relative importance of each criterion ([52]) as different criteria differently affect water availability. To achieve the weight of each standardized criterion, RFWP uses a decision-making process known as Analytical Hierarchical Process (AHP - [46]), which employs a pairwise comparison (two by two) between the criteria to determine their relative importance and calculate their respective weights, whose final sum must be equal to one.
The P - PET criterion was the most important because it represents the potential volume of water available to be converted in streamflow. TWI was considered the second most important as it indicates the water table’s depth, the potential consumption of groundwater, and the aquifer recharge. Finally, NC was considered the less critical criterion.
Combination of standardized criteria
RFWP proposes the overlap of the standardized criteria grids based on the aggregation of the product of the weights and values of the standardized criteria ([33]), according to eqn. 4:
where xi,j is the standardized value of the i-th criterion at the j-th grid cell, Sj is the resulting numerical value for the cell j and wi is the weight of criterion i. High values of Sj indicate sites with high priority and low value areas with low priority. Fig. 1 shows an example of a set of criteria and their relationship to the study’s objective after applying RFWP.
Fig. 1 - Example of the application of Rainfall Forests to Water Production (RFWP) method.
Application of the RFWP
The hydrological modeling of an Atlantic Rainforest basin was performed using the “Distributed Hydrology Soil-Vegetation Model” (DHSVM - [54]) to evaluate RFWP. The basin under study was the Itapemirim River Basin upstream of the “Usina Paineiras” stream gauge station - BHPAIN (Fig. 2). The basin is located in the south of Espírito Santo (Brazil), between the geographic coordinates 20° 10′ S and 21° 15′ S; and 40° 55′ W and 41° 50′ W, with an area of approximately 5170 km². According to the Köppen classification, the regions’ predominant climatic types are “Cwa” (Humid Subtropical climate with dry winter and hot summer) and “Cwb” (Humid Subtropical climate with a dry winter and temperate summer). The altitudes vary from 5 to 2854 meters, and the relief is dominated by mountains, which indicates suitability for applying the DHSVM.
Fig. 2 - The study area: Itapemirim river basin upstream Usina Paineiras stream gauge station (BHPAIN), Espirito Santo, SE Brazil.
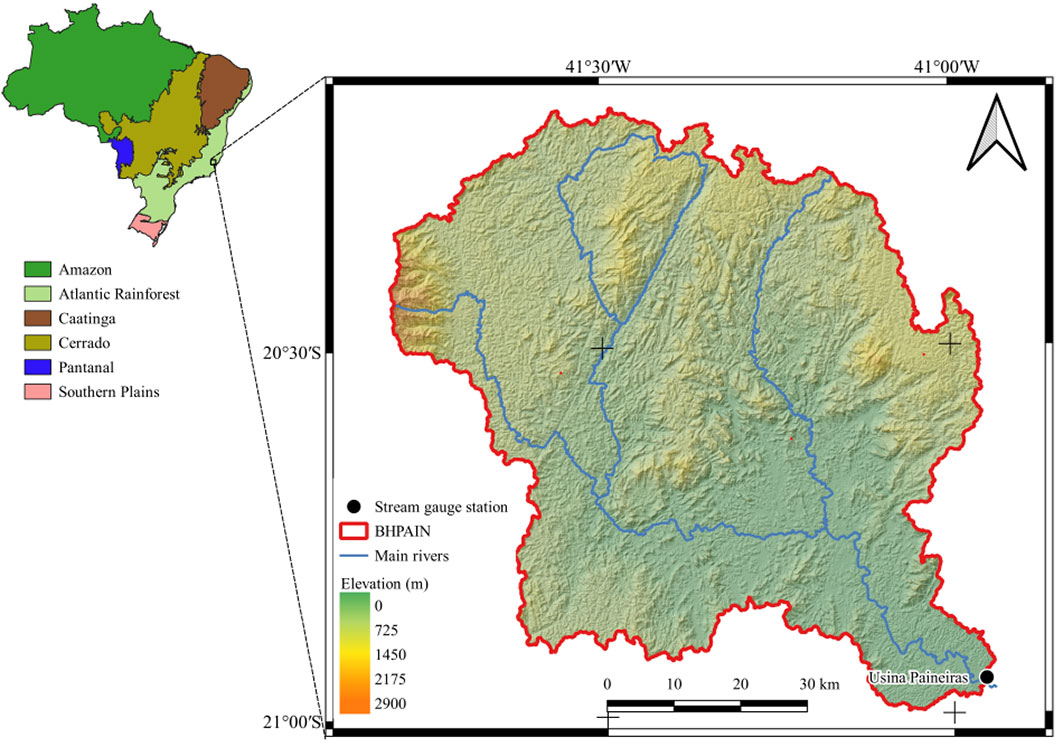
The gridded data that characterize the soils and the land use (for 2015) at BHPAIN were obtained from the Institute of Environment and Water Resources of Espírito Santo ([23]). BHPAIN’s land uses were determined from aerial photographs using remote sensing photo-interpretation techniques ([23]) and showed that the three mainland uses are pastures (42% of the area), forests (23.4%), and coffee plantations (15.9%). According to the Brazilian Soil Classification System, the predominant soil types in the basin are Interceptisols, Ultisols, and Oxisols, representing 31.6%, 30%, and 20.4% of the BHPAIN.
The gridded dataset used in the application of RFWP to BHPAIN was standardized to 90 m spatial resolution, indicated as the most suitable to hydrologic modeling of BHPAIN with DHSVM model ([35]).
The climatological criterion considers the Brazilian daily gridded database containing rainfall depths, with a spatial resolution of 0.25° × 0.25° ([56]), which was used to compute the mean annual rainfall depths (P). This dataset was resampled to the 90 meters spatial resolution, using the Inverse Distance Weighting interpolator ([56]).
The historical average of the monthly reference evapotranspiration (PETm) was calculated using the Hargreaves & Samani equations calibrated for Espírito Santo, according to eqn. 5 ([57]). The sum of PETm is the average annual evapotranspiration (PET - eqn. 5).
where PETm is the average monthly evapotranspiration (mm), Qo is the monthly extraterrestrial solar irradiation (mm day-1), Tmax is the historical average monthly maximum air temperature (°C), Tmin is the historical average monthly minimum air temperature (°C), Tmea is the historical average monthly mean air temperature (°C), and MND is the month’s number of days (day).
In order to consider the variation of evapotranspiration in altitude, the historical average air temperatures were calculated using multiple linear regression equations established for Espírito Santo State, according to the general model in eqn. 6 ([10]):
where Tk is the historical average monthly air temperatures (maximum, minimum, or mean - °C), Alt is the altitude (m a.s.l.), Lat is the latitude (°), Long is the longitude (°), and β0, β1, β2, β3 are regression parameters ([10]).
A SRTM digital elevation model (DEM) with a spatial resolution of 90 meters was used. The DEM was manipulated with GIS tools to become a hydrologically conditioned digital elevation model (HC-DEM) to serve as input data for the DHSVM model. The calculations of the variables Q0, Tmax, Tmin, Tmed, PETm (eqn. 5, eqn. 6), and PET were all performed with a GIS tool based on the HC-DEM. The maps containing the variables P and PET were then subtracted to generate the P - PET gridded dataset.
The establishment of the CN gridded dataset (soil and land use criterion) passed through the association between the land use classes and the soil hydrological groups. BHPAIN soils were classified into hydrological groups based on the recommendation to Brazilian soils ([47]). Therefore, the Curve Number method tables were used to associate land use and soil group to CN values. This procedure generated a gridded file with the 90 m spatial resolution adopted. Areas whose land use could not be converted to forests (rocky sites, mining sites, urbanized areas, and water bodies) were excluded from the posterior analysis by assigning the “No Data” information.
Finally, TWI was calculated applying eqn. 1 to the HC-DEM, with the SAGA-GIS Wetness Index algorithm ([12]).
The criteria weights (wi) were defined based on the paired comparison using AHP ([46]) as described above, resulting in the following values: (i) P - PET: wi = 0.5813; (ii) TWI: wi = 0.3092; and (iii) CN: wi = 0.1096.
The three criteria were combined using the standardized criteria grids (xi.j) and their respective weights (wi), resulting in a single priority map with values between 0 and 255. The combined priority values were then reclassified into eight priority classes, from 1 (most suitable sites for forest restoration) to 8 (least suitable sites). This reclassification was performed using the GIS natural breaks method, which maximizes the difference between classes.
Hydrological modeling of land-use change scenarios
The effectiveness of RFWP in achieving its objectives was verified through hydrological modeling, using the DHSVM model ([54]). For the application of the DHSVM, we used the input data of a previous calibration for BHPAIN ([35]). More information about the values of the DHSVM’s input parameters used, are reported by Mendes et al. ([35]).
The modeling consisted of building 16 scenarios of restoration of the native forest (Tab. 1) in sites belonging to each of the eight classes of priority (and their combinations), thereby verifying the impact over the water availability. Only sites with agriculture, pastures, exposed soil, vegetation, and early-stage regeneration were considered eligible to be converted into Atlantic Forest. In all scenarios, daily streamflow series for BHPAIN were simulated using the daily meteorological data from 2008 to 2011. The evaluation of each scenario in matching the objectives was performed by the analysis of relative changes in two reference flows: the average streamflow (Qave) and the minimum streamflow, represented by the flow of permanence in 90% of the time (Q90). The simulated scenarios are described in Tab. 1.
Tab. 1 - Forest restoration scenarios simulated based on the results of RFWP applied in the study area (BHPAIN).
| Scenario | Description | Area of forest restoration | |
|---|---|---|---|
| (km2) | (%) | ||
| SC0 | No land-use change (current scenario) | - | - |
| SC1 | Forest restoration at eligible sites of class 1 | 44.2 | 0.9 |
| SC2 | Forest restoration at eligible sites of class 2 | 153.2 | 3.0 |
| SC3 | Forest restoration at eligible sites of class 3 | 419.8 | 8.1 |
| SC4 | Forest restoration at eligible sites of class 4 | 807.2 | 15.6 |
| SC5 | Forest restoration at eligible sites of class 5 | 961.5 | 18.6 |
| SC6 | Forest restoration at eligible sites of class 6 | 781.2 | 15.1 |
| SC7 | Forest restoration at eligible sites of class 7 | 510.2 | 9.9 |
| SC8 | Forest restoration at eligible sites of class 8 | 211.8 | 4.1 |
| SCA12 | Forest restoration at eligible sites of class 1 and 2 | 197.4 | 3.8 |
| SCA13 | Forest restoration at eligible sites of class 1 to 3 | 617.2 | 12.0 |
| SCA14 | Forest restoration at eligible sites of class 1 to 4 | 1424.3 | 27.6 |
| SCA15 | Forest restoration at eligible sites of class 1 to 5 | 2385.9 | 46.2 |
| SCA16 | Forest restoration at eligible sites of class 1 to 6 | 3167.1 | 61.3 |
| SCA17 | Forest restoration at eligible sites of class 1 to 7 | 3677.3 | 71.2 |
| SCA18 | Forest restoration at eligible sites of class 1 to 8 | 3889.1 | 75.3 |
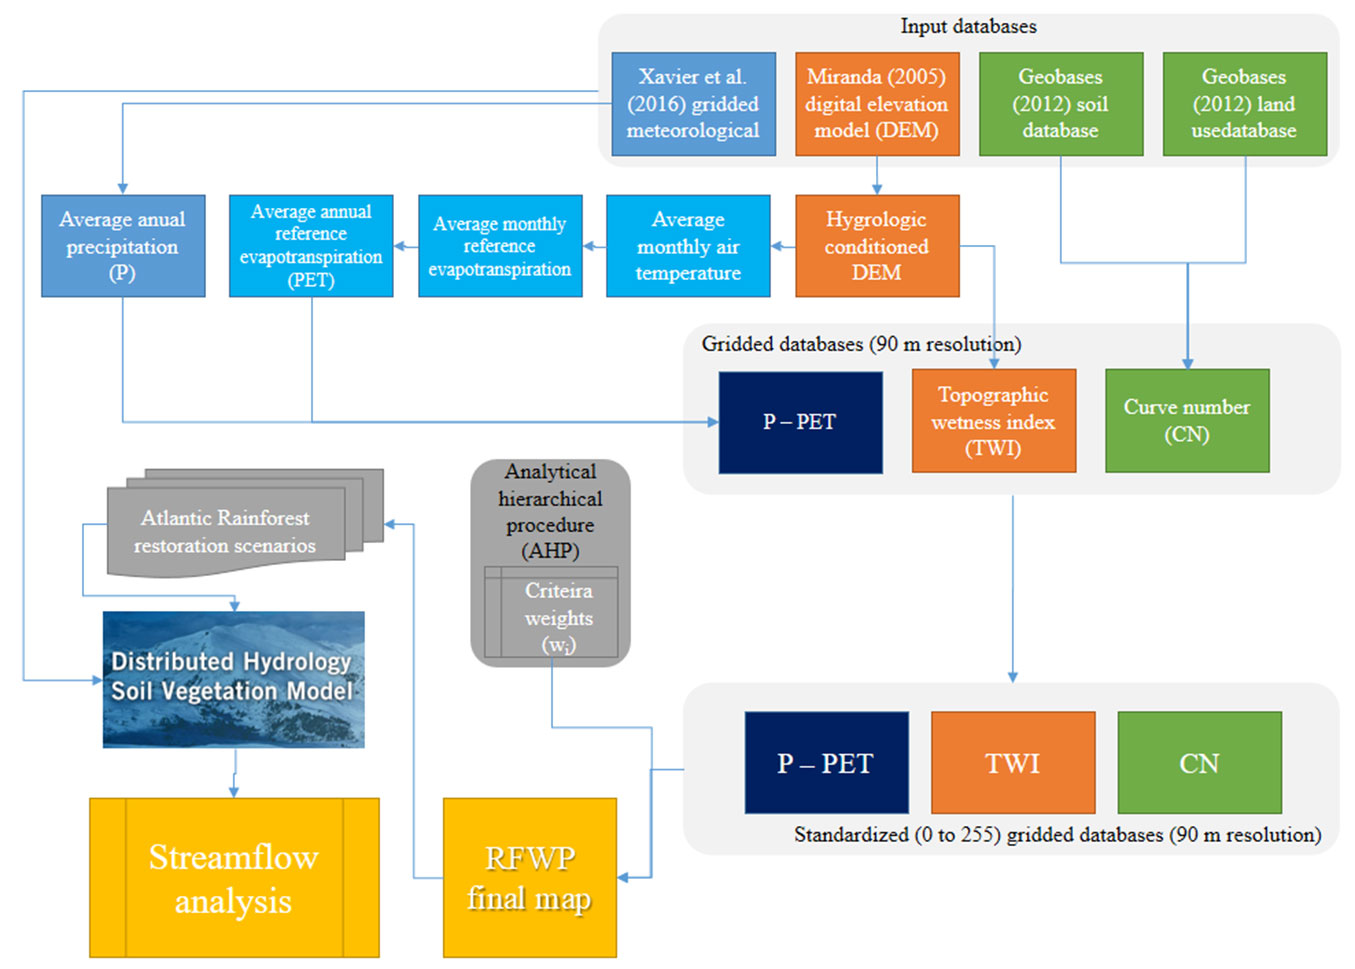
The steps for applying the RFWP and verifying land-use changes with hydrological modeling are summarized in Fig. 3.
Fig. 3 - Methodological steps for the application of RFWP and verification of land-use changes by hydrological modeling.
Results and discussion
Application of RFWP
The final result of RFWP to BHPAIN is shown in Fig. 4a, and its reclassification in the eight different classes is shown in Fig. 4b.
Fig. 4 - Maps resulted from the application of RFWP to BHPAIN. (a) Values of the aggregated criteria over the study area; (b) reclassification of grid points in 8 classes of priority to forest restoration.
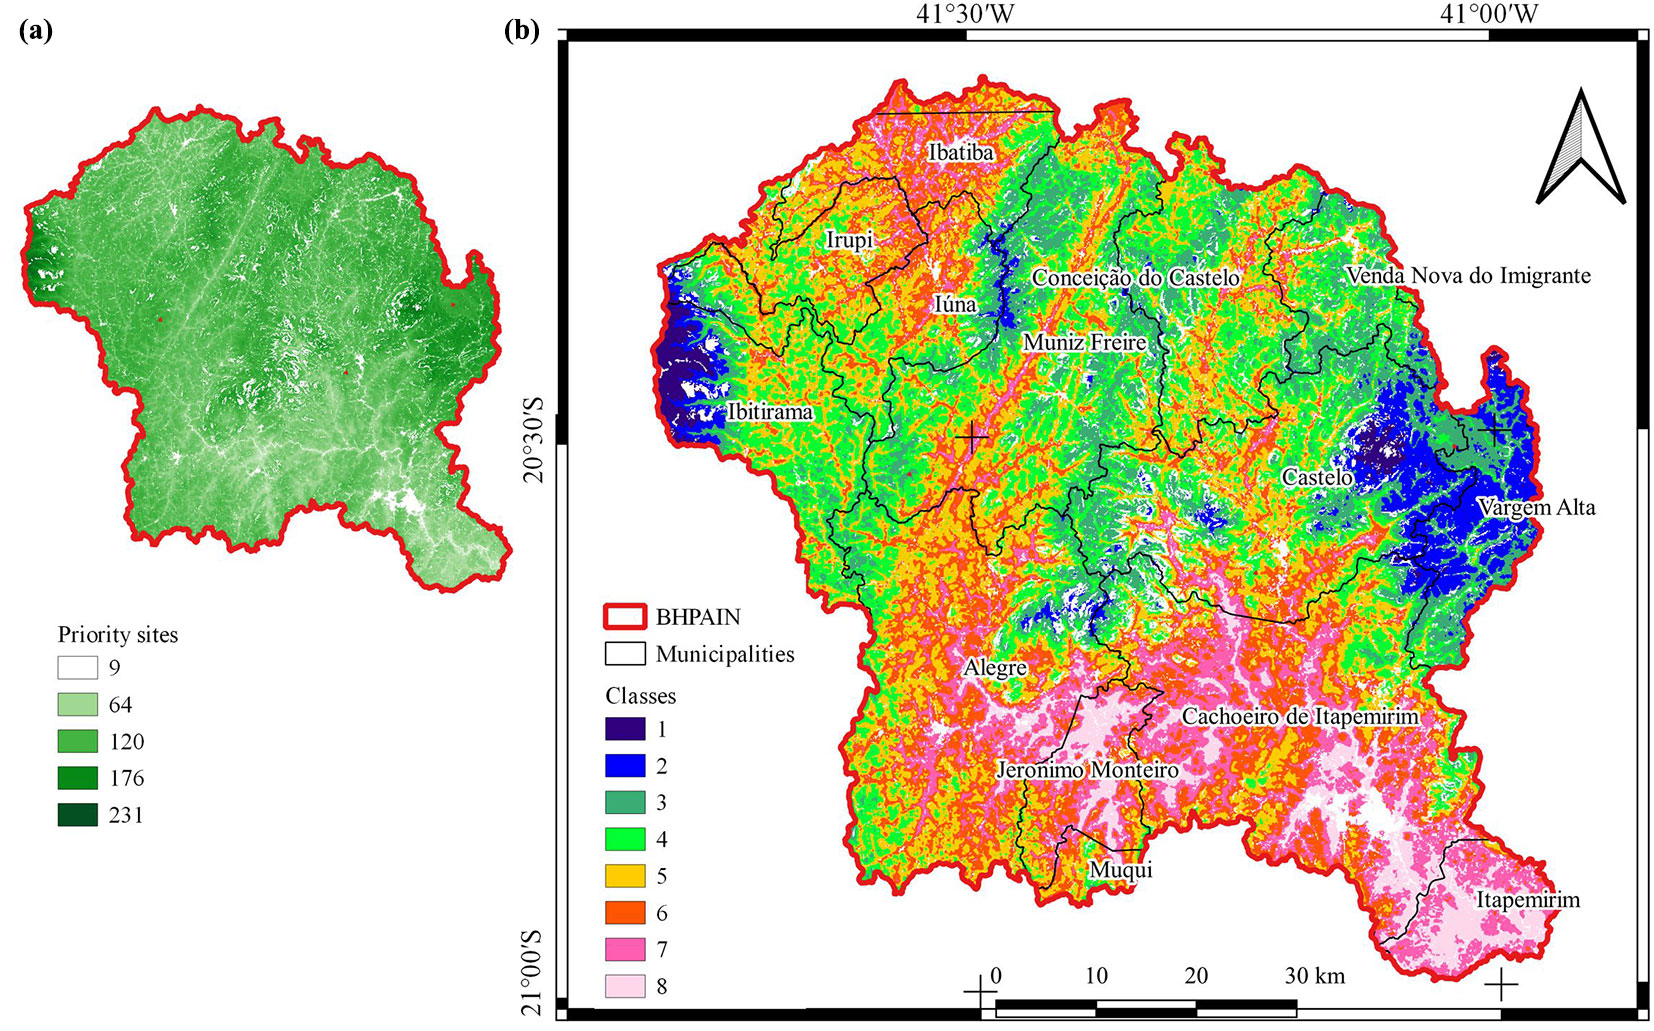
The highest S-values of Fig. 4a represents sites most suitable for the Atlantic Rainforest restoration to increase water availability. The maximum value of S was 231, and the minimum was 9. The “blank” areas are those where land use cannot be changed (rocky sites, mining sites, urbanized areas, and water bodies).
Comparing Fig. 4 and Fig. 5b, one can observe that the criterion P - PET was determinant to delineate the three classes of higher priority (1, 2, and 3) due to its higher wi. In classes 4 and 5, there is a prevalence of TWI, but the classes are still influenced by the P - PET, especially in sites with good water availability (higher P - PET). The delineation of classes 6, 7, and 8 was influenced by the TWI in sites close to water bodies and by lower P - PET values.
Fig. 5 - Results of the simulated scenarios of the Atlantic Forest restoration at BHPAIN. (a) Percentage of change in Qave and Q90; (b) percentage variation of the streamflows per increment of the Atlantic Forest area.

Class 1 sites (S range: 171-231) were found in areas close to important remaining forest fragments in the upper basin: Northwestern portion (Caparaó) and Northeastern portion (Castelo and Vargem Alta municipalities). The sites of class 2 (S range: 147-171) are situated around class 1 sites and reaches areas under pasture, agriculture, and also remaining forest fragments in the northwestern (Ibitirama) and northeastern (Castelo, Vargem Alta, and Venda Nova do Imigrante municipalities) headwaters of BHPAIN. Some sites at the high altitude of the BHPAIN’s center were also class 2 (Alegre, Cachoeiro de Itapemirim, Castelo, Muiz Freire, and Iúna). The forest fragments of class 1 and class 2 sites include the Caparaó National Park, the Forno Grande State Park (Castelo), and the part of the Pedra Azul State Park belonging to BHPAIN (Vargem Alta), which are protected areas included by the government as a priority for biodiversity conservation. Therefore, the sites of these classes can be taken as fundamental not only for water production but also for biodiversity conservation.
Sites class 3 (S range: 129-147) and site class 4 (S range: 115-129) include pastures, agriculture crops, and forest fragments at intermediate altitudes and in the middle basin. In class 5 (S range: 102-115), pastures at intermediate altitudes are predominant. Classes 6 (S range: 88-102), class 7 (S range: 72-88), and class 8 (S range: 9-72) occupies the lower basin and the lands along the valleys near the streams.
Our results confirmed that the RFWP decision rules applied can be considered adequate, since the priority sites for restoration were delineated in major P - PET areas far away from the water table and streams and with a significant potential infiltration. Indeed, these sites present the potential for the infiltration gain to exceed the evapotranspiration losses.
For the application of the RFWP in other areas or biomes, it is recommended to test different weights and the relative importance of criteria to assess which process is dominant to achieve the objective ([48]), or even include additional criteria. A sensitivity analysis must be incorporated to check the ordering of priority and the criteria’ weights ([33]).
Hydrological modeling of land-use change scenarios
The percentages of change in the reference flow for each scenario compared to current situation (SC0) are shown in Fig. 5a. Since the results in Fig. 5a may be masked according to the different restored areas of each class, the rate of variation of the flows (in %) as the surface (in km2) covered by native vegetation increases in the study area is displayed in Fig. 5b.
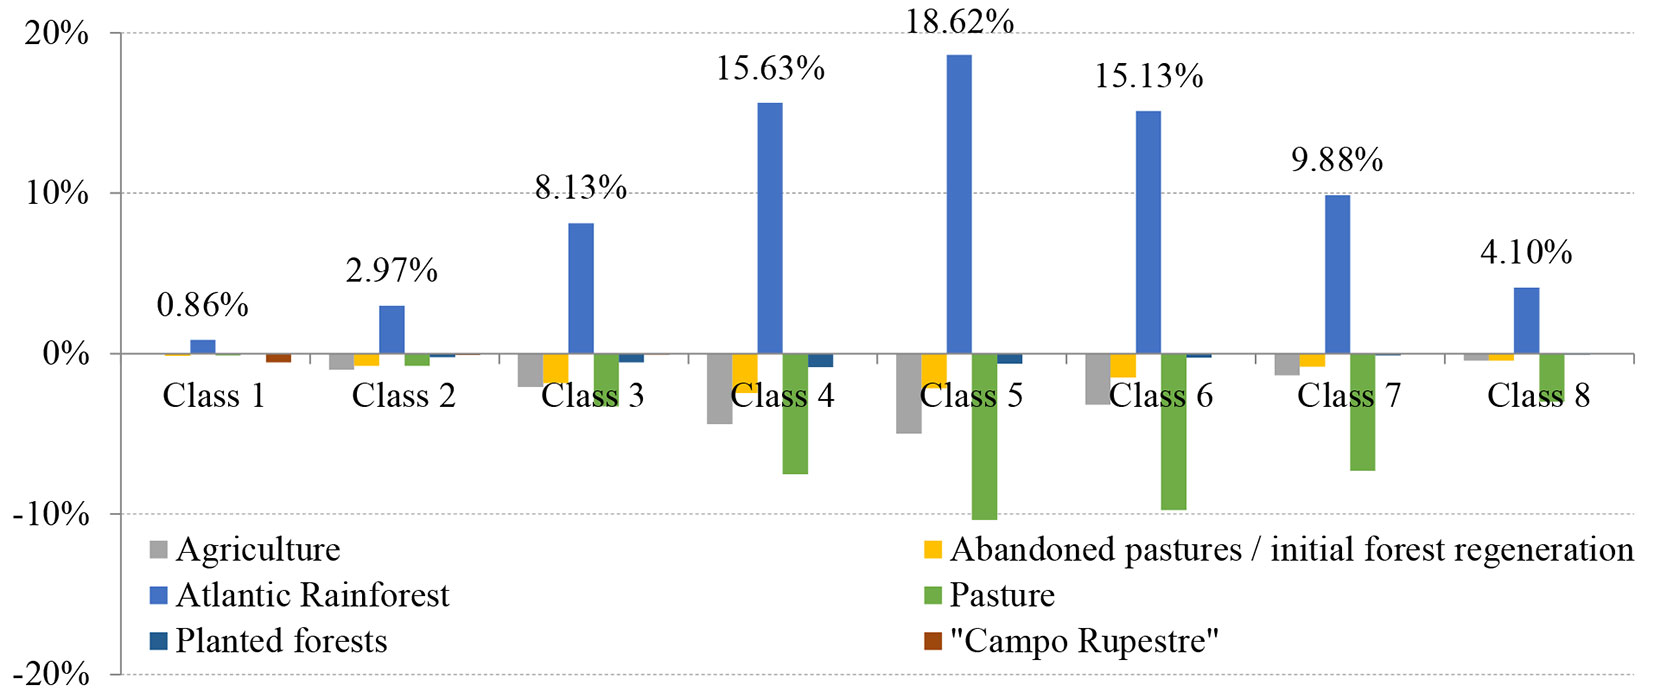
Fig. 6 shows that the percentage change in streamflows were more pronounced for Qave than for Q90 for all the scenarios, suggesting that forest restoration in BHPAIN could affect more significantly the annual water availability than that of dry periods. The discussion of the results presented in Fig. 6 will follow two main aspects: the comparison of the scenarios related to forest restoration individually in each class (SC1 to SC8), and the analysis of the scenarios that simulated the restoration of more classes together (SCA12 to SCA18).
Fig. 6 - Change of each land use (expressed as percentage of the basin area) considering the afforestation of all eligible areas inside each suitability class to forest restoration at BHPAIN.
Comparison of different scenarios of forest restoration (SC1 to SC8)
Fig. 5a shows that class 5 (SC5) is the one with the most significant change in Qave (1.29%) and Q90 (0.87%), while the order of the other classes’ impacts varies considering Qave or Q90. Forest restoration in SC7 and SC8 (worse to water production) contributed to the reduction of Q90, showing that RFWP results are consistent. The root system of the forest, in classes 7 and 8, tends to be closer to groundwater sources. In these areas, the forest maintains the evapotranspiration closer to PET for a longer period, increasing water consumption ([38]). Therefore, forest restoration in these areas contributes more to water consumption ([24]) than with the increase of infiltration, resulting in the reduction of water availability in dry periods. Based on the above considerations, we concluded that site belonging to classes 1 to 6 are more suitable for forest restoration aimed to water production than sites belonging to classes 7 and 8.
Fig. 6 presents the percentage of BHPAIN area affected by land-use changes in the simulated scenarios SC1 to SC8, where only a little afforestation occurs at SC1 (0.86% of the basin’s area), SC2 (2.97%), and SC3 (8.13%) compared to the other scenarios (SC4 to SC6). SC4, SC5, SC6 scenarios simulated an effective change of pastures and abandoned pastures to forest (about 15 to 19% of BHPAIN). Although classes 1 to 3 are the priority levels, their area available for forest restoration is smaller (Tab. 1, Fig. 6). This confirms the minor effect of SC1 to SC3 over the streamflows (Fig. 5a), and highights the need to evaluate the relative importance of afforestation in each scenario, which can be calculated by dividing the percentage change in the streamflow by the restored area (Fig. 5b), resulting in the percentage change in streamflow per 1.0 Km2 of afforested area.
Fig. 5b shows that the SC1 has the highest rate of change in flows per km2 of forest restoration. For all the other scenarios, the flow gains are decreasing. For Qave, the rate of change in SC1 is almost double that for SC2, suggesting the effectiveness of forest restoration for water production in these areas. The results in Fig. 5b support our initial assumption on the existence of areas more suitable for increasing water availability, and the effectiveness of method adopted in separating sites based on their potential increase of streamflow after forest restoration.
Combination of forest restoration scenarios (SCA12 to SCA18)
The SCA12 to SCA18 scenarios consisted of combining two or more classes of sites eligible to forest restoration. According to Fig. 5a, the most substantial increment for Qave is predicted under SCA18, which simulated the most significant increase in forest cover (3889.1 km2 or almost 75% of the basin area). The results of scenarios SCA15 to SCA18 showed little difference from each other. The more significant increase of Q90 was obtained under scenario SCA16, which simulated forest restoration over an area of 3167.1 km2 (61% of the whole basin). Yet, the increase in both flows was not high, being only 4.73% for Qave and 2.45% for Q90. This corroborates the results of previous studies on the BHPAIN, which demonstrated that the rainfall exerts more influence than forest cover over BHPAIN streamflow ([36]).
Fig. 5a also suggests that the combined scenarios (SCA) could lead to higher increases in streamflow than the individual scenarios (SC). Indeed, a considerable increase in the streamflows was observed under SCA12 to SCA15, while smaller increases in the Qave and Q90 are predicted by the subsequent scenarios. However, Fig. 5b shows that the percentage gain in Q90 per km2 of afforestation is expected to be higher under SC12 to SC14. Therefore, the sites of classes 1 to 4 are priority sites, and have more potential to increase Qave and Q90, and therefore water availability.
Overall, our results delineate the areas of the BHPAIN where forest restoration could better contribute to increase streamflows, especially pastures, which are mostly in degraded conditions ([45]). Based on simulated scenarios, an increase in the native forest cover up to 27.6% of the BHPAIN area, namely at sites indicated by classes 1 to 4 (SCA14), is expected to significantly enhance local water production.
General considerations about RFWP
The results found are the first step towards spatial planning aimed to identify suitable sites for afforestation to support the environmental and socioeconomic functions of the landscape. The results of RWFP must be assessed carefully for each basin, as it could have negative consequences in different ecosystems, such as in the warmer regions with high evapotranspiration. For example, it has been reported that an intermediate forest cover in regions with drier climate can maximize groundwater recharge ([25], [39]).
The RFWP is a useful tool that allows the delineation of sites where forest restoration potentially changes the balance between infiltration and evapotranspiration, thus achieving net water production. Our results showed that in specific sites, the forest impact on the streamflow was positive, while in other sites the flow is reduced. The results of hydrological modeling confirmed the suitability of the method used in this study for spatial analysis and mapping.
Land use planning and management can greatly benefit from the use of RFWP to identify the areas of favorable conditions for the infiltration and aquifer recharge, increase the water availability of catchments and, as an immediate consequence, reduce erosion processes. The benefits of forest restoration in the study area can be enhanced by adopting best management practices ([15]) and sustainable agricultural systems ([55]), such as agroforestry. In this context, due to the vast predominance of pastures at BHPAIN, the adoption of Integrated Crop-Livestock-Forest Systems (ICLFS) is recommended to achieve sustainability ([2]).
Finally, identifying priority areas for forest restoration intending to increase water availability is still a challenging problem. Further research is encouraged, especially in different regions, to test the applicability of the RFWP. Besides, we consider essential the validation of RFWP with observational data in the field.
Conclusions
The methodology applied in this study (RFWP) allowed to map sites with different levels of priority for the restoration of Atlantic Rainforest aimed at increasing water availability (streamflows) in the BHPAIN (SE Brazil). The hydrological modeling proved that the method adopted is effective for the above purposes. However, caution should be taken in the choice of criteria to be included and in the weighting of criteria, and their prior assessment is recommended to improve the RFWP performance. Overall, our results support the use of RFWP as a helpful tool in land use planning and management.
Acknowledgments
This study was partly financed by the Coordenação de Aperfeiçoamento de Pessoal de Nível Superior - Brasil (CAPES) - Finance Code 001; and Conselho Nacional de Desenvolvimento Científico e Tecnológico - Brasil (CNPq) - Finance Code 304916/2017-0.
References
CrossRef | Gscholar
CrossRef | Gscholar
CrossRef | Gscholar
CrossRef | Gscholar
CrossRef | Gscholar
Authors’ Info
Authors’ Affiliation
Laís Thomazini Oliveira-Ravani 0000-0001-7346-2511
Sidney Sara Zanetti 0000-0001-9135-3925
Department of Forestry and Wood Sciences, UFES - Federal University of Espirito Santo, Vitória, ES, 29075-910 (Brazil)
Computer Sciences Department, UFES - Federal University of Espírito Santo, Vitória, ES, 29075-910 (Brazil)
Corresponding author
Paper Info
Citation
Cecílio RA, Oliveira-Ravani LT, Zanetti SS, Mendes HA (2021). Method for classifying sites to Atlantic Rainforest restoration aiming to increase basin’s streamflows. iForest 14: 86-94. - doi: 10.3832/ifor3658-013
Academic Editor
Carlotta Ferrara
Paper history
Received: Sep 22, 2020
Accepted: Dec 18, 2020
First online: Feb 19, 2021
Publication Date: Feb 28, 2021
Publication Time: 2.10 months
Copyright Information
© SISEF - The Italian Society of Silviculture and Forest Ecology 2021
Open Access
This article is distributed under the terms of the Creative Commons Attribution-Non Commercial 4.0 International (https://creativecommons.org/licenses/by-nc/4.0/), which permits unrestricted use, distribution, and reproduction in any medium, provided you give appropriate credit to the original author(s) and the source, provide a link to the Creative Commons license, and indicate if changes were made.

Web Metrics
Breakdown by View Type
Article Usage
Total Article Views: 37017
(from publication date up to now)
Breakdown by View Type
HTML Page Views: 31041
Abstract Page Views: 2701
PDF Downloads: 2635
Citation/Reference Downloads: 0
XML Downloads: 640
Web Metrics
Days since publication: 1983
Overall contacts: 37017
Avg. contacts per week: 130.67
Article Citations
Article citations are based on data periodically collected from the Clarivate Web of Science web site
(last update: Mar 2025)
Total number of cites (since 2021): 2
Average cites per year: 0.40
Publication Metrics
by Dimensions ©
Articles citing this article
List of the papers citing this article based on CrossRef Cited-by.
Related Contents
iForest Similar Articles
Research Articles
Hydrological simulation of a small forested catchment under different land use and forest management
vol. 13, pp. 301-308 (online: 10 July 2020)
Research Articles
Method for the analysis of the relationship between forest cover and streamflow in watersheds
vol. 14, pp. 344-352 (online: 21 July 2021)
Research Articles
Quantitative assessment of past and future tropical forest transition and its dynamic to streamflow of the catchment, Malaysia
vol. 17, pp. 181-191 (online: 30 June 2024)
Short Communications
The Polish landscape changing due to forest policy and forest management
vol. 2, pp. 140-142 (online: 30 July 2009)
Research Articles
Evaluation of urban forest landscape health: a case study of the Nanguo Peach Garden, China
vol. 13, pp. 175-184 (online: 02 May 2020)
Research Articles
The concept of green infrastructure and urban landscape planning: a challenge for urban forestry planning in Belgrade, Serbia
vol. 11, pp. 491-498 (online: 18 July 2018)
Research Articles
Communicating spatial planning decisions at the landscape and farm level with landscape visualization
vol. 7, pp. 434-442 (online: 19 May 2014)
Review Papers
Large-scale effects of forest management in Mediterranean landscapes of Europe
vol. 6, pp. 342-346 (online: 29 August 2013)
Research Articles
How do urban dwellers react to potential landscape changes in recreation areas? A case study with particular focus on the introduction of dendromass in the Hamburg Metropolitan Region
vol. 7, pp. 423-433 (online: 19 May 2014)
Research Articles
Public participation GIS to support a bottom-up approach in forest landscape planning
vol. 6, pp. 347-352 (online: 29 August 2013)
iForest Database Search
Search By Author
Search By Keyword
Google Scholar Search
Citing Articles
Search By Author
Search By Keywords
PubMed Search
Search By Author
Search By Keyword


