Interactions between thinning and bear damage complicate restoration in coast redwood forests
iForest - Biogeosciences and Forestry, Volume 13, Issue 1, Pages 1-8 (2020)
doi: https://doi.org/10.3832/ifor3135-012
Published: Jan 08, 2020 - Copyright © 2020 SISEF
Research Articles
Abstract
Silviculture was used to direct the development of young redwood stands toward old forest stand structures. Two variable-density thinning treatments and an unthinned control treatment were monitored for 10 years following treatment in young coast redwood (Sequoia sempervirens) stands in northern California, USA. The intent of these treatments was for forest restoration by accelerating the development of old forest features. The thinning treatments increased individual tree growth in both low and moderate density thinning treatments as compared to the control. The variable-density thinning also resulted in greater stand structural variability and was successful at increasing the relative proportion of redwood. Black bears (Ursus americanus) caused major damage to residual trees and showed a preference for more vigorous trees. Most of this damage occurred in the first four years after thinning. The confounding effects of thinning to favor larger trees and bear damage preferentially affecting more vigorous and large trees reduced the effectiveness of these treatments by eliminating the stems intended to form the future old forest structures. It also indicates forest managers need a conservative approach that leaves greater numbers of residual trees in redwood stands when bears are present. Thinning should leave sufficient trees to form the old forest structure plus ample allowances for bear-caused mortality. The long-term outcome of stand development in these thinned redwood forests is uncertain because of high rates of mortality in young trees.
Keywords
Sequoia sempervirens, Restoration, Variable-Density Thinning, Precommercial Thinning, Silviculture, Ursus americanus
Introduction
Coast redwood (Sequoia sempervirens [Lamb. ex D. Don] Endl.) forests are noted for their large sizes, the great ages of individual trees, and the magnificent structures these forests form. However, much of the range of redwood was harvested by the end of the 20th century ([6]). These harvested forests are at various states of regrowth from these initial harvests, or multiple harvests, and have experienced a range of management treatments including prescribed burning, planting, and thinning. Many thousands of hectares of cutover forest have been converted to protected areas as national, state or local parks. These cutover forests were often regenerated in ways that increased uniformity in spatial patterns and age structures. Many stands were also intentionally re-established to reduce the proportion of redwood. At present, many of these stands consist of high densities of relatively small trees, a less than desirable species composition, and slow future development due to high density ([19], [21]). A common management objective in these protected areas is restoration towards old forest structures.
In contrast to these young forests, old redwood forests have low densities, dominance by redwood, and multiaged stand structures ([14], [21]). Spatial patterns are random for old trees and clumpy for smaller trees ([4], [29]). Clonal reproduction in redwood leads to unusual spatial patterns with clumpy patterns of stems, but old forest stands typically consist of many clones ([15]). Individual trees can be several meters in diameter, reach heights over 110 m, and can live over 2,000 years ([24], [16]). Biomass can exceed 3.0 × 10⁷ kg ha-1 with basal areas over 250 m2 ha-1 ([1], [8], [30]). Hence young stands have little resemblance to the old forests they are intended to emulate through restoration.
Restoration in young redwood stands builds on well-developed silvicultural concepts related to density control and its effect on tree size and stand structural development. Previous studies have demonstrated the potential to increase tree growth by decreasing tree density, and the importance of artificial thinning as a density reduction tool, including in redwood stands ([23], [13], [31], [19], [20], [21], [5]). Restoration treatments in redwood are complicated by the objectives of developing stands that emulate natural old forest structures - a process that took centuries - and doing so as rapidly as possible. These objectives are best achieved by encouraging the attainment of rapid rates of tree increment to achieve large tree sizes, heterogeneous spatial patterns of trees, and heterogeneous tree sizes. This also includes increasing the proportion of redwood to more closely emulate the old forest features present before harvest ([21]). Hence, these objectives are primarily met by lowering density to increase tree growth and creating irregular spatial patterns.
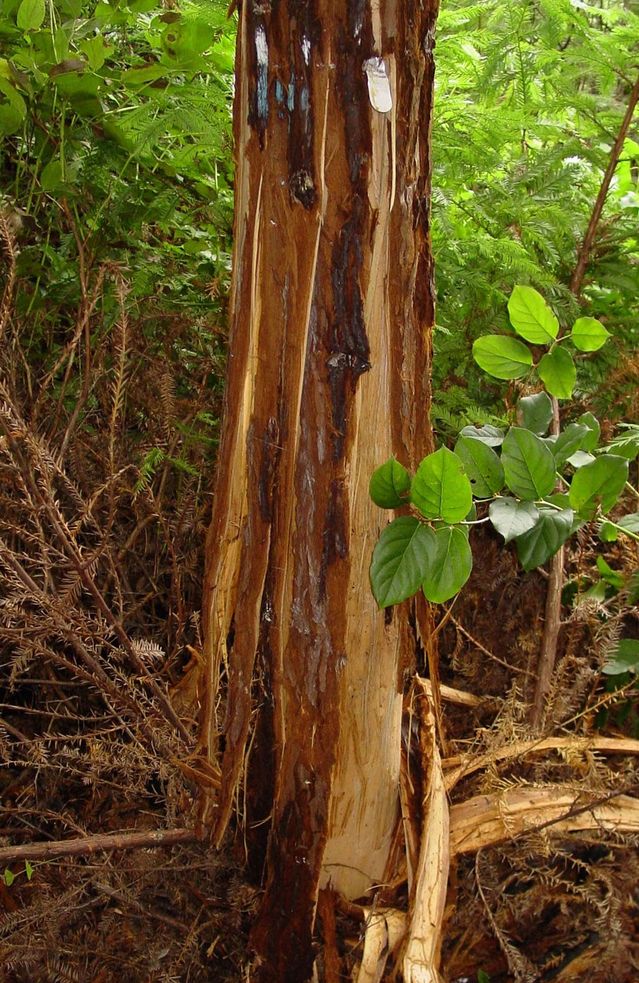
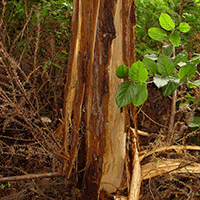
An additional factor that complicates redwood restoration is black bears (Ursus americanus Pallas) which damage and sometimes kill redwood stems in some parts of the natural range of coast redwood ([7], [27], [25]). These bears remove the bark to eat the cambium, thereby severing or partially severing the cambial connection between the roots and the crown (Fig. 1). Bears can cause significant economic loss in young commercial forests ([11]). Redwood trees, because of their sprouting ability ([26], [3], [17]), can resprout from below the bole damage to form new stems. This often produces multiple-stemmed trees that will grow to eventually reach sizes that are also vulnerable to bears. The bears apparently prefer redwood over other species, trees that are more vigorous (e.g., higher sugar content in the cambium), and smaller trees (10-60 cm dbh - [10], [19], [25], [5]). Restorative thinning treatments can therefore potentially exacerbate bear damage by increasing the proportion of redwood and increasing the vigor of residual trees. In the most extreme cases, bears may repeatedly damage stands thereby reducing the probability of any tree reaching a large size and forming long-term structures of many smaller trees. This outcome is potentially the opposite of the desired stand structure intended to result from these restoration treatments.
Several operational and research field trials have been implemented in young coast redwood stands to examine alternate trajectories to achieve restoration objectives ([9], [19], [28]). These trials used an assortment of protocols to achieve variable spatial patterns using variable-density thinning (VDT). VDT attempts to enhance stand variability by thinning in different ways within a single stand ([2], [18]). However, designing a VDT prescription protocol to enhance variability in a systematic way creates other difficulties. For example, some previous trials were effective in enhancing variability, but were difficult to implement, whereas others were easy to implement but were not as effective for increasing stand heterogeneity ([18]). None of these trials have been followed for more than a few years and therefore results to date have been preliminary.
In this analysis, we evaluated the effectiveness of VDT after ten years in young stands using two different thinning treatments and an untreated control. The Mill Creek restoration project was implemented as a research study in 2004 and previously reported after four years ([19]). Results indicated thinning was effective for accelerating diameter growth rates and enhancing size variability four years after VDT. However, bear damage to redwood trees approached 10% per year in some of the heavier thinning treatments ([19]). That rate of damage, if it continued, would negate any growth advantage to the thinning as trees favored in thinning may be subsequently and repeatedly damaged by bears. Additionally, the sprouting response from damaged redwood stems often results in multiple sprouts that negate the intent of the thinning treatments by increasing total density. However, four years is insufficient period to assess these treatments when stand development is expected to proceed for centuries.
In this reanalysis ten years following thinning, we pursued the following objectives: (i) examine the effects of VDT on density and tree increment (dbh, height, volume); (ii) examine the effects of VDT on structural diversity (density and species); (iii) examine the rate and significance of bear damage in thinned stands; (iv) analyze the tradeoffs between reducing density which accelerates size development, and increasing bear damage which increases stem density and slows size development; and (v) make recommendations on future restoration thinning in redwood.
Methods
Study area
The study was located at Del Norte Coast Redwoods State Park (DNCRSP - formerly the Mill Creek property) in Del Norte County, California, USA (41.733 N, 124.083 W). The study area was approximately 5 km from the Pacific coast on a highly productive site. The previous industrial owner of this property clearcut most of the property and replanted using predominantly coast Douglas-fir (Pseudotsuga menziesii [Mirb.] Franco var. menziesii). Most stands dominated by conifers on the 10,120 ha property were established in the 1980s and 1990s and were planted at relatively high densities (approx. 1000 to 1800 trees ha-1) for commercial timber production ([19]).
California State Parks (CSP), the agency responsible for management of DNCRSP, is restoring the property to encourage the development of old forest features in redwood stands (such as large trees, diverse stand structures, dominance by redwood, etc.), and reducing live fuels. Restoration therefore involves increasing the proportion of redwood in young stands, reducing density to accelerate tree growth, and encouraging rapid development of old forest features. The thinning program is a key component of these restoration objectives because of its effect on stand development, species composition, live fuels, and other resource concerns related to wildlife habitat. Revenue generation from thinnings is not a priority for DNCRSP: however, the high cost of thinning and budgetary constraints represent long-term constraints to achieving restoration objectives.
Experimental design
The thinning study was replicated in three locations or study areas within a linear distance of approximately 2 km. Each study area was in a mixed coast redwood and Douglas-fir plantation established between 1988 and 1991 that ranged from 7 to 22 ha in size. The Douglas-fir in these stands was mostly planted on regular spacings after clearcutting. Redwood regeneration included sprouts from cut stumps, damaged small trees, or roots. There was also natural seedling recruitment, primarily of Douglas-fir ([19]). Site quality was high with Douglas-fir site index ranging from 39.6 to 42.7 m (50 yr base - [12]). Two study areas, “Child’s Hill” and “Moratorium” were divided into eight treatment areas. The third, “Cougar Ridge”, was smaller and was divided into three treatment areas ([19])
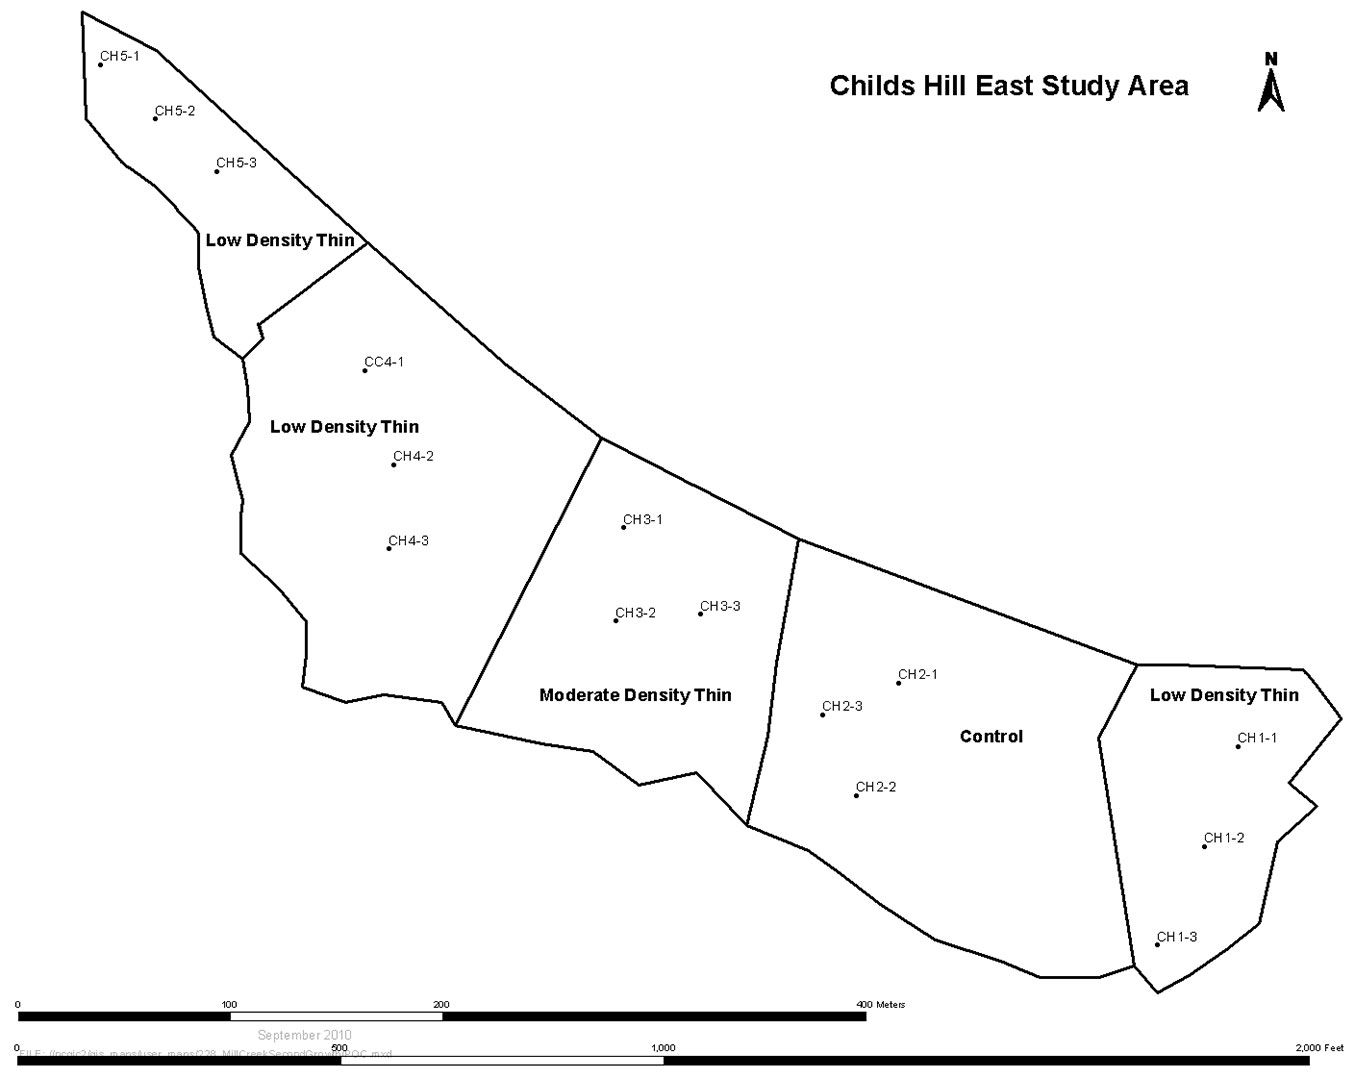
The two thinning treatments and an unthinned control were assessed. Thinning treatments included a low density treatment with a target post-thinning density of 125 trees ha-1 that was designed to reduce the stand to the desired density in a single operation. A moderate density treatment with a target of 250 trees ha-1 was designed as the initial operation of several steps over subsequent decades to achieve the desired density. The two treatments therefore represent “one-step” and “multistep” options for directing stands on trajectories to their target restored stand structures. Because of concern over these densities, a 50% long-term allowance for mortality was assumed and post-thinning densities were adjusted upwards to 185 trees ha-1 in the low density and 371 trees ha-1 in the moderate density treatment. At Child’s Hill and Moratorium, four treatment areas were randomly assigned to the low density treatment, and two each to the moderate density and control treatments (Fig. 2). Additional treatment areas were assigned to the low density treatment because greater variation in stand structure was anticipated. At Cougar Ridge, one treatment was randomly assigned to each area.
Fig. 2 - Layout of eastern part of the Childs Hill study area showing division into five treatment areas and randomized plot locations. The western part of this study area was immediately adjacent and included three more treatment areas.
Variable-density thinning for this research study required marking trees for removal to provide randomization of horizontal spatial patterns of trees within plots but consistent application between plots. To achieve this, the 2003 marking protocol required the tree-marker visualize an area of the stand, or a cell, equal to the average area available per tree given the target post-thinning densities. The cell was 1/125 ha or 80 m2 in the low density treatment and 1/250 ha or 40 m2 for the moderate density treatment. A random number from 1 to 4 was assigned to each cell based on a roll of a single die and represented the number of retained trees except rolling a “4” indicated no retention thereby creating a small gap and numbers “5” and “6” were ignored. As the tree-marker moved from cell to cell, a variable density thinning resulted with an average of 1.5 trees per cell ([19]). Species priorities for retention in decreasing preference were redwood, then alternate conifer species such as Sitka spruce (Picea sitchensis [Bong.] Carr.), western hemlock (Tsuga heterophylla [Raf.] Sarg.), grand fir (Abies grandis [Dougl. ex D. Don] Lindl.), and western redcedar (Thuja plicata Donn ex D. Don), then coast Douglas-fir, and various broadleaved species such as tanoak (Notholithocarpus densiflorus [Hook. & Arn.] Rehd.), Pacific madrone (Arbutus menziesii Pursh), and California laurel (Umbellularia californica [Hook. & Arn.] Nutt.). The tallest tree or trees for a given species within a cell were retained regardless of spatial position or tree form to further accelerate the process of old forest structure development and avoid dysgenic selection. No commercial wood products were removed and all thinning debris was left on site ([19]).
In 2004, three plots were established in each treatment except in the larger low density treatment area at Cougar Ridge, where six plots were established. All plots were circular and 0.067 ha in size for the low density and moderate density treatments, and 0.040 ha for the control treatment where higher densities and less variation were anticipated. Locations of plots were randomized on transects through the middle of treatment areas or by preselecting randomized locations within treatment areas. Plots were measured in winter of 2004 shortly after thinning, four years later in 2008, and after ten years in 2014. Tree diameter at 1.37 m above ground (dbh), and height were measured on all trees greater than 1.37 m height except in the control treatments where tree height and height to live crown were subsampled and measured at approximately every fourth tree. Trees were numbered and a paint mark was made on trees at 1.37 m to mark location of the diameter measurement. Thinning debris or slash was not measured in 2014 as thinning slash was almost non-existent and indistinguishable from other forest floor debris. The proportion of the stem damaged by bears, stem mortality, and other stem deformities were recorded, as were any obvious clonal patterns among redwood stems ([19]).
Analysis
Mean dbh, height, and volume were calculated for each plot, then averaged across treatments within a treatment area, and then averaged across all treatment areas. Tree volumes were calculated by assuming a cylinder stem segment below, and a frustrum of a paraboloid above, breast height. A comparison of means analysis was conducted on three groups of trees: (1) all trees present in 2004 and 2014; (2) trees present in 2004 and still alive in 2014 (i.e., residual trees); and (3) the largest 125 trees ha-1 in 2004. The latter density corresponded to the target restoration density for these stands. ANOVA was used to test for significant changes in size and species composition due to treatment area and treatment effects. The coefficient of variation (CV) was used to describe size variation. Multiple logistic regression was used to assess the probability of bear damage in redwood and Douglas-fir using tree diameter in 2004, treatment (n=3), and study area (n=3) as independent variables. Tree diameter in 2004 was used as a surrogate for tree vigor/size because it represented tree size at the initiation of the study and was measured on every tree.
Results
Ten years after thinning, mean size (dbh, height, volume) of all trees present in both measurements was greatest in the untreated control treatment and less in both thinning treatments (Tab. 1). However, statistically significant differences were uncommon due, in part, to the high variation within treatments. Only the height of the control trees was significantly greater than the heights of trees in the thinned treatments. There were no differences in mean size of trees in the trees present in both 2004 and 2014 (residual trees - Tab. 1). Similarly, for the largest 125 trees ha-1, trees in the control treatment were larger than either thinning treatment but these differences were only significant for height. For the 125 largest trees, the low density treatment had the largest average diameter increase (6.7 cm) followed by the control (4.0 cm) and the moderate treatment (0.7 cm).
Tab. 1 - Average dbh, height, and volume for each treatment (± standard deviation) in 2004 and 2014. Sizes were calculated for all trees present during each year (All Trees), trees that were present in 2004 and alive in 2014 (Residual Trees), and the 125 largest trees per hectare based on dbh at both measurements (Largest 125 trees ha-1). Letters denote significant differences (p < 0.05) between 2014 treatment means after ANOVA.
| Measure | Treatment | All Trees | Residual Trees | Largest 125 trees ha-1 | |||
|---|---|---|---|---|---|---|---|
| 2004 | 2014 | 2004 | 2014 | 2004 | 2014 | ||
| DBH (cm) |
Control | 9.4 ± 2.1 | 18.0 ± 9.8 | 10.9 ± 1.9 | 18.5 ± 9.8 | 23.2 ± 2.2 | 27.3 ± 5.5 |
| Moderate density | 11.8 ± 3.9 | 13.6 ± 12.8 | 11.7 ± 3.9 | 22.1 ± 13.0 | 20.1 ± 3.2 | 20.8 ± 11.2 | |
| Low density | 13.3 ± 6.3 | 15.2 ± 13.9 | 13.2 ± 6.3 | 25.4 ± 16.3 | 18.2 ± 4.6 | 24.9 ± 13.3 | |
| Height (m) |
Control | 7.9 ± 1.3 | 13.4 ± 6.6 a | 8.8 ± 1.5 | 13.8 ± 6.5 | 12.5 ± 1.5 | 19.2 ± 3.4 a |
| Moderate density | 8.2 ± 1.6 | 8.7 ± 5.3 b | 8.1 ± 1.6 | 11.8 ± 5.6 | 11.6 ± 1.0 | 13.1 ± 4.4 b | |
| Low density | 8.3 ± 3.1 | 9.0 ± 5.5 b | 8.3 ± 3.1 | 12.8 ± 6.5 | 10.5 ± 2.0 | 13.9 ± 5.3 b | |
| Volume (m3) | Control | 0.1 ± 0.1 | 0.4 ± 0.4 | 0.1 ± 0.1 | 0.4 ± 0.4 | 0.3 ± 0.1 | 0.7 ± 0.4 |
| Moderate density | 0.1 ± 0.1 | 0.2 ± 0.4 | 0.1 ± 0.1 | 0.5 ± 0.5 | 0.2 ± 0.1 | 0.5 ± 0.5 | |
| Low density | 0.2 ± 0.1 | 0.3 ± 0.6 | 0.1 ± 0.1 | 0.8 ± 0.8 | 0.2 ± 0.1 | 0.8 ± 0.8 | |
Target densities for the thinned treatments were generally achieved with the initial thinning in 2004. However, subsequent ingrowth of new stems over the following ten years in the thinning treatments increased residual densities over targets (Tab. 2). In contrast, control treatment densities declined in this period but still remained higher than thinned treatments. Densities declined since 2008 in two of the control treatments (Childs Hill and Moratorium) suggesting competition-related mortality.
Tab. 2 - Mean post-treatment densities for three treatments and three study areas at Mill Creek. (n/a): not applicable.
| Study Area | Treatment | No. of Plots |
Density (trees ha-1) | ||||
|---|---|---|---|---|---|---|---|
| Target | 2004 | 2008 | 2014 | 2004-2014 Change |
|||
| Childs Hill |
Control | 6 | n/a | 1623 | 1433 | 1117 | -506 |
| Moderate density | 6 | 371 | 410 | 482 | 460 | +50 | |
| Low density | 12 | 185 | 192 | 277 | 326 | +134 | |
| Cougar Ridge |
Control | 3 | n/a | 3369 | 2438 | 2017 | -1352 |
| Moderate density | 3 | 371 | 558 | 1231 | 1667 | +1109 | |
| Low density | 6 | 185 | 331 | 640 | 838 | +507 | |
| Moratorium | Control | 6 | n/a | 3352 | 2730 | 1763 | -1589 |
| Moderate density | 6 | 371 | 346 | 645 | 592 | +246 | |
| Low density | 12 | 185 | 206 | 493 | 506 | +300 | |
The thinning treatments had an immediate and positive effect on moving tree species composition towards targets ([19]). The thinning treatments reduced the relative proportion of Douglas-fir and increased the proportion of redwood. In the ten years since the thinning treatments, these changes were still present, and even improved relative to the increase in Douglas-fir in the control treatment (Tab. 3). “Other species” increased in the low density treatment, but differences between 2004 and 2014 were not significant.
Tab. 3 - Species composition immediately after thinning and in 2014 by treatment area and treatment. All values are in percent. (CH): Childs Hill; (CR): Cougar Ridge; (MO): Moratorium. Standard deviations (SD) for study area means are shown.
| Treatment | Species Category | 2004 | 2014 | ||||||
|---|---|---|---|---|---|---|---|---|---|
| Study area | Mean ± SD | Study area | Mean ± SD | ||||||
| CH | CR | MO | CH | CR | MO | ||||
| Control | Redwood | 3.3 | 41.2 | 24.0 | 22.8 ± 19.0 | 1.9 | 36.8 | 21.5 | 20.0 ± 17.5 |
| Douglas-fir | 89.6 | 54.9 | 33.2 | 59.2 ± 28.4 | 94.8 | 58.7 | 44.0 | 65.8 ± 26.1 | |
| Other | 7.1 | 3.9 | 42.8 | 17.9 ± 21.6 | 3.4 | 4.5 | 34.5 | 14.1 ± 17.7 | |
| Moderate density | Redwood | 37.4 | 93.8 | 67.9 | 66.3 ± 28.3 | 38.9 | 74.9 | 67.2 | 60.4 ± 19.0 |
| Douglas-fir | 58.4 | 6.2 | 22.1 | 28.9 ± 26.8 | 48.1 | 14.0 | 14.3 | 25.5 ± 19.6 | |
| Other | 4.2 | 0.0 | 10.0 | 4.7 ± 5.0 | 13.0 | 11.0 | 18.5 | 14.1 ± 3.9 | |
| Low density | Redwood | 18.1 | 52.2 | 71.9 | 47.4 ± 27.2 | 20.2 | 37.7 | 62.9 | 40.3 ± 21.5 |
| Douglas-fir | 72.3 | 38.1 | 20.4 | 43.6 ± 26.4 | 46.9 | 40.4 | 10.0 | 32.5 ± 19.7 | |
| Other | 9.7 | 9.7 | 7.8 | 9.1 ± 1.1 | 32.8 | 22.0 | 27.0 | 27.3 ± 5.4 | |
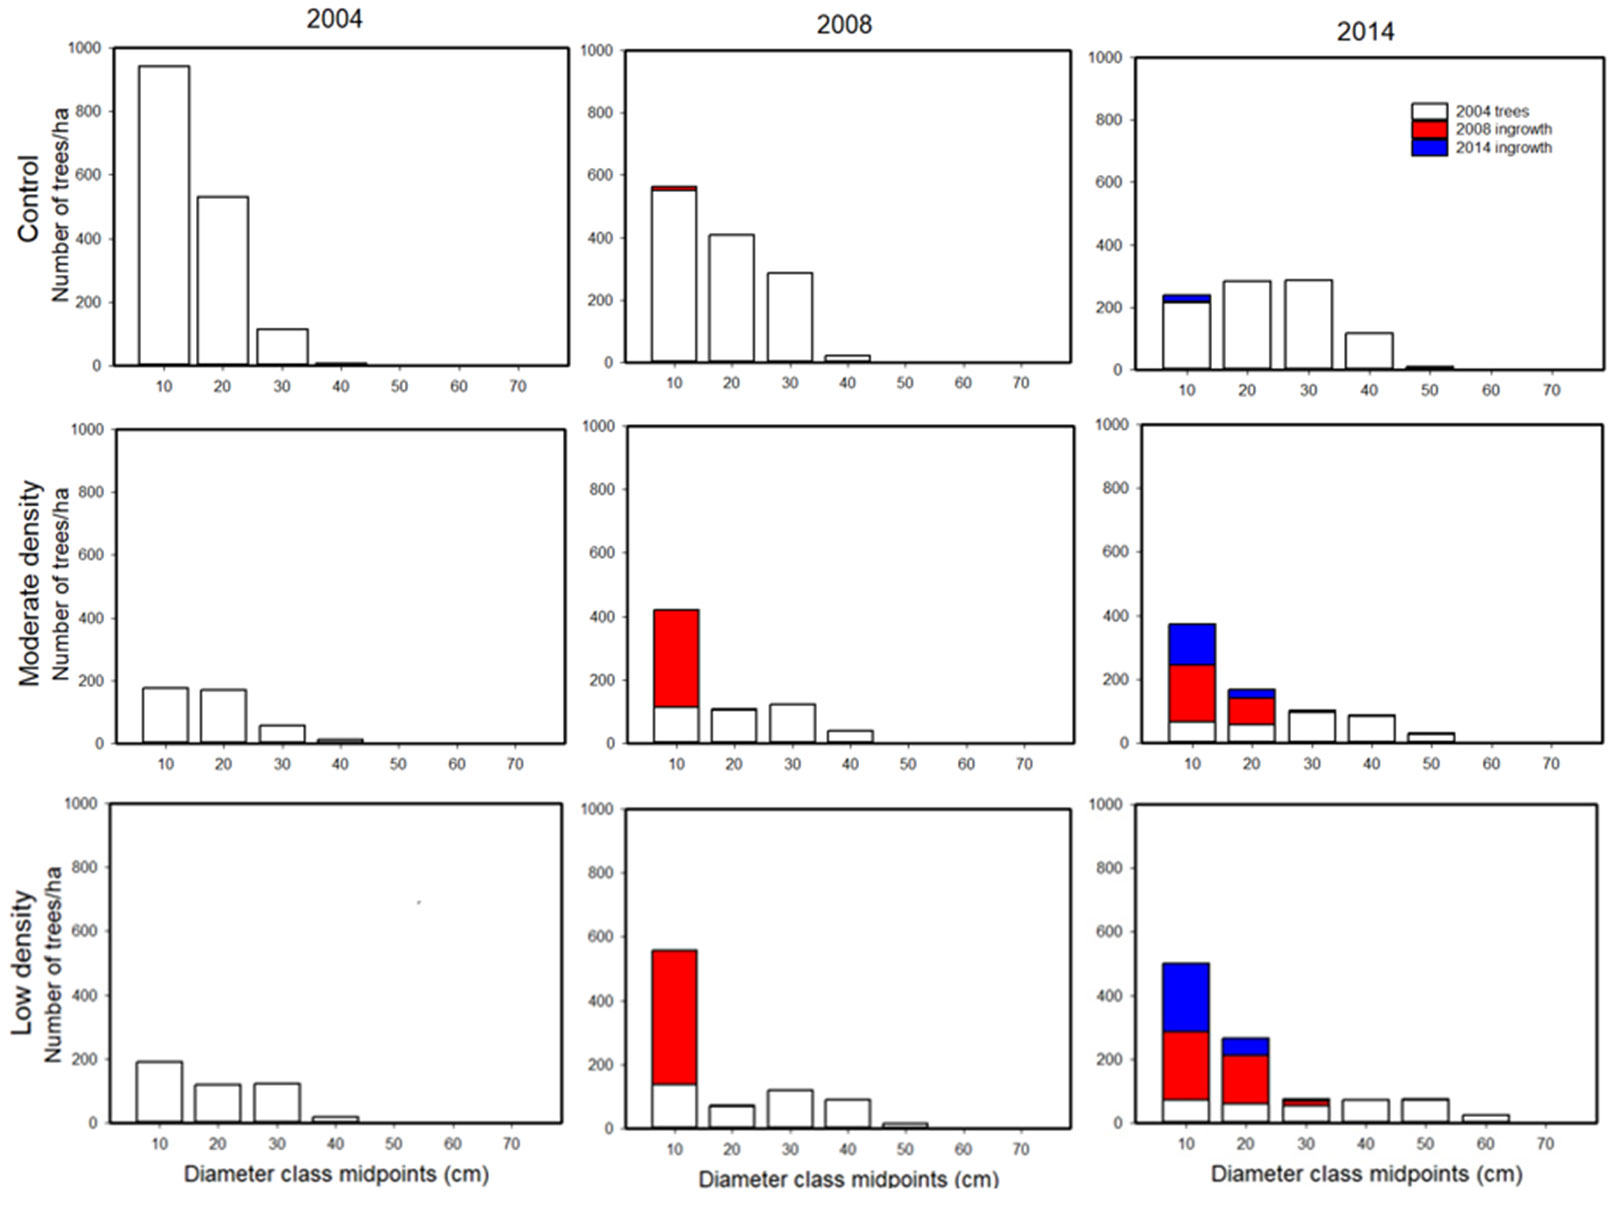
Diameter frequency distributions were used to show changes in stand structure in the ten years since treatment (Fig. 3). Distributions for the control treatments shifted to larger tree sizes and fewer total trees over time. In comparison, the thinned treatments included larger trees and fewer small trees than the controls. The thinned treatments also included ingrowth (i.e., new trees) that appeared in small size classes in both the 2008 and 2014 measurements (Fig. 3). The trends were towards normal distributions in the control plots and negative exponential distributions in the thinned treatments. Similar patterns of development were evident using height and volume distributions (not shown).
Fig. 3 - Changes in diameter distributions over time in three treatments from 2004 to 2014. Patterns show residual trees, and ingrowth in 2008, and 2014.
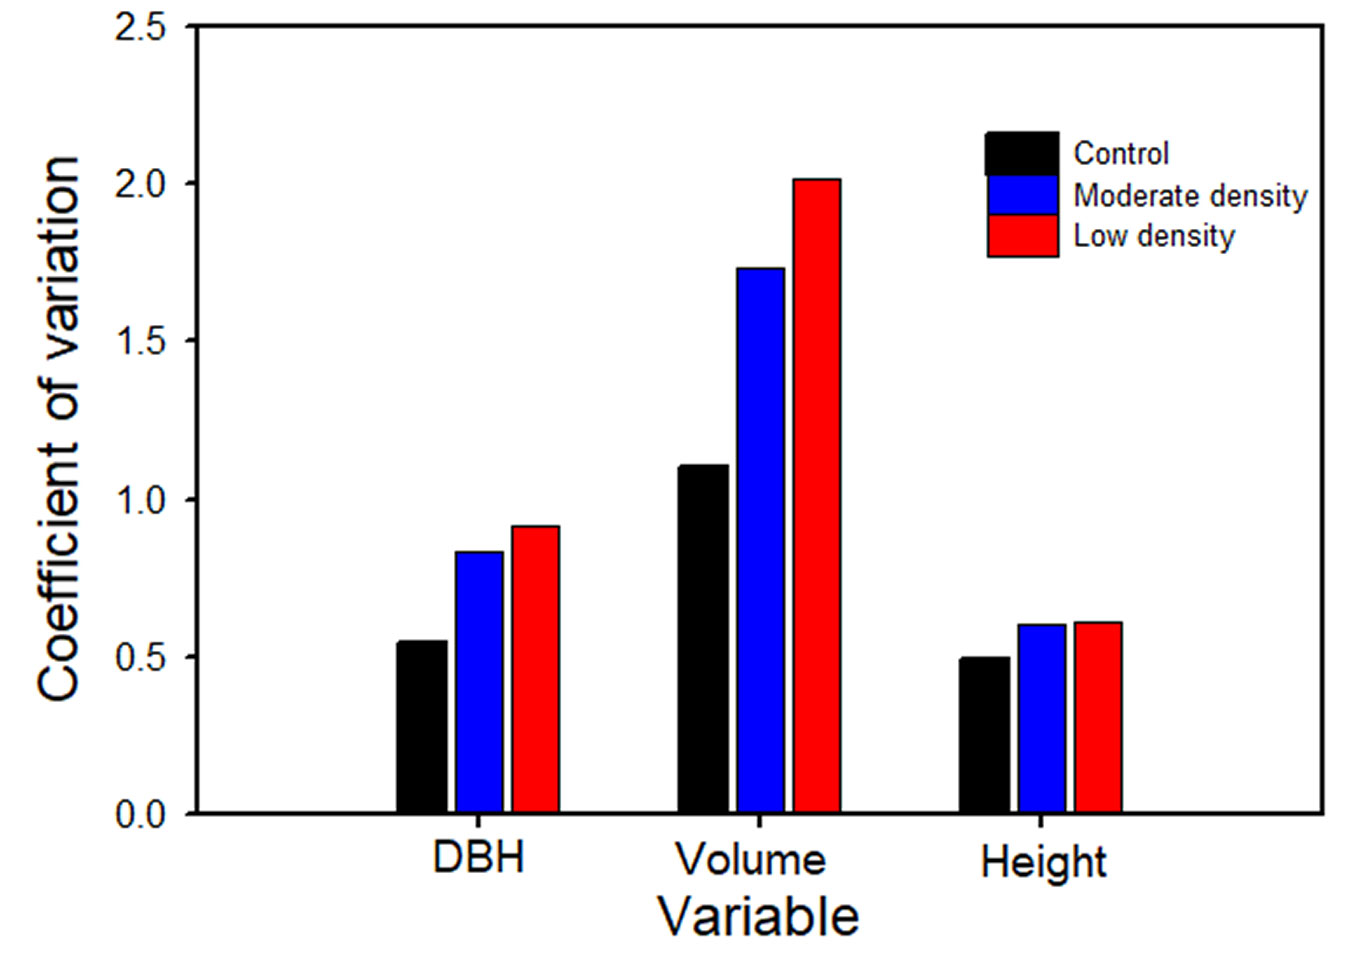
An objective of VDT is to increase variation in size structure. Young redwood stands typically have high levels of size variation (as represented by the coefficient of variation, CV) that was evident in the control plots in these analyses (Fig. 4). Thinning enhanced this variation in both the low and moderate treatments. Additionally, the CV was greater in all treatments in 2014, including the control, as compared to the values reported for 2008 ([19]).
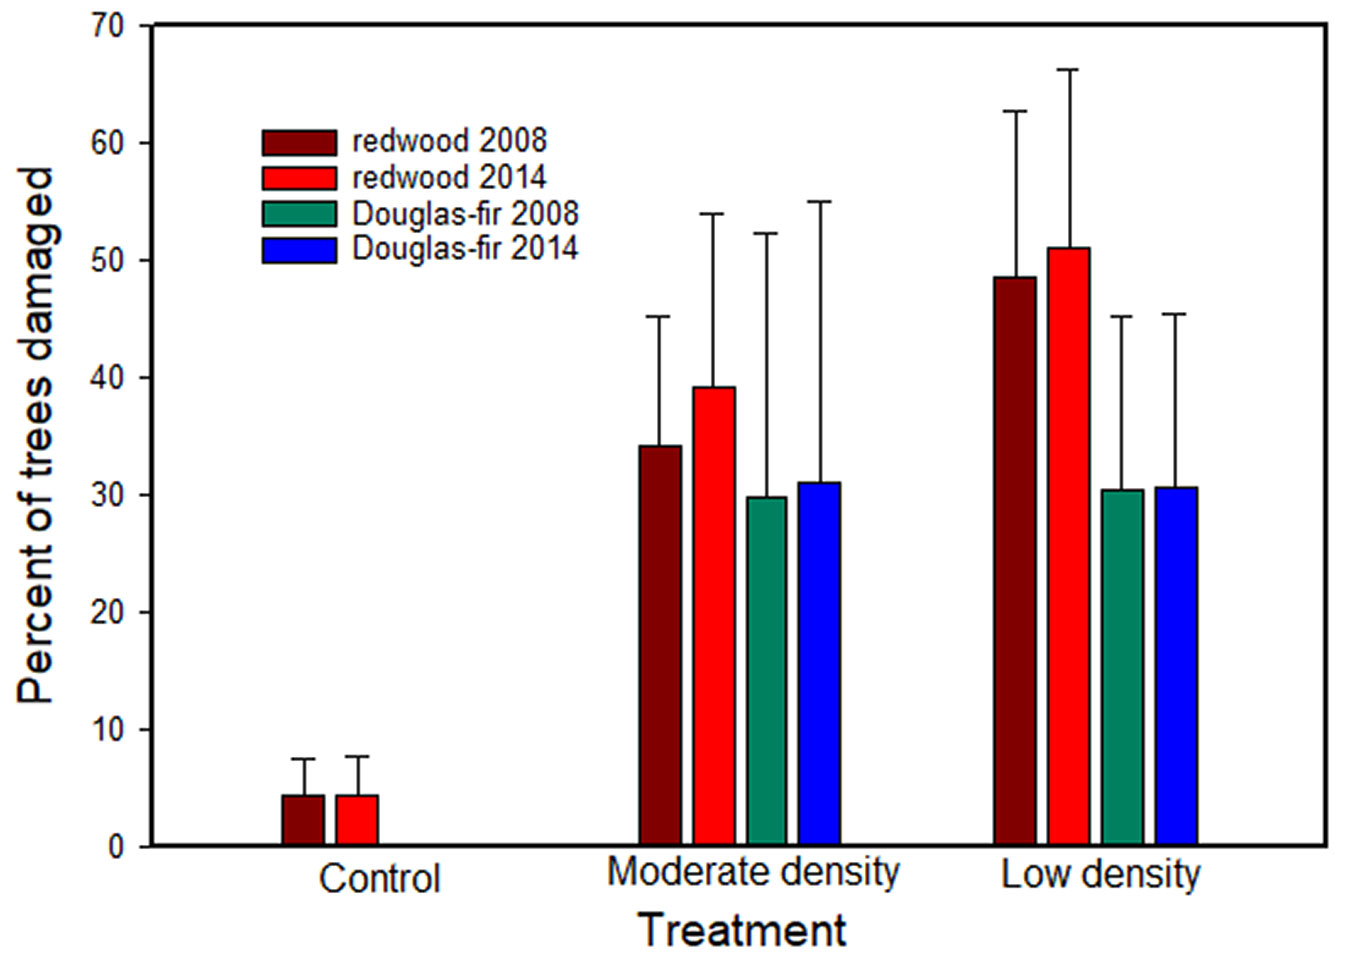
Bear damage (including partially girdled stems and killed stems) to trees in the study continued through year ten in both thinning treatments, but at a much reduced rate between 2008 and 2014 (Fig. 5). Damage was very minor in the control over the entire study and particularly in Douglas-fir. For redwood, damaged trees reached approximately 51% and 39% of all residual trees in the low and moderate treatments by year 10, with 19% and 11% top killed, respectively. Damage to residual Douglas-fir was constant from 2008-2014 at approximately 30% for both thinning treatments. In contrast, damage in the control treatments increased from 4.3 to 4.6% for residual redwood trees and remained below 1% for residual Douglas-fir trees. The only significant treatment effects were between the control and both thinning treatments. Whereas bear damage was greatest in thinned treatments, total stem mortality for residual trees from all factors was greatest in the control treatments (Tab. 4).
Fig. 5 - Percent of residual redwood and Douglas-fir trees damaged by bears in 2008 and 2014. The percent mortality of Douglas-fir in the control treatment was less than 0.04% and not visible in this figure.
Tab. 4 - Ten-year percent mortality of residual trees by treatment for redwood, Douglas-fir, and all species.
| Treatment | Percent mortality | Total trees ha-1 |
||
|---|---|---|---|---|
| Redwood | Douglas-fir | All species |
||
| Control | 51 | 31 | 41 | 1592 |
| Moderate density | 19 | 13 | 17 | 416 |
| Low density | 11 | 17 | 14 | 450 |
Logistic regression models were very strong for predicting bear damage in both redwood and Douglas-fir. For redwood, treatment, study area, and initial tree diameter were all significant (Tab. 5). The model estimated the probability of redwood damage at greater than 50% in low and moderate treatments for trees greater than approximately 15 cm dbh. For Douglas-fir, treatment and initial tree diameter were significant independent variables (Tab. 5). Comparing models indicated redwoods are preferred in all treatments, and the more severe “low density” thinning had greater damage than the moderate and control treatments for both tree species (Fig. 6).
Tab. 5 - Logistic regression models for redwood and Douglas-fir. Study area were the Childs Hill, Cougar Ridge, and Moratorium. Treatments were the low density, moderate density, and control.
| Species | Independent variable |
Coefficient | Standard error |
Wald statistic |
P-value | Model evaluation |
|---|---|---|---|---|---|---|
| Redwood (n = 858) |
Constant | -3.889 | 0.419 | 86.278 | <0.001 | Chi-square: 751.130 (P = 0.995) |
| DBH 2004 (cm) | 0.116 | 0.011 | 106.201 | <0.001 | Likelihood ratio test: 277.131 (P <0.001) | |
| Study area | -0.294 | 0.131 | 5.032 | 0.025 | Hosmer-Lemeshow: 68.212 (P<0.001) | |
| Treatment | 1.091 | 0.121 | 81.001 | <0.001 | - | |
| Douglas-fir (n = 1176) |
Constant | -7.264 | 0.457 | 252.606 | <0.001 | Chi-square: 679.944 (P = 1.000) |
| DBH 2004 (cm) | 0.121 | 0.017 | 50.134 | <0.001 | Likelihood ratio test: 304.080 (P <0.001) | |
| Treatment | 1.729 | 0.141 | 150.102 | <0.001 | Hosmer-Lemeshow: 32.592 (P<0.001) |
Fig. 6 - Logistic regression models to predict bear damage in redwood and Douglas-fir. “L”, “M” and “C” refer to low density, moderate density, and control treatments. The redwood model was limited to trees less than 21 cm and the Douglas-fir to 30 cm, the maximum diameters observed in this study. The redwood model included a term for study area which was held constant as the Childs Hill study area in this figure.
Discussion
The expected response to thinning, including VDT, is to increase mean tree size with time. This has been commonly observed in redwood ([23], [13], [17], [31], [20]), including the first four-year results from this study ([19]). However, the ten-year results from this study indicate that bears preferentially damage the largest trees in thinned treatments. The net trends in the thinning treatments were an increase in density and a loss of tree size potential from the repeated thinning “from above” (i.e., the most vigorous trees) caused by bears: neither outcome was consistent with the original restoration objectives. In contrast, the controls had higher rates of mortality because of competition. This was a thin “from below” that maintained larger trees and increased average tree size. The bear damage in this study resulted in reduced mean tree size, increased ingrowth, and reduced the effectiveness of the restoration thinning treatments. Because of the complexity of these interactions, and the long periods necessary for restoration, it is not clear what the ultimate effects of these treatments and the bears will be on stand structure development and restoration objectives.
The thinning treatments were moderately effective at increasing the proportion of redwood in the thinned stands. By favoring redwood and other species over Douglas-fir, in stands that were predominantly Douglas-fir, the treatments have also modified the species composition to more closely resemble the target. However, improvement was not consistent in all treatments due, in part, to bear damage to redwood and Douglas-fir. Additionally, as bears affected both redwood and Douglas-fir and only redwood resprouts after complete girdling of the stem, the effect of the bears is to increase the proportion of redwood in terms of numbers of stems. The thinning treatments have accelerated the development of a heterogeneous stand structure based on greater age variability, and a lesser effect on enhancing larger tree sizes than in unthinned treatments.
The damage to tree stems by bears represents an overriding factor affecting density management decisions in redwood stands where bears damage trees. At present, this extensive damage is limited to the northern part of the redwood range where this study was conducted. This damage typically has a disproportionate effect on the larger, released trees where thinning left relatively little competition, and on redwood. Through year ten, the low density treatment was somewhat effective at increasing residual tree growth rates, reducing Douglas-fir, and enhancing structural variability, but damage to the largest trees and redwoods is contrary to restoration objectives. The slowing of bear damage rates from 2008-2014 was unexpected and may indicate an attraction to trees in recently thinned stands or some change in bear population demographics. The rate of damage, however, does not preclude the possibility that affected stands are prevented from moving out of a stand initiation stage (sensu [22]) where trees do not attain large sizes and regeneration is perpetually stimulated by death of larger stems.
VDT is designed to enhance stand structural variability in stands that may be uniform because of regeneration methods or previous thinning. The higher coefficients of variation in the thinning treatments in this study indicate that the thinning treatments are accomplishing this goal. However, by increasing variation, VDT makes statistical inference more difficult. Studies of VDT, in general, are likely to face similar problems. These analyses were also made more difficult by the effects of bears which not only reduced density, but preferentially damaged or killed the largest trees. Additionally, when bark is removed at breast height by bears, DBH measurements may underestimate growth rates. Hence, quantifying the effects of VDT can be difficult, and the effects of bears compound these problems. Another element of stand structural variability is heterogeneous spatial patterns, but these were not assessed in this study. Whereas the thinning effects were examined in a study designed to replicate thinning treatments on multiple sites, these sites were close enough together that a few bears could have damaged all trees: hence bear damage effects were not part of the original study design and were not well replicated.
At the initiation of this study, it was recognized that thinning to the target final old forest density posed risks related to potential mortality or damage from any cause, particularly bears, over a long time horizon. Old forest tree densities typically range from approximately 50 to 100 trees ha-1 ([21]). Since there were no estimates of potential mortality during this long stand development process, the target density in the low-density treatment was increased to exceed the upper range of the target old forest density and have a 50% allowance for mortality. However, through year ten, it was already evident that the allowances for mortality in the low-density treatment may have been insufficient due to the high levels of stem mortality caused by bears. Whereas the total number of trees exceeded the targets at year ten, large numbers of residual trees have been killed and replaced by ingrowth of many smaller trees. The target densities for the more conservative moderate-density treatment at the onset of this study were twice as high as the low-density treatment. With a target post-thinning density of 371 trees ha-1 and a presumed 75% mortality rate, the resulting density would be approximately 93 trees ha-1. Ten years later, target density numbers are confounded by the opposing forces of bear damage and ingrowth, and further confounded by the ingrowth stimulated by the bear damage when bear-killed redwood stems have resprouted. The control experienced the highest rate of mortality due to competition-related mortality of smaller trees.
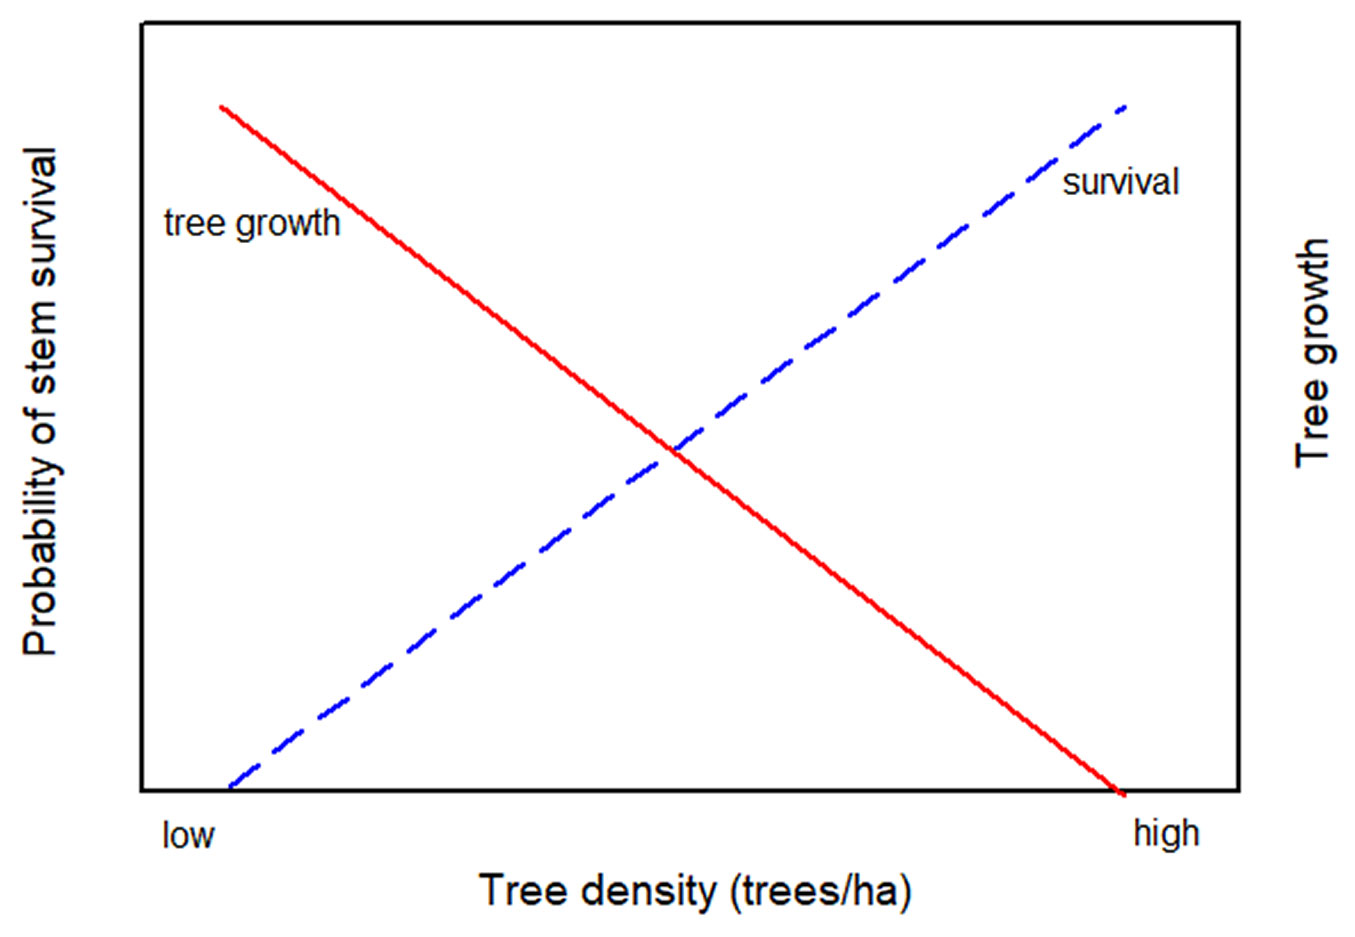
The effect of black bears on these thinned redwood stands is contrary to what is normally expected in young stands: instead of faster-growing trees having a greater chance of survival, their chances are lower. This has been demonstrated in previous studies ([25]), including the previous report from this study ([19]). This creates a relationship for thinned stands where tree growth increases with declining stand density, but survival decreases as shown schematically in Fig. 7. At high densities, survival is likely to be high but growth will be reduced. At low densities, survival will be low, but growth will be rapid. An appropriate density probably lies at some intermediate level. Decisions over thinning densities are complicated by these opposing processes, and further complicated by bear damage at low densities causing an increase in redwood sprouting and an increase in total stand density. This relationship implies that an ideal density may exist to achieve rapid growth at an acceptable level of bear damage. However, given the unpredictability of bear damage, and the limited data on thinning responses in redwood, this tradeoff between rapid growth and survival of individual trees is poorly defined. Other considerations that confound the determination of ideal tree densities is the desirability of creating decadent features (snags, dead tops, basal hollows, etc.) as found in old growth. Bear damage can help to create these features, but it may take many years to know which damaged trees will die or be sufficiently damaged to slow growth. In any case, an ideal density regime for any species is more likely to be defined as a range of densities for a particular age and site.
Fig. 7 - Tradeoff between tree growth and probability of survival of redwood stems at a range of tree density after thinning. At high densities, survival is likely to be high but growth will be reduced. At low densities, survival will be low, but growth will be rapid. An appropriate density probably lies at some intermediate level.
The damage to trees caused by black bears is only an issue in the northern part of the range of coast redwood. In areas where bears are not an issue, a low density or one-step approach to thinning will probably be successful. Where bear issues exist, a more conservative approach is warranted that involves thinning to higher residual densities and possibly multiple thinnings. This is a more costly approach that may also be more intrusive because multiple thinnings and greater monitoring will be necessary. The residual densities targeted by the treatments in this study ranged from 185-371 trees ha-1. The actual densities achieved by the treatments encompassed a larger range (Tab. 2). This range apparently encompasses an appropriate early stand density for coast redwood given the uncertainty of bear damage and the unpredictability of subsequent stand development. More precise prescriptions for early stand densities are not possible given this uncertainty and the tradeoffs, or inverse relationships, between tree growth and bear damage over a range of density. However, a conservative approach to this dilemma would be to leave higher densities than originally prescribed in the low density treatment of this study.
Conclusions
A variable-density thinning study in young coast redwood stands to achieve old forest restoration objectives has had limited success after ten years. Thinning increased individual tree growth rates, but more vigorous trees were preferentially attacked by black bears. Bear damage encouraged basal sprouting from redwood. The net effect has been an increase in density and no effect on mean tree size. The combination of thinning and bear damage has also increased stand structural variation which is consistent with restoration objectives. Thinning to remove smaller trees combined with bear damage of primarily larger trees produced confounding effects about treatment effects on tree size. The structural variability that is an objective of VDT also contributes to difficulties in making statistical inference because all variability is increased. This ten-year study provides a view of stand development following VDT, but only a glimpse given the long-term development process towards old forest structures in coast redwood. Whether sufficient numbers of trees will survive the bear damage threat to reach a large size remains an unanswered question. Restoration prescriptions in similar stands should probably take a more conservative approach where density is maintained at higher levels than the low density treatment presented here.
Author Contributions
Kevin O’Hara led in the design of study and the field measurements, data analysis, and manuscript preparation. Lakshmi Narayan managed data, data analysis and provided editorial review. Lathrop Leonard designed and supervised field measurements, and provided editorial review.
Conflicts of interest
The authors declare no conflicts of interest.
Acknowledgements
This work was funded by the Save the Redwoods League, US National Institute of Food and Agriculture (NIFA), and completed with the cooperation of California Department of Parks and Recreation.
References
Gscholar
Online | Gscholar
Gscholar
Gscholar
Gscholar
Gscholar
Online | Gscholar
Online | Gscholar
Authors’ Info
Authors’ Affiliation
Lakshmi Narayan
Department of Environmental Science, Policy and Management, University of California, Berkeley, CA 94720-3114 (USA)
California Department of Parks and Recreation, Crescent City, CA 95531 (USA)
Corresponding author
Paper Info
Citation
O’Hara KL, Narayan L, Leonard LP (2020). Interactions between thinning and bear damage complicate restoration in coast redwood forests. iForest 13: 1-8. - doi: 10.3832/ifor3135-012
Academic Editor
Emanuele Lingua
Paper history
Received: Apr 23, 2019
Accepted: Oct 17, 2019
First online: Jan 08, 2020
Publication Date: Feb 29, 2020
Publication Time: 2.77 months
Copyright Information
© SISEF - The Italian Society of Silviculture and Forest Ecology 2020
Open Access
This article is distributed under the terms of the Creative Commons Attribution-Non Commercial 4.0 International (https://creativecommons.org/licenses/by-nc/4.0/), which permits unrestricted use, distribution, and reproduction in any medium, provided you give appropriate credit to the original author(s) and the source, provide a link to the Creative Commons license, and indicate if changes were made.
Web Metrics
Breakdown by View Type
Article Usage
Total Article Views: 43832
(from publication date up to now)
Breakdown by View Type
HTML Page Views: 37065
Abstract Page Views: 2995
PDF Downloads: 2920
Citation/Reference Downloads: 9
XML Downloads: 843
Web Metrics
Days since publication: 2215
Overall contacts: 43832
Avg. contacts per week: 138.52
Article Citations
Article citations are based on data periodically collected from the Clarivate Web of Science web site
(last update: Mar 2025)
(No citations were found up to date. Please come back later)
Publication Metrics
by Dimensions ©
Articles citing this article
List of the papers citing this article based on CrossRef Cited-by.
Related Contents
iForest Similar Articles
Research Articles
Modeling of time consumption for selective and situational precommercial thinning in mountain beech forest stands
vol. 14, pp. 137-143 (online: 16 March 2021)
Research Articles
Long-term outcome of precommercial thinning on floristic diversity in north western New Brunswick, Canada
vol. 1, pp. 145-156 (online: 25 November 2008)
Research Articles
The conversion into high forest of Turkey oak coppice stands: methods, silviculture and perspectives
vol. 13, pp. 309-317 (online: 10 July 2020)
Research Articles
Tree-oriented silviculture: a new approach for coppice stands
vol. 9, pp. 791-800 (online: 04 August 2016)
Research Articles
Impact of thinning on carbon storage of dead organic matter across larch and oak stands in South Korea
vol. 9, pp. 593-598 (online: 01 March 2016)
Research Articles
Is it needed to integrate mixture degree in Stand Density Management Diagram (SDMD)?
vol. 16, pp. 274-281 (online: 28 October 2023)
Research Articles
Long-term effects of thinning and mixing on stand spatial structure: a case study of Chinese fir plantations
vol. 14, pp. 113-121 (online: 08 March 2021)
Research Articles
Deriving tree growth models from stand models based on the self-thinning rule of Chinese fir plantations
vol. 15, pp. 1-7 (online: 13 January 2022)
Research Articles
Age and thinning effects on elemental composition of Pinus pinaster and Pinus radiata needles
vol. 14, pp. 299-306 (online: 08 June 2021)
Research Articles
Acoustic evaluation of wood quality with a non-destructive method in standing trees: a first survey in Italy
vol. 10, pp. 700-706 (online: 17 July 2017)
iForest Database Search
Search By Author
Search By Keyword
Google Scholar Search
Citing Articles
Search By Author
Search By Keywords
PubMed Search
Search By Author
Search By Keyword

