
Temporal patterns control carbon balance in forest and agricultural tropical peatlands in North Selangor, Malaysia
iForest - Biogeosciences and Forestry, Volume 14, Issue 4, Pages 362-369 (2021)
doi: https://doi.org/10.3832/ifor3700-014
Published: Aug 10, 2021 - Copyright © 2021 SISEF
Research Articles
Abstract
Tropical peat swamp forests can sequester significant amount of carbon (C). However, there is dearth of understanding on the tropical soils’ C stocks and emissions because of the changes in peatland use, land use policies, and micro-climate. The objective of this study was to determine the C stocks and fluxes of two peat swamp forests and a peatland under mixed cropping in Selangor, Malaysia. Standard procedures were used to determine aboveground biomass, belowground biomass, selected peat soil physical, chemical, and biological properties, and environmental variables that are related to peat soil respirations. The mean C stocks for the peat swamp forest and mixed cropping sites were 1788.79 Mg C ha-1 and 1023.57 Mg C ha-1, respectively. The carbon dioxide emission rates of peat swamp forest and mixed cropping sites ranged from 7.20 to 73.13 tCO2 ha-1 year-1 and 26.50 to 43.43 tCO2 ha-1 year-1, respectively. These emissions are related to seasonal changes because the relative humidity, soil temperature, and ground water of the experimental sites had significant effects on soil respiration. Unlike the mixed cropping sites, the fluxes of the peat swamp forest were significantly higher in the dry season compared with the wet season. These findings suggest that peat soil respiration is controlled by relative humidity, temperature, and the changes in ground water table. Continued monitoring and conservation efforts to preserve stored C in peatlands are essential.
Keywords
Peat Characteristics, Carbon Storage, Carbon Dioxide Fluxes, Cash Crop Cultivation, Seasonal Variations
Introduction
Tropical peatlands play an important role in carbon (C) sequestration because they can store approximately 69.6-129.8 Pg C ([31], [8]). However, if they are not carefully managed, they can be a source of carbon dioxide (CO2) and methane (CH4). The occurrence of peatlands in Malaysia is approximately 2.6 M ha-1 ([26]) out of which approximately 0.64 M ha-1 occurs in the Peninsular Malaysia ([34]). The ever-increasing demands for agricultural and wood product lands has been implicated in the on-going soil C loss, climate change, forest degradation, bush fires, among others ([22], [7], [14]). Peatlands also play an important role in food security. For example, edible oils from the oil palm cultivation on peat soil have been sustaining the economies of many countries ([28], [40]). Planting cash crops such as soybean, maize, and cassava on peat soils reduces malnutrition, hunger, poverty, and unemployment ([1]). However, the improper management of peatlands for food production has been implicated in in the on-going environmental quality degradation. The literature is replete with information on greenhouse gas (GHG) emissions, particularly CO2 emission from oil palm cultivation on tropical peat soils that had been estimated ranging from 19 to 94 t CO2 year-1 ([27], [22], [7]). Unlike the oil palm industry, there is limited information on the CO2 emission from other cash crops cultivated on peat soils suggesting that that the CO2 emission for the cultivation of pineapples and sago in the eastern part of Malaysia (Borneo) ranges from 12.55 to 179.6 t CO2 ha-1 year-1 ([27], [6]). Information of this kind is lacking for the western part of Malaysia (Peninsular Malaysia) where peat soils are often cultivated with cash crops such as pineapples, banana, and cassava.
Information on climate heterogeneity such as relative humidity, rainfall, water table, soil and air temperatures ([27], [16], [15]) with monsoonal transitions and the impact of the controlling factors on soil respiration are still scarce. Understanding these factors and their confounding effects on soil CO2 fluxes may serve as a guideline for refining integrated management plans for peatlands.
The first objective of this study was to explain the temporal variations in soil CO2 fluxes due to seasonal change caused by changes in environmental and anthropogenic factors such as rainfall, air temperature, relative humidity, water table and land use. The second objective of this study was to determine selected peatland properties and C stocks under two contrasting land uses for sustainable management of peatlands.
Materials and methods
Study area
The study was conducted in Kuala Langat South Forest Reserve (KLSFR), Selangor, Malaysia. This forest reserve is approximately 6908 ha. Two plots were selected to represents a virgin jungle reserve in Compartment 26 (02° 40′ 48.8″ N, 101° 37′ 10.6″ E) and an adjacent agricultural land which is planted with banana (10 months old plants) and pineapple (12 months old plants - 02° 46′ 06.8″ N, 101° 34′ 30.5″ E). From 2008 to 2019, the mean annual rainfall and temperature of the area were 1895 mm and 27.6 °C, respectively. The area is an ecosystem restoration project under the jurisdiction of the Selangor State Forestry Department, Malaysia. Compartment 26 was gazetted in 1926 (174 ha) and it is not logged. The virgin jungle reserve has several important peat swamp forest tree species such as meranti bunga (Shorea teysmanniana), kempas (Koompassia malaccensis), bintangor (Calophyllum spp.) and geronggang (Cratoxylum arborescens). Endangered wildlife such as tapir, sun bears, and white handed gibbon are also found in the area ([9]). According to the neighbouring farmers, the agricultural land was leased in 1988 by the local agricultural development authorities for cash crop cultivation. The area is used for planting short-term crops to generate income for the local farmers. Currently, Compartment 7 (165 ha) is cultivated with bananas and pineapples, although information on the previous crop rotation is not documented. We established a 200 × 100 m permanent sampling plot (2 ha) in each compartment to collect soil samples in addition to measuring fluxes from July 2018 to August 2019. Each site had eight random sampling points and they were chosen within a regular grid.
Estimation of aboveground and belowground biomass
The aboveground biomasses in the sites were estimated using remote sensing techniques. Phase Array L-Band Synthetic Aperture Radar (PALSAR) obtained from the Advance Land Observation Satellite (ALOS) was used. An aboveground biomass estimation model was developed to estimate C stock of the experimental sites. Synthetic Aperture Radar (SAR) satellite images which were acquired in year 2017 from Phase Array L-Band Synthetic Aperture Radar 2 (PALSAR-2) system onboard Advance Land Observation Satellite 2 (ALOS-2) satellite were used as the primary input. The images consisted of two polarizations, that is, horizontal-vertical (HV) and horizontal-horizontal (HH) at 25-m spatial resolution, geometrically and radiometrically corrected and normalized for topography. These data were generated by Earth Observation Research Center (EORC) under JAXA (Japan Aerospace Exploration Agency) and supplied by the Remote Sensing Technology Center of Japan (RESTEC). In 2018, 84 sampling plots (21 clusters) were established in the study area. A cluster consisted of four plots (Fig. S1 in Supplementary material). The plots were circular with smaller nests (subset). The biggest nest measured 20 m in radius, followed by the smaller nests measuring 12 m and 4 m in radius. The trees were grouped by size, in classes, and thereafter, they were sampled based on the nest size. In addition to these nests, small nest measuring 2 m in radius was used to count saplings, i.e., trees measuring < 10 cm in diameter at breast height (dbh) and > 1.3 m in height. The range of trees which were measured in each nest of a sample plot are presented in Tab. S1 (Supplementary material). This design was developed by Walker et al. ([41]) and modified to suit tropical forest stand conditions by Hamdan et al. ([11]). The aboveground biomass was determined using an allometric equation ([5]) as follows (eqn. 1):
The equation is suitable for moist tropical forests with 1500-4000 mm annual rainfall, where D is the diameter at breast height in cm and Wt is total aboveground biomass in kg tree-1. The backscatter values from HV polarization from the two datasets were extracted from the images. The AGB values at the sample plots on the ground were correlated with the corresponding backscatter values using non-linear regression. This process produced several empirical models that were used to retrieve AGB of the study area. The estimation models used AGB as independent variable to observe the sensitivity of the backscatter to the AGB. The relationship between backscatter and AGB is often represented in logarithmic function as follows (eqn. 2):
where y is the aboveground biomass (Mg ha-1), x is the backscatter of HV polarization, a = 4.29740, and b = -39.015. For roots, the belowground biomass was estimated as 0.26 · AGB (Mg ha-1), according to Cairns et al. ([4]).
Soil observation and characterization
Soil sampling was done using an Eijkelkamp peat auger (dimension of 50 cm length and 5.2 cm in diameter) up to the depth of the mineral layer for each site at the beginning of the study (August 2018). The changes in colour, peat type, depth of horizon, and other features were recorded according to Soil Survey Staff ([36]). Peat soil degree of decomposition is classified as sapric, hemic and fibric. Sapric is the highly decomposed material which contains one-third of fibre by volume after rubbing test. Hemic is the intermediate which is partially decomposed, containing fibre between one-third and two-thirds of the volume before rubbing. Fibric material constitutes more than two-thirds of undecomposed material by volume after rubbing ([37]). The bulk density at different soil depths (based on pedological horizons) was determined using the coring method. Two replicates were collected at each horizon. Samples for bulk density were collected using a modified method using aluminium foils. The peat samples were retrieved using the extension auger, after which the samples were trimmed with a knife to 5 cm for uniformity. The individual samples were packed using aluminium foils after which they were kept in ziplock bags to avoid contamination. In the laboratory, the peat soil samples were weighed (with and without the aluminium foil) using a digital weighing balance after which they were oven dried at 65-70 °C ([41], [19]) until a constant weight was attained. This temperature range was chosen because of the organic nature of the peat soil samples. However, the mineral samples of sulfidic marine clay were oven dried at 105 °C for the bulk density determination.
Another set of independent soil samples were taken according to the pedological horizons for pH and electrical conductivity (EC) determination using the peat auger. The soil samples were also analysed for organic C using the Walkley & Black ([42]) method and Nitrogen (N) by dry combustion method ([23]) using a TruMac® CNS analyser (LECO Corp., St. Joseph, MI, USA). Walkley & Black ([42]) method was used because there was a requirement to determine organic matter content of the samples for basic properties. Available phosphorus (P) was determined using Bray and Kurtz Method II ([29]). Exchangeable potassium (K), calcium (Ca), and magnesium (Mg) were extracted using 1 M ammonium acetate (NH4OAc) calibrated at pH 7 after which these cations were determined using atomic absorption spectrometry. Cation exchange capacity (CEC) was determined using the leaching method ([39]). Peat soil C stocks were calculated by multiplying the percentage of organic carbon (OC) by the bulk density of peat (g cm-3) at the measured peat depths (cm) after which the values obtained were converted to t C ha-1.
Estimation of total soil respiration
An automated soil CO2 flux system (LI-8100®, Li-COR Biosciences, Lincoln, NE, USA) was used to measure the peat soil CO2 fluxes into the atmosphere. The instrument was calibrated twice within the duration of measurement using a standard CO2 gas. Also, the zero and span procedure before measurements were recorded. Measurements were taken between 10:00 and 12:00 p.m. This was based on the assumption that the daily soil CO2 fluxes were higher during this duration ([21]). Thus, eight replications of soil collars placed randomly for each site were used because of the complexity of the sites (limited access because of overgrowth and water inundation). Before the beginning of the measurement of the CO2 emission, soil collars (radius: 10 cm; height: 10 cm) were placed on the soil surface and inserted into the soil, leaving a headspace of 3 cm. Soil disturbance during collar insertion was minimized. Measurements were carried out from August 2018 to August 2019. During the CO2 emission measurement (two months interval), the lid of the chamber was closed to enable the air to circulate in the gap between the collar headspace and the chamber. Once the CO2 concentration in the chamber had stabilised (approximately 30 seconds), the concentration was recorded for approximately 60 seconds. Each measurement was repeated twice at each sampling point. The CO2 flux rate was determined using the Li-8100 A 4.0.9 systems software by calculating the initial slope of a fitted exponential curve at the ambient CO2 concentration. The units for this measurement were µg mol CO2 m-2 s-1. These values were converted to mg CO2 m-2 h-1 using a mathematical function and reported as total soil respiration.
Measurements of ancillary variables
At each time of soil respiration measurement, eight replicates of bulk density samples (one per sampling point) at 5 cm depth at each site were taken using core rings of 100 cm3. These soil samples were taken near the soil flux measurement sampling point to determine soil porosity and volumetric soil water content. Water filled pore space (WFPS) was calculated from the soil water content and bulk density. The particle density value which was used for organic matter was one g cm-3 as recommended by Brady & Weil ([3]) and Rixen et al. ([35]) for peat samples. Soil bulk density and soil water content were determined by recording the initial weight of the soils. Afterwards, they were oven dried at 105 °C until constant weight was attained. Water filled pore space (WFPS), which is the ratio of volumetric water content to total porosity of the peat soil was calculated. The peat soil temperature was determined using an additional temperature probe. The probe was inserted in the peat soil at a 5 cm depth and measurement was taken when the values stabilized (± 5 seconds). Relative humidity was determined using LI-8100 CO2 flux system.
Groundwater monitoring well was used to monitor the groundwater level (GWL) fluctuation at the experimental sites. The device is made of a two inch PVC (polyvinyl chloride) pipe with 8 mm holes to enable water to enter the monitoring well. The top of the pipe was closed with an end cap to prevent debris. The pipe was marked with the station number. A filtering net was used to wrap the PVC before it was inserted in the soil to prevent sedimentation. The PVC pipe was inserted in the mineral layer. The monitoring well was installed at the selected forest compartment on a transect of 300 m with an interval of 100 m measured from a river/channel/compartment boundary towards the forest. The GWL was measured by dipping a dry measuring stick or measuring tape inside the monitoring well. Water table depth was computed by subtracting the depth of the measuring point above the ground surface from the depth recorded between the water surface to the measuring point of the well. Values indicating water level below the ground surface were recorded negative whereas the values obtained above ground surface were recorded as positive values.
Meteorological data
Meteorological data for the duration of this study were obtained from the National Meteorological Department of Malaysia. The nearest weather stations from which data were obtained were at Banting (GPS: 02° 49′ N, 101° 30′ E), Malaysia and Kuala Lumpur International Airport, Sepang (02° 43′ N, 101° 42′ E), Malaysia. The data were downloaded from August 2018 to August 2019. The rainfall ranged from 54.2 to 378.2 mm (Fig. S2 in Supplementary material). Because the climate in Malaysia is controlled by two monsoon seasons, heavy rainfall is expected from October to March (wet season), whereas May to September are relatively drier. The wet season (September to December 2018) and the dry season (July to August 2018, and August 2019) had high and low precipitations, respectively. Lower air temperature was recorded (± 27.0°C) during the wet season whereas higher air temperature (28 and 29 °C) was recorded during the dry season.
Statistical analysis
All the measured variables were subjected to normality test using the Shapiro-Wilks test. To compare the differences of soil respiration and environmental variables across sampling time at the two experimental sites, normally distributed data were subjected to Analysis of variance (ANOVA), while non-normal data were subjected to Kruskal-Wallis test. A probability threshold of 0.05 was used to determine significant effects. Means which were normally distributed were compared using Student Newman-Keul (SNK) test. Pearson correlation analysis was used to determine the relationship among the environmental variables. The statistical analyses were conducted using the software SAS® ver. 9.4 (SAS Institute, Cary, NC, USA). For aboveground biomass, the estimation was validated using the k-fold cross-validation method, which is a technique that is used to evaluate a predictive model by dividing the original sample into (i) a training set to train the model and (ii) a test set to evaluate the model. The cross-validation process was repeated k times (the folds), with each of the k subsamples used exactly once as the validation data ([24]).
Results and discussion
Results for aboveground biomass which was measured according to logarithmic function showed that the eqn. 2 was significant at 95% confidence interval (data not shown). The estimated aboveground biomass, measured according to tree size classes (Tab. S1 in Supplementary material) was accurate with a RMSE value of ± 62.70 Mg ha-1 and a mean absolute percentage error (MAPE) of 18.5%. This accuracy was considered sufficient for the present study ([30]). The aboveground biomass at the forest site was 3.5 folds relatively higher compared to the mixed crop site (Tab. 1).
Tab. 1 - Carbon stocks (± standard error) for different tropical peatland uses. Mineral substratum depth: (a) 1.75 m; (b) 3.80 m.
| Carbon pools | Carbon stocks (Mg C ha-1) | |
|---|---|---|
| Mixed crops | Forest | |
| Aboveground biomass | 42.60 ± 6.89 | 153.10 ± 24.38 |
| Belowground biomass (roots) | 11.08 ± 1.79 | 39.81 ± 6.33 |
| Peat soil (up to mineral substratum) | 969.89 (a) | 1595.88 (b) |
| Total ecosystem | 1023.57 | 1788.79 |
The field and laboratory results are presented in Tab. 2 and Tab. S2 (Supplemenary material). The two experimental sites showed different peat soil profile characteristics. The forest peat soil profile revealed decomposed woody material below 75 cm with a parent material depth greater than 3.8 m, whereas the soil profile of the mixed crops site showed very little decomposing wood and a shallower depth (1.75 m). Fibric material was found in the mixed crops site but this material was not present in the forest site. Peat soils which are often cultivated with plantation crops or cash crops reduce in depth with cultivation time because of subsidence which is difficult to control even with good drainage system ([14], [13]).
Tab. 2 - Selected soil physical and chemical properties of mixed cropping and forest swamp plots. (BD): bulk density; (EC): electric conductivity; (BS): base saturation; (CEC): cation exchange capacity.
| Soil properties | Mixed crops (soil depth, cm) | Forest (soil depth, cm) | ||||||||||
|---|---|---|---|---|---|---|---|---|---|---|---|---|
| 0-12 | 12-38 | 38-85 | 85-175 | > 175 | 0-15 | 15-50 | 50-100 | 100-150 | 150-200 | 320-380 | > 380 | |
| pH | 3.87 | 3.86 | 3.87 | 3.9 | 2.88 | 3.16 | 3.18 | 3.63 | 3.34 | 3.87 | 3.58 | 3.27 |
| BD (g cm-3) | 0.24 | 0.12 | 0.47 | 0.85 | 1.08 | 0.19 | 0.16 | 0.17 | 0.18 | 0.23 | 0.49 | 0.98 |
| EC (ds m-1) | 1.5 | <0.1 | 1.3 | 2.1 | 16.5 | 3.8 | 2.3 | 1.6 | 1.4 | 1.5 | 15 | 24 |
| BS (%) | 56.62 | 10.77 | 36.52 | 18.41 | 193.36 | 33.98 | 46.01 | 7.11 | 33.56 | 169.44 | 49.83 | 110.04 |
| Organic C (%) | 30.28 | 25.51 | 23.56 | 3.71 | 3.4 | 31.56 | 31.67 | 31.81 | 32.22 | 30.68 | 10.96 | 7.12 |
| Total N (%) | 0.96 | 0.62 | 0.65 | 0.13 | 0.13 | 1.91 | 0.84 | 0.73 | 0.66 | 0.73 | 0.33 | 0.25 |
| C:N | 32 | 41 | 36 | 30 | 27 | 17 | 38 | 44 | 49 | 42 | 33 | 28 |
| Availaible P (mg kg-1) | 82 | 22 | 89 | 11 | 12 | 102 | 15 | 2 | 1 | 2 | 16 | 21 |
| CEC (cmol kg-1) | 1.2 | 5.8 | 2 | 7.3 | 18 | 2.5 | 1.4 | 1.8 | 1.8 | 1 | 36.2 | 26.9 |
| K (cmol kg-1) | 0.04 | 0.02 | 0.02 | 0.04 | 0.63 | 0.04 | 0.01 | 0.01 | 0.01 | 0.99 | 0.9 | 0.08 |
| Ca (cmol kg-1) | 0.48 | 0.47 | 0.56 | 0.78 | 5.1 | 0.63 | 0.52 | 0.01 | 0.51 | 0.54 | 2.3 | 9.76 |
| Mg (cmol kg-1) | 0.07 | 0.06 | 0.07 | 0.39 | 12.35 | 0.12 | 0.06 | 0.06 | 0.05 | 0.07 | 11.18 | 13.29 |
| Na (cmol kg-1) | 0.08 | 0.08 | 0.08 | 0.14 | 16.67 | 0.05 | 0.04 | 0.04 | 0.04 | 0.06 | 3.66 | 6.44 |
| Mn (mg kg-1) | 5.15 | 0.62 | 2.15 | 1.56 | 20.78 | 1.65 | 0.84 | 0.87 | 1.09 | 1.05 | 11 | 17.03 |
| Cu (mg kg-1) | 1.17 | 0.64 | 0.82 | 0.58 | 0.706 | 0.74 | 0.52 | 0.7 | 0.78 | 0.5 | 0.54 | 0.67 |
| Fe (mg kg-1) | 44.41 | 15.14 | 6.56 | 9.39 | 84.78 | 23.01 | 25.54 | 6.2 | 5.58 | 4.17 | 4.15 | 13.84 |
| Zn (mg kg-1) | 5.85 | 0.35 | 3.96 | 0.29 | 7.65 | 4.76 | 0.46 | 0.47 | 0.31 | 0.18 | 6.3 | 6.86 |
The pH (2.8-3.9) and bulk density (0.12-0.49) of the two experimental sites were relatively low (Tab. 1) although the values are typical of those peat soils. The low pH and bulk density of the two sites suggest that the soils of the two sites are acidic in addition to having a lower bearing capacity (Tab. 1). Carbon decreased with increasing soil depth. The soil CEC of the two sites decreased down the soil profile. The exchangeable bases (K, Ca, Mg, Na) of the two experimental sites were less than 1 cmol kg-1 except for the forest site depth of 320-380 cm, whose Ca, Mg, and Na were greater than 1 cmol kg-1. Trace elements (Mn, Cu, Fe, and Zn) were detected only in the top layer of the mixed crop site. The soil pH, bulk density, and C values were consistent with those reported in the Soil Survey Staff ([38]). The CEC values of peat soils are generally greater than 10 cmol kg-1 ([32], [33]) but those reported in the present study were lower because of the lower exchangeable bases. The ECs of the two peat soils were higher compared with those reported by Girkin et al. ([10]) and Ishikura et al. ([15]) for Panama peatlands (0.014 dS m-1) and Central Kalimantan, Indonesia peatlands (0.010 -0.171 dS m-1), respectively. This observation is related to the differences in precipitation, ground water levels, colonisation of the mangroves during the Holocene ([7]), and sulfidic marine clay parent material (Tab. S2 in Supplementary material).
The ecosystem C stocks (biomass and peat soil up to the mineral substratum) were 1023.57 and 1788.79 Mg C ha-1 (Tab. 2) for mixed crops and forest site, respectively. The ecosystem C stocks in the swamp forest was relatively higher (74%) compared to the mixed crops site. The ecosystem C distribution was in the order of the soil C in the peat (89-95%), followed by aboveground (4-8%), and belowground biomass (1-2%). The soil C in the forest plot was higher than in the mixed crop site clearly due to the differences in the soil depths of these sites. The forest C stocks are comparable to those reported for uncultivated peatlands ([31], [33]).
In the present study, we determined the changes in environmental parameters between sites at different sampling periods to understand the factors affecting soil carbon dioxide fluxes (Tab. 3). The soil fluxes, relative humidity, and soil temperature were significantly different across sampling time. The fluxes in the forest site were significantly different (p = 0.019) but the difference at the mixed crops site was significantly higher (p ≤ 0.001). The relative humidity (p ≤ 0.001) and ground water levels (p = 0.006) at the two experimental sites varied significantly. Relative humidity is controlled by environmental factors such as air temperature and moisture (Fig. S2 in Supplementary material). The ground water levels of both sites were controlled by rainfall and canal control gauge (Tab. 4). Soil bulk density (p = 0.014) and water filled pore space (p = 0.007) were significantly different in the forest plot.
Tab. 3 - P-value for differences among different sampling intervals in mixed crops and forest swamp sites using ANOVA or Kruskall-Wallis tests. (BD): bulk density; (T): temperature; (RH): relative humidity; (WFPS): water filled pore space; (GWL): ground water level.
| Variable | Mixed crops | Forest |
|---|---|---|
| Soil Flux | 0.019 | <0.001 |
| Soil BD | 0.573 | 0.014 |
| RH | <0.0004 | <0.0001 |
| Soil T | 0.014 | 0.014 |
| WFPS | 0.563 | 0.007 |
| GWL | 0.006 | 0.006 |
Tab. 4 - Correlations among selected soil properties and climatic parameters for mixed crops site. (Soil T): Soil temperature; (RH): Relative humidity; (WFPS): water filled pore space; (GWL): ground water level; (*): p < 0.05; (**): p < 0.01; (***): p < 0.001.
| Variable | Soil T | RH | Rainfall | WFPS | GWL |
|---|---|---|---|---|---|
| Soil Flux | -0.158 | -0.262* | 0.092 | -0.172 | -0.198 |
| Soil T | - | -0.004 | -0.113 | -0.139 | -0.139 |
| RH | - | - | -0.122 | -0.042 | 0.419* |
| Rainfall | - | - | - | -0.186 | -0.557*** |
| WFPS | - | - | - | - | -0.470** |
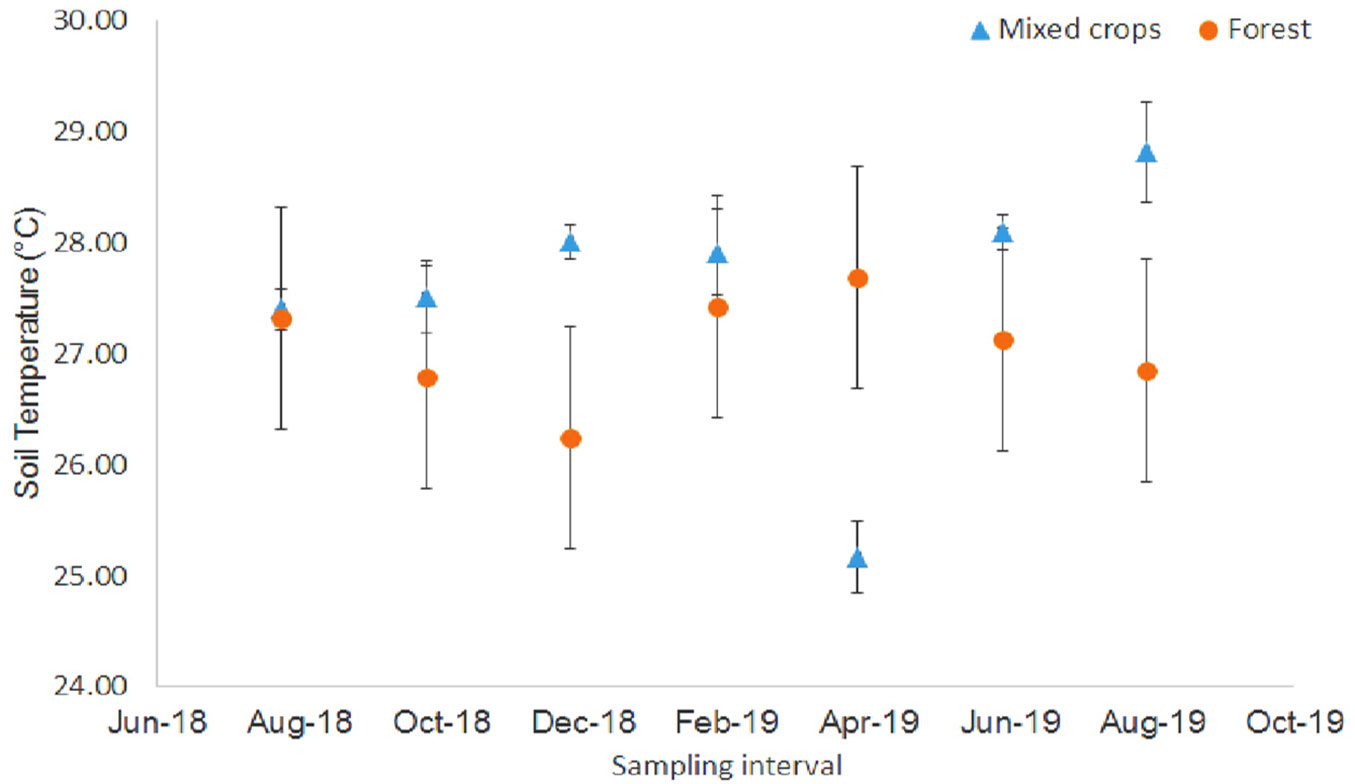
The soil CO2 fluxes (Rs) were significantly different. In the forest plot, higher fluxes (559.15-834.77 mg CO2 m-2 h-1) occurred from February 2019 to August 2019 (Fig. 1). For the mixed crops plot, the Rs were significantly different but higher fluxes were recorded in December 2018 (495.79 mg CO2 m-2 h-1) and April 2019 (589.24 mg CO2 m-2 h-1). There were differences in the soil temperature and the forest plot showed lower values (Fig. 2). In December 2018, there was a significant soil temperature change (Fig. 2). The highest soil temperature was recorded in April 2019 (27.69 °C) for forest plot and in August 2019 (28.81 °C) for the mixed crops plot.
Fig. 1 - Soil carbon dioxide fluxes in at study site (August 2018 - August 2019). Vertical bars denote standard error (n = 8).
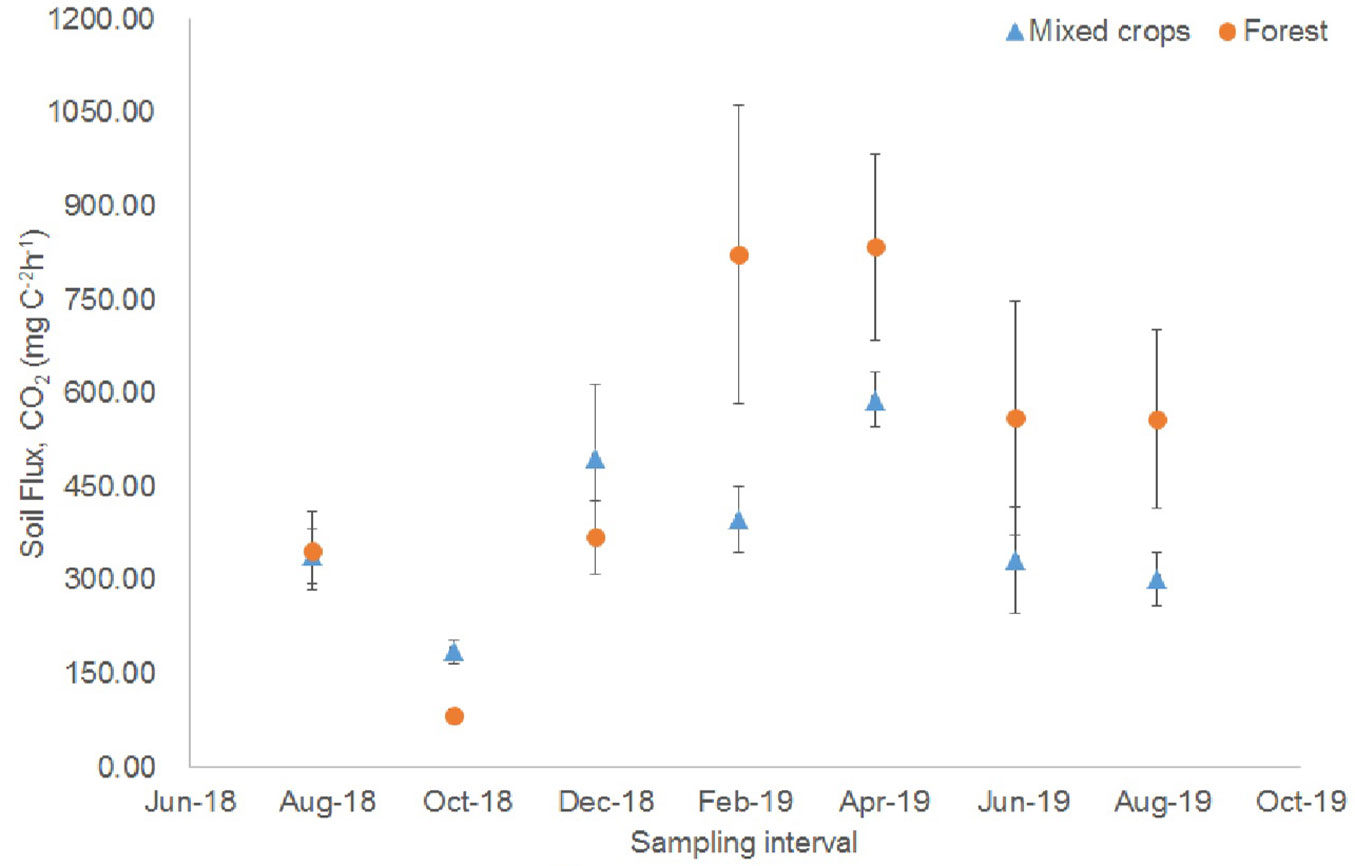
Fig. 2 - Soil temperature at study site (August 2018 - August 2019). Vertical bars denote standard error (n = 8).
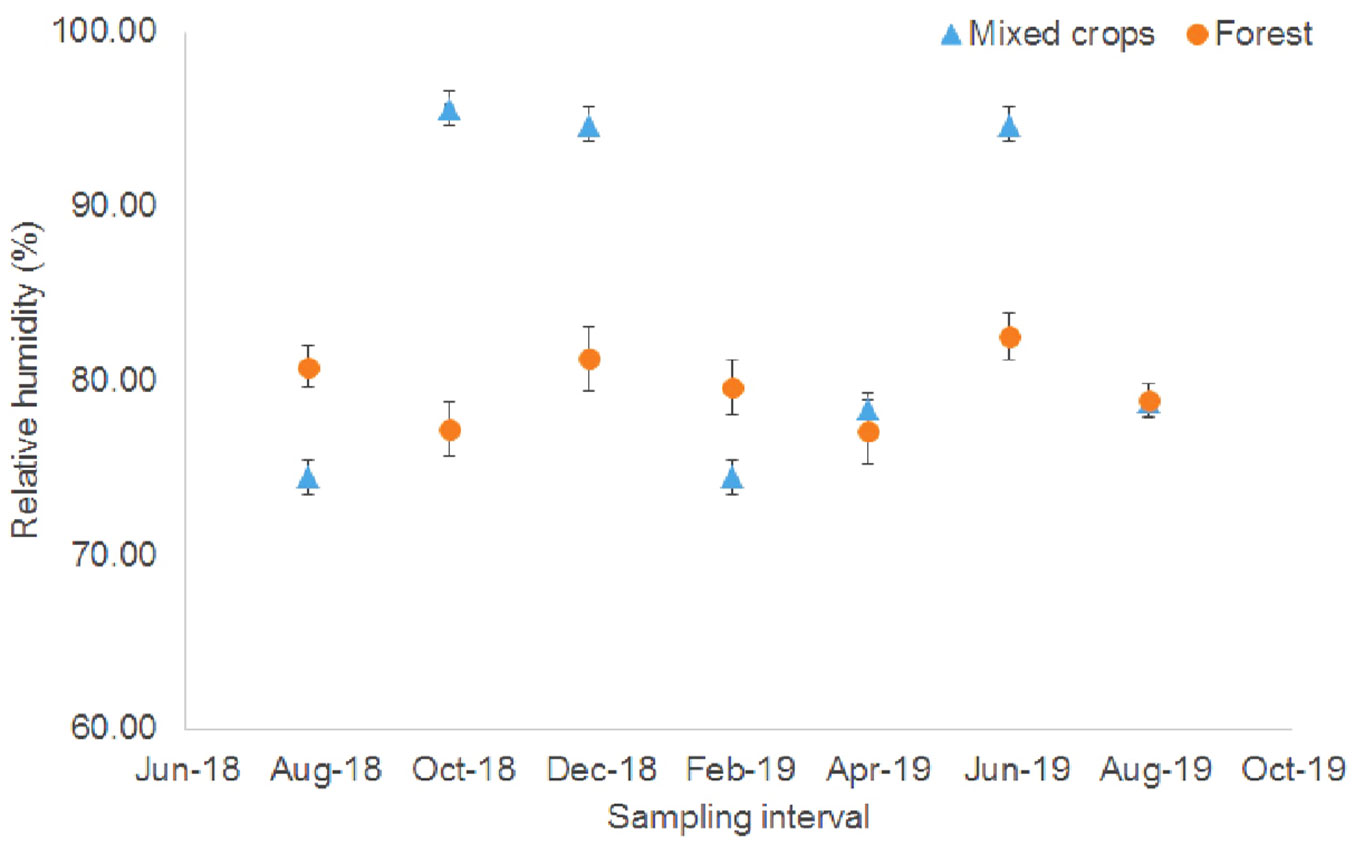
The experimental sites had different relative humidity and difference was prominent in the mixed crops plot (Fig. 3) because the relative humidity fluctuated between 74.46% and 95.63%. Higher relative humidity values were observed from October to December 2018 and in June 2019. However, in the forest plot the relative humidity was relatively stable (77.06%-82.51%). The relative humidity values for the mixed crops plot from October to December 2018 and in June 2019 were higher because of microclimate effects.
Fig. 3 - Relative humidity at the study site (August 2018 - August 2019). Vertical bars denote standard error (n = 6).
The changes in soil CO2 fluxes, soil temperature, and relative humidity could be related to rainfall, ground water level, and air temperature patterns because for example, during the dry period, soil CO2 emission was high in the forest site and the opposite was true in the wet season. The CO2 emission during the dry season was due to high temperature and oxidative peat decomposition ([14], [6]). High temperature lowers water table and causes rapid peat soil decomposition. This observation compares with those of Girkin et al. ([10]) and Lee et al. ([20]). In the mixed crops site, the higher soil CO2 in December 2018 and April 2019 could be ascribed to the higher relative humidity (October and December 2018) and agricultural activities such as fertilization and clearing. High humidity, land clearing, and fertilization favour microbial activities of microorganisms to enhanced soil respiration ([21], [18]). Thus, land management strategies drive changes in CO2 emissions in cultivated land.
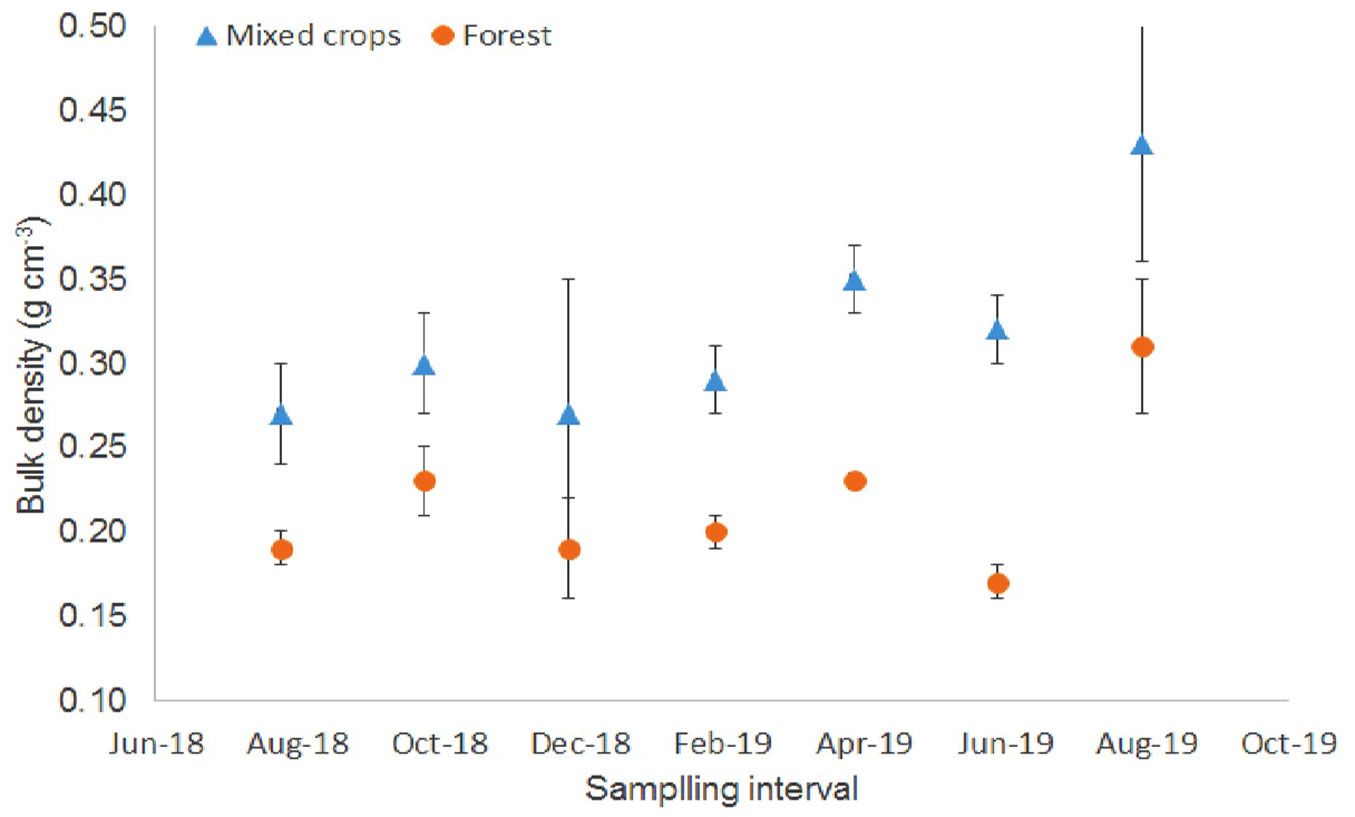
Only bulk density values (0.17-0.23 g cm-3) of the forest plot were significantly different (Fig. 4). The bulk density values were similar to those of an adjacent tropical peat swamp forest in North Selangor Peat Swamp Forest ([7]).
Fig. 4 - Peat bulk density values at the study site (August 2018 - August 2019). Vertical bars denote standard error (n = 4).
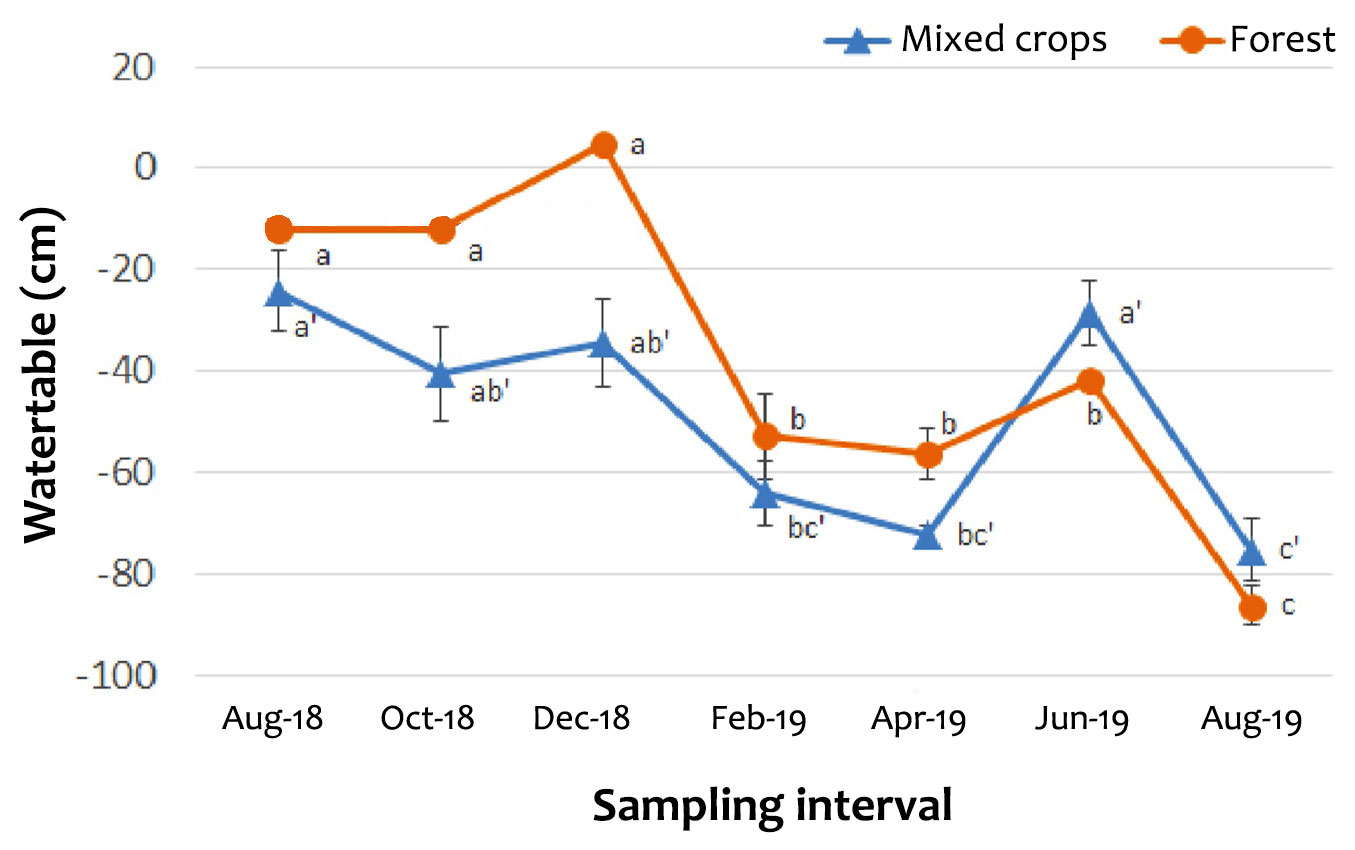
The values of WFPS were relatively lower in the mixed crops plot than in the forest plot (Fig. S3 in Supplementary material). In the forest plot, WFPS was generally greater than 75% (Fig. S3). Regardless of time of sampling, the GWL of the forest plot was relatively higher compared with the mixed crops plot (Fig. 5). The GWL remained high from August to December 2018 but it decreased from February to April 2019, except in June 2019 (Fig. 5). The changes in the GWL in the two sites are related to the rainfall patterns and control of water flow through the canals built by the Forestry Department of Malaysia. The canals were constructed not only for prevention of peat fires but to also reduce peat oxidation and subsidence ([25]). For oil palm plantations, a range of -40 to -60 cm is recommended for maintaining the water table ([31], [17]). This is the standard set by the Roundtable on Sustainable Palm Oil (RSPO) to minimize peat soil and carbon loss. Unlike the oil palm plantations, the cultivated peat soils with other crops (for example, mixed farming) are not restricted to the RSPO standard because water table fluctuations is driven by GHG such as methane (CH4 - [7]), temporal variation, climate or manual control of water flow. In such situations water table fluctuations within +10 to -80 cm occur; for example the -80 cm which was recorded in August 2019 (dry period) in the forest plot.
Fig. 5 - Ground water level at the study site (August 2018 - August 2019). Vertical bars denote standard error (n = 4). Individual points labelled with the same letters are not significantly different (p>0.05) according to SNK test.
In the mixed crop plots, there was a significant correlation between relative humidity and soil fluxes (Tab. 5). Ground water levels significantly correlated with relative humidity, rainfall, and water filled pore space. However in the forest plot, soil fluxes, relative humidity, rainfall, and ground water level significantly correlated with soil temperature. For the forest plot, water filled pore space correlated with relative humidity and ground water level.
Tab. 5 - Correlations among selected soil properties and climatic parameters for forest swamp site. (Soil T): Soil Temperature; (RH): Relative humidity; (WFPS): Water filled pore space; (GWL): Ground water table; (*): p < 0.05; (**): p < 0.01; (***): p < 0.001.
| Variable | Soil T | RH | Rainfall | WFPS | GWL |
|---|---|---|---|---|---|
| Soil Flux | -0.312* | -0.200 | 0.280 | 0.031 | -0.380 |
| Soil T | - | -0.354** | -0.033** | -0.071 | -0.506*** |
| RH | - | - | -0.227 | -0.366** | 0.616 |
| Rainfall | - | - | - | -0.069 | -0.300 |
| WFPS | - | - | - | - | -0.499*** |
The mixed crops plot data (Tab. 5) suggest that rainfall had significant influence on groundwater levels and WFPS. Environmental factors controlling temporal variations in soil fluxes, WFPS, and GWL in forests are soil temperature, relative humidity, and rainfall. Factors such as other GHGs (methane and nitrous oxide), microbial respiration and peat subsidence ([7], [18], [25]), though playing important roles, were not extensively explored here. Although the two sites showed some similarities, the climatic conditions at the forest plot were more diverse because of the spatial variability of species, microclimate, peat depth, organic debris, and microbial biomass ([2], [13], [20]).
Oil palm cultivation on peats emits 19 to 94 tCO2 ha-1 year-1 ([31], [13], [7]). Most peat swamp forests emit CO2 between 13.33 to 86.0 tCO2 ha-1 year-1 ([14], [12], [15], [10]). The emissions of 7.20 to 73.13 tCO2 ha-1 year-1 from the peat forest plot were lower, and this was due to the microclimate of the plot and the strict monitoring of the entire peat swamp forest by the Forest Department of Malaysia. For mixed farming (pineapple, cassava, rice, and soybean) 19.3 to 176.6 tCO2 year-1 had been reported ([14], [25], [6]). This emission is higher than the range (26.50 to 43.43 tCO2 ha-1 year-1) recorded in this present study, suggesting practicing mixed farming on peat soils could minimize CO2, as mixed farming since 1988 to date might have caused soil C stabilization in the long run.
Our findings suggest that management of tropical peatlands by the Forestry State Department of Malaysia and farmers who cultivated peat soils in Malaysia is essential, especially when land is scarce and peat land transitions to agricultural cash crops such as banana and pineapple is inevitable as an option for food security and income for farmers. The way forwards for good management practices of peatlands include control of water table levels during droughts, early warning system for fire occurrence, constant monitoring, and awareness of environmental variables to reduce peat subsidence and soil respirations that encourages carbon dioxide fluxes. For example, cash crop farmers can be advised to maintain water table at -40 to -60 cm, minimize synthetic fertilizers and promote biofertilizers that may lower CO2 emissions and promote agroforestry models with native peatland timber species with crops. The outcomes of this work could contribute to sustainable management of peatlands particularly, for cultivated peatlands.
Conclusion
There were no extreme differences in the peat physical and chemical properties in the mixed crops plot as compared to forest plot, except for shallower peat depth due to subsidence as well as lower C pools due to biomass differences in the mixed crop plots, implying that land use change influences peat depth and characteristics. Future research should elucidate the minimum water table requirements for cash crop cultivation and forests that may allow sustainable farming and forest protection by minimizing peat loss. Relative humidity, soil temperature, and ground water levels had significant effect on soil carbon dioxide fluxes in peat swamp forest and mixed cropping sites. Soil fluxes were significantly higher in the dry season compared with the wet season for the forest plot and the opposite was true for the mixed crop plots. This study further shows how droughts can severely influence CO2 emissions and the need to introduce management strategies, such as ground cover or fast growing native peat swamp species with the inclusion of water management measures, to reduce CO2 emissions. Long term research should also capture contributions of microbial population and processes related to carbon and root respiration in different sites with varying vegetation cover. Ground water levels correlated with rainfall, water filled pore space, and relative humidity. At the mixed cropping site, soil carbon dioxide fluxes correlated with relative humidity whereas for the forest site, soil temperature correlated with relative humidity, rainfall, ground water level, and soil carbon dioxide fluxes. Long term understanding of temporal changes of tropical peatlands with varying land use is crucial to predict regional carbon balance model and pave the way to sustainable mitigation measures for climate adaptation.
Acknowledgements
We are indebted to the Forestry Department of Selangor for providing the research funds and other assistance related to this research. We are also grateful to the personnel of the Global Environment Facility (GEF) for providing basic information on the experimental sites. The staff of Forest Research Institute of Malaysia (FRIM) are acknowledged for the field and laboratory assistance rendered.
References
Gscholar
Gscholar
Gscholar
Gscholar
Gscholar
Gscholar
Gscholar
Gscholar
Gscholar
Gscholar
Gscholar
Authors’ Info
Authors’ Affiliation
Mohammad Fakhri Ishak
Ismail Parlan
Hamdan Omar 0000-0002-8565-1122
Marryanna Lion 0000-0001-8182-7752
Mohd Ghazali Hassan
Forest Research Institute Malaysia - FRIM, 52109 Kepong, Selangor Darul Ehsan (Malaysia)
Faculty of Agriculture and Forestry, UPM Bintulu, Sarawak, P.O. Box 396, Jalan Nyabau, 97008 Bintulu, Sarawak (Malaysia)
Institut Ekosains Borneo, UPM Bintulu, Sarawak, P.O. Box 396, Jalan Nyabau, 97008 Bintulu, Sarawak (Malaysia)
Abdul Khalim Abu Samah
Forestry Department of Peninsular Malaysia, Jalan Sultan Salahuddin, 50660 Kuala Lumpur (Malaysia)
Corresponding author
Paper Info
Citation
Vijayanathan J, Ishak MF, Parlan I, Omar H, Osumanu Haruna A, Lion M, Hassan MG, Jong RM, Samah AKA (2021). Temporal patterns control carbon balance in forest and agricultural tropical peatlands in North Selangor, Malaysia. iForest 14: 362-369. - doi: 10.3832/ifor3700-014
Academic Editor
Giorgio Alberti
Paper history
Received: Nov 19, 2020
Accepted: Jun 06, 2021
First online: Aug 10, 2021
Publication Date: Aug 31, 2021
Publication Time: 2.17 months
Copyright Information
© SISEF - The Italian Society of Silviculture and Forest Ecology 2021
Open Access
This article is distributed under the terms of the Creative Commons Attribution-Non Commercial 4.0 International (https://creativecommons.org/licenses/by-nc/4.0/), which permits unrestricted use, distribution, and reproduction in any medium, provided you give appropriate credit to the original author(s) and the source, provide a link to the Creative Commons license, and indicate if changes were made.

Web Metrics
Breakdown by View Type
Article Usage
Total Article Views: 37633
(from publication date up to now)
Breakdown by View Type
HTML Page Views: 30995
Abstract Page Views: 3427
PDF Downloads: 2548
Citation/Reference Downloads: 4
XML Downloads: 659
Web Metrics
Days since publication: 1782
Overall contacts: 37633
Avg. contacts per week: 147.83
Article Citations
Article citations are based on data periodically collected from the Clarivate Web of Science web site
(last update: Mar 2025)
Total number of cites (since 2021): 4
Average cites per year: 0.67
Publication Metrics
by Dimensions ©
Articles citing this article
List of the papers citing this article based on CrossRef Cited-by.
Related Contents
iForest Similar Articles
Research Articles
Estimating changes in soil organic carbon storage due to land use changes using a modified calculation method
vol. 8, pp. 45-52 (online: 17 June 2014)
Research Articles
Carbon storage in degraded cork oak (Quercus suber) forests on flat lowlands in Morocco
vol. 9, pp. 125-137 (online: 08 August 2015)
Research Articles
Effects of traditional forest management on carbon storage in a Mediterranean holm oak (Quercus ilex L.) coppice
vol. 11, pp. 344-351 (online: 18 April 2018)
Research Articles
Carbon storage and soil property changes following afforestation in mountain ecosystems of the Western Rhodopes, Bulgaria
vol. 9, pp. 626-634 (online: 06 May 2016)
Research Articles
Soil stoichiometry modulates effects of shrub encroachment on soil carbon concentration and stock in a subalpine grassland
vol. 13, pp. 65-72 (online: 07 February 2020)
Research Articles
Potential relationships of selected abiotic variables, chemical elements and stand characteristics with soil organic carbon in spruce and beech stands
vol. 14, pp. 320-328 (online: 09 July 2021)
Review Papers
Comparative assessment for biogenic carbon accounting methods in carbon footprint of products: a review study for construction materials based on forest products
vol. 10, pp. 815-823 (online: 25 September 2017)
Research Articles
Exploring machine learning modeling approaches for biomass and carbon dioxide weight estimation in Lebanon cedar trees
vol. 17, pp. 19-28 (online: 12 February 2024)
Research Articles
Impacts of stump harvesting on carbon dioxide, methane and nitrous oxide fluxes
vol. 15, pp. 148-162 (online: 07 May 2022)
Research Articles
Factors of soil CO2 emission in boreal forests: evidence from Central Siberia
vol. 16, pp. 86-94 (online: 19 March 2023)
iForest Database Search
Search By Author
Search By Keyword
Google Scholar Search
Citing Articles
Search By Author
Search By Keywords
PubMed Search
Search By Author
Search By Keyword


