
Revealing the physiological basis of forester’s choice of poplar clones (Populus spp.)
iForest - Biogeosciences and Forestry, Volume 17, Issue 3, Pages 156-164 (2024)
doi: https://doi.org/10.3832/ifor4433-017
Published: Jun 14, 2024 - Copyright © 2024 SISEF
Research Articles
Abstract
Poplar plantations cover 31.4 million ha around the world and supply timber for paper, sawn wood and other wood-based products. In each region where poplars are planted, it is possible to identify “model clones” which are massively adopted by foresters. Improving the rationale of clone selection in breeding programs requires a comprehensive understanding of the physiological traits that explain the differences in genotypes growth. Moreover, given that growth is related to the use of resources (water, light and nutrients) we also need to determine which morphological and physiological traits explain the model condition of most widespread clones. A controlled-condition study was carried out to evaluate eight Populus deltoides and two Populus × canadensis clones, including the model Populus deltoides €˜Australiano 129/60’. For each clone, physiological and morphological traits related to biomass partitioning (roots, stem and leaf dry mass), growth (height, diameter), light use (leaf area duration, leaf size, net photosynthetic rate), water use (stem hydraulic conductivity, water consumption) and nutrient use (nitrogen and phosphorus concentrations) were measured. High variability in the physiology and morphology was observed among clones, and similar and contrasting clones in relation to the model clone were identified. Similarities among clones varied depending on the characteristic being evaluated at the time-water use, light use or nutrient use. The results showed that variability not only relates to visible phenotype, but also to functionality. This information is significant since the breeding programs can evaluate non-traditional traits and select genotypes which are similar or complementary to the model clone. The characterization of model clones is key for breeding programs which seek new candidates taking into account the use of water, nutrients and light. It is also important because it helps explain why foresters prefer one clone over others. Knowledge about functional variability within clones of the same species enables foresters to conduct more intelligent and site-specific silviculture and to optimize the genotype selection in breeding programs.
Keywords
Salicaceae, Physiology, Functional Traits, Model Clones, Breeding Program
Introduction
Fast-growing species have been planted around the world to satisfy wood demand and provide a wide variety of goods and services for society. Populus species (poplars) have been extensively cultivated due to their growth performance, easy vegetative propagation and wood properties ([14]). Poplar plantations cover 31.4 million ha that supply timber for paper, sawn wood and other wood-based products ([39]). In general, the stands are monoclonal, and different clones or genotypes are used in the same region. Depending on the region, it is possible to identify several “model clones” which are massively adopted by foresters because they acclimate well to the frequent stresses in the area. Understanding the characteristics of the most chosen clones is essential for selecting other clones with similar performance, thereby enabling foresters to develop a more genetically diversified area. Genetic diversity is needed to reduce the risk of massive losses due to new biotic or abiotic stresses ([5]).
One of the most important traits when choosing clones to be planted is growth rate, which is usually positively related to photosynthesis ([8]). The characteristics of leaves, such as size and thickness, can affect growth ([29]), and the leaf nitrogen content is another relevant trait that affects photosynthetic rate ([40]). However, high photosynthetic capacity does not necessarily determine a high stem growth rate, since it is also affected by dry mass partitioning, environmental conditions, competition and diseases. It is noteworthy that wide variability in leaf traits was reported in poplars, in photosynthetic capacity and foliar morphology ([30], [1], [23]). Plant nutrient contents are also significant as to stand nutrient cycling ([17]). Differences in tissue concentrations are decisive to identify genotypes with variable nutrient cycling ([27]), such as distinct retranslocation rate or nutrient use ([13]). Furthermore, total leaf area and leaf nitrogen content are good predictors for identifying high-yielding and water-use efficient clones ([33]).
The origin of the genotypes is another attribute that can influence growth-related variables given that it defines dry mass partitioning ([47]), and phenology like the dates of the beginning and end of bud burst and autumn senescence ([36], [3]). Plant allometry can be important to define the growth patterns of trees ([45], [16]). For example, a high allocation to roots can be found in genotypes selected from dry environments ([31]), because wide roots improve the ability to explore the soil and to take up water during dry lapses. In shoot partitioning, a major proportion of leaves increases light interception capacity, resulting in a higher relative growth rate ([7]). Furthermore, in deciduous trees, both the beginning and the end of photosynthetic activity are important with respect to nutrient mobilization. The nutrients move from storage organs like roots and stems to buds during earlier spring ([32]) and retranslocate from foliage to stems and roots during the end of summer ([28]). Hence, it is possible to find variability in the use of nutrients in spatial (i.e., soil exploration, crown formation, storage size) and temporal scales (i.e., bud burst and foliar abscission dates).
When selecting clones, it is desirable to choose genotypes with high productivity and high water use efficiency, as both traits are not necessarily linked ([34], [44]). Moreover, genotypes can have different hydraulic architecture if their stems, leaves and roots have different conductivity. Thus, differences in hydraulic architecture could determine distinct water consumption ([19]) and yield, due to the positive relationship between hydraulic conductivity and growth ([20]). High intraspecific variability in poplars’ hydraulic traits was observed between genotypes that belong to the same species ([15]). Therefore, analyzing the relationship between water use and growth is of utmost relevance.
In Argentina, in the Delta del Río Paraná (Delta), Salicaceae forest plantations (Populus spp. and Salix spp.) cover 83.000 ha and represent the main productive activity of the region ([26]). Populus deltoides and Populus × canadensis hybrids are the predominant species, but the clone Populus deltoides ’Australiano 129/60’ (A129) is the most chosen genotype among poplar plantations. This clone is high-yielding and one of the most stable when it grows under different environmental conditions ([2]) because abiotic stresses, like drought, flooding and salinity, are frequent in this region ([22], [26], [2]). A129 could be considered a “model clone” due to its yield stability and prevalence in poplar plantations. This situation can be comparable to the expansion of Populus × canadensis ’I-214’ among Italian and Spanish plantations ([4], [35]). In contrast, Argentinian foresters have discarded some clones in the last few years, due to their low yield or disease outbreaks that affected several areas ([5]). This situation is likely to be found in other regions where poplars are cultivated, so it is interesting to analyze the relationship between clone predominance in a region and resource use.
To understand why foresters chose a given clone, we need to know what are the physiological traits that explain the differences in genotypes’ growth and use of resources (water, light and nutrients) in order to determine which traits explain the model condition of most widespread clones. The high variability described for poplars at both morphological and physiological traits ([1], [11], [38], [13]), probably relates to different ecophysiological strategies among clones. If we can describe and compare the ecophysiological traits of the model clones, we will be able to select new genotypes with similar potential to the most selected clones which will be more likely adopted by foresters. Hence, the aim of this work is to evaluate the use of light, water and nutrients of new genotypes from a breeding program and to compare them with old clones. A controlled-condition study was carried out by describing interclonal diversity ([33]) and making clonal-level comparisons. Our goals are to assess the variability between clones in the use of light, water and nutrients, and to identify traits that can define the “model” condition of genotypes. This information will contribute to understand the empirical perceptions of foresters about genotype performances in the field.
Materials and methods
Site conditions and plant material
The experiment was carried out at the facilities of Estación Experimental Agropecuaria Delta del Paraná (INTA), in Campana, Provincia de Buenos Aires, Argentina (34° 10′ 34″ S, 58° 51′ 48″ W). Mean annual rainfall is 1019 mm, evenly distributed throughout the year, and mean annual temperature is 16.5 °C. Eight Populus deltoides clones (P. deltoides ’Australiano 129/60’, P. deltoides ’Carabelas INTA’, P. deltoides ’Guayracá INTA’, P. deltoides ’Hovyú INTA’, P. deltoides ’Nandi INTA’, P. deltoides ’Ñacurutú INTA’, P. deltoides ’Paycarabí INTA’, P. deltoides ’Pytá INTA’) and two Populus × canadensis clones (P. deltoides ’Ragonese 22 INTA’, P. × canadensis ’Triplo’) were used in the experiment. The model (Populus deltoides ’Australiano 129/60’) and non-model (Populus × canadensis ’Triplo’) clones were included (Tab. 1). Clones were planted outdoors in August 2017 in 20 L pots filled with soil collected in areas normally used to establish poplar plantations. The soil is silt loam, and the chemical characteristics are described in Tab. S1 (Supplementary material). Thirty-cm one-year-old cuttings of each clone were planted up to half their length, one plant per pot. We planted 20 cuttings of each clone (n=200); pots were randomly distributed and mixed frequently during the experiment. Two months after planting, trees were pruned to leave a single stem. Plants were maintained free of diseases and pots were watered periodically to keep the soil at field capacity. The experiment was divided into two samplings: summer (December 2017) and winter (July 2018). The list of all the variables measured, their abbreviations and units are shown in Tab. S2 (Supplementary material).
Tab. 1 - Summary of information about genotypes used in the experiment. Abbr.: is the abbreviation used to identify each clone. Sex: masculine (M) and female (F). Parents: identification of mother and father if known; Sm, Op: selected mother, open pollinization. Year: the year when clones began to be large-scale planted in the Delta del Río Paraná. Diffusion: present expansion degree of each genotype among plantations. Class.: clones that have been available for more than 10 years were classified “old”; clones that have been available for less than 10 years were classified as “new”. These data were compiled from the INTA database, meeting with forest growers and information reported by Fossati et al. ([18]) and Luquez et al. ([26]).
| Full name | Abbr. | Sex | Parents | Year | Diffusion | Class. |
|---|---|---|---|---|---|---|
| P. deltoides ’Australiano 129/60’ | A129 | F | Sm, Op | 90’s | High | Old |
| P. deltoides ’Carabelas INTA’ | CAR | M | Sm, Op | 2008 | Medium | Old |
| P. deltoides ’Guayracá INTA’ | GUA | M | Sm, Op | 2015 | Medium | New |
| P. deltoides ’Hovyú INTA’ | HOV | F | Sm, Op | 2016 | Medium | New |
| P. deltoides ’Nandi INTA’ | NAN | F | Sm, Op | 2017 | Medium | New |
| P. deltoides ’Ñacurutú INTA’ | ÑAC | F | Sm, Op | 2015 | Medium | New |
| P. deltoides ’Paycarabí INTA’ | PAY | F | Sm, Op | 2016 | Medium | New |
| P. deltoides ’Pyta INTA’ | PYT | M | Sm, Op | 2017 | Medium | New |
| P. × canadensis ’Ragonese 22 INTA’ | R22 | M | A129, P. nigra var. Italica | 90’s | Medium | Old |
| P. × canadensis ’Triplo’ | TRI | M | P. deltoides ’51-078’, P. × canadensis ’I-154’ | 90’s | Low | Old |
Growth measurements
Eight plants of each clone were sampled in summer (December) and the remaining 12 continued growing and were harvested in winter (July). In summer, total biomass was divided into 3 compartments: stem (STEM), leaves (LEAF) and roots (ROOT); while in winter plants had only stem and roots. All the biomass was dried at 60 °C (up to constant weight). Total dry weight (TOTALdw, g), dry weight of each compartment (STEMdw, LEAFdw, ROOTdw, g) and STEMdw/ROOTdw ratio were obtained. The total height (H, m) and collar diameter (CD, mm) of every plant was measured for both samplings.
Light use measurements
Bud burst date was registered for every plant, and the last leaf abscission date was registered in those trees that completed the growing season. With this information, the growing season duration was determined as “days with leaves” (Ldays).
For the summer sampling, five fully expanded leaves of eight plants per clone (n = 40) were collected. Leaf size (Lsize, cm2) was determined on digital photographs of each leaf and processed with the software ImageTool v. 1.28 CMEIAS (University of Texas, Texas, USA). After that, leaves were dried at 60 °C up to constant weight. The specific leaf area (SLA, cm2 g-1) was obtained as the ratio between leaf size and dry weight of the five leaves of each clone. Plant leaf area (LA, cm2) was calculated as LA (cm2) = SLA (cm2 g-1) · LEAFdw (g).
At the end of the growing season, leaf area duration (LAD, m2 day) was calculated as the function between LA and days. To determine LAD, bud burst and abscission dates were considered as the beginning and the end of the period respectively. At these moments LA was zero. Then, four LA values were obtained during the growing season. In December, LA was calculated as described in the previous paragraph (destructive sampling), whereas in November, March and April LA was calculated as the number of leaves multiplied by the mean Lsize of each clone. The mean LA of each date was graphed across the days. LAD corresponds to the area under the curve.
In December 2017, light-saturated photosynthetic rate (Asat, μmol CO2 m-2 s-1), stomatal conductance (gs, mmol m-2 s-1) and intrinsic water use efficiency (WUEi, mmol CO2 µmol-1 H2O) were measured in top full expanded leaves of 5 plants per clone. An Infrared Gas Analyser (IRGA -Ciras 2, PPSystem, Amesbury, USA) was used. The leaf chamber was set at 25 °C, 1500 μmol m-2 s-1 of photosynthetic photon flux density (PPFD) and 360 ppm of CO2.
Water use measurements
Water consumption was determined in five plants per clone at three different moments across the growing season: November 2017 (small plants), March 2018 (large plants) and April 2018 (senescence beginning). Plants were watered until field capacity and pots were covered with bags to reduce direct evaporation from the soil. They were weighed with a 0.1 kg precision balance to obtain the initial weight (W1). Then, they were kept without watering for 72 hours (t). After this period, every plant was weighted again to obtain the final weight (W2). Hourly water consumption (WCh, kg h-1) was estimated as follows: WCh (kg h-1) = (W1 - W2) / t (h).
WCh was graphed across the days, and accumulated water consumption (WC, kg) throughout the growing season was defined as the area under the curve. Bulk water use efficiency (WUEb) was defined as WUEb = WC / STEMdw+ROOTdw (winter sampling). Then, WC was related to STEMdw to define stem production water-use efficiency (STEMdw/WC). ROOTdw was also related to WC to obtain an index of water uptake efficiency of the root system (WC/ROOTdw).
Stem hydraulic conductivity (kh) was determined with a multichannel perfusor for every sampled plant at both samplings times. About 14 cm length stems were used for the measurements. Every stem piece was taken 5 cm above the insertion and cut under water to prevent the formation of new embolisms by air entry. The determinations were done with distilled water and under a 0.0098 MPa pressure gradient (ΔP) generated by a 1 m water column. Stems were connected to the perfusor using teflon tape film to prevent water leaks. Water collected during one minute was weighted. Finally, kh was estimated as kh (g cm s-1 MPa-1) = Q L ΔP-1 where L is stem piece length, Q is the amount of water that crosses through the stem per unit of time, and ΔP is the pressure gradient between the ends of the system. Then, kh was divided by the cross-sectional area (XA, cm2) to calculate specific hydraulic conductivity (ks, g cm-1 s-1 MPa-1) as ks = kh / XA, and by LA to calculate leaf specific conductivity (kl, g cm-1 s-1 MPa-1) as kl = kh / LA. To estimate the conductive XA of the stem, the barkless diameter was measured at two perpendicular positions. The mean value was registered and the pith diameter was not included in the estimation because water is not conducted by the pith and it could be relevant for annual stems.
Nutrient use measurements
Three composed samples per clone were performed for each compartment (stem, leaves and roots). Each sample included material from four individuals of the same clone. Nitrogen (N) concentrations were measured with the semi-micro Kjeldahl method and phosphorus (P) concentrations, by induced plasma emission spectroscopy, and were identified as follows: stem N concentration (Ns, %), leaf N concentration (Nl, %), root N concentration (Nr, %), stem P concentration (Ps, ppm), leaf P concentration (Pl, ppm) and root P concentration (Pr, ppm). The samples were collected in summer and winter at the same time as biomass sampling for growth measurements. Before the end of the growing season, senescent leaves were collected to be included in the analyses. The concentrations of each compartment were multiplied by the respective dry weight to obtain P and N contents. Total P content (Pc, g) and total N content (Nc, g) were calculated as the sum of compartment’s content. At the winter sampling, as trees had no leaves, only stem and roots compartments were considered. Only for winter sampling, nitrogen use efficiency (NUE) and phosphorus use efficiencies (PUE) were calculated for each plant as: NUE = TOTALdw (g) / Nc (g); PUE = TOTALdw (g) / Pc (g). Then, an index of the N and P efficiencies to produce stem biomass was estimated. N stem production efficiency (Nspe) and P stem production efficiency (Pspe) was calculated as: Nspe = STEMdw / Nc; Pspe = STEMdw / Pc.
Statistical analysis
Data underwent analysis of variance (one way ANOVA), with the clone considered as the main factor. For variables measured in winter and summer, each season was analyzed separately. After that, summer vs. winter was compared for each clone separately. When the effect clone was significant (p ≤ 0.05), the means were compared using Tukey test.
Cluster analyses (hierarchical method, Euclidean distance) were carried out from an n x p matrix (n: ten clones; p: mean of each variable). Four clusters were performed: morphology, light use, water use and nutrient use. Some variables can be repeated among clusters. Only variables with significant differences (p < 0.05) were included. The cluster analysis of morphology was run with the following variables: STEMdw (winter), LEAFdw (summer) and ROOTdw (winter); STEMdw/ROOTdw (winter); H and CD (winter); LA and SLA (summer). The cluster analysis of light use included the following variables: LAD, Ldays and Lsize; Asat and Nl (summer). The cluster analysis of water use included: LA; WC; kh and ks (summer and winter); STEMdw/WC and WC/ ROOTdw. The cluster analysis of nutrient use included: Nl (summer) and Nl (senescent); Pl (senescent); Nr and Pr (winter); NUE and PUE.
A multiple linear regression was carried out to relate TOTALdw to light, water and nutrient use. Three models were carried out for estimating TOTALdw from light use, water use and nutrient variables described for the clusters analysis. The model showing the lower AIC was selected and reported.
Results
Growth
Clones had significant differences in total height (H) and collar diameter (CD) in both samplings (summer: H: F=20.41 - p <0.0001; CD: F=4.73 - p= 0.0001; winter: H: F=25.36 - p <0.0001; CD: F= 4.73 - p= 0.0001). A129 was the tallest, and only one of the six new clones (GUA) and the old CAR and R22 had similar height (Tab. S3 in Supplementary material).
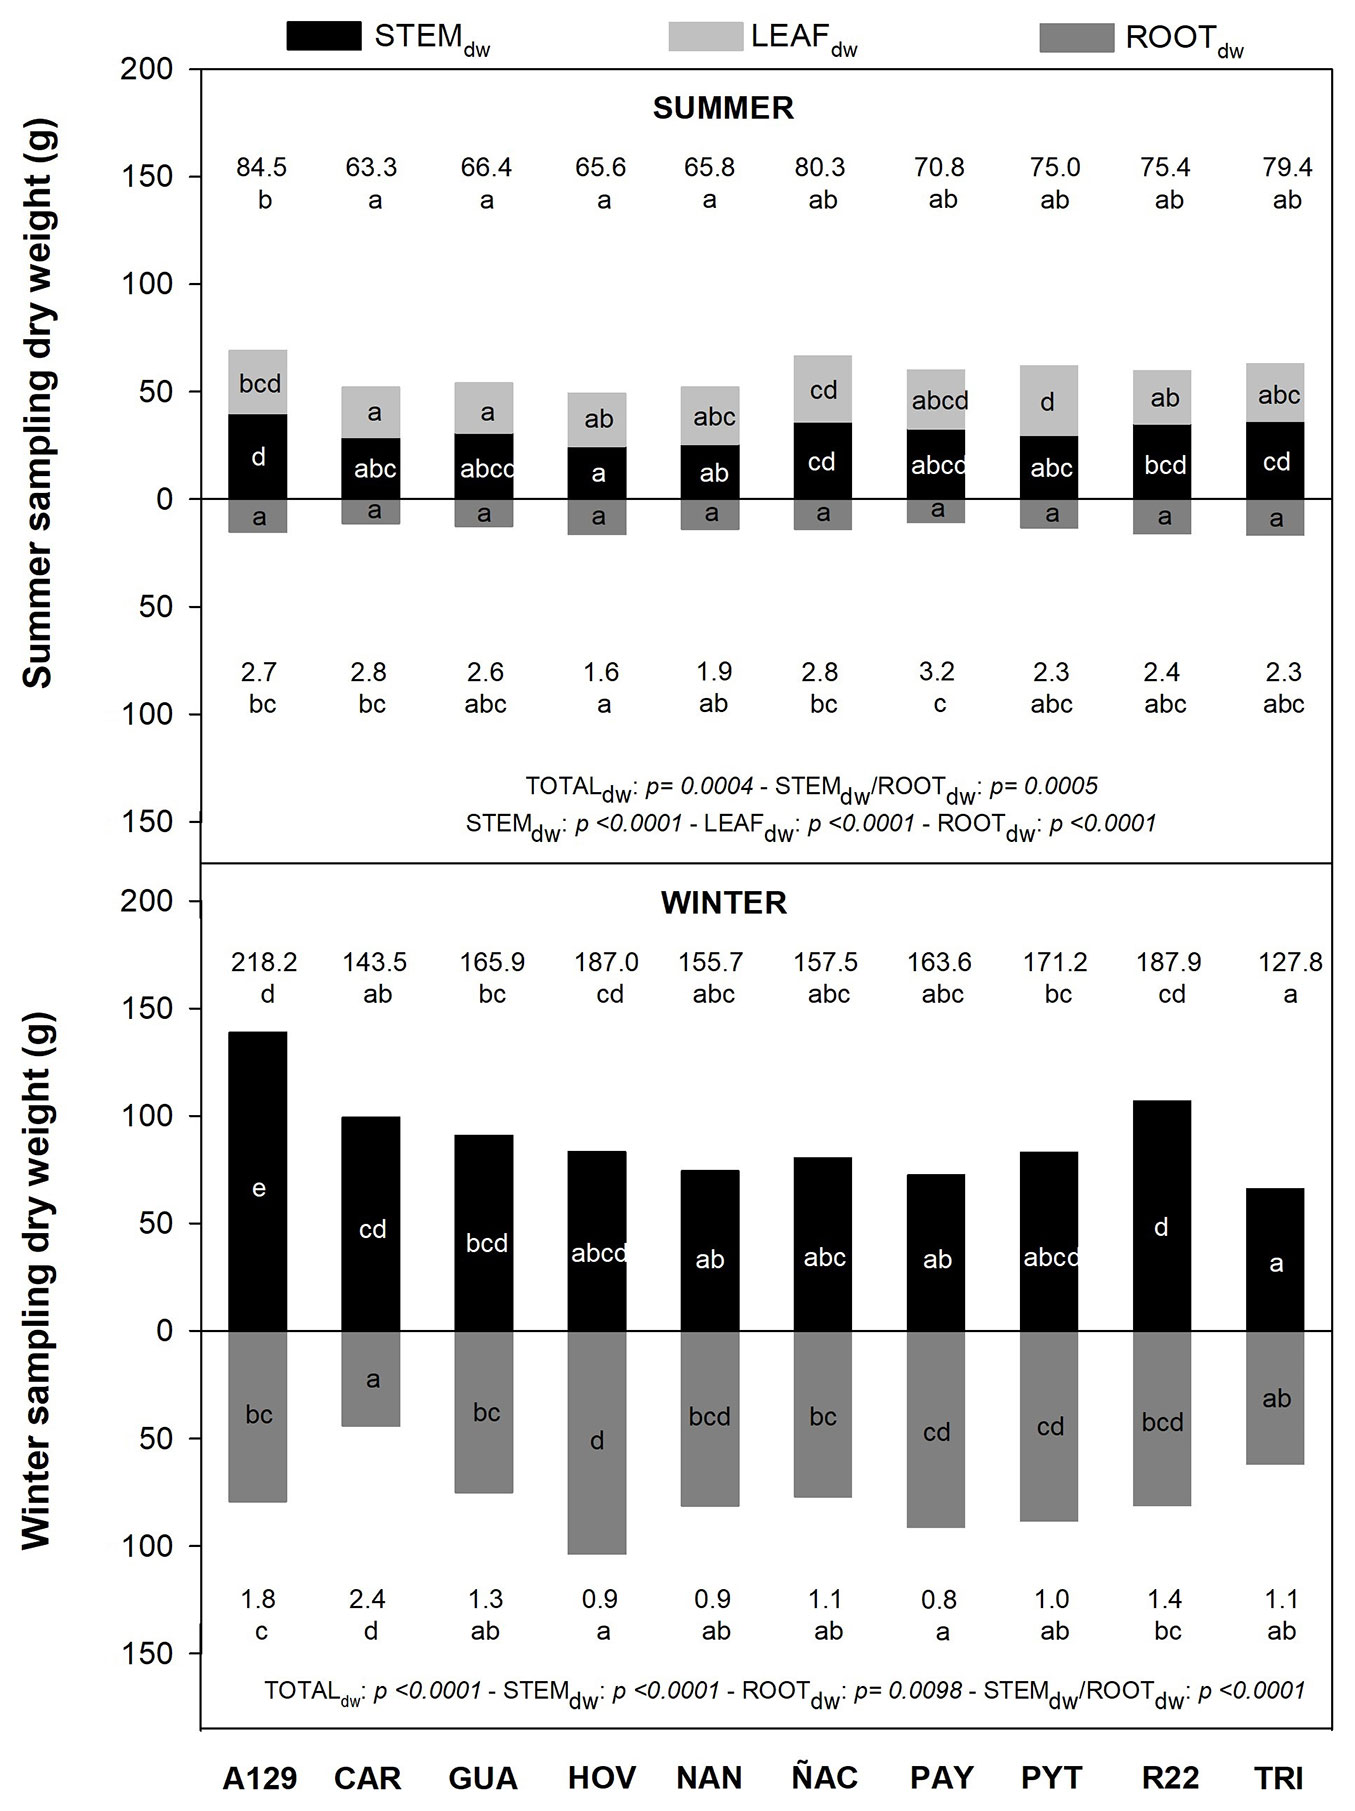
STEMdw, LEAFdw and ROOTdw were different among clones in summer and in winter. A129 had the highest TOTALdw and STEMdw. Clonal variability was also observed in STEMdw/ROOTdw. The non-model clone (TRI) was similar to others for the summer sampling but had the lowest TOTALdw for the winter sampling (Fig. 1).
Fig. 1 - Total dry weight (TOTALdw), stem (STEMdw), leaf (LEAFdw) and root (ROOTdw) dry weight for both summer (above) and winter (below) sampling. Numbers on the top represent TOTALdw. Numbers on the bottom represent STEMdw/ROOTdw values. Different letters indicate significant differences (p <0.05) among clones in each season. P-values of each variable are also reported for summer and winter.
Light use
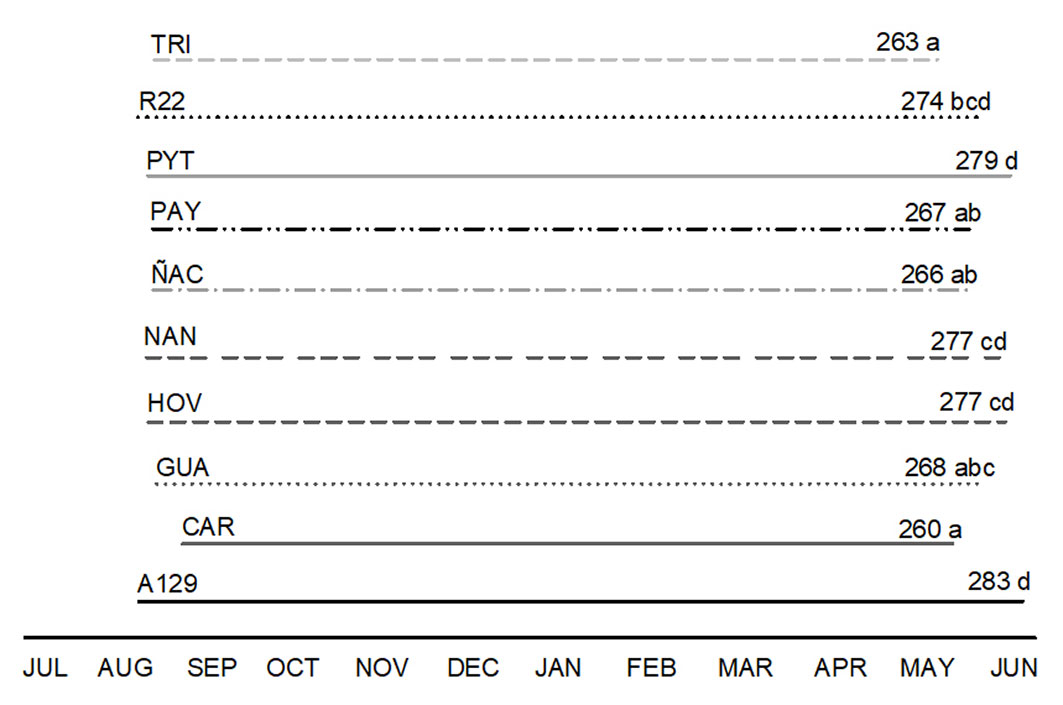
The duration of the growing season, expressed as Ldays, was different among clones (F=3.39; p <0.0001). A129 had the highest Ldays while TRI and CAR had the shortest growing season (Fig. 2). High amplitude was observed in LAD, from 59 to 108 m2 day, corresponding to an old (CAR) and a new clone (PYT), respectively (Fig. S1 in Supplementary material). Asat was significantly different between clones: from 7.78 to 15.27 µmol m-2 s-1, corresponding to the new clone ÑAC and the old clone R22, respectively (Tab. 2). The intrinsic water use efficiency (WUEi) and the stomatal conductance (gs) did not vary between clones (Tab. 2).
Fig. 2 - Time line representing days with leaves (Ldays) of each clone. The numbers above the lines correspond to the mean amount of days between bud burst and abscission dates. Different letters indicate significant differences (p <0.05) between clones.
Tab. 2 - Light-saturated net photosynthesis (Asat), stomatal conductance (gs) and intrinsic water use efficiency (WUEi) for each clone (summer sampling). Means ± standard deviations are reported. Different letters indicate significant differences (p <0.05) between clones.
| Clone | gs (mmol m-2 s-1) |
Asat (µmol m-2 s-1) |
WUEi (mmol CO2 µmol-1 H2O) |
|---|---|---|---|
| A129 | 176 ± 124 | 12.89 ± 4.63ab | 5.12 ± 1.16 |
| CAR | 133 ± 80 | 9.75 ± 4.75ab | 3.97 ± 1.60 |
| GUA | 148 ± 84 | 12.05 ± 3.82ab | 4.64 ± 1.34 |
| HOV | 187 ± 106 | 12.82 ± 3.60ab | 4.87 ± 1.55 |
| NAN | 171 ± 83 | 11.17 ± 1.77ab | 3.83 ± 1.12 |
| ÑAC | 122 ± 86 | 7.78 ± 5.73a | 3.87 ± 1.89 |
| PAY | 124 ± 80 | 10.49 ± 5.79ab | 4.48 ± 1.52 |
| PYT | 141 ± 58 | 9.85 ± 1.82ab | 4.17 ± 1.58 |
| R22 | 195 ± 110 | 15.27 ± 4.13b | 5.24 ± 1.24 |
| TRI | 143 ± 113 | 10.48 ± 6.42ab | 4.40 ± 1.41 |
| F | 0.82 | 2.27 | 1.28 |
| p-value | 0.5976 | 0.0236 | 0.2568 |
Water use
Stem hydraulic conductivity (kh), specific hydraulic conductivity (ks) and leaf specific hydraulic conductivity (kl) were significantly different among clones (Tab. S4 in Supplementary material). Summer kh fluctuated from 37.9 to 82.6 g cm s-1 MPa-1, corresponding to a new clone (NAN) and the non-model old clone (TRI), respectively (F= 4.71; p=0.001), while kl was highest in the TRI and lowest in NAN (F=6.88; p<0.001). In winter, kh ranged from 20.2 (old R22) to 86.3 g cm s-1 MPa-1 (non-model TRI) (F= 19.68; p<0.001). Some clones had significant differences between summer and winter kh. In those cases, kh in winter was lower than in summer. In summer, ks varied between 50 and 93.7 g cm-1 s-1 MPa-1, corresponding to the model clone A129 and the new clone HOV, respectively (F= 3.82; p= 0.001). All clones evaluated decreased ks in winter (F= 33.22; p <0.001 - Tab. S4 in Supplementary material).
Accumulated water consumption (WC) across the growing season varied among clones (F=4.41; p=0.001). The old P. × canadensis R22 and non-model TRI had the highest and lowest WC respectively (Fig. S2). No significant differences were found among clones in WUEb (mean= 0.001 kg DW kg H2O-1; F=1.29; p=0.28), but the relation STEMdw/WC did vary. Moreover, water uptake efficiency of the root system (expressed as WC/ROOTdw) also varied. The model and non-model clones were similar in both traits (Tab. 3): high STEMdw/WC and low WC/ROOTdw.
Tab. 3 - Relation between water consumption and dry mass of stem (STEMdw/WC) and roots (WC/ROOTdw). Means ± standard deviations are reported. Different letters indicate significant differences (p <0.05) between clones.
| Clone | STEMdw/WC (g kg-1) |
WC/ROOTdw (kg g-1) |
|---|---|---|
| A129 | 0.91 ± 0.86 b | 1.34 ± 0.86 a |
| CAR | 0.84 ± 0.11 b | 3.44 ± 0.81 c |
| GUA | 0.71 ± 0.07 ab | 1.81 ± 0.24 ab |
| HOV | 0.66 ± 0.10 ab | 1.28 ± 0.40 a |
| NAN | 0.66 ± 0.08 ab | 1.36 ± 0.29 ab |
| ÑAC | 0.56 ± 0.17 ab | 1.34 ± 0.53 a |
| PAY | 0.68 ± 0.09 ab | 1.35 ± 0.32 ab |
| PYT | 0.82 ± 0.19 ab | 1.66 ± 0.44 ab |
| R22 | 0.40 ± 0.13 a | 2.65 ± 0.74 bc |
| TRI | 0.78 ± 027 b | 1.43 ± 0.25 ab |
| F | 3.98 | 7.05 |
| p-value | 0.0020 | <0.0001 |
Nutrient use
Variation in Nl was significant among clones (F=5.57; p=0.0008). NAN (new) and A129 (model) were the clones with the highest values. No differences were found among clones neither in Ns (mean=0.53%; F=1.93; p=0.106) and Nr (mean=1.16%; F= 1.49; p=0.219) during the summer, nor in Ns during the winter (mean=1.11%; F=0.41; p= 0.913). However, differences were significant in Nl of senescent leaves (F=5.20; p= 0.001) and Nr in winter (F=4.29; p=0.003). One of the old clones (CAR) had the highest Nl in senescent leaves (1.47%), while NAN, ÑAC, PAY, PYT (new clones) and TRI (non-model) had the lowest values (around 1%). Nr in summer ranged from 1.06% to 1.29%. In winter, Nr varied from 0.87% to 1.28%. Comparison of sampling dates showed a 28-49% decrease in Nl from summer to winter. Besides, there was an increase in Ns in winter with respect to the summer, except for HOV (new), which had similar values in both samplings. Moreover, Nr of HOV, NAN, PAY and PYT, four of the six new clones, was significantly lower in winter than in summer. The remaining clones had similar Nr at both samplings (Tab. S5 in Supplementary material). Total nitrogen content (Nc) at the end of the growing season varied significantly among clones (F=9.60; p<0.001). The model clone (A129) had the highest N content in the stem and roots (2.55 g), while the non-model (TRI) had 1.40 g of Nc in winter. Differences in the N content were also evident for each biomass compartment; old clone CAR had the lowest root N content, while its stem had one of the higher amounts of N. Furthermore, the model clone (A129) had higher N content in the stem, but did not differ from the others in roots N content (Fig. 3).
Fig. 3 - N and P content (g) of stem, roots and leaves in the summer, and stem and roots in the winter for all evaluated clones. N and P content are the result of multiplying the N and P concentrations (g · gdw-1) by the dry weight of the respective biomass compartment (gdw). For every clone, the bar on the left represents the summer sampling (sum), while the right one represents the winter sampling (win). Numbers on each top margin indicate N total content (Nc) and P total content (Pc) for each clone at both samplings. Different letters indicate significant differences (p <0.05) among clones for the same season.
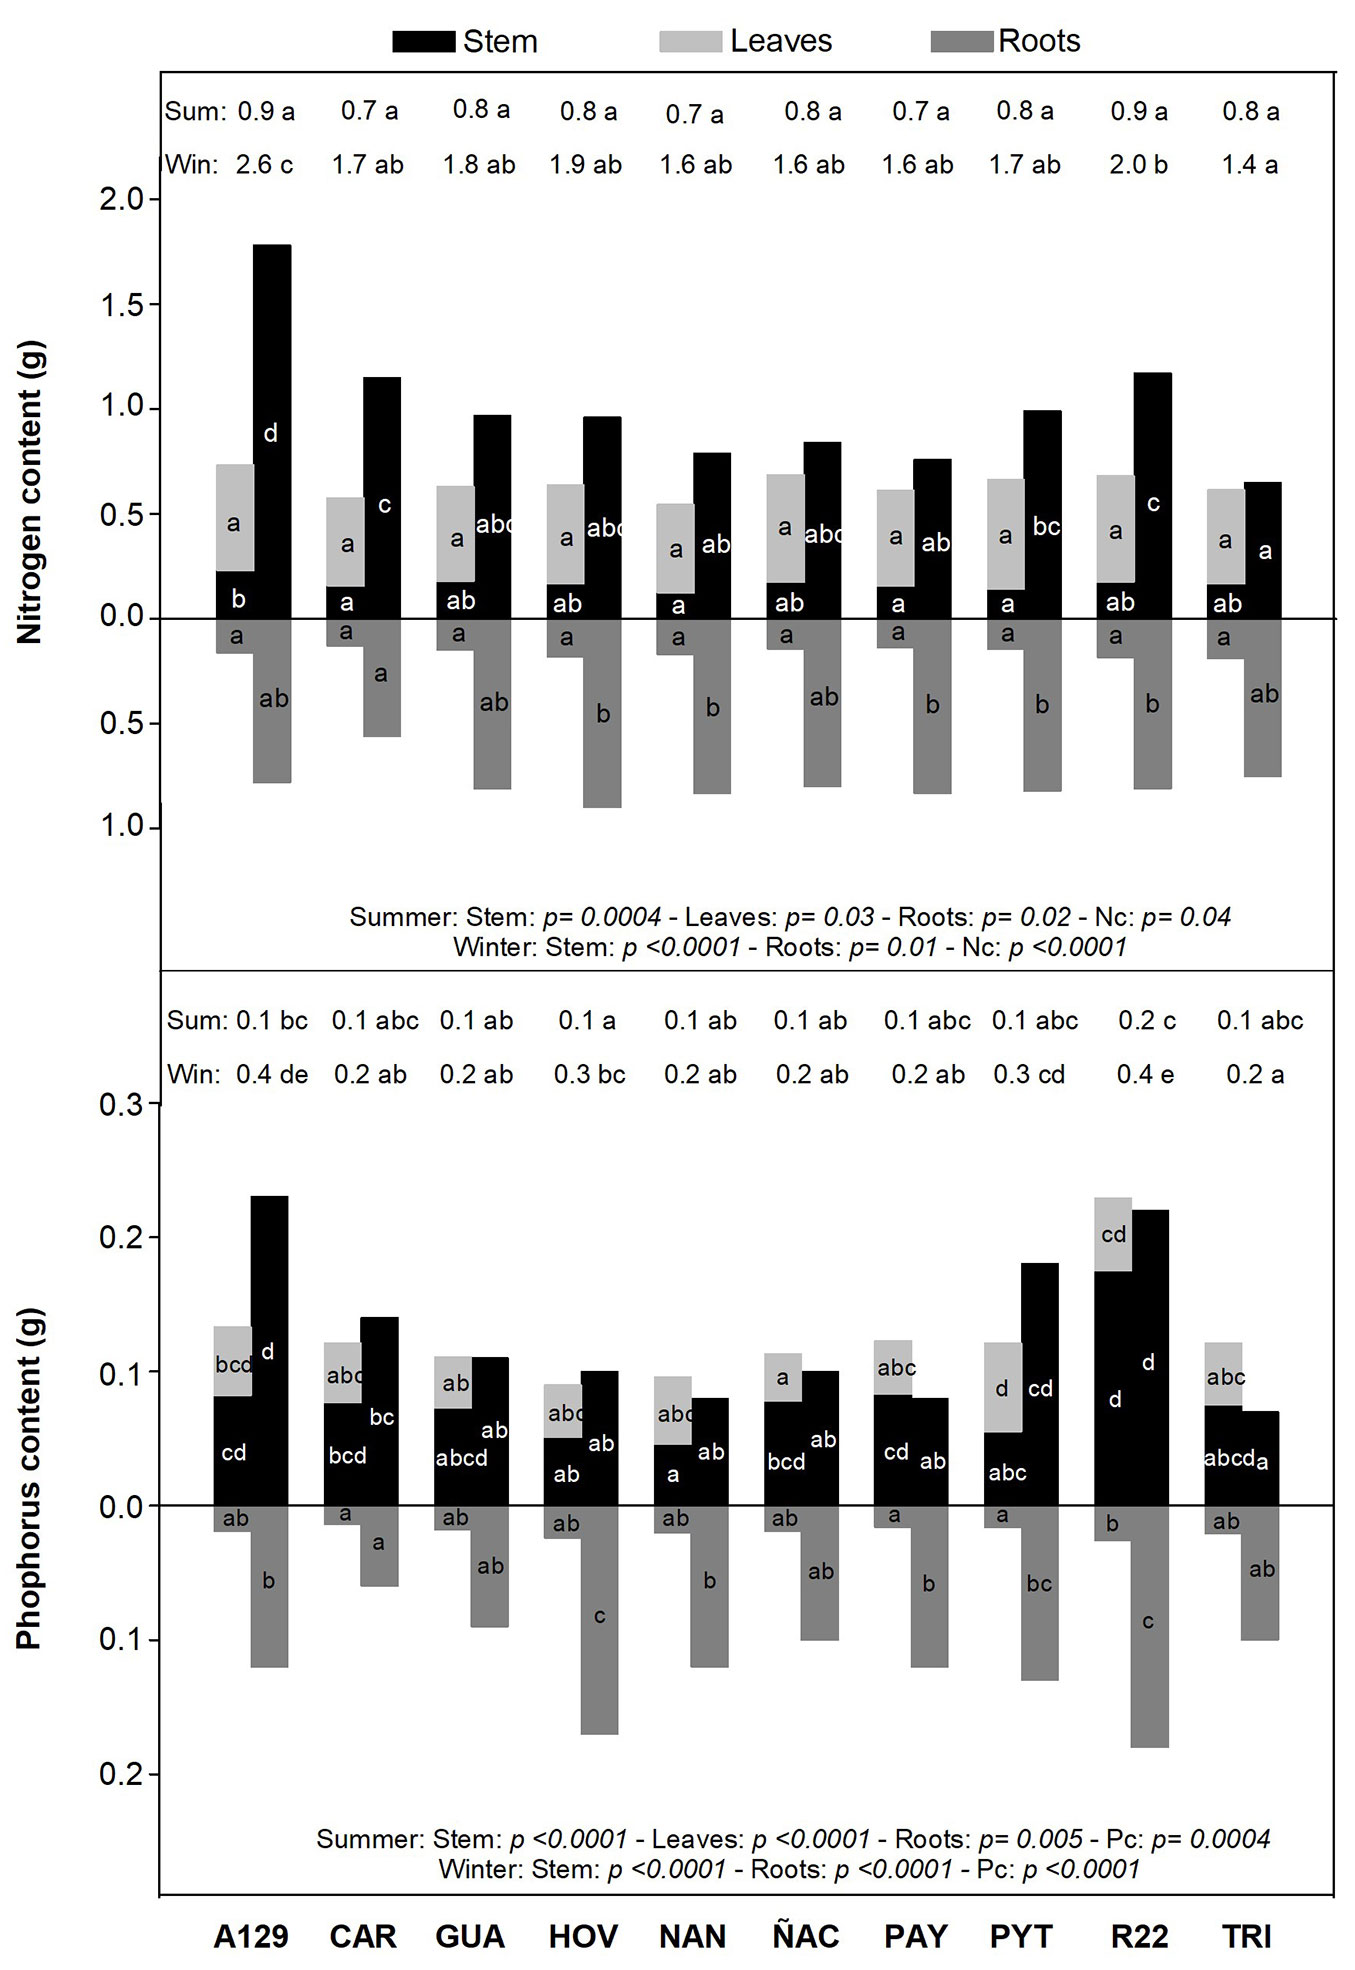
Phosphorus (P) concentration in summer was similar for all clones in each biomass compartment. Green leaves varied between 1600 and 2400 ppm of P (F=1.66; p= 0.166), Ps was around 1800 and 2600 ppm (F=0.92; p=0.527), and Pr was between 1200 and 1650 ppm (F=1.85; p=0.121). Despite this amplitude, no significant differences were found among genotypes. There were clonal differences in P concentration of senescent leaves (F=6.14; p= 0.0004) and roots (F=2.87; p=0.024) at the end of the growing season. The new clone PYT had the lowest Pl in senescent leaves (1195 ppm). GUA, PAY and ÑAC (new clones) had the lowest Pr for the winter sampling (~1300 ppm), while R22 was the clone with the highest Pr (2172 ppm). Ps in winter varied from 1000 to 2000 ppm, but no significant differences were found among clones (F=2.32; p=0.06). Pl in senescent leaves was similar for both samplings, except for two new clones, NAN and PYT, which had a significant P decrease in the leaves in winter. There was no difference in Pr between summer and winter (Tab. S6). Pc (g) after foliar abscission was highly variable among clones (F=19.62; p<0.001). No significant differences were found among genotypes in both roots and stem P content. The old R22 and the model A129 were the clones with the highest P content accumulation at the end of the growing season (~0.40 g plant-1). The non-model old clone (TRI) had the lowest value of P content with only 0.17 g in the stem and roots. We found differences in resources partitioning: while there were no differences between R22 and A129 in Pc, differences were found in the partitioning of P to the roots. Moreover, the non-model clone TRI was on the opposite side of the model A129 regarding Pc, but there were no differences in root content (Fig. 3).
Significant differences were found among clones in NUE and PUE. The most N efficient clones were two of the six new clones, both with similar values (PYT and PAY). However, they differed at the PUE. PAY was also one of the most efficient clones in PUE with another new clone (GUA). Otherwise, the model A129 and the old R22 were two of the least efficient clones considering both nutrients. CAR had the highest stem production efficiency considering accumulated N and P (Nspe and Pspe - Tab. 4).
Tab. 4 - Nitrogen and phosphorus use efficiencies (NUE: winter TOTALdw/Nc; PUE: winter TOTALdw/Pc). Relationship between STEMdw at the end of the growing season with Nc and Pc (Nspe and Pspe). Means ± standard deviations are reported for each clone. Different letters indicate significant differences (p <0.05) between clones.
| Clone | NUE | PUE | Nspe | Pspe |
|---|---|---|---|---|
| A129 | 87 ± 6 ab | 622 ± 64 b | 55 ± 6 ab | 395 ± 60 bc |
| CAR | 84 ± 7 ab | 723 ± 111 bcd | 58 ± 6 b | 500 ± 81 d |
| GUA | 94 ± 8 abc | 828 ± 75 d | 52 ± 6 ab | 456 ± 70 |
| HOV | 102 ± 14 bc | 697 ± 34 bc | 46 ± 13 ab | 312 ± 53 ab |
| NAN | 96 ± 5 abc | 762 ± 60 cd | 46 ± 4 a | 364 ± 64 abc |
| ÑAC | 96 ± 6 abc | 807 ± 65 cd | 49 ± 5 ab | 410 ± 54 cd |
| PAY | 104 ± 10 c | 832 ± 102 d | 46 ± 4 a | 369 ± 56 abc |
| PYT | 104 ± 30 c | 616 ± 142 b | 51 ± 18 ab | 306 ± 94 ab |
| R22 | 95 ± 5 abc | 492 ± 67 a | 54 ± 6 ab | 281 ± 53 a |
| TRI | 92 ± 12 abc | 748 ± 84 cd | 47 ± 10 ab | 389 ± 85 bc |
| F | 3.72 | 18.53 | 2.78 | 11.49 |
| p-value | 0.0004 | <0.0001 | 0.0058 | <0.0001 |
Multivariate similarities among clones
Clusters analyses allowed to group and identify similarities among old, new and model genotypes. The model clone A129 was the only one which was always located at the same position in every cluster. In the morphological cluster, the model and non-model clones were located in opposite groups. A129 constituted an individual cluster and, despite belonging to a separate group, a less disseminated clone (CAR) was the nearest clone. There were clear differences between A129 (model) and R22 (old) in physiology and resources use, but they did not reflect large differences in morphology. They looked quite similar, but they function differently. PAY and NAN, two of the newest available clones, were identified as the most similar to each other, but they differed from the model. The two P. × canadensis clones (TRI and R22) were different to each other. There were more similarities between hybrids and P. deltoides clones than between hybrid clones. It was not possible to identify a pattern among old and new genotypes as they all alternate positions with respect to the model (Fig. 4).
Fig. 4 - Cluster analyses (hierarchical method, Euclidean distance) using data of four groups of traits (morphology, light use, water use and nutrient use). Cophenetic correlation: morphology = 0.80; light use = 0.76; water use = 0.76; nutrient use = 0.83. The model clone (A129) is always at the bottom. The non-model clone (TRI) is marked with a rectangle. The new clones are marked with an elipse. Variables included in each cluster analysis were: Morphology: STEMdw (winter), LEAFdw (summer) and ROOTdw (winter); STEMdw/ROOTdw (winter); H and CD (winter); LA and SLA (summer). Light use: LAD, Ldays and Lsize; Asat and Nl (summer). Water use: LA; WC; kh and ks (summer and winter); STEMdw/WC and WC/ ROOTdw. Nutrient use: Nl (summer) and Nl (senescent); Pl (senescent); Nr and Pr (winter); NUE and PUE. Mean, standard deviation, minimum and maximum values, F and p-values of all the variables included in this analysis are listed in Tab. S7 (Supplementary material).
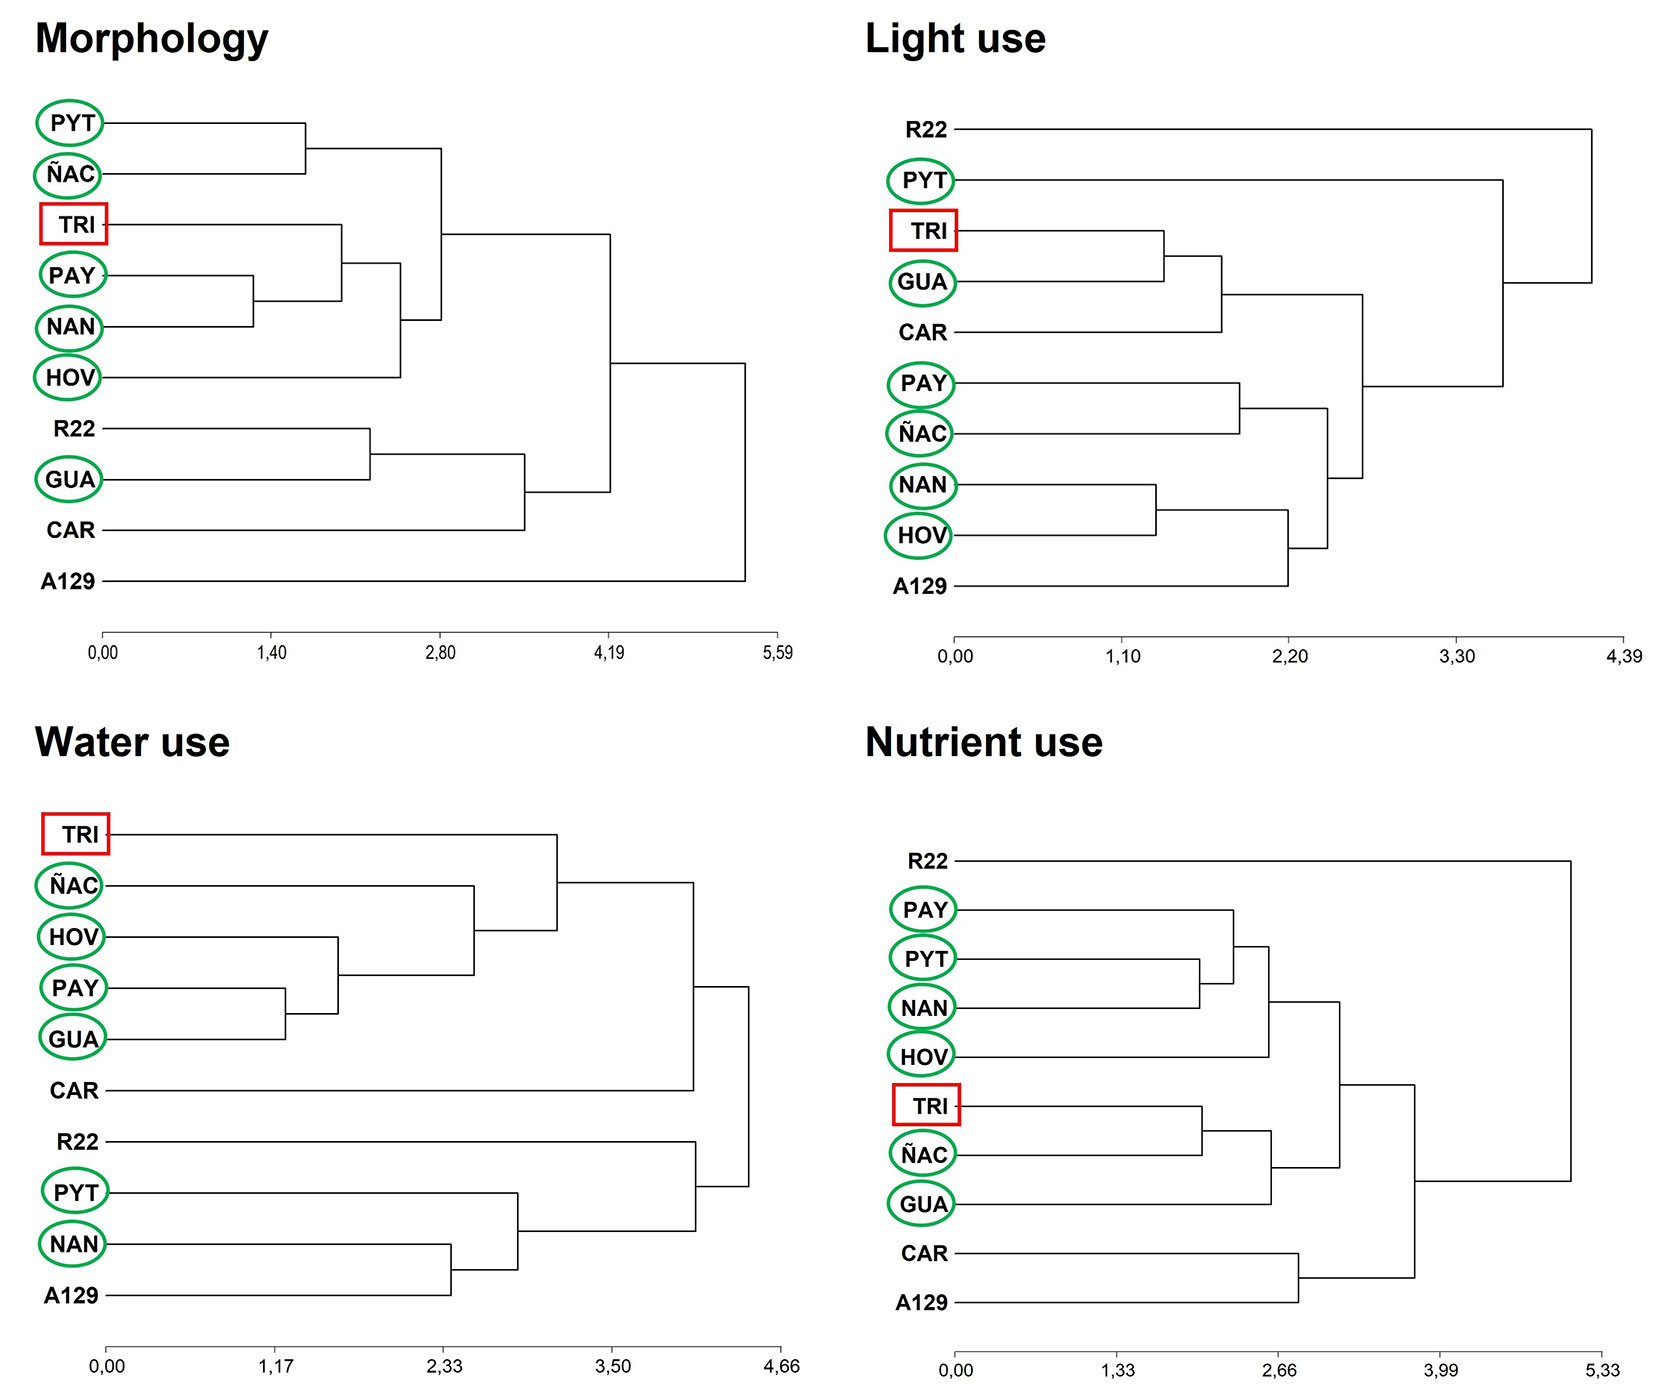
We identified three groups in the water-use cluster, with one of those groups composed of one of the old clones only (R22). The model clone formed a group with two new clones (NAN and PYT) and one of the oldest clones (CAR). The non-model clone (TRI) occupied an opposite position, near to the other P. × canadensis one (Fig. 4).
R22 also constituted a separate group in both the light use and nutrient use clusters, with alternating positions between old and new clones in both clusters. The new HOV and NAN clones were quite similar to the model in terms of light use. In addition, HOV was the closest clone to the model in the nutrient use cluster, and shared the cluster with another new clone, PYT. The clone R22, a genotype with a diffusion date similar to A129, showed clear differences in functional traits with respect to the model (Fig. 4).
Relationship between total dry mass and morpho-physiological traits
The multiple linear regression allowed us to identify the relation between TOTALdw and different physiological traits. For light use, TOTALdw was positively related to Ldays and Nl in the summer. For water use, the dry matter production was positively related to WC, WUEi and STEMdw/WC on the one hand, and negatively related to ks and WC/ROOTdw on the other. Finally, we observed a positive relation between TOTALdw and five of the nutrient use traits included in the analysis (Ns, Ps, Nr, Pr, and PUE), and a negative relation between TOTALdw and NUE (Tab. 5).
Tab. 5 - Multiple linear regression to select the most relevant traits that explain TOTALdw in absence of stresses. Three models were carried out with traits described in Fig. 4related with light use, water use and nutrient use. The model showing the lower Akaike Information Criterion (AIC) was selected. Adjusted R2 (R2 adj) and square mean error (SME) are reported.
| TOTALdw | Regressors | AIC | R2 adj | SME |
|---|---|---|---|---|
| Light use | -692.7 + 2.7 Ldays + 58.5 Nl (summer) | 84.2 | 0.74 | 358 |
| Water use | 190.1 + 1.0 WC - 1.2 ks (summer) + 4.6 kh (winter) - 5.6 ks (winter) - 17.6 WC/ ROOTdw | 87.3 | 0.62 | 9643 |
| Nutrient use | 816.6 + 48.2 Nl (summer) - 19.2 Nl (senescent) - 258.4 Nr (winter) - 0.02 Pr (winter) - 3.8 NUE - 0.1 PUE | 42.7 | 1 | 134 |
Discussion
Controlled-condition studies are a good method to describe ecophysiological traits and make comparisons, although they have some limitations to predict yields at field conditions ([33], [48]). The genotypes evaluated in this study are commercial clones. This means that they have been selected from genetic improvement programs and their productivity in the field was proved. Thus, this pot experiment can help to establish relationships among clones, but it is not a test of field performance. The interclonal diversity can be well described by pot experiments ([33], [2]) and the information can be improved by complementary field studies ([25]).
Although all the clones used in this experiment, or even their parents, came from similar latitudes ([26]), we found great variability between traits and clones. Dry mass partitioning was highly variable among genotypes, and both the model and the non-model clones were intermediate in stem:root and root dry weight. Two of the new clones, HOV and PAY, develop a large root system considering both root dry mass and its relation to stem weight. On the other hand, old CAR is the clone with the lowest root proportion related to the stem and the one with the lowest root dry weight. High biomass partitioning to roots may be associated with acclimation to drought ([47]) or with high water and nutrients uptake capacity through soil exploration ([12], [49]). This could indicate lower root system efficiency, however, as clones with great partitioning to roots need high investment in belowground biomass to obtain resources, while CAR has a competitive stem growth with a small root system. Nevertheless, a small root system could make difficult water uptake if water deficit occurs ([9]), and it can explain the low growth of CAR in dry years ([2]).
The model A129 has high yield that could explain its wide expansion ([2]). Despite being a one-year controlled condition study, its potential performance was confirmed. Stem growth in A129 is attributed to an important root and foliar system which allows to explore soil and capture light. When A129 and CAR are contrasted with respect to their morphological and physiological traits, a functional difference is observed: A129 is a “more expensive” clone than CAR in terms of carbon and nutrients. If we consider productivity, they are both competitive genotypes in stem production, but they have different soil exploration patterns.
Clonal differences in variables related to the temporal pattern of light use were also observed. For example, bud burst and foliar abscission dates were different. CAR (old) is one of the clones with smaller leaf area and a shorter growing season (days with leaves). Thus, it has the lowest leaf area duration (LAD). This old clone has 24 days with leaves less than the A129 model and a much smaller root system. Hence, CAR could be considered an efficient genotype in stem growth with respect to resources use. This was also observed comparing water uptake by roots since CAR has the highest WC/ROOTdw. On the other hand, the non-model (TRI) is one of the clones with the lowest relation between water uptake and roots dry weight, and the clone with the minimum yield at the end of the growing season. TRI consumes less water, but this is due to its low growth rate and not due to high efficiency. It is worth mentioning that TRI is a clone commonly planted in Europe ([43]) where it shows better performance than in the Delta del Paraná, Argentina.
Significant differences were found among clones in nitrogen and phosphorus retention, but the relation between plant size and nutrient accumulation was not straightforward due to clone variability in tissue concentrations. It is important to consider plants’ nutrient accumulation in wetlands, where nitrogen-inorganic forms in the soil can easily lixiviate, and available phosphorus is usually low due to edaphic factors ([37], [21], [41]). Furthermore, variability in nutrient cycling could have a relevant impact since soil properties determine global and regional patterns of soil microbial communities ([24]). This is also important as leaf nitrogen content can partly affect the growth of clones ([33]), and nutrients stored in stems and roots are used to sustain the initial burst in spring. We found that the model clone A129 accumulates high amounts of N and P in the tissues, so it probably reduces N lixiviation and enhances initial growth in spring, two positive processes to increase forest productivity. Very low nutrient accumulation was observed in the non-model TRI, and if this process is repeated every year, it can explain TRI’s low yield.
Morpho-physiological differences between clones have been proved, even among clones belonging to the same species. These results are consistent with previous research on other species that also have verified clonal variability ([6], [42], [12]). In this study, we observed a similar performance among clones from different species like A129 and R22, two genotypes that began to be planted on a large scale at the same time. This similarity is probably due to a genetic relationship since A129 is hybrid R22’s mother. However, there are other P. deltoides clones similar to P. × canadensis genotypes. For example, GUA (new clone) has great morphological and physiological similarities with the old R22 (STEMdw/ROOTdw, Ldays and LAD). They also have similar total nitrogen content at the end of the growing season, though they vary significantly in water consumption and phosphorus total content. Low water consumption could be related to the differences found towards the winter: GUA has a more important decrease at stem hydraulic conductivity (kh) and specific hydraulic conductivity (ks) with respect to the summer measurements. A stem with low conductivity could be the reason for lower water consumption ([19], [10]).
The stability of the model clone A129 was confirmed by its relative positioning in morphology, light, water and nutrient use clusters. There was no clone analogous to the model in the 4 clusters at the same time, as any clone is equivalent in functionality to the model clone. The most similar genotypes to A129 were NAN (water use), HOV (light use) and CAR (nutrient use). Therefore, the model clone should be replaced by NAN, HOV or CAR depending on whether water availability, light availability or nutrient availability are critical. Additionally, we observed that A129 constituted an individual cluster in the morphology analysis, although CAR, GUA and R22 were close. That means that the morphological aspect of A129 is unique, and this can facilitate identification for foresters. Despite plantation of A129 and R22 began at the same time, model A129 has shown a greater expansion than R22. The differences in the use of resources, especially those related to light and nutrient use, seem to be relevant to explain the differences in the expansion rate of both genotypes.
The functional traits (morphological, physiological and phenological) help understand plant performance ([46]). Working with ten clones we found that performance (measured as total dry mass) is positively related to N concentration in leaves and the days with leaves, i.e., the length of the growing season. We also found that higher growth is related to higher water consumption, highly conductive stems and big root systems, i.e., plants with big absorbing roots and big stems, both with low specific conductivity. This information is significant since the breeding programs can evaluate non-traditional traits and select genotypes related to performance. In this way, it would be possible to find clones with similar growth than the models, but with different morphological, physiological and/or phenological attributes. The Delta del Paraná example can be assumed in other poplar-production regions since the low diversity within plantations is frequent. For instance, in Italy and Spain the most widely planted clone is Populus × euramericana ’I-214’ ([4], [35]), which can be considered a model clone. Characterizing model clones is crucial for guiding breeding programs in the search of new candidates. Finally, morpho-physiological evaluations under non-stressful conditions should be complemented with assessments of the responses to the most common stresses that plantations withstand in each region, as yield stability and phenotypic plasticity differ among poplar clones ([2]).
Conclusions
High variability in physiology and morphology associated with different uses of resources was observed among poplar clones belonging to the same species. This study demonstrates that variability not only relates to visible phenotype, but also to functionality. This type of information could be relevant for optimizing water, light and nutrient uses. It is also important because it helps explain the forester’s preference for a clone over others. Knowledge about functional variability enables foresters to conduct more intelligent and site-specific silviculture and to optimize the genotype selection in breeding programs.
Acknowledgements
We would like to thank the E.E.A. Delta del Paraná staff for their valuable contributions in the setup, measuring, and maintenance of the experiment. SMB received CONICET-INTA Co-funded Doctoral Fellowships, Argentina.
This research was funded by CONICET, Argentina through the project PIP no. 112-201701-00392 (CG), and by the Agencia I+D+i, Argentina through the project PICT 2017-1424 (LIF).
Authors’ contributions
Conceptualization: SMB, JAA, CG; methodology: SMB, JAA, CG; collection of data: SMB, LIF, JAA, CG; data analysis: SMB, LIF, JAA, CG; writing original draft preparation: SMB, CG; writing-review and editing: SMB, LIF, JAA, CG; funding acquisition: LIF, CG; supervision: JAA, CG.
References
CrossRef | Gscholar
Gscholar
Authors’ Info
Authors’ Affiliation
Javier Alejandro Alvarez
Laura Inés Faustino 0000-0002-5118-3607
Instituto Nacional de Tecnología Agropecuaria (INTA), Estación Experimental Agropecuaria Delta del Paraná, Río Paraná de las Palmas y Canal Laurentino Comas, 4ta Sección de Islas, 2802 Campana, Provincia de Buenos Aires (Argentina)
Consejo Nacional de Investigaciones Científicas y Técnicas (CONICET), Instituto de Fisiología Vegetal (INFIVE), Diagonal 113 y calle 61, 1900 La Plata, Provincia de Buenos Aires (Argentina)
Facultad de Ciencias Agrarias y Forestales, Universidad Nacional de La Plata, Avenida 60 y 118, 1900 La Plata, Provincia de Buenos Aires (Argentina)
Corresponding author
Paper Info
Citation
Bonnin SM, Alvarez JA, Faustino LI, Graciano C (2024). Revealing the physiological basis of forester’s choice of poplar clones (Populus spp.). iForest 17: 156-164. - doi: 10.3832/ifor4433-017
Academic Editor
Andrea Cutini
Paper history
Received: Jul 21, 2023
Accepted: Feb 27, 2024
First online: Jun 14, 2024
Publication Date: Jun 30, 2024
Publication Time: 3.60 months
Copyright Information
© SISEF - The Italian Society of Silviculture and Forest Ecology 2024
Open Access
This article is distributed under the terms of the Creative Commons Attribution-Non Commercial 4.0 International (https://creativecommons.org/licenses/by-nc/4.0/), which permits unrestricted use, distribution, and reproduction in any medium, provided you give appropriate credit to the original author(s) and the source, provide a link to the Creative Commons license, and indicate if changes were made.

Web Metrics
Breakdown by View Type
Article Usage
Total Article Views: 11872
(from publication date up to now)
Breakdown by View Type
HTML Page Views: 6681
Abstract Page Views: 2548
PDF Downloads: 2310
Citation/Reference Downloads: 3
XML Downloads: 330
Web Metrics
Days since publication: 769
Overall contacts: 11872
Avg. contacts per week: 108.07
Article Citations
Article citations are based on data periodically collected from the Clarivate Web of Science web site
(last update: Mar 2025)
(No citations were found up to date. Please come back later)
Publication Metrics
by Dimensions ©
Articles citing this article
List of the papers citing this article based on CrossRef Cited-by.
Related Contents
iForest Similar Articles
Research Articles
Preliminary study on genetic variation of growth traits and wood properties and superior clones selection of Populus ussuriensis Kom.
vol. 12, pp. 459-466 (online: 29 September 2019)
Research Articles
Mapping Cadmium distribution in roots of Salicaceae through scanning electron microscopy with x-ray microanalysis
vol. 4, pp. 113-120 (online: 01 June 2011)
Research Articles
Energy production of poplar clones and their energy use efficiency
vol. 7, pp. 150-155 (online: 23 January 2014)
Research Articles
Kinetic, morphophysiological, and biochemical parameters as a strategy to select clones of Eucalyptus spp. more efficient in phosphorus uptake
vol. 18, pp. 212-222 (online: 09 August 2025)
Research Articles
Interaction between planting spacing and wood properties of Eucalyptus clones grown in short rotation
vol. 14, pp. 12-17 (online: 02 January 2021)
Research Articles
Verification of new Populus nigra L. clone improvement based on their performance over three rotations
vol. 13, pp. 185-193 (online: 12 May 2020)
Research Articles
Stem xylem traits in poplar genotypes (Populus L.): additional parameters for selection and breeding
vol. 19, pp. 52-60 (online: 15 February 2026)
Review Papers
Breeding and improvement of black locust (Robinia pseudoacacia L.) with a special focus on Hungary: a review
vol. 16, pp. 290-298 (online: 28 October 2023)
Research Articles
NIR-based models for estimating selected physical and chemical wood properties from fast-growing plantations
vol. 15, pp. 372-380 (online: 05 October 2022)
Research Articles
Nitrogen removal and its determinants in hybrid Populus clones for bioenergy plantations after two biennial rotations in two temperate sites in northern Italy
vol. 8, pp. 668-676 (online: 02 February 2015)
iForest Database Search
Search By Author
Search By Keyword
Google Scholar Search
Citing Articles
Search By Author
Search By Keywords
PubMed Search
Search By Author
Search By Keyword


