
Controlling soil total nitrogen factors across shrublands in the Three Rivers Source Region of the Tibetan Plateau
iForest - Biogeosciences and Forestry, Volume 13, Issue 6, Pages 559-565 (2020)
doi: https://doi.org/10.3832/ifor3533-013
Published: Nov 29, 2020 - Copyright © 2020 SISEF
Research Articles
Abstract
Alpine shrublands in the Three Rivers Source Region (TRSR) store substantial soil total nitrogen (N); however, limited information is available regarding its storage and controlling factors. To quantify the storage and controlling factors of soil total N stock, we analysed 66 soil profiles from samples obtained from 22 shrubland sites located across the TRSR on the Tibetan Plateau. Analytical methods, such as ordinary least squares regression, one-way analysis of variance, curve estimation, and variation partitioning were used to evaluate the effects of soil characteristics (soil organic carbon), vegetation characteristics (community types and ground cover of shrublands), climatic factors (mean annual temperature - MAT), and topographical features (slope) on soil N stock. Our results showed that soil N storage at a soil depth interval of 0-100 cm was 63.10 ± 27.41 Tg (Tg = 1012 g), with an average soil N stock of 2.44 ± 1.06 kg m-2 in the TRSR shrublands. Although the type of vegetation community had a small effect on soil N stock, the latter increased with increasing shrubland ground cover and soil organic carbon. However, soil N stock decreased with increasing topographical slope and MAT. Furthermore, changes in MAT primarily affected the N stock of topsoil. Among all the controlling factors, soil organic carbon explained most of the variation in the soil N stock. Considering the effects of global warming, an increase in MAT has decreased the soil N stock. Long-term monitoring of changes in soil N stock should be conducted to improve the precise estimation of soil N storage across the shrublands in the TRSR of the Tibetan Plateau.
Keywords
Soil N Storage, Ground Cover, SOC, MAT, Alpine Shrublands, Tibetan Plateau
Introduction
Nitrogen (N) is an important limiting nutrient in northern ecosystems and is widely considered to be one of the most important elements in nutrient cycles ([1]). Within the N cycle in soils, significant greenhouse gases can be produced from ammonia (NH3) volatilisation and denitrification (NOx - [39]). As a key element, the storage of N in the soil is a basic input parameter for greenhouse gas, vegetation, and land surface models ([38]). Thus, studying soil N storage and its controlling factors is important to understand the relationship between carbon cycles in terrestrial ecosystems and global climate change ([43]).
Human activities, such as fertiliser use, industrial development, burning of biomass, expansion of agriculture, and deforestation have affected the N cycle ([37]) and even accelerated N deposition rate ([15]). Several studies have shown that global N deposition was 3-5 times higher in recent years than in the last century ([16]). In many regions, especially in Asia, N deposition is expected to increase faster ([6]). In China, over the past decades, total N deposition has not only significantly increased, but has also increased faster than that in Europe and the United States of America, even in the high-altitude region of the Tibetan Plateau ([12]). Accurate quantification of soil N stock is important for assessing the N capacity of soils to act as N sinks. Furthermore, uncertainties exist in the estimation of soil N stocks. Globally, researchers have estimated different soil N storages at 0-100 cm depths, for example, approximately 95 Pg ([34]) and 133-140 Pg ([3]). At a national scale, soil N storage in China (0-100 cm) was reported to be 7.4 Pg ([41]), which was lower than the previously estimated 8.29 Pg ([37]).
Soil characteristics ([1]), climatic factors ([19]), topography ([42]), and vegetation properties ([24]) have significant effects on soil N stock. Research has also demonstrated that soil depths, soil types ([41]), and soil parent materials ([1]) can affect soil N concentration and the over-soil N stock. Soil organic carbon (SOC) was observed to exhibit similar spatial distribution to soil N in the Loess Plateau of China ([11]) and eastern Rio Grande Plains, Texas, USA ([44]). Climatic changes have been observed to significantly affect nutrient dynamics, especially for N ([18]), and warmer, wetter climates contribute to soil N processes ([19]) including leaching and denitrification, which inevitably affect soil N storage.
Geomorphic disturbances and terrain characteristics ([33]) have also been demonstrated to affect soil N. Topography, including slope, has been found to play an important role in shaping microclimate environments, resulting in different temperatures and moisture levels, thus affecting the distribution of plant communities and various soil processes ([2]). However, topographical slope has also been found to significantly impact soil erosion ([4]), thus affecting soil N. This demonstrates that topographical factors play an important role in predicting soil N storage, and ignoring topographical effects increases the uncertainty of estimating soil N stock, especially in mountain regions ([42]).
In Mediterranean regions, vegetation types, including native and reforested plants, have also been found to affect soil N storage ([20]). However, the extensive heterogeneity found in soils has made vegetation types poor predictors of soil N stock ([37]). Specifically, soil N in the forest and woodlands of northern China was 14% higher than that in the wetlands. In contrast, soil N in the wetlands was found to be more than twice that in the forest and woodlands of southern China ([37]).
On the Tibetan Plateau, the following factors affect the soil N storage: yak grazing in the alpine meadows ([25]), soil characteristics, such as paedogenesis and physicochemical parameters in the alpine meadows ([26]), and different land cover types, including alpine wet meadows, alpine deserts, alpine steppes, alpine meadows, and barren lands ([43]). However, less attention has been paid to the shrublands of the Tibetan Plateau ([30]). It has been demonstrated that the mean annual temperature (MAT), instead of mean annual precipitation (MAP), primarily affects the soil N stock at a soil depth interval of 0-30 cm in the alpine shrublands of the Tibetan Plateau ([30]). However, previous research on the effects of climatic factors on soil N stock has only focused on topsoil (0-30 cm), while the response of soil N stock to increasing MAT in deeper soils, such as at 0-100 cm, remains unknown in these shrublands. Therefore, other factors affecting soil N stock in these shrublands should be studied.
Although uncertainties in the estimation of global N stocks usually exist, regional evaluations increase the precision of estimates ([41]). At a regional scale, the Three Rivers Source Region (TRSR) is distributed across the interiors of the Tibetan Plateau ([21]). So far, soil N storage has not been estimated in the TRSR. Regarding global warming, the TRSR has not only experienced climatic changes, but the changes experienced here were also greater than those experienced in other regions ([21]). It has been demonstrated that MAT has increased by 1.5 °C in the last 40 years ([35]), which will change the soil N stock ([24]). In this study, our aim was to evaluate the soil N storage across the shrublands of the TRSR and examine the factors controlling it. We tested the following hypotheses: (1) soil characteristics (such as SOC), geographic conditions (such as slope), and vegetation characteristics (including different dominant community types and ground cover of shrublands) can not only shape soil N stock, but also explain most variations in the soil N stock across the shrublands of the TRSR; (2) the effects of MAT on soil N stock are concentrated in the topsoil and soil N stock at depths of 0-100 cm is relatively insensitive to the changes in MAT.
Materials and methods
Study area
The study area was situated between latitudes 31.65 °N to 37.02 °N and longitudes 89.40 °E to 102.45 °E. The TRSR, also known as the “water tower of China” due to it consisting mainly of the Lancang (Mekong), Yellow, and Yangtze rivers, is situated in the central Tibetan Plateau which has the highest altitude, largest area, and most crowded distribution of rivers, lakes, and glaciers worldwide ([35]). Hence, despite the fragile ecological environment, the TRSR performs significant functions as an ecological security barrier for the Tibetan Plateau ([21]). Therefore, a nature reserve was established on the TRSR in 2000. Due to its unique geographical position and rich biodiversity, a Chinese national park was established in the TRSR in 2019. This upgrade from nature reserve to national park implied stricter management in the TRSR, ensuring less human disturbance. Alpine shrublands, a significant biome in the TRSR, is dominated by woody plants, such as Sibiraea laevigata, Potentilla fruticose, Rhododendron capitatum, and R. thymifolium, and many herbs, including Kobresia capillifolia, Leymus secalinus, Stipa purpurea, and K. parva. The main soil types in the region are leptosols, calcisols, chernozems, and cambisols, based on the soil classification system of the Food and Agriculture Organization (FAO) of the United Nations ([28]).
The climate of the TRSR represents a typical continental plateau climate ([10]). The mean altitude is 4000 m a.s.l., while the MATs and MAPs in the study area range from -5.6 to 3.8 °C and from 262 to 773 mm, respectively ([35]). Like the Tibetan Plateau, the TRSR is moving toward a warmer and wetter climate ([35]). Specifically, the MAT in the TRSR has been increasing by up to 0.27-0.33 °C every decade ([35]). Furthermore, MAP has also been increasing in the TRSR by up to 1.35 mm year-1 ([35]).
Field survey and laboratory measurements
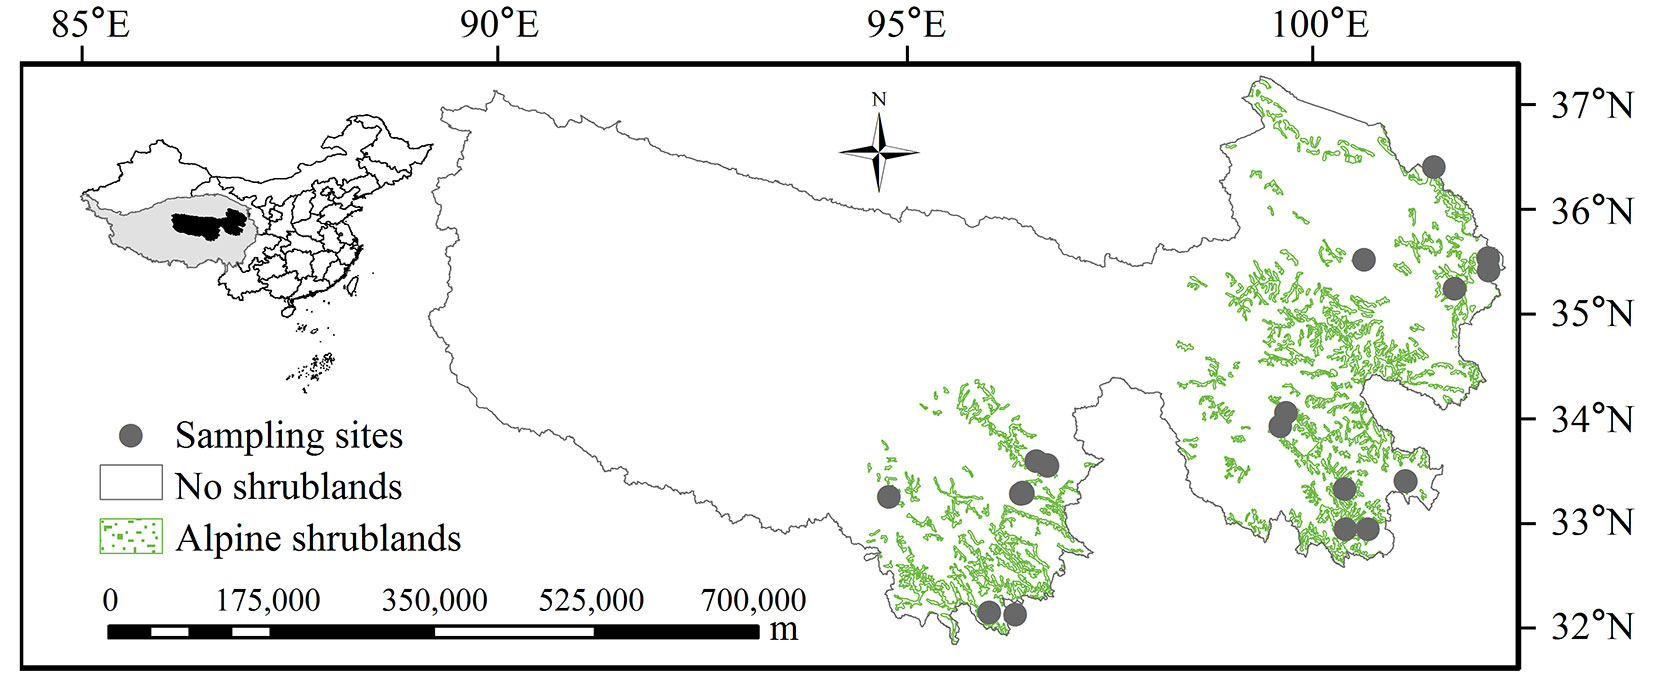
To estimate the soil N stock in the alpine shrublands of the TRSR, a total of 66 soil profiles were systematically sampled from 22 typical sites in the shrublands from July to August from 2011 to 2013 (Fig. 1). Field surveys were conducted following the method prescribed by the Technical Manual Writing Group of the Ecosystem Carbon Sequestration Project ([9]). First, we conducted a preliminary survey of potential study sites based on the 1:1.000.000 scale vegetation atlas of China (Fig. 1). Afterwards, we confirmed the representativeness of the selected sites in the field. These selected sites had to satisfy two requirements: (i) the dominant community of shrublands should be larger than 1oo m2; and (ii) the site should have a relatively even distribution of habitat, species composition, and community structure ([9]). At each site, geographical conditions, such as slope, were determined using a geological compass (DQY-1A®, Optical Instrument Company, Haerbin, China), and three 5 × 5 m plots were identified. The distance between them was never less than 5 m or further than 50 m. Primary vegetation characteristics, such as the ground cover of woody plants and dominant woody species were visually estimated and recorded in each plot. At each plot, a soil profile (1 m long × 1.5 m wide × 1 m deep) was dug for the collection of samples at different depths (0-10, 10-20, 20-30, 30-50, 50-70, and 70-100 cm). Three sub-samples were collected using a standard 100 cm3 cylindrical container (height: 50 mm; diameter: 50.5 mm) for each depth and then mixed to form one composite sample per plot. The sample was dried at 105 °C for 24 h in the lab and then gravimetrically weighed. The soil bulk density of each sampled horizon was calculated as the ratio between the dry weight and total volume. Soil samples were then sieved at 2.0 mm. SOC was measured through wet oxidation following the Walkley-Black method, and organic matter was oxidised by adding sulphuric acid to potassium dichromate. Total soil N was measured through dry combustion using an elemental analyser (2400 CHNS/O® elemental analyser, Perkin-Elmer, Waltham, MA, USA). The temperatures for combustion and reduction were set to 950 °C and 640 °C, respectively.
Fig. 1 - The distribution of 22 sampling sites in the shrublands of the Three Rivers Source Region shown on a 1:1.000.000 scale background vegetation map ([7]).
Climate data
To analyse the effects of climatic factors on soil N stock, the MAT data for each site were obtained from the WorldClim database (⇒ http://www.worldclim.org/), with a spatial resolution of 1 × 1 km ([14]).
Data analysis
To determine the soil N stock and storage (their results and corresponding standard deviations using the 22 sites) at each soil depth, the following formulas were used (eqn. 1, eqn. 2).
where ND is the soil N stock (kg N m-2), Ti is the soil thickness (cm), Ni is the total N content (g kg-1), BDi is the bulk density (g cm-3), and Ci is the volume percentage of the fraction > 2 mm in layer i (cm). In eqn. 2, NSi is the soil N storage at layer i (cm), and Area is the area of shrublands across the TRSR.
The effects of MAT, SOC, and topographical slope of the shrublands on soil N stock were determined using ordinary least squares regression. Curve estimation was used to estimate the relationship between the ground cover of shrublands and soil N stock. Normality and homogeneity of variance were satisfied, and one-way analysis of variance (ANOVA) was used to compare the differences between various dominant community types. These analyses were performed using SPSS® v. 22.0 (IBM Corporation, Armonk, NY, USA) and the graphs were drawn using Origin® 2017 (OriginLab, Northampton, MA, USA). Variables that did not significantly contribute to the soil N stock were excluded from the variation partitioning analysis. The variation in soil N stock at depths of 0-30, 30-50, and 50-100 cm layers was partitioned using four explanatory factors that included SOC, slope, ground cover, MAT, and their combined effects. This analysis was performed using the “vegan” R software package ([36]).
Results
Storage, stock, and content of soil N in TRSR shrublands
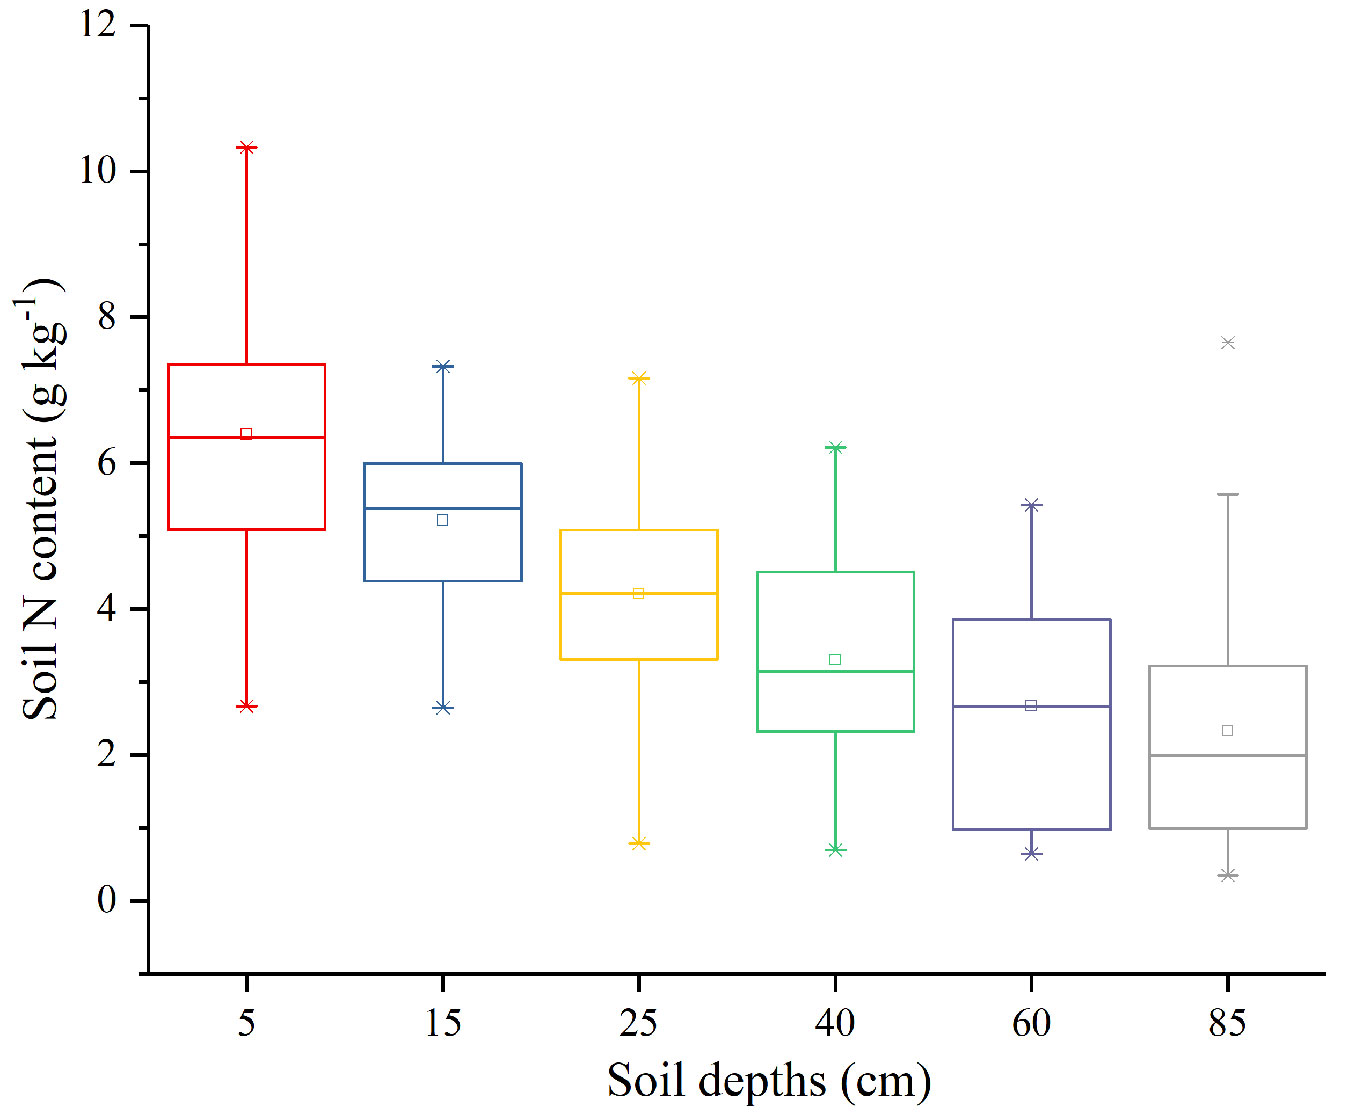
The soil N storage in the TRSR shrublands was 63.10 ± 27.41 Tg at 0-100 cm soil depth interval, with an average soil N stock of 2.44 ± 1.06 kg m-2 (Tab. 1). The soil N content decreased with increasing soil depth and at the soil depth intervals of 0-10, 10-20, 20-30, 30-50, 50-70, 70-100 cm, it was found to be 6.44 ± 1.83, 5.23 ± 1.25, 4.25 ± 1.44, 3.32 ± 1.47, 2.68 ± 1.54, and 2.34 ± 1.93 g kg-1, respectively (Fig. 2).
Tab. 1 - Stock and storage of soil nitrogen (N) from soil surface to a depth of 100 cm in the shrublands of the Three Rivers Source Region. The results of soil N storage are shown as mean values ± standard deviation (SD).
| Soil depth (cm) |
Soil N stock (kg m-2) | Soil N storage (Tg) |
|||
|---|---|---|---|---|---|
| Min | Max | Mean | SD | ||
| 0-10 | 0.14 | 0.79 | 0.40 | 0.17 | 10.43 ± 4.44 |
| 0-20 | 0.35 | 1.45 | 0.80 | 0.28 | 20.78 ± 7.35 |
| 0-30 | 0.45 | 1.87 | 1.14 | 0.38 | 29.44 ± 9.72 |
| 0-50 | 0.61 | 2.69 | 1.64 | 0.54 | 42.40 ± 14.02 |
| 0-70 | 0.61 | 3.58 | 2.02 | 0.75 | 52.22 ± 19.39 |
| 0-100 | 0.61 | 4.72 | 2.44 | 1.06 | 63.10 ± 27.41 |
Fig. 2 - Soil nitrogen (N) content at different soil depths across the shrublands of the Three Rivers Source Region.
Factors controlling soil N stock in TRSR shrublands
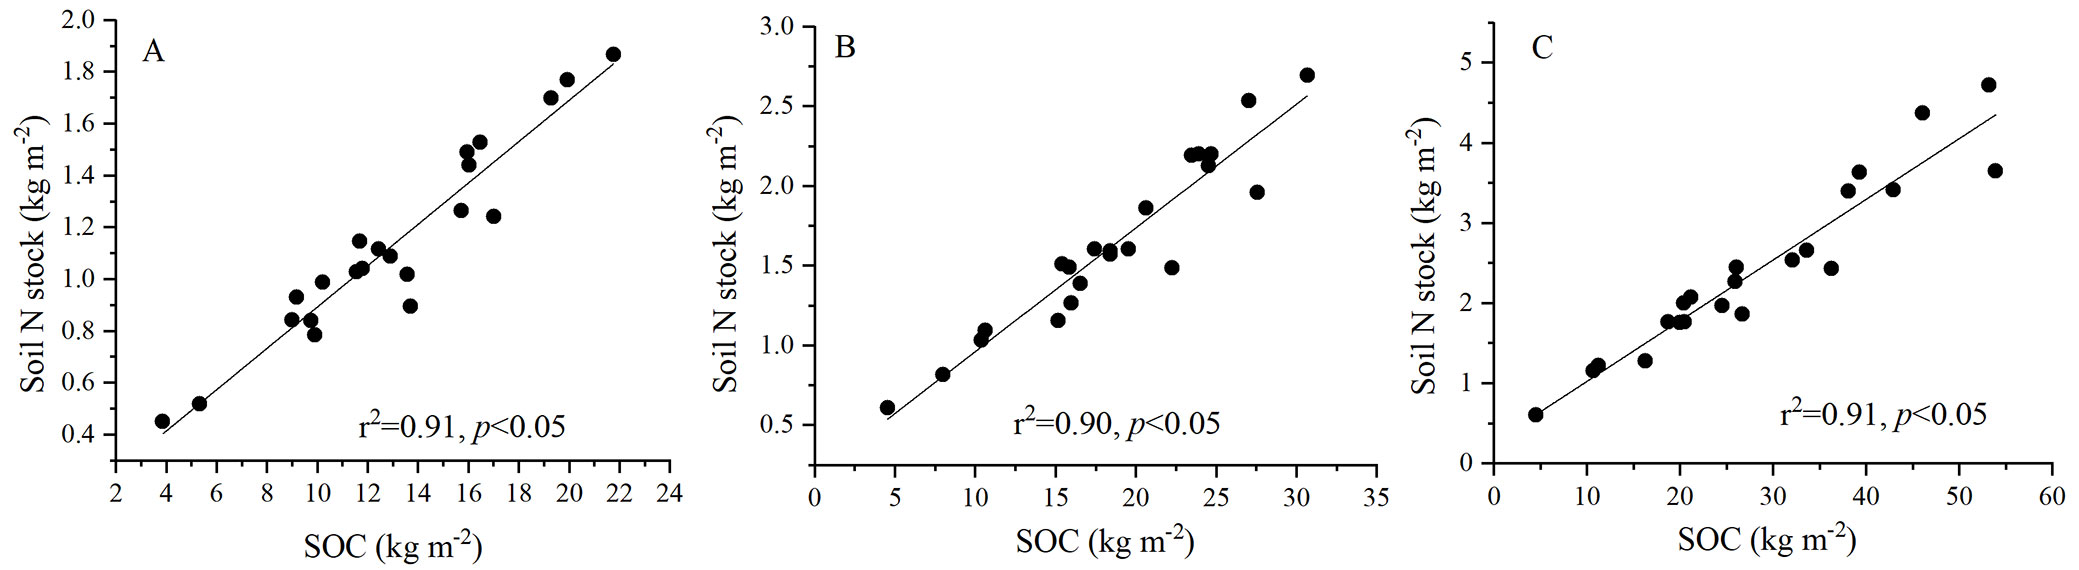
SOC significantly affected soil N stock (Fig. 3). Specifically, soil N stock increased with SOC at soil depth intervals of 0-30 cm (Fig. 3A), and similar observations were made at soil depth intervals of 0-50 (Fig. 3B) and 0-100 cm (Fig. 3C).
Fig. 3 - Relationship between soil organic carbon (SOC) and soil nitrogen (N) stock in the shrublands of the Three Rivers Source Region at the soil depth intervals of (A) 0-30 cm, (B) 0-50 cm, and (C) 0-100 cm.
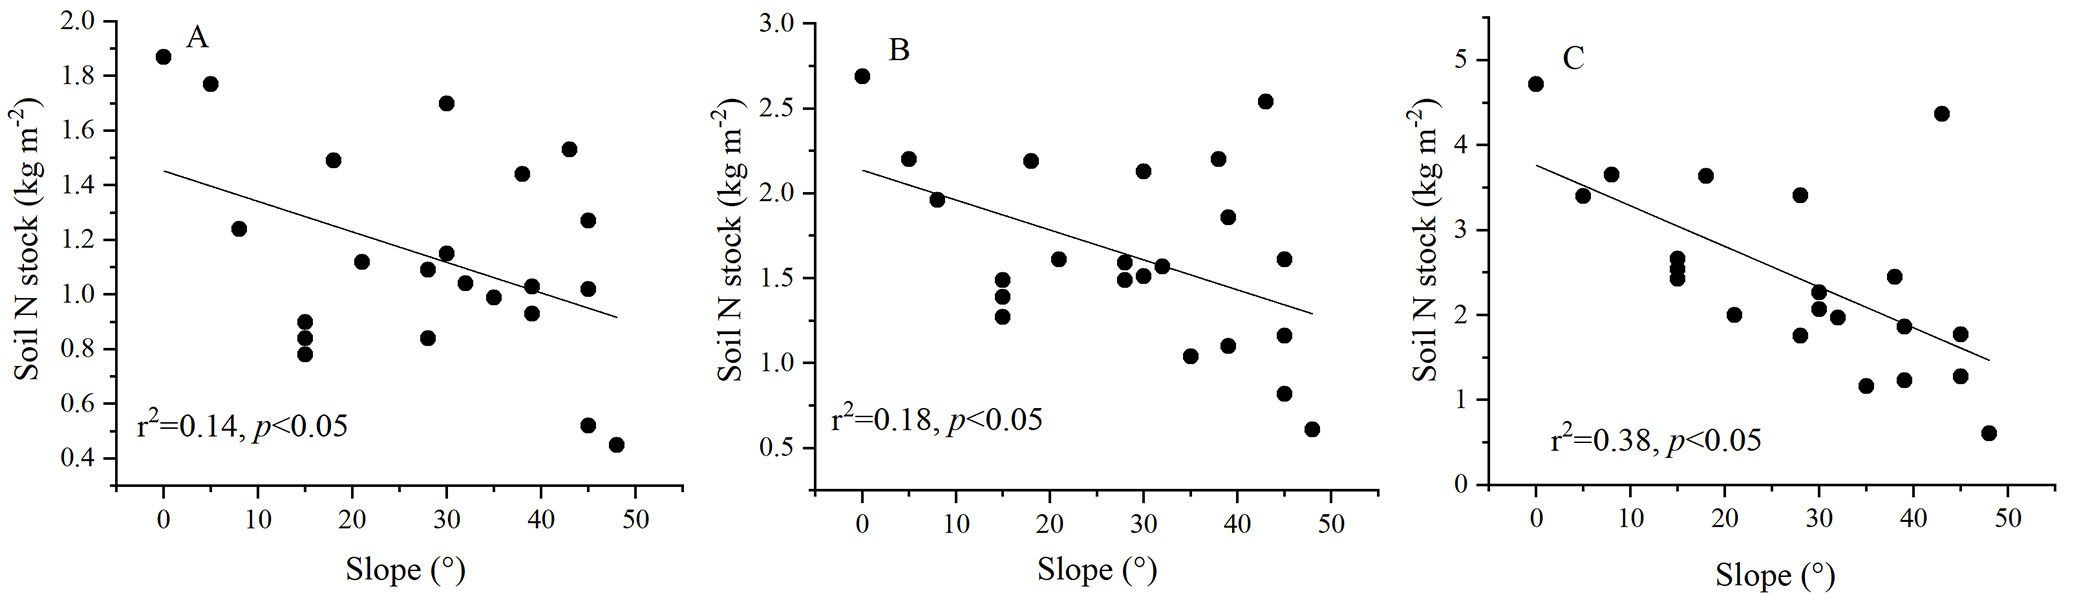
Slope was also found to significantly affect soil N stock (Fig. 4). However, contrary to the relationship between SOC and soil N density, soil N stock decreased with increasing slope at the soil depth interval of 0-30 cm (Fig. 4A), and similar observations were made at depth intervals of 0-50 (Fig. 4B) and 0-100 cm (Fig. 4C).
Fig. 4 - Relationship between slope and soil nitrogen (N) stock in the shrublands of the Three Rivers Source Region at the soil depth intervals of (A) 0-30 cm, (B) 0-50 cm, and (C) 0-100 cm.
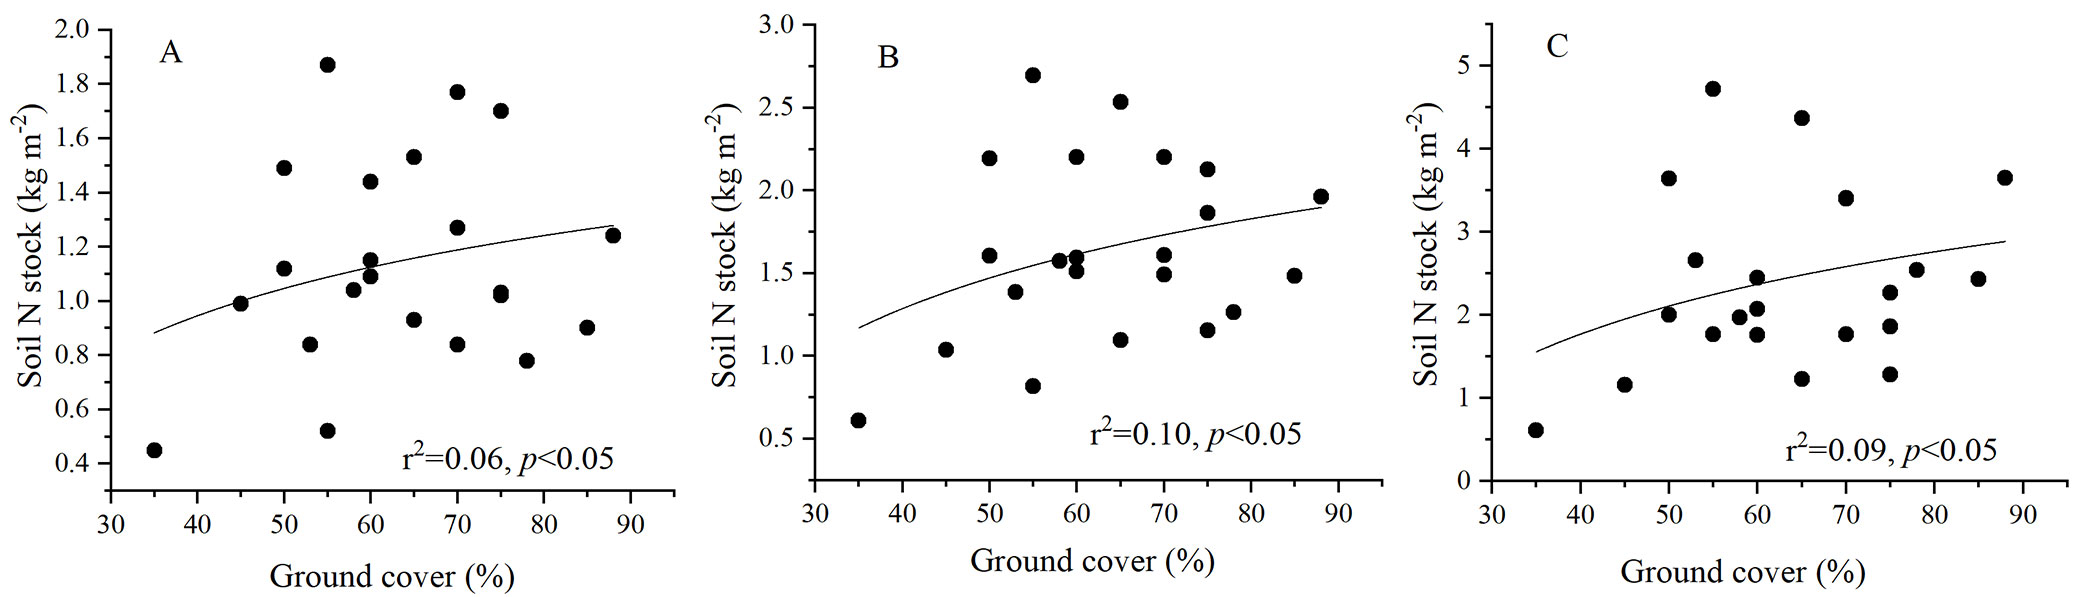
The ground cover of shrublands can significantly stimulate the accumulation of soil N stock; indeed, it was observed to increase with ground cover at all soil depth intervals of 0-30 (Fig. 5A), 0-50 (Fig. 5B), and 0-100 cm (Fig. 5C).
Fig. 5 - Relationship between ground cover and soil N stock in the shrublands of the Three Rivers Source Region at the soil depth intervals of (A) 0-30 cm, (B) 0-50 cm, and (C) 0-100 cm.
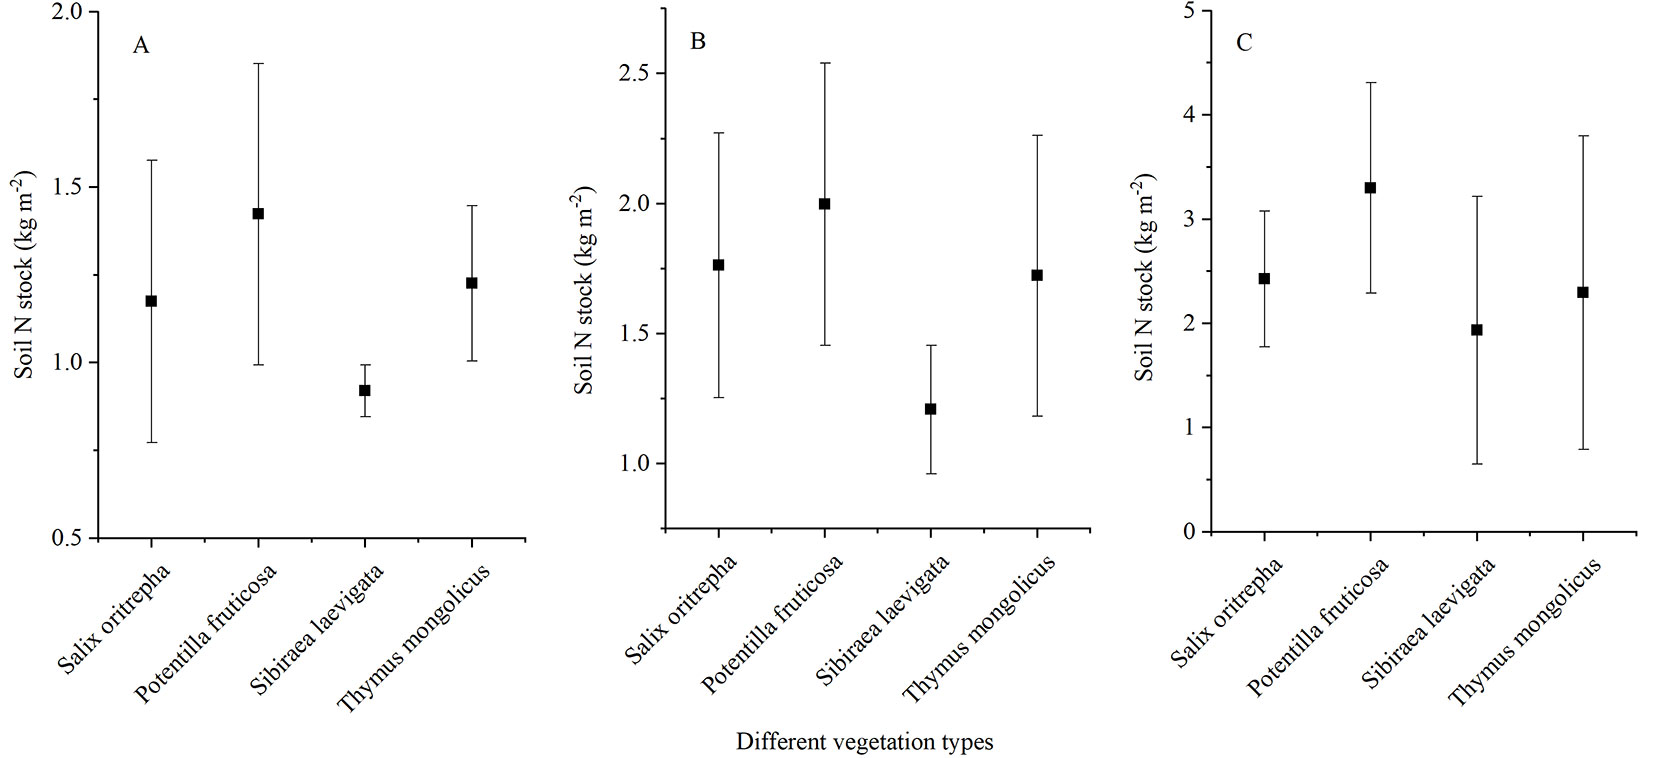
Soil N stock differences were observed for different shrubland community types, especially for P. fruticose and S. laevigata (Fig. 6). However, these differences were not significant (p > 0.05) according to the ANOVA results.
Fig. 6 - Relationship between vegetation types and soil N stock in the shrublands of the Three Rivers Source Region at the soil depth intervals of (A) 0-30 cm, (B) 0-50 cm, and (C) 0-100 cm. The solid black squares and error bars represent the mean of each measurement and corresponding standard deviations, respectively.
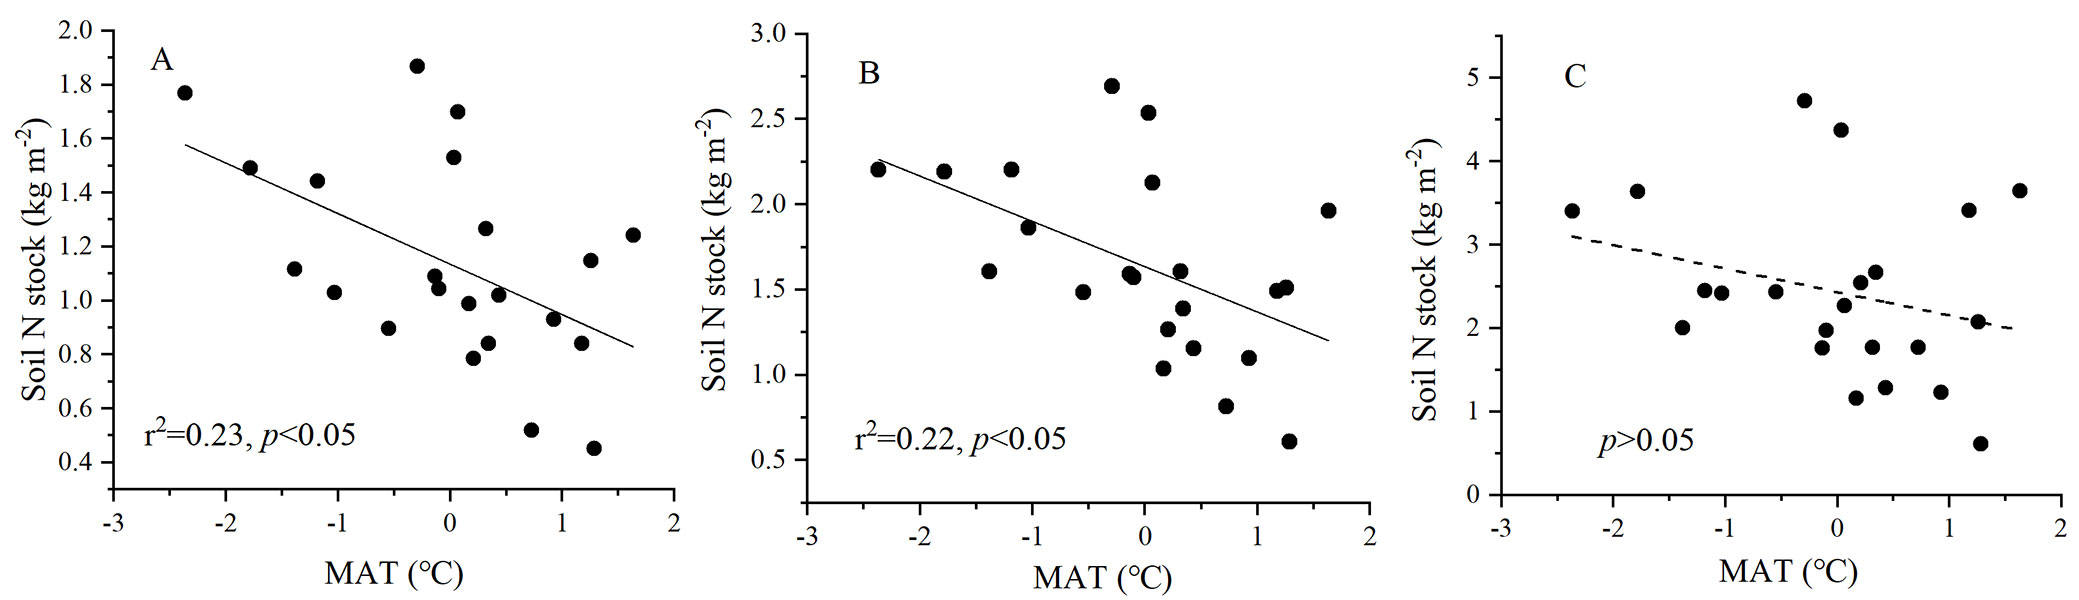
Soil N stock was found to significantly decrease with increasing MAT (p < 0.05) at soil depth intervals of 0-30 (Fig. 7A) and 0-50 cm (p < 0.05 - Fig. 7B). However, a decreasing trend was not observed at soil depth intervals of 0-100 cm (p > 0.05 - Fig. 7C), which supported the hypothesis that the effects of MAT on soil N stock were concentrated in the topsoil, with deeper soils having a small effect.
Fig. 7 - Relationships between mean annual temperature (MAT) and soil nitrogen (N) stock in the shrublands of the Three Rivers Source Region at the soil depth intervals of (A) 0-30 cm, (B) 0-50 cm, and (C) 0-100 cm.
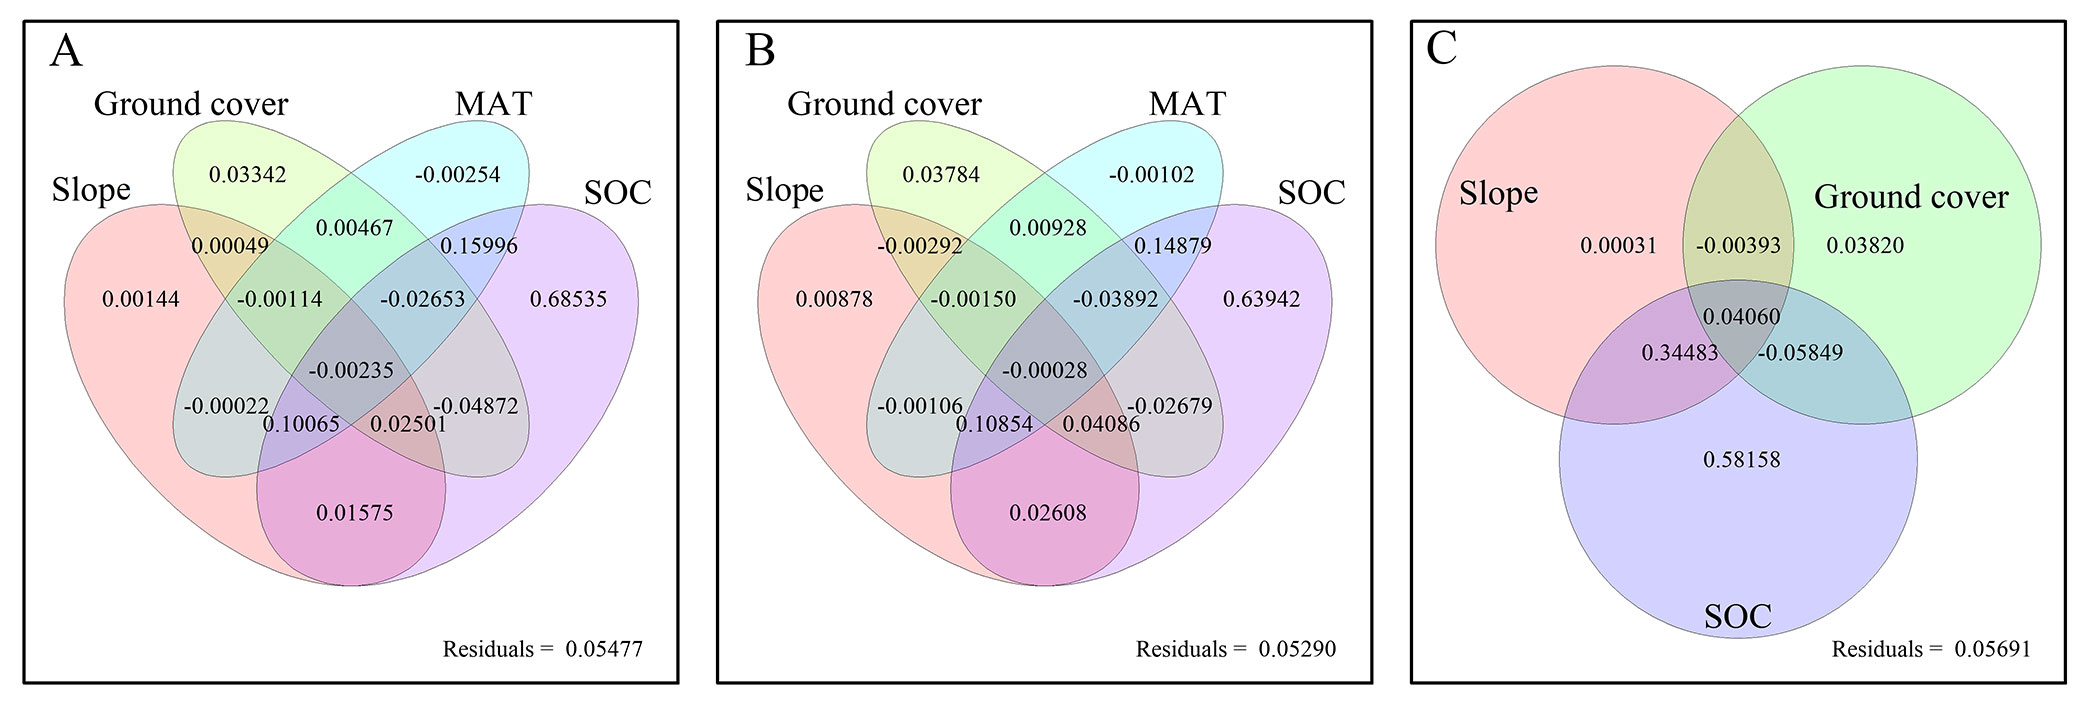
Variables, such as slope, ground cover, SOC, and MAT, can significantly affect soil N stock at soil depth intervals of 0-30 and 0-50 cm; thus, these variables were selected to conduct variation partitioning analyses. Considering that the effect of MAT on soil N stock was insignificant at the soil depth interval of 0-100 cm, it was not included in the variation partitioning analyses for this depth interval. The results showed that the soil N stock was effectively explained by the selected variable, supporting the hypothesis. The amount of variation captured by all selected factors was 94.52%, 94.71%, and 94.31% for soil N stock at soil depth intervals of 0-30, 0-50, and 0-100 cm, respectively (Fig. 8). Individual SOC explained the most variations in the soil N stock for up to 68.54%, 63.94%, and 58.16% at soil depth intervals of 0-30, 0-50, and 0-100 cm, respectively (Fig. 8).
Fig. 8 - Results of variation partitioning analysis for soil nitrogen (N) stock at the soil depth intervals of in (A) 0-30 cm, (B) 0-50 cm, and (C) 0-100 cm across the shrublands of the Three Rivers Source Region. Variation partitioning analysis consists of explained variation, including effects of slope, ground cover, soil organic carbon (SOC), mean annual temperature (MAT), and their joint effects, and unexplained variations.
Discussion
Relationship between SOC and soil N stock
Soil N stock was observed to increase with increasing SOC at all soil depth intervals of 0-30, 0-50, and 0-100 cm across the shrublands of the TRSR (Fig. 3). Similar observations have been made for the Loess Plateau ([11]). It has been demonstrated that N in soil is mainly determined by the decomposition and accumulation of soil organic matter ([44], [11]), which corresponds with the positive correlation observed between soil N stock and SOC.
In the TRSR, SOC has been demonstrated to contribute to a potential sink ([32]). Considering that and the positive correlation observed between SOC and soil N stock, a potentially increasing soil N can be inferred in future.
Relationship between soil N stock and slope
Variations in topography can result in different microclimates, inducing different plant growth and soil properties ([20]). It has been demonstrated that, although slope does not directly affect soil N storage in the grasslands of northern China, it can affect factors such as soil pH and bulk density, which can limit soil N storage ([42]). In this study, soil N stock was found to decrease with increasing slope. A steep slope can lead to soil erosion, which can significantly damage the environment and result in the loss of finer soil particles with higher N stock ([5]). Therefore, soil N stock was observed to decrease with increasing slope across the shrublands of the TRSR.
The negative relationship between soil N stock and slope indicated that conservation of soil by revegetation or reduced grazing to restrain soil erosion is necessary to maintain soil fertility ([13]).
Relationship among vegetation type, ground cover, and soil N stock
The amount of soil N storage is related to biotic processes, including decomposition of organic matter and productivity of plants ([34], [3]). Hence, vegetation type significantly affects soil N distribution ([41]). However, some studies have indicated that vegetation type is a poor predictor of soil N stock in China ([37]), consistent with our finding that the effects of different dominant shrubland communities on soil N stock were small in the TRSR. Similarly, in temperate and boreal forests, vegetation types have been found to have only a small impact on soil N storage ([24]). This difference could be due to high soil heterogeneity ([37]), which indicates that regional research on factors controlling soil N stock is significant for understanding terrestrial N cycles.
Higher ground cover of shrublands can stimulate the accumulation of soil N storage in the shrublands of the TRSR. Increased ground cover is derived from a growing shrubland canopy, which can stimulate more litter input to soil ([8]), thus increasing soil N stock. It has been demonstrated that climatic changes increase the ground cover of shrublands at high latitudes ([29]) and arctic and alpine regions ([27]), indicating that an increase in soil N storage may occur in the future ([23]).
Relationship between soil N stock and MAT
Increasing temperatures can accelerate microbial metabolism, which can contribute to gaseous losses by denitrification and volatilisation, decreasing the soil N stock ([17]). An increase in plant growth in the shrublands of the TRSR ([31]) has also contributed to the uptake of nutrients by plant roots, decreasing the soil N stock ([17]). However, it should be noted that in cold and wet regions, low temperatures generally limit plant growth ([40]). An increasing MAT has been demonstrated to stimulate aboveground biomass in the shrublands of the TRSR ([31]). Thus, more litter is transferred to the soil as one of the primary input resources ([24]), which aids in increasing the soil N stock. The effects of limited accumulation of N may exceed the positive effects on soil N stock, resulting in a negative relationship between MAT and soil N stock.
It has been found that soil N stock at soil depth intervals of 0-30 cm decreases with increasing MAT in the alpine shrublands of the Tibetan Plateau ([30]). Furthermore, this study demonstrated that soil N stock at a soil depth of 0-100 cm was independent of MAT, which showed that the soil N stock in deeper soils, such as at 50-100 cm depth, was less affected by MAT in the shrublands of the TRSR.
Amid the growing effects of global warming, MAT has been increasing by 1.5 °C in the TRSR ([35]). Considering only the negative relationship between temperature and soil N stock (Fig. 7), soil N storage was found to decrease. However, N dioxides have been anthropogenically emitted and may increase further ([22]). Further, global warming not only affects plant growth but also shifts plant species across the tundra ecosystem ([40]), changing the nutrient cycle. Therefore, long-term monitoring of changes in soil N stock is necessary to improve the precision of N storage estimation across the shrublands of the TRSR.
Controlling factors of soil N stock
The controlling factors of soil N stock in the shrublands can explain most soil N stock variables, with the unexplained variations being only 5.48%, 5.29%, and 5.69% at soil depth intervals of 0-30, 0-50, and 0-100 cm, respectively (Fig. 8), indicating that the factors controlling soil characteristics ([1]), topography ([42]), vegetation properties ([24]), and climatic factors ([19]) significantly affected the soil N stock. The dominant variable that determined the soil N stock was SOC across the shrublands of the TRSR. The individually explained variable of soil N stock from SOC was as high as 68.54%, 63.94%, and 58.16% at soil depth intervals of 0-30, 0-50, and 0-100 cm, respectively (Fig. 8), which indicated that SOC was a robust factor controlling the soil N stock in the shrublands of the TRSR.
Conclusions
Across the shrublands in the TRSR, total soil N storage at the soil depth interval of 0-100 cm was 63.10 ± 2 7.41 Tg and the average soil N stock was 2.44 ± 1.06 kg m-2. Increasing the ground cover of shrublands stimulated soil N accumulation. However, MAT and topographical slope were negatively related to soil N stock. Furthermore, the effect of MAT on soil N stock was concentrated on the topsoil. Most soil N stock variations were explained by climatic factors, soil characteristics, topography, and vegetation type in the TRSR, with SOC explaining the largest variation. In the global climate change scenarios, long-term monitoring of changes in soil N stock is necessary to improve the estimation of soil N stock across the shrublands of the TRSR in the Tibetan Plateau.
Acknowledgements
We thank Zebing Zhong, Wenzhu Song, Hechun Liu, Changbin Li, Yi Ning and Feng Xiong for facilitating our field surveys on the Tibetan Plateau and for their laboratory assistance. This study was funded by the National Key Research and Development Program of China (2019YFC0507404), the National Program on Basic Work Project of China (2015FY11030001-5), Natural Science Foundation of Qinghai (2019-ZJ-910), Qinghai Province International Exchange and Cooperation Project (2019-HZ-807), and the Strategic Priority Research Program of CAS (XDA0505030304).
References
Gscholar
CrossRef | Gscholar
Gscholar
Gscholar
Gscholar
Authors’ Info
Authors’ Affiliation
Dong Wang
Key Laboratory of Tree Breeding and Cultivation of the State Forestry Administration, Research Institute of Forestry Chinese Academy of Forestry, Beijing 100091 (China)
Research Institute of Natural Protected Area, Chinese Academy of Forestry, Beijing 100091 (China)
Guoying Zhou 0000-0003-2485-6172
Key Laboratory of Tibetan Medicine Research, Northwest Institute of Plateau Biology, Chinese Academy of Science, Xining 810008 (China)
Guoying Zhou 0000-0003-2485-6172
Qinghai Key Laboratory of Qing-Tibet Biological Resources, Xining, 810008 (China)
Corresponding author
Paper Info
Citation
Nie X, Wang D, Yang L, Zhou G (2020). Controlling soil total nitrogen factors across shrublands in the Three Rivers Source Region of the Tibetan Plateau. iForest 13: 559-565. - doi: 10.3832/ifor3533-013
Academic Editor
Giorgio Alberti
Paper history
Received: May 22, 2020
Accepted: Sep 20, 2020
First online: Nov 29, 2020
Publication Date: Dec 31, 2020
Publication Time: 2.33 months
Copyright Information
© SISEF - The Italian Society of Silviculture and Forest Ecology 2020
Open Access
This article is distributed under the terms of the Creative Commons Attribution-Non Commercial 4.0 International (https://creativecommons.org/licenses/by-nc/4.0/), which permits unrestricted use, distribution, and reproduction in any medium, provided you give appropriate credit to the original author(s) and the source, provide a link to the Creative Commons license, and indicate if changes were made.

Web Metrics
Breakdown by View Type
Article Usage
Total Article Views: 37942
(from publication date up to now)
Breakdown by View Type
HTML Page Views: 31550
Abstract Page Views: 3297
PDF Downloads: 2398
Citation/Reference Downloads: 4
XML Downloads: 693
Web Metrics
Days since publication: 2070
Overall contacts: 37942
Avg. contacts per week: 128.31
Article Citations
Article citations are based on data periodically collected from the Clarivate Web of Science web site
(last update: Jul 2026)
Total number of cites (since 2020): 8
Average cites per year: 1.14
Publication Metrics
by Dimensions ©
Articles citing this article
List of the papers citing this article based on CrossRef Cited-by.
Related Contents
iForest Similar Articles
Research Articles
Thinning effects on soil and microbial respiration in a coppice-originated Carpinus betulus L. stand in Turkey
vol. 9, pp. 783-790 (online: 29 May 2016)
Research Articles
Estimating changes in soil organic carbon storage due to land use changes using a modified calculation method
vol. 8, pp. 45-52 (online: 17 June 2014)
Research Articles
The losses of condensed tannins in six foliar litters vary with gap position and season in an alpine forest
vol. 9, pp. 910-918 (online: 04 August 2016)
Research Articles
Soil fauna communities and microbial activities response to litter and soil properties under degraded and restored forests of Hyrcania
vol. 14, pp. 490-498 (online: 11 November 2021)
Research Articles
Soil stoichiometry modulates effects of shrub encroachment on soil carbon concentration and stock in a subalpine grassland
vol. 13, pp. 65-72 (online: 07 February 2020)
Research Articles
Wood-soil interactions in soil bioengineering slope stabilization works
vol. 2, pp. 187-191 (online: 15 October 2009)
Research Articles
Carbon storage and soil property changes following afforestation in mountain ecosystems of the Western Rhodopes, Bulgaria
vol. 9, pp. 626-634 (online: 06 May 2016)
Research Articles
Soil respiration along an altitudinal gradient in a subalpine secondary forest in China
vol. 8, pp. 526-532 (online: 01 December 2014)
Research Articles
Impact of deforestation on the soil physical and chemical attributes, and humic fraction of organic matter in dry environments in Brazil
vol. 15, pp. 465-475 (online: 18 November 2022)
Research Articles
The manipulation of aboveground litter input affects soil CO2 efflux in a subtropical liquidambar forest in China
vol. 12, pp. 181-186 (online: 10 April 2019)
iForest Database Search
Search By Author
Search By Keyword
Google Scholar Search
Citing Articles
Search By Author
Search By Keywords
PubMed Search
Search By Author
Search By Keyword


