Facilitating objective forest land use decisions by site classification and tree growth modeling: a case study from Vietnam
iForest - Biogeosciences and Forestry, Volume 12, Issue 6, Pages 542-550 (2019)
doi: https://doi.org/10.3832/ifor2945-012
Published: Dec 17, 2019 - Copyright © 2019 SISEF
Research Articles
Abstract
Onsite information pertaining to forest growth potential is a significant prerequisite for selecting suitable forest plantation locations and safeguards sustainable timber production and income generation. In the scope of forest landscape restoration, the selection of the most suitable sites for reforestation remains a major issue. The current study introduces an operational, objective, and straightforward methodology for the identification and prioritization of sites that are suitable for forest plantations. The methodology is based on an approach that combines land use suitability assessment with site-specific growth and yield predictions. The land use suitability assessment is based on a methodological framework presented by the Food and Agriculture Organization (FAO). In a study area in Vietnam four different suitability classes are defined for the species Acacia mangium (A. mangium). Field assessments in existing A. mangium plantations were utilized to develop yield models. Among the Korf, Gompertz, and Chapman-Richards growth equations Korf performed the best for all suitability classes. Prioritization of sites is realized by the analytical hierarchy process (AHP). Our study offers a pragmatic approach for selecting the most suitable sites for large-scale forest restoration activities. Integrating growth and yield predictions supports reforestation practices and promotes sustainable timber production.
Keywords
Acacia mangium, Suitability, Analytical Hierarchy Process, Volume Growth, Vietnam
Introduction
A net annual decrease in forest area of 3.3 million ha per year was recorded in the period between 2010 and 2015, but planted forests increased by a net 3.1 million ha per year and now cover 7 % of the global forest area ([19]). Afforestation programs and plantation forestry generally strive to satisfy timber demand and compensate for deforestation. According to Borges et al. ([6]) the global timber volume produced in planted areas will increase from 1.4 billion m3 in 2005 to 1.7 billion m3 in 2030. Forest Landscape Restoration (FLR) is an initiative aimed at the reduction of degraded land through the restoration by multi-functional forest ecosystems and the improvement of forest growth quality in the landscape for the both people and biodiversity ([31]).
Globally, 30% of the land surface is covered by forests which store 45% of the terrestrial carbon ([5]). Deforestation reduces the forest landscape and diminishes carbon stocks. Deforestation and forest degradation cause 17-25% of the annual anthropogenic greenhouse gas emissions and remain the main drivers of global warming ([27]). Many activities have been implemented to reduce deforestation and forest degradation especially in developing countries. Under the United Nations Program on Reducing Emission from Deforestation and Forest Degradation (REDD+) financial incentives for implementing large-scale FLR programs have been provided to 64 developing countries with the objective to conserve forest carbon stocks, promote sustainable forest management and boost forest carbon stocks ([35], [9]).
Afforestation and reforestation contribute to an increase in forest cover and a rise in forest carbon stocks worldwide ([18]). Furthermore, many countries, including Vietnam, are responding to the New York Declaration on Forests, by cutting the loss of natural forest in half by 2020, attempting to stop the loss of natural forest by 2030, and by reducing annual emission by 4.5 to 8.8 billion tonnes of CO2 through forest protection and restoration. The extension of forest areas through afforestation and reforestation along with improved forest productivity in forest plantations are solutions for contributing to the successful restoration of globally degraded and deforested land as well as the mitigation of global greenhouse gas emissions as called for by the New York Declaration and Bonn Challenge (⇒ https://forestdeclaration.org/⇒ https://forestdeclaration.org/, ⇒ https://www.bonnchallenge.org/⇒ https://www.bonnchallenge.org/).
Vietnam is committed to increasing its forest cover. Since 1990 the forested area has continuously been enlarged and reached 41.5% of total land area in 2014. From 1990 to 2015 the area of forest plantations increased on average by 107.800 hectares annually ([20]). Currently, more than 3.5 million hectares are covered by forest plantations. Most of the timber grown in forest plantations is used for the production of pulp and paper. Many major national programs have been initiated for afforestation and reforestation purposes ([11]). The national afforestation program 661, also called the Five Million Hectare Reforestation Program (5MHRP), implemented between 1998 and 2010 focused on reforesting degraded land ([24]). One of the main incentives for increased forest plantation expansion are the government policies on forest land allocation ([10]). By 2020 forest plantations are estimated to cover 4.1 million hectares ([37]).
Land suitability assessments aim at identifying the most appropriate spatial pattern for future land use in order to meet specific demands ([15], [17]). Land suitability assessments are essential prerequisites for establishing forest plantations ([40]). In the current study, site condition classification for growing A. mangium is based on a land suitability evaluation technique developed by FAO ([15]). Timber production is selected as the land use of interest and land use suitability analysis focuses on the identification of suitable locations for afforestation with A.mangium to allow for sustainable timber production. This method matches the ecological requirements of A. mangium with site conditions. Land suitability classification serves the estimation of timber growth.
Timber growth depends on site conditions and, inversely, produced timber growth reflects site productivity. Timber volume growth depends on natural factors such as soil properties, climate, and topography and can be considered an indicator directly linked to site productivity ([46]). In addition, timber volume growth is also considered an indicator of sustainability. Taking into account site-depended growth patterns, land suitability classification for A. mangium forest plantations is combined with a site-specific growth model in order to obtain reliable information on potential timber production.
Vietnam is meeting the challenges of sustainable forest development in rural areas. High population numbers and the associated poverty as well as the dependence of the poorest sections of the population on forest resources represent special challenges for the development of a sustainable forest economy. According to Pham et al. ([36]), in Vietnam 25 million forest-dependent people earn 20% of their income from forest resources. In addition, the demand of the wood-processing industry is constantly increasing due to the country’s growing economy. On the other hand, there is only low profit growth and low productivity in the plantation economy, which is why there is an urgent need for action here. The selection of suitable areas for growing forest plantations is a crucial issue for the further development of the forest and timber sector in Vietnam, especially given the current situation of limited land availability. Finding suitable plantation areas is also key to meeting the demand for sustainably produced timber, ensuring the long-term success of forest industries, increasing local incomes and contributing to poverty alleviation. Therefore, the overall objectives of this study provide technical guidance in site selection and on the readiness of FLR under sustainable forest management initiatives.
The specific objectives of the study are: (i) to identify site suitability and (ii) to identify site-specific timber growth as parameters to select sites for the establishment of forest plantations.
Materials and methods
Study area and species
Thai Nguyen Province is located in Northeastern Vietnam and covers an area of slightly more than 350,000 ha, with 87,000 ha of planted forests and 94,000 ha of natural forests. The elevation ranges from about 50 m to more than 900 m a.s.l. The slope of the terrain varies between 0 and more than 35 degrees. The mean annual temperature is approximately 24 °C and total annual precipitation is about 1700 mm ([2]).
In the study area, forests are classified as production, protection and special-use forests. The main objectives of the production forest are to provide timber, non- timber forest products in conjunction with environmental protection. In the recent years, there has been an increase in demand for timber from forest plantations, while the timber supply from forest plantations is probably not sufficient to keep pace with the increasing timber demand. Thai Nguyen Province was selected to conduct the research to enhance effective utilization of forest land through selecting suitable forest lands for forest plantations.
The study focuses on commercial forest plantations that supply timber to be processed in wood mills. The study species is Acacia mangium Willd. This species, which is also known by its local name Keo tai tuong, is one of the fastest-growing tree species in Vietnam ([44]), and belongs to the family Leguminosae, sub-family Mimosoideae. The species originates from the humid tropical forests of Northeastern Australia, Papua New Guinea, and the Molucca Islands in Eastern Indonesia ([29]). According to Harwood & Nambiar ([22]), Acacia plantations in Vietnam (e.g., A. auriculiformis, A. mangium, and a hybrid of A. auriculiformis and A. mangium) covered around 1.1 million ha in 2013, of which 600,000 ha were stocked by A. mangium and mainly located in North Vietnam. In the study area, almost all of the harvested A. mangium timber is used to produce woodchips and pulpwood as raw materials for domestic use and export.
Desirable properties of Acacia mangium include rapid growth, good wood quality and tolerance to a variety of soils and environments. It grows well on lateritic soils with high concentrations of iron and aluminum oxides, but is intolerant to saline conditions and shade. Acacia trees fix atmospheric nitrogen so that, in contrast to Eucalyptus, they increase the amount of nitrogen in the soil. Good management helps to minimise soil loss and fertility decline ([29]).
Procedure of land suitability evaluation
We implemented a land suitability classification based on the FAO framework ([15]). The physical land suitability evaluation focuses on growth conditions for A. mangium and does not consider socio-economic criteria. A land suitability assessment is performed in three steps.
Step 1: Selection of factors for bio-physical land suitability evaluation
Factors to be utilized for the assessment of land suitability should be readily available to forest managers ([3]) and have a close relationship to forest productivity. The ecological requirements of A. mangium presented by Krisnawati et al. ([29]) were used to identify three factors, which are further defined by attributes, for the assessment of land suitability for establishing plantations:
- Soil properties (soil type, soil depth): soil properties were derived from the digital soil map provided by the Vietnam Academy of Agriculture Sciences (VAAS). The map was created in 2005 and includes soil type and soil depth information.
- Topography (elevation, slope): a digital elevation model (DEM) was obtained from the Shuttle Radar Topographic Mission (SRTM) at a resolution of 30 × 30 m (downloaded from ⇒ http://srtm.csi.cgiar.org/) and was provided by the Consortium for Spatial Information (CSI).
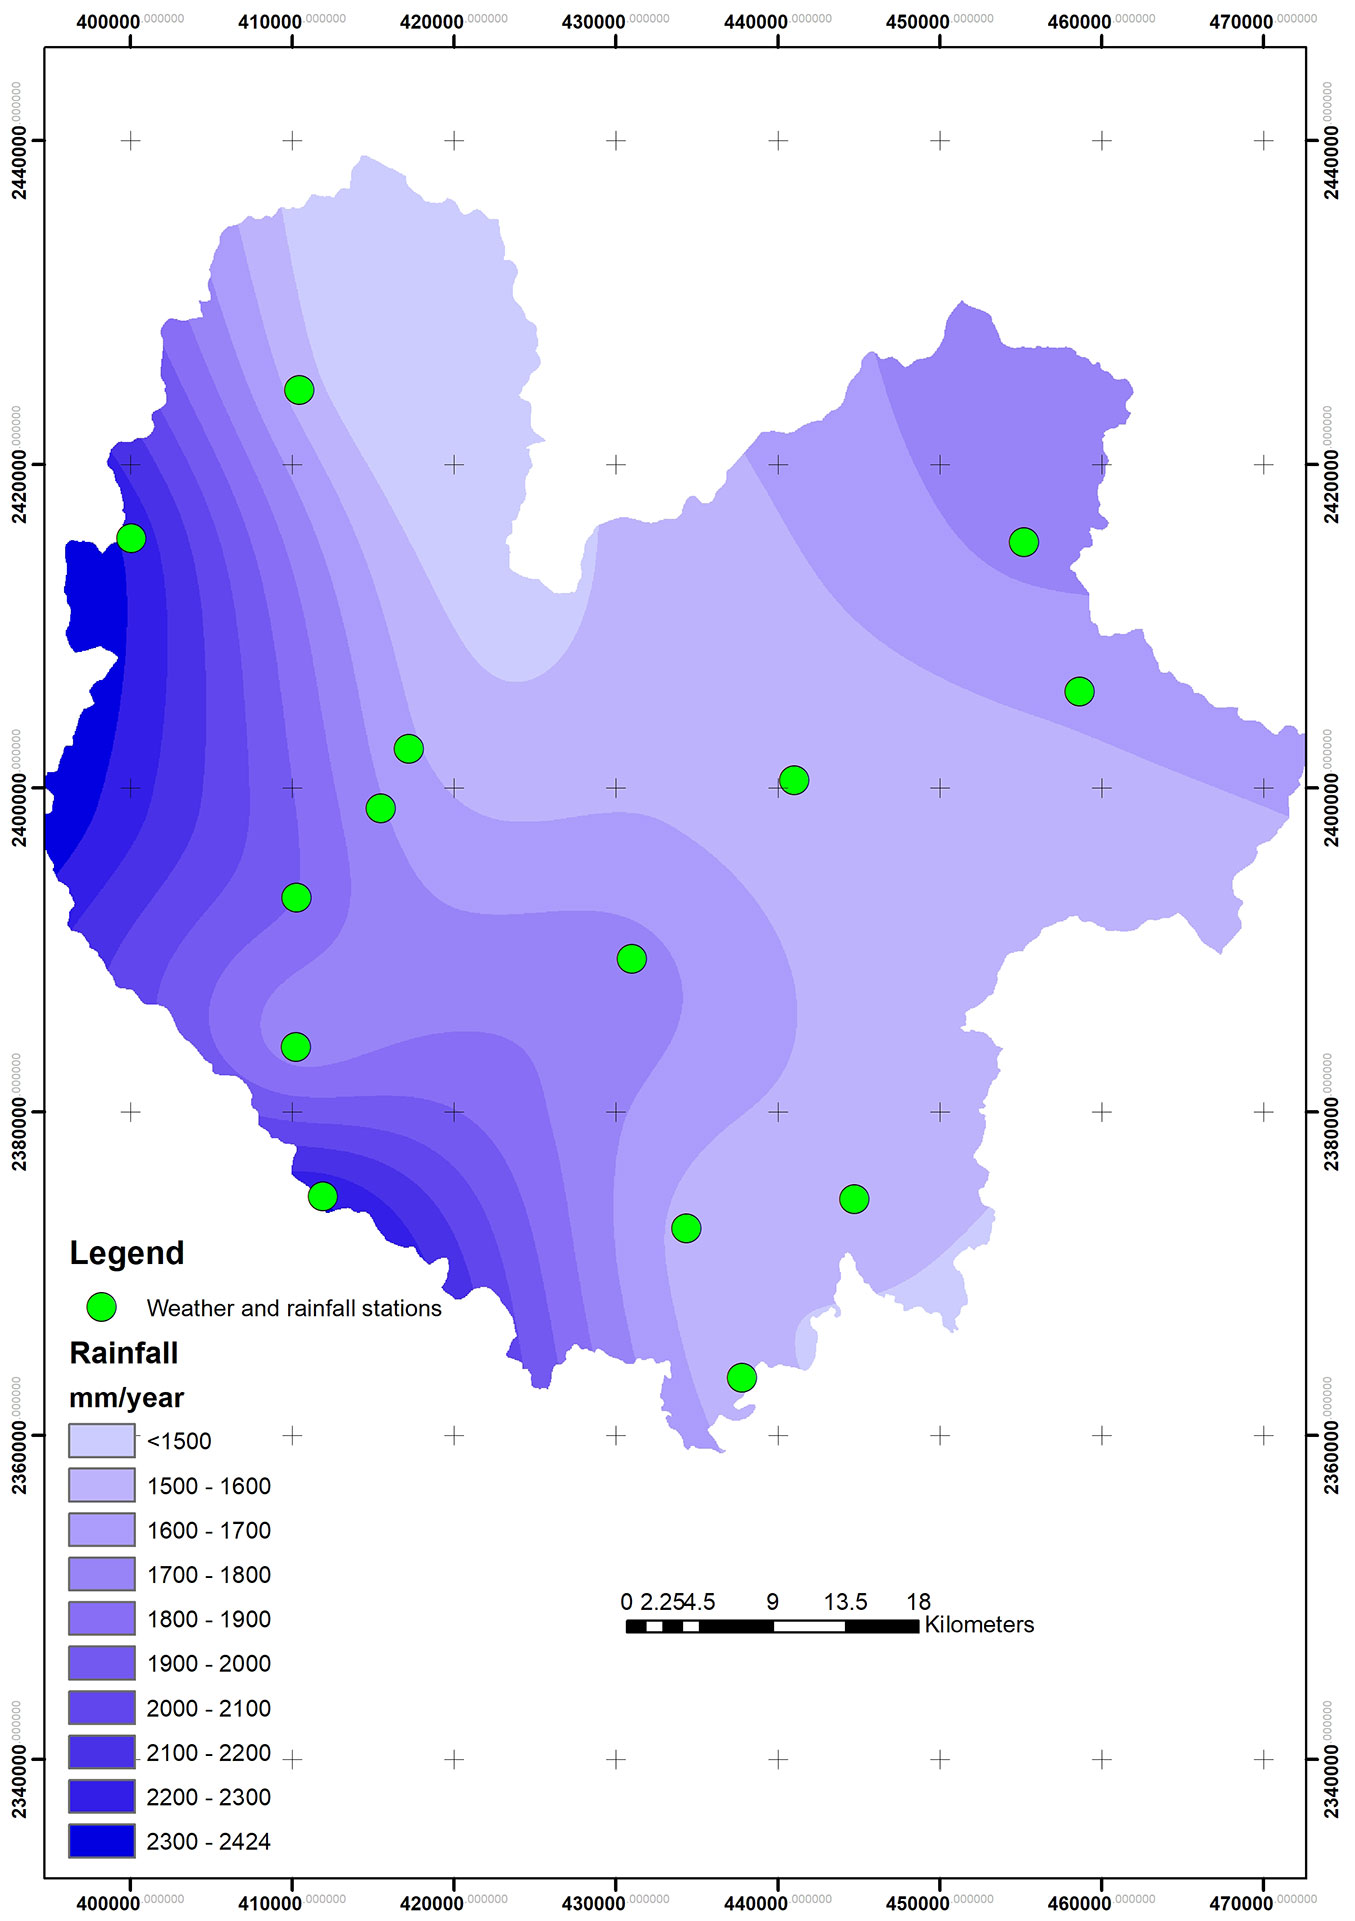
- Climate regime (mean annual rainfall): climatic information was provided by the Vietnam Institute of Meteorology, Hydrology and Climate Change (⇒ http://www.imh.ac.vn/). Rainfall information was obtained based on the 15 years (from 2000 to 2014) of observations at three weather stations and 11 rainfall stations. Spatial interpolation of mean annual rainfall was implemented by applying inverse distance weighting (IDW) method in ArcGIS® ver. 10.2.2 platform (ESRI, Redlands, CA, USA). Mean annual rainfall map is represented in Fig. 1.
Fig. 1 - Mean annual rainfall map.
Step 2: Combining the three factors to suitability classes
Land use suitability analysis aims to identify the most appropriate future land use to meet specific demands ([15], [17]). Classes are determined for each factor based on how a specific tree species behaves under certain environmental conditions. Land suitability evaluations ([15]) define suitability is the fitness of a given type of land for a defined use. Four classes for land suitability classification are applied:
- S1 (Highly suitable): land having negligible or slight limitations affecting site productivity (productivity class 1), and with negligible or slight management limitations or degradation hazards;
- S2 (Moderately suitable): land having moderate limitations affecting site productivity (productivity class 2), or land having higher productivity but with moderate management limitations or degradation hazards;
- S3 (Marginally suitable): land having severe limitations affecting site productivity (productivity class 3), or land having higher productivity but with severe management limitations or degradation hazards;
- Un (Unsuitable): land having severe limitations affecting site productivity (productivity class 4), or land having higher productivity but with very severe management limitations or severe to very degradation hazards.
Based on a comparison between tree species requirements and site conditions, ecological factors were allocated to respective suitability classes. The evaluation was supported by the additional consultations of four local experts, who provided field knowledge pertaining to forest growth, soil sciences, and suitable forest site assessment for the main tree species in Vietnam. The experts were selected from the fields of science and forestry practice and are considered to be the most experienced in the cultivation of A. mangium.
Step 3: Determination of scores and weights of land suitability for A. mangium
Land suitability classes reflect the degree of suitability. In order to utilize the suitability classes identified in Step 2 for the prioritization of individual sites for reforestation, a ranking has to be introduced. By a pragmatic decision it was decided to introduce scores ranging from 1 to 4. A higher score was assigned to higher suitable land (suitability class) for growing A. mangium (see Tab. S1 in the Supplementary materials for questionnaires for suitability classes determination for A. mangium and pair wise comparison):
- Unsuitable class: score equals 1;
- Marginally suitable class: score equals 2;
- Moderately suitable class: score equals 3;
- Highly suitable class: score equals 4.
Scoring of individual sites has to take into account that each factor has a different effect on tree growth and forest productivity. Therefore, the contribution of individual factors and attributes of factors on the decision-making process was assessed by means of the AHP process. The AHP is included in the family of multi-criteria decision-making techniques ([34]) and is utilized to assign weights for standardization of criteria maps based on expert knowledge ([33], [21], [32], [26]). After gaining information for site suitability and bio-physical factors (Step 1) and attributes assigned to each individual suitability class from forestry expert consultations (Step 2), AHP was used to determine the weight of each factor and each attribute by regarding soil properties, topography and rainfall regime. The experts were asked to rank the individual factors and attributes with respect to their importance for tree growth. The ranking was performed by a pair-wise comparison.
In AHP methodology, pairwise comparisons show forestry experts’ preferences by comparing two factors at a time. AHP methodology was implemented in four main steps ([50]):
- Taking consideration of a hierarchy of different factors (soil properties, topography, climate);
- Using pairwise matrix to assess and assign the importance of each factor with scale ranges from 1 to 9. According to Saaty & Vargas ([42]), preferences are expressed by numerical values of 1, 3, 5, 7 and 9, respectively, with 2, 4, 6 and 8 as intermediate values between adjacent scale values. For example, 1 implies “least valued than” and 9 implies “absolutely more important than” in the pairwise comparison matrix ([42]).
- Determining eigenvalue λmax of the reciprocal ratio matrix, eigenvector, consistency ratio (CR) based on consistency index (CI) and random index (RI) and the normalized value for each criteria/alternative;
- Checking the satisfactory of consistency ratio (CR) in order to make decisions based on the normalized values for criteria and determine the final overall rating.
Aggregation Individual Judgment (AIJ) is considered a unique mode to combine individual judgments into group judgment ([41]). AIJ matrices are calculated as (eqn. 1):
where xi are judgments of individual i, i = {1,…,m}, A is the aggregation individual judgment by geometric mean.
To ensure that the decision makers’ judgments of are consistent, the consistency ratio (CR) and consistency index (CI) were applied, which are defined as (eqn. 2, eqn. 3):
where λmax is the maximum eigenvalue of the normalized comparison matrix, λmax ≥ n, RI is a Random Index for the number of factors compared in a matrix, appropriate consistency index, corresponds index of consistency for random judgments, and n is the number of factors being compared (n = 3, RI = 0.52 - [42]). CI estimates the level of consistency with respect to the entire comparison process. CRs less than or equal to 0.1 (10%) indicate consistent assessments of decision-makers, for CRs > 0.1 the individual criteria have to be re-examined (see Tab. S1 in the Supplementary materials for pair-wise comparisons for factors by experts and aggregation of individual judgments).
Each attribute was mapped according to the attributes mentioned under step 1 (soil type, soil depth, elevation, slope, and rainfall). Each input raster layer was weighted according to its proportional influence given the constraint that the sum of the percentage influence weights for all the raster map (factors and attributes) is equal to 1 (see Tab. S1 in the Supplementary materials for weights of each attribute and each factor).
The individual attribute maps were combined by the weighted linear combination method (WLC) in a GIS environment (raster calculator tool in ArcGIS). WLC was developed by Eastman et al. ([12]). The higher the combined value achieved by weighing in the cell, the more suitable it is for A. mangium. The final score was converted to each suitability class including S1, S2, S3 and Un for areas unsuitable for afforestation. The final score of the land suitability in each suitability class is defined as (eqn. 4):
where S is the final score/suitability, Wi is the weight of factor i, and Xi is the score of class i.
Modelling productivity
Productivity is an ultimate indicator of a tree’s reaction to its environmental conditions. The most widely used direct measure of forest site productivity is volume. Productivity (m3 ha-1) in each suitability class was assessed based on data collection by a forest inventory in the research area.
Sample plot design
A forest survey aims to supply data for fitting growth functions of studied species and establishing a potential productivity map. Through forest inventories, information on the quality and quantity of forest resources such as forest growth, area, and species identification can be recorded ([28]). A concentric circular plot design, with three different plot radii was applied:
- r1 = 5.64 m / area of 100 m2 for the trees with DBH > 0 cm;
- r2 = 7.98 m / area of 200 m2 for the trees with DBH ≥ 5 cm;
- r3 = 12.62 m / area of 500 m2 for the trees with DBH ≥ 12 cm.
The DBH all trees within a plot was measured using a diameter tape. On ten trees (closest to the center point of plot) per plot tree height was recorded using a Criterion RD 1000 laser instrument.
Sample plot allocation
Based on a map that presents the allocation of the studied species with respect to age classes and suitability classes, the number of sample plots was determined in line with the percentage of stands that each suitability class occupied (S1: 40%, S2: 30%, S3: 30%). A total of 152 concentric circular sample plots was laid out following a systematic selection. All stand ages from 1 to 9 years were covered.
Calculation of stand variables
The data assessed on the 152 concentric plots was utilized to describe the relationship between tree height and diameter at breast height by a linear model ([38] - eqn. 5):
where a, b are coefficients of the model, h is the total height of tree (m), and DBH is the diameter at breast height (cm).
The model was used to estimate height of mean quadratic diameter tree in relation to the quadratic mean diameter calculated with the following equation for each concentric plot (eqn. 6, eqn. 7):
where a is the line slope, b is intercept, dgi is the quadratic mean diameter (cm) at plot in the plot i, gi is the basal area (m2 ha-1) in the plot i, hgi is the height of mean quadratic diameter tree in the plot i, nsi is the stocking density (trees ha-1) in the plot i.
The parameters dgi and hgi were utilized to calculate the volume of live stems per hectare (eqn. 8):
where f is the tree form (commonly used for A. mangium in Vietnam: f = 0.49 - [44]).
Modelling volume growth for suitability classes
The growth model is based on observations of growing stock volumes to predict the potential production of forest plantations. By using growth models, we can explore stand conditions and determine the harvesting time needed for maximizing timber production. Many studies have applied empirical functions ([49], [4], [48], [25], [47]). Generally, the overall shape of the curve is sigmoid ([1], [7]). The data from the concentric plots were used to model yield curves ([38]) as described by Korf (1939 - eqn. 9), Gompertz (1825 - eqn. 10), and Chapman-Richards (1961-1959 - eqn. 11):
where a0, a1, and a2 are the parameters to be estimated (asymptote, slope, and position of inflection point, respectively), V is the standing volume of live trees per hectare at age A, A ∈ (1, i).
Models were developed by means of R software ([39]). The coefficient of determination (r2), the root mean square error (RMSE) and Akaike’s information criterion (AIC) were used to measure the goodness-of-fit per suitability class.
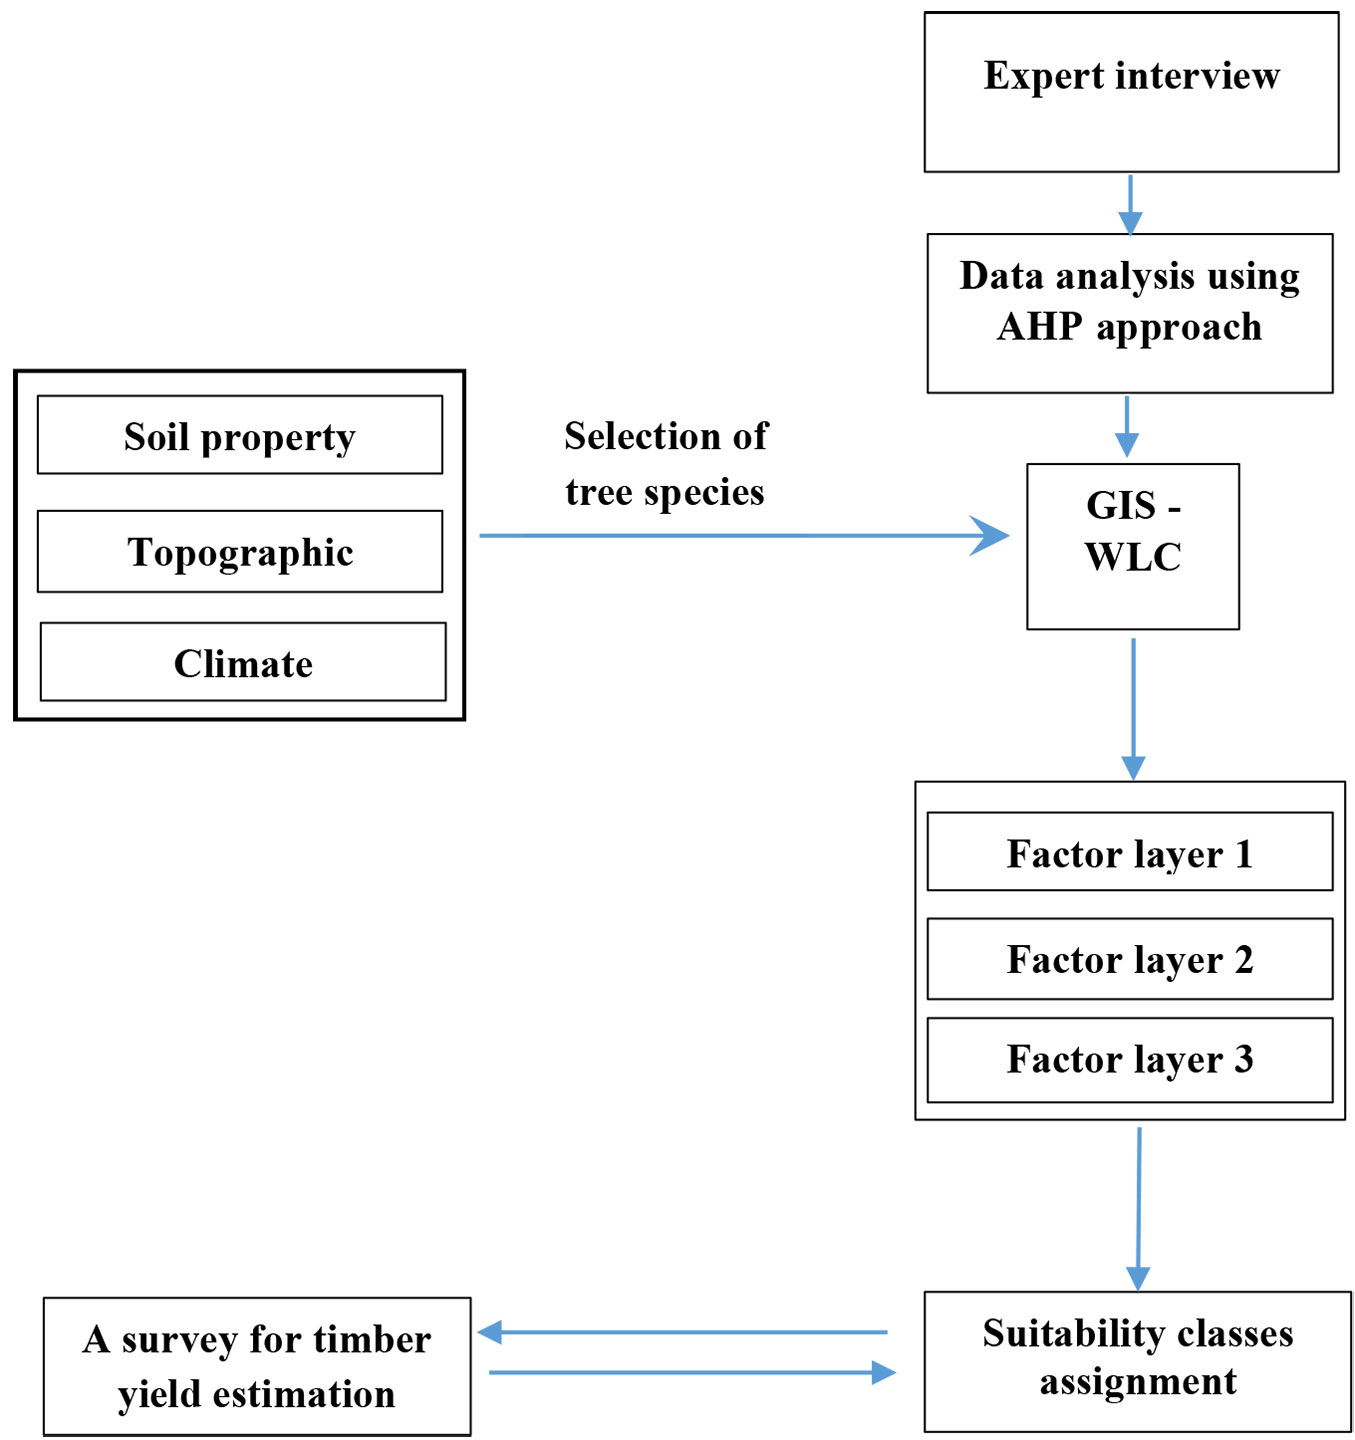
Steps of the proposed methodology are represented in Fig. 2.
Fig. 2 - Steps of the proposed methodology.
Results
Assignment of suitability classes for A. mangium
Tab. 1 presents the judgement of the consulted experts on the impact of individual bio-physical attributes for growth of A. mangium. According to the experts, soil types Rhodic ferralsol (Fk), Ferralic acrisol (Fp), or Dystric gleysol (D), soil depth ≥ 100 cm, elevation < 200 m a.s.l., slope gradient between 0 and 15 degrees and annual rainfall above 2000 mm favour the growth of A. mangium.
Tab. 1 - Attributes of factors for determination of suitability classes for A. mangium. (*) Soil types: (Fk) Rhodic ferralsols developed on bases and acid magma rock; (Fp) Ferralic acrisols, formed by the feralite process, is ancient alluvial soil; (D) Dystric gleysols; (Fs) Yellowish red soil on metamorphic and sedimentary rock; (Fa) Ferralic arcrisols is yellowish red soil developed on acid magma, formed by the feralite process; (Fv) Rhodic ferralsols developed on limestone; (Fq) Yellowish red soil developed on sandstone; (Rk) Chrimic luvisols; (Ha) Humic ferralsols developed on acid magma rock.
| Site condition | Forestry land suitability | |||
|---|---|---|---|---|
| Highly suitable (S1) |
Moderately suitable (S2) |
Marginally suitable (S3) |
Unsuitable (UN) |
|
| Soil type* | Fk, Fp, D | Fs, Fa, Fv | Fq, Rk, Ha | Karst |
| Soil depth (cm) | ≥ 100 | ≥ 70-100 | ≥ 50-70 | 50 |
| Elevation (m a.s.l.) | < 200 | 200-400 | 400-700 | >700 |
| Slope gradient (degree) | 0-15 | 15-25 | 25-35 | >35 |
| Mean annual rainfall (mm/year) | 2000-2400 | 1500-2000 | 1300-1500 | < 1300 |
| Score of each variable category for land suitability assessment | 4 | 3 | 2 | 1 |
The aggregation of the four judgments was calculated to obtain the eigenvector and give the results of weighting calculation based on revised power (Tab. 2).
Tab. 2 - Aij for pair-wise comparison matrix of four experts (λmax = 3.005; CI = 0.003; RI = 0.52; CR = 0.005).
| - | Soil properties |
Topography | Climate | Eigenvector | Weight (Revised power) |
|---|---|---|---|---|---|
| Soil properties | 1 | 2.20 | 3.00 | 0.550 | 0.556 |
| Topography | 0.45 | 1 | 1.70 | 0.280 | 0.272 |
| Climate | 0.33 | 0.59 | 1 | 0.170 | 0.172 |
The consistency analysis presented in Tab. 2 was performed using the normalized matrix of criteria and final weights of criteria. The results illustrate that the consistency index (CI) for paired criteria concerning the impact of different factors on land suitability was 0.003 (0.3%) and the consistency ratio (CR) was 0.005, which was acceptable as it is smaller than the 10% threshold proposed by Saaty & Vargas ([42]). Soil properties were identified as the most important factor, followed by topographic and climate factors. Based on the principle of the WLC, the raster calculator tool in an ArcGIS environment was utilized to combine raster inputs with different weights of factors.
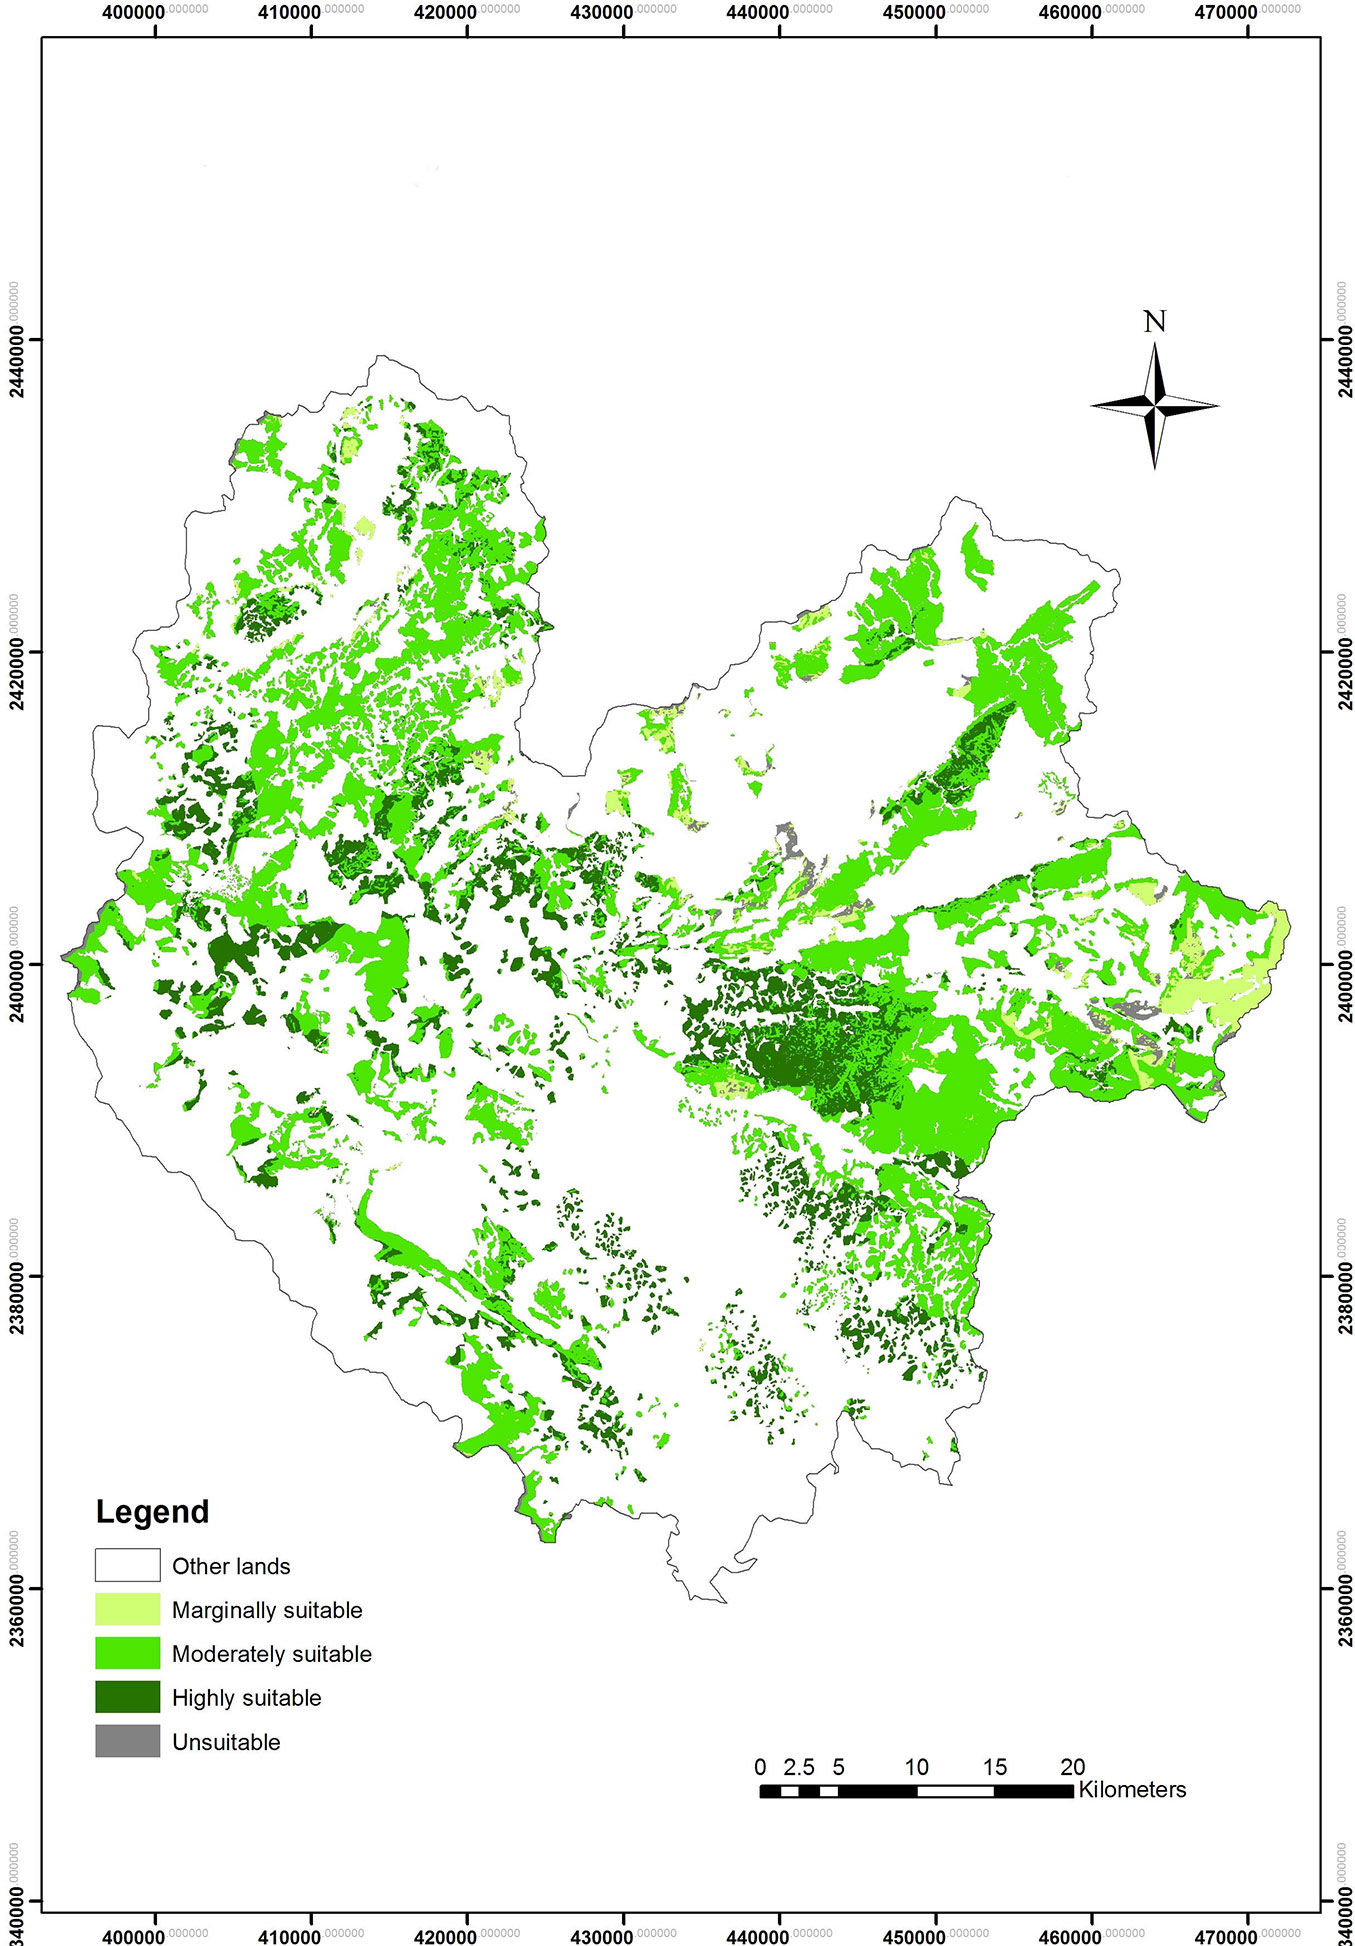
The result indicates that the largest area of forest land with respect to potential suitability for forest plantations with A. mangium belongs to the moderately suitable class (S2: 65.20%), followed by the highly suitable class (S1: 24.18%), marginally suitable class (S3: 5.82%), and unsuitable class (Un: 4.8%). A map of suitability locations for growing A. mangium is represented in Fig. 3.
Fig. 3 - Map of suitability locations for growing A. mangium.
Forest stand growth
Stand variables according to suitability classes
The survey covered stand ages between 1 and 9 years and a mean stand age of 5 years for all three suitability classes (Tab. 3). Likewise, the stocking density is nearly the same among the suitability classes. Basal area, quadratic mean diameter, stand height, and volume show an increase with site quality indicating higher productivity.
Tab. 3 - Summary of stand attributes for suitability classes S1, S2, and S3.
| Suitability class |
No. of plots |
Statistics | Variables | |||||
|---|---|---|---|---|---|---|---|---|
| Age (yrs) |
Stocking density (trees ha-1) |
Basal area (m2 ha-1) |
Quadratic mean diameter (cm) |
Stand mean height (hg) |
Volume (m3 ha-1) |
|||
| Highly suitable S1 |
59 | Min | 1 | 660 | 4.8 | 5.0 | 5.6 | 13.1 |
| Max | 9 | 2590 | 30.6 | 20.8 | 17.0 | 235.6 | ||
| Mean | 5 | 1823 | 19.5 | 12.0 | 12.6 | 125.7 | ||
| Moderately suitable S2 |
60 | Min | 1 | 920 | 5.2 | 5.7 | 4.7 | 12.2 |
| Max | 9 | 2590 | 34.5 | 18.9 | 16.9 | 262.2 | ||
| Mean | 5 | 1837 | 18.3 | 11.5 | 11.8 | 112.3 | ||
| Marginally suitable S3 |
33 | Min | 1 | 1000 | 2.6 | 3.6 | 3.0 | 3.8 |
| Max | 9 | 2800 | 27.5 | 14.7 | 15.1 | 173.5 | ||
| Mean | 5 | 1905 | 14.7 | 10.0 | 10.5 | 81.8 | ||
The relationships between quadratic mean diameter and tree number per hectare are presented in Fig. 4. In all three suitability classes (S1, S2, S3) the relationship is negatively correlated. The relationships between quadratic mean diameter and tree number per hectare in different suitability classes were fitted by a linear model. The resulting functions are similar but shifted to the right into higher diameter classes with improving suitability calls.
Fig. 4 - Relationship between quadratic mean diameter and tree number per hectare in different suitability classes.
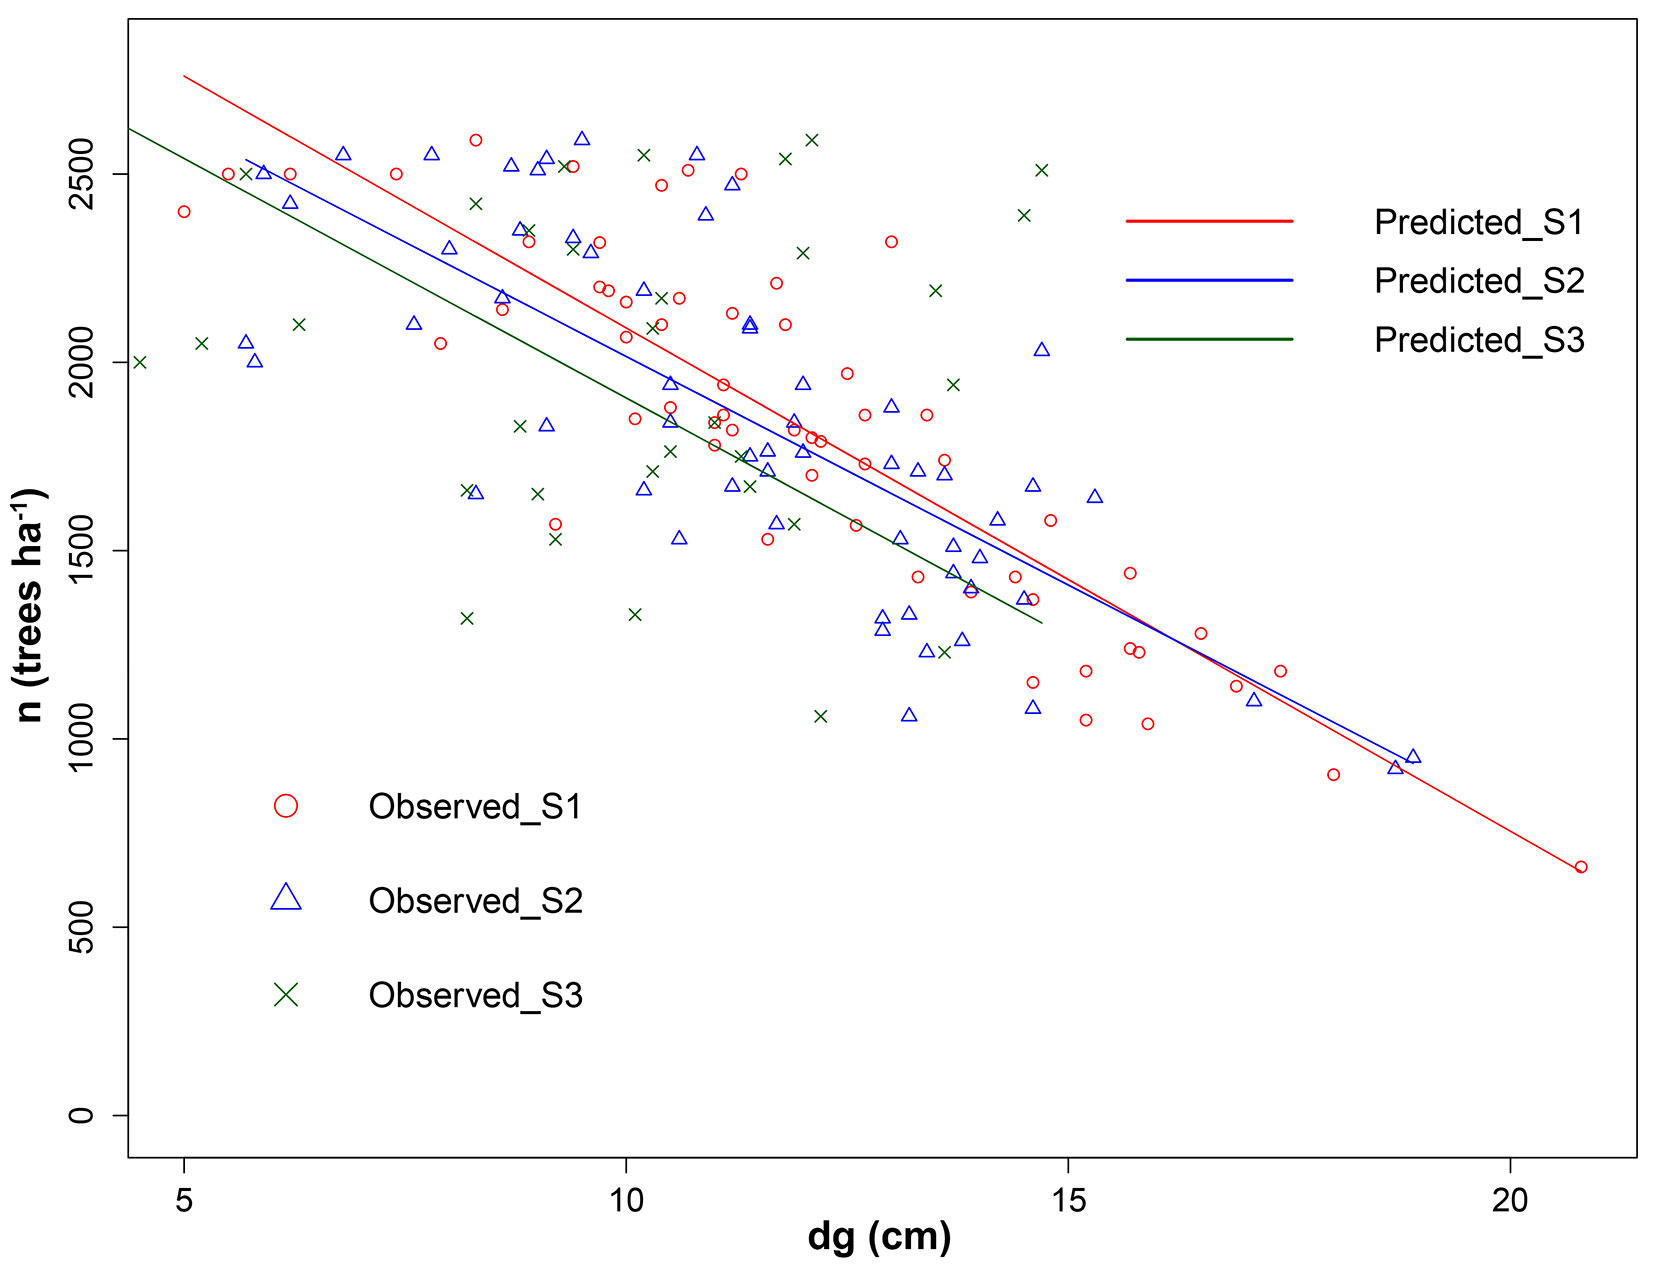
Class S1 (r2 = 0.751; P < 0.001 - eqn. 12):
Class S2 (r2 = 0.594; P < 0.001 - eqn. 13):
Class S3 (r2 = 0.667; P < 0.001 - eqn. 14):
where n is the number of trees per ha (trees ha-1), and dg is the quadratic mean diameter (cm).
Fig. 5 shows the per hectare volume over stand age. Stand volumes vary not only with stand age but also with suitability classes. Volumes are consistently larger in higher suitability classes, which supports the applicability of the suitability classification found for the study area. Differences of volume growth of A. mangium between the three suitability classes were significant (Kruskal-Wallis test, χ2 = 15.74, P < 0.001).
Fig. 5 - Distribution of volume per hectare according to age by different suitability classes.
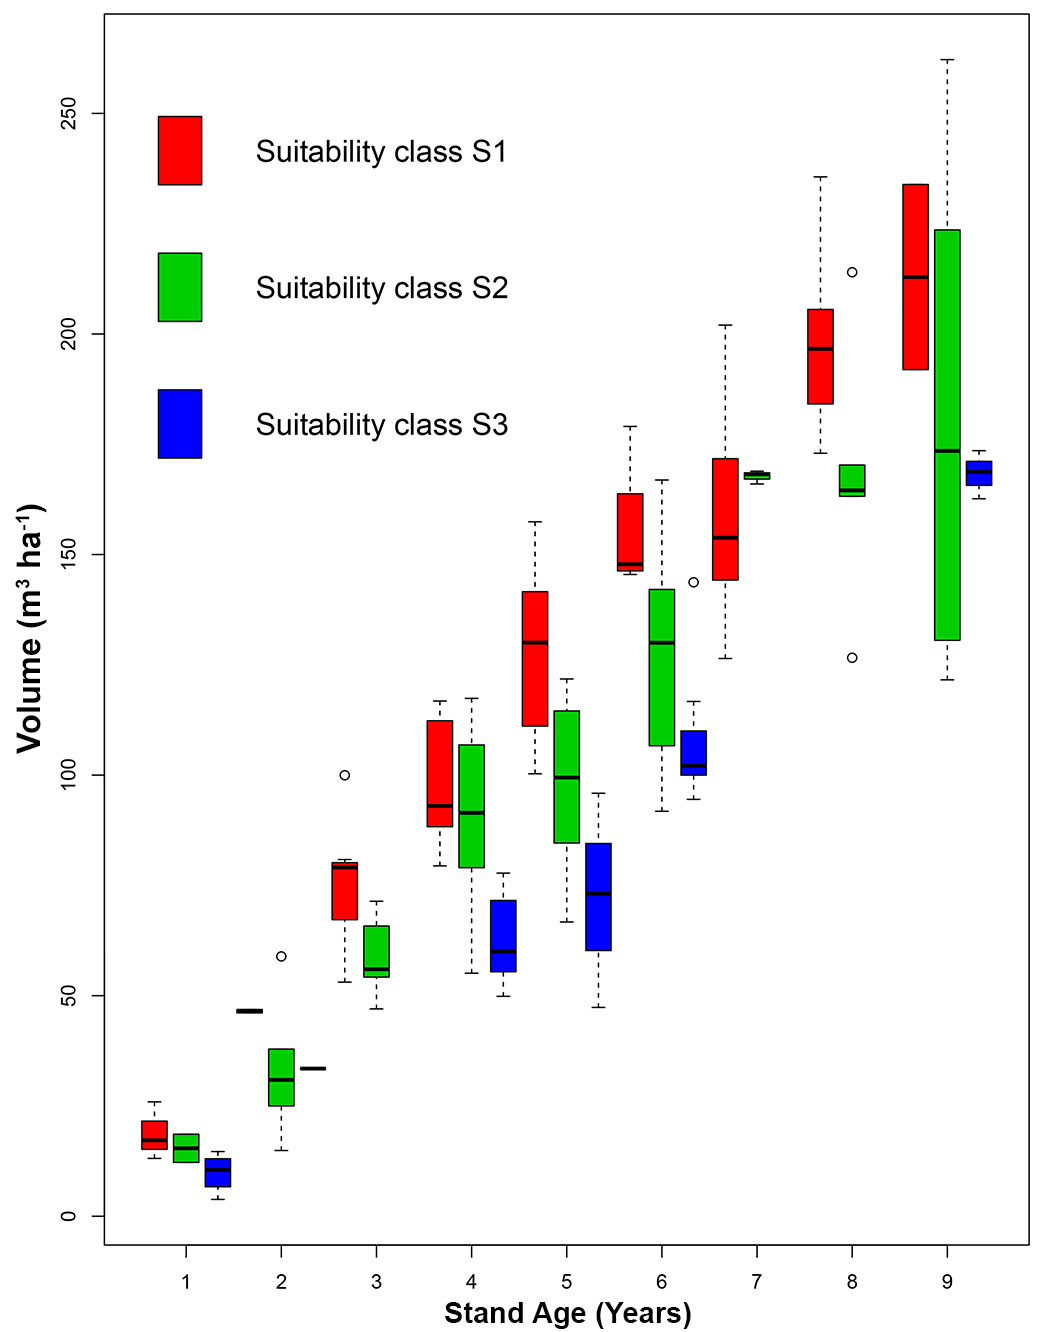
Yield function
The yield model describes the productivity of the three levels of suitability classes. For the suitability class “unsuitable” no model was developed because data was not collected. Each suitability class resulted in a different age-related yield (Fig. 5). Three types of models were utilized to fit volume yield as a function of stand age.
Tab. 4 - The fitted models for A. mangium.
| Suitability class |
Function | r2 | RMSE | AIC | Number of plots |
|---|---|---|---|---|---|
| S1 | Korf | 0.873 | 18.23 | 517.99 | 59 |
| Gompertz | 0.870 | 18.49 | 518.19 | 59 | |
| Chapman-Richards | 0.872 | 18.26 | 519.69 | 59 | |
| S2 | Korf | 0.766 | 26.10 | 569.66 | 60 |
| Gompertz | 0.766 | 26.09 | 569.62 | 60 | |
| Chapman-Richards | 0.766 | 26.08 | 569.56 | 60 | |
| S3 | Korf | 0.926 | 11.73 | 264.01 | 33 |
| Gompertz | 0.926 | 11.68 | 263.84 | 33 | |
| Chapman-Richards | 0.926 | 11.70 | 263.93 | 33 |
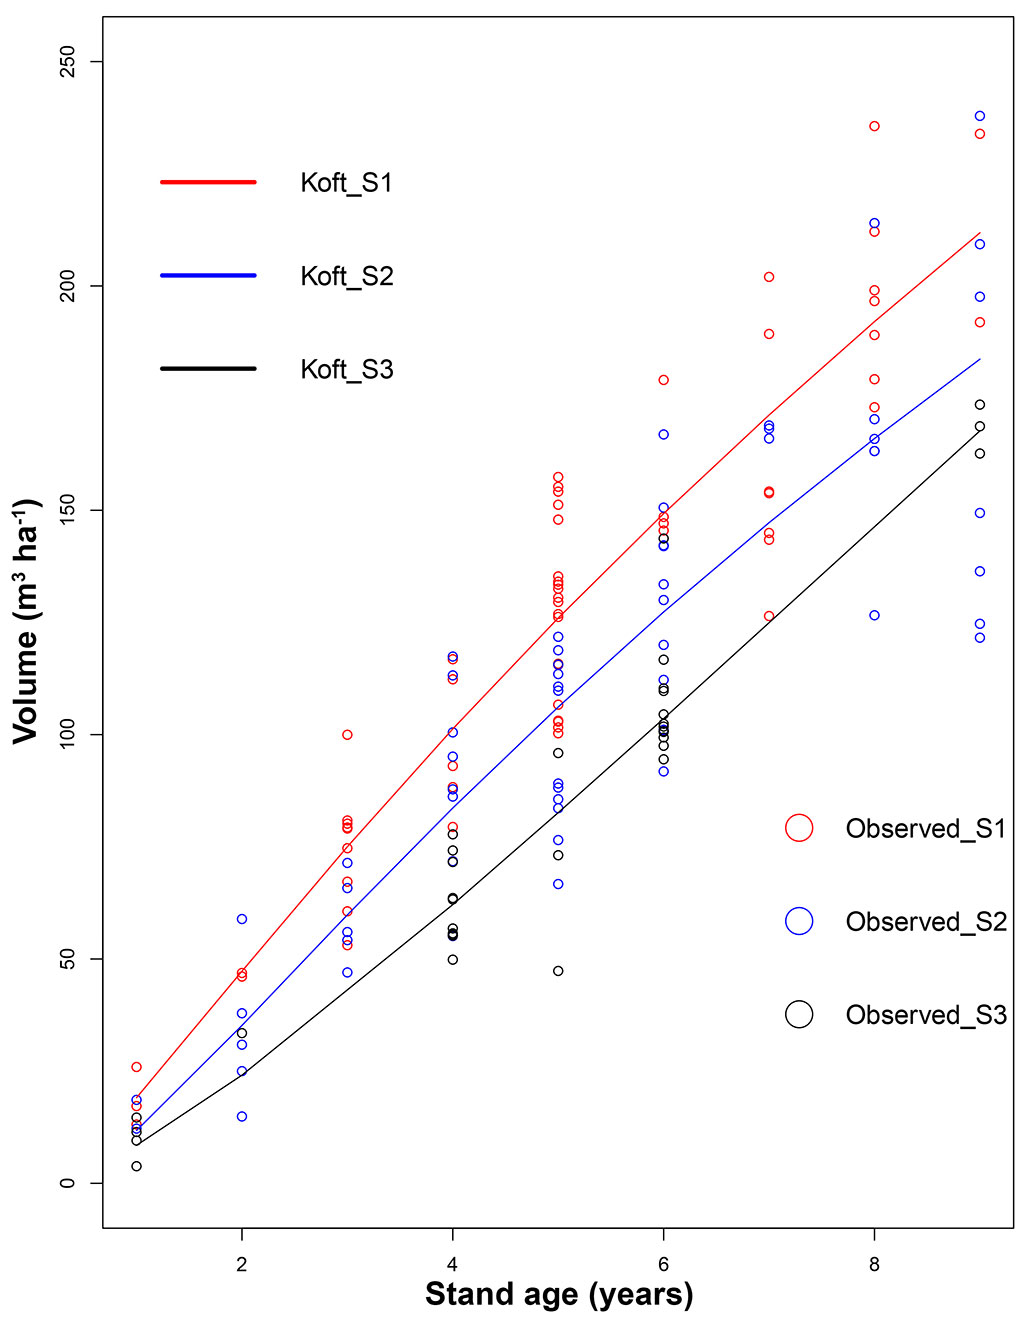
RMSE, AIC and r2 values indicate a good fit for all models and suitability classes (Tab. 4). The Korf function obtained slightly higher values for r2, hence, the Korf functions of the respective suitability classes were selected to perform volume yield of A. mangium according to age. They show volume yield of A. mangium as follows (eqn. 15, eqn. 16, eqn. 17):
The shapes of the volume curves indicate clear differences between the best and the worst suitability class (Fig. 6), which clearly shows differences in site-related yield.
Fig. 6 - Volume growth curves of A. mangium for the three suitability classes by the Korf function.
Tab. 5 presents volume and mean annual increment (MAI) for stand age and suitability class as obtained by the Korf function. In S1 a maximum MAI of 25.3 m3 ha-1year-1 is found at age 4 years. In S2 the maximum MAI (21.2 m3 ha-1year-1) is found at age 5. In S3 the maximum MAI (20.0 m3 ha-1year-1) is found at age 18. MAI consistently increases with stand suitability; the MAI ranges of individual suitability classes do not overlap. Hence, the selection of suitability classes has a decisive influence on timber production in the study area.
Tab. 5 - Variation in volume growth of A. mangium by age and suitability classes as obtained by the Korf function.
| Years | S1 (Highly suitable) | S2 (Moderately suitable) | S3 (Marginally suitable) | |||
|---|---|---|---|---|---|---|
| V(t) (m3 ha-1) |
MAI (m3 ha-1 year-1) |
V(t) (m3 ha-1) |
MAI (m3 ha-1 year-1) |
V(t) (m3 ha-1) |
MAI (m3 ha-1 year-1) |
|
| 2 | 47.3 | 23.6 | 35.2 | 17.6 | 24.1 | 12.1 |
| 3 | 75.0 | 25.0 | 59.8 | 19.9 | 42.4 | 14.1 |
| 4 | 101.3 | 25.3 | 83.6 | 20.9 | 62.1 | 15.5 |
| 5 | 126.0 | 25.2 | 106.2 | 21.2 | 82.6 | 16.5 |
| 6 | 149.3 | 24.9 | 127.3 | 21.2 | 103.6 | 17.3 |
| 7 | 171.2 | 24.5 | 147.2 | 21.0 | 124.8 | 17.8 |
| 8 | 192.1 | 24.0 | 166.0 | 20.7 | 146.2 | 18.3 |
| 9 | 211.8 | 23.5 | 183.7 | 20.4 | 167.7 | 18.6 |
| 10 | 230.7 | 23.1 | 200.4 | 20.0 | 189.2 | 18.9 |
| 11 | 248.7 | 22.6 | 216.3 | 19.7 | 210.7 | 19.2 |
| 12 | 266.0 | 22.2 | 231.4 | 19.3 | 232.1 | 19.3 |
| 13 | 282.6 | 21.7 | 245.9 | 18.9 | 253.5 | 19.5 |
| 14 | 298.5 | 21.3 | 259.6 | 18.5 | 274.8 | 19.6 |
| 15 | 313.9 | 20.9 | 272.8 | 18.2 | 296.0 | 19.7 |
| 16 | 328.7 | 20.5 | 285.4 | 17.8 | 317.1 | 19.8 |
| 17 | 343.0 | 20.2 | 297.6 | 17.5 | 338.1 | 19.9 |
| 18 | 356.9 | 19.8 | 309.3 | 17.2 | 358.9 | 20.0 |
Discussion
One of the eligible REDD+ activities concerns the enhancement of forest carbon stocks via afforestation and reforestation (⇒ https://redd.unfccc.int/fact-sheets/unfccc-negotiations.html). The creation of new plantations is only beneficial for climate protection if natural forests are not cleared beforehand ([23]). In recent years, concepts to promote the afforestation of degraded and abandoned sites have, therefore, been specifically promoted ([16], [8]). In order to achieve a variety of benefits from the plantation economy, both the locations and the tree species must be carefully selected. The present study makes a decisive contribution to this aim and is based on a transparent and straightforward approach.
Four classes of suitability (S1 to S3 and unsuitable class) are defined and specified for the study area with regard to favourable and constraining factors ([45]). Subsequent to the identification of site suitability a growth model was applied to assess the potential timber production in different site classes. The yield of A. mangium was calculated based on a site-dependent yield model developed for A. mangium plantations. This allowed for assigning the productivity to each suitability class.
Self-sufficiency of raw timber for the Vietnamese economy is predicted to increase to 80% by 2020 ([13]). However, the current local wood supply is not sufficient to meet the domestic timber demand and makes the import raw material from other countries into Vietnam necessary. Based on Vietnam’s development strategy for the period 2006-2020, a stable supply of raw material capable of supporting the timber-processing industry should be realized by 2020. Therefore, sustainable forest production has to be increased to satisfy the domestic timber demand by utilizing local production. In order to meet this goal, the efficiency of the forest plantations has to be increased by the selection of suitable tree species and by sustainable forest management.
Principles of sustainable forest development and land use planning often require a compromise between socio-economic development and environmental interests. Biophysical factors have a significant effect on the productivity of forest plantations, while socio-economical and economic factors have an impact on profitability and management systems. To enhance profits from forest plantations, the tree species grown need to match the specific site conditions. Good land use planning can realize higher productivity of forest land as well as decrease the area required for future timber procurement for private households and forest industries ([43], [14]).
The stand volume yield model represents the current management practice in A. mangium plantations (i.e., no thinning and short rotation). The land suitability classes and volume yield provide valuable information for policymakers, planners, and stakeholders to make decisions about different forest management regimes. The yield model applied supports decisions on optimal rotation periods for sustainable production and simultaneously improves the cost-efficiency of sustainable timber production in Thai Nguyen A. mangium plantations. Currently, most of the A. mangium plantations are managed in short rotations of 5-7 years to meet the timber demand for woodchip production. Extending the length of rotation periods leads to production of assortments with higher value (e.g., sawn logs) and enhances forest carbon pools and carbon removals by timber utilization. Summarizing, the presented approach provides a valuable contribution to sustainable forest management.
The effectiveness of reforestation and FLR are strongly dependent on stakeholder needs and biophysical conditions. The suitability classification along with the growth predictions provide basic information for land use management decisions in the scope of forest landscape restoration and the implementation of plantation forestry. This basic information allows for objective allocation of afforestation while simultaneously minimizing the risk of economic losses by unsuitable site selection for afforestation activities. The extension of forest areas through afforestation and reforestation under Forest Landscape Restoration (FLR) can reduce degraded lands, increase the forest cover and boost the forest carbon stock worldwide. In addition, however, the needs of the local population must also be taken into account. Afforestation must not take place on land used for agricultural purposes. Only currently unused areas or areas with unsatisfactory tree cover should be selected for potential afforestation. Stakeholders should be involved in afforestation programmes at an early stage in order to avoid conflicts and to ensure the success of afforestation programmes.
The approach can easily be extended to other species and regions. Many restoration and reforestation efforts have partially or completed failed, mainly because tree species or provenances were planted that were not adapted to the specific local conditions ([30], [9]). Land suitability assessments are essential prerequisites for establishing forest plantations ([40]). Site condition classification for growing study species is based on a land suitability evaluation technique developed by FAO ([15]), this technique helps match ecological requirements of A. mangium with site conditions. Each individual environmental factor has a different effect on tree growth and forest productivity. Therefore, AHP was used to determine the weight of each factor on tree growth and forest productivity.
Taking into account site-depended growth patterns, land suitability classifications for A. mangium forest plantations is combined with a site-specific growth model in order to obtain reliable information on the potential timber production. The approach of this study can be extended to other species and regions under the same environmental conditions.
Conclusion
The study provides an approach that can guide site selection including the identification of economically unsuitable sites and facilitates the afforestation with site-adapted tree species. This safeguards the success of reforestation and FLR activities by satisfying principles such as restoring ecological function by enhancing productive land use, or meeting community livelihood needs. The application of land suitability class evaluation and stand growth prediction as shown in the current study offer a straightforward and operational decision-making tool that supports readiness of FLR.
Acknowledgements
The authors acknowledge the financial support from the Ministry of Education and Training of Vietnam (MoET) and the University of Hamburg, Germany (Institute for Wood Sciences, World Forestry). We thank Prof. Dr Do Dinh Sam (The Vietnam Union of Science and Technology Associations), Prof. Dr Ngo Dinh Que (The Vietnam Union of Science and Technology Associations), Dr Nguyen Thi Thu Hoan (Lecturer and researcher of Thai Nguyen University of Agriculture and Forestry, Vietnam), and Bach Tuan Dinh (Vice Director of the Thai Nguyen Forestry department, Vietnam) for their support and consultation for suitability classes determination and pair wise comparison, and Phan Van Duc and Phan Trung Nghia for the field survey.
References
Gscholar
Gscholar
Gscholar
Gscholar
Gscholar
Gscholar
Gscholar
Gscholar
Gscholar
Gscholar
Gscholar
Gscholar
Gscholar
Gscholar
Gscholar
Authors’ Info
Authors’ Affiliation
Mues Volker
Michael Köhl
University of Hamburg, Institute for World Forestry, Leuschnerstr.91, D-21031 Hamburg (Germany)
Thai Nguyen University of Agriculture and Forestry (Vietnam)
Corresponding author
Paper Info
Citation
Cuong ND, Volker M, Köhl M (2019). Facilitating objective forest land use decisions by site classification and tree growth modeling: a case study from Vietnam. iForest 12: 542-550. - doi: 10.3832/ifor2945-012
Academic Editor
Emanuele Lingua
Paper history
Received: Aug 08, 2018
Accepted: Aug 27, 2019
First online: Dec 17, 2019
Publication Date: Dec 31, 2019
Publication Time: 3.73 months
Copyright Information
© SISEF - The Italian Society of Silviculture and Forest Ecology 2019
Open Access
This article is distributed under the terms of the Creative Commons Attribution-Non Commercial 4.0 International (https://creativecommons.org/licenses/by-nc/4.0/), which permits unrestricted use, distribution, and reproduction in any medium, provided you give appropriate credit to the original author(s) and the source, provide a link to the Creative Commons license, and indicate if changes were made.

Web Metrics
Breakdown by View Type
Article Usage
Total Article Views: 48119
(from publication date up to now)
Breakdown by View Type
HTML Page Views: 41648
Abstract Page Views: 3093
PDF Downloads: 2454
Citation/Reference Downloads: 4
XML Downloads: 920
Web Metrics
Days since publication: 2405
Overall contacts: 48119
Avg. contacts per week: 140.06
Article Citations
Article citations are based on data periodically collected from the Clarivate Web of Science web site
(last update: Mar 2025)
Total number of cites (since 2019): 6
Average cites per year: 0.86
Publication Metrics
by Dimensions ©
Articles citing this article
List of the papers citing this article based on CrossRef Cited-by.
Related Contents
iForest Similar Articles
Research Articles
Local ecological niche modelling to provide suitability maps for 27 forest tree species in edge conditions
vol. 13, pp. 230-237 (online: 19 June 2020)
Research Articles
The analytic hierarchy process for selection of suitable trees for Mexico City
vol. 13, pp. 541-547 (online: 18 November 2020)
Research Articles
Maximizing growth of Acacia confusa through native plant growth-promoting bacterial inoculation and seed pelleting for revegetation in landslide areas
vol. 19, pp. 28-37 (online: 11 January 2026)
Research Articles
A comparison of models for quantifying growth and standing carbon in UK Scots pine forests
vol. 8, pp. 596-605 (online: 02 February 2015)
Research Articles
Spatio-temporal modelling of forest monitoring data: modelling German tree defoliation data collected between 1989 and 2015 for trend estimation and survey grid examination using GAMMs
vol. 12, pp. 338-348 (online: 05 July 2019)
Research Articles
Use of alternative containers for promoting deep rooting of native forest species used for dryland restoration: the case of Acacia caven
vol. 10, pp. 776-782 (online: 02 September 2017)
Research Articles
Distribution factors of the epiphytic lichen Lobaria pulmonaria (L.) Hoffm. at local and regional spatial scales in the Caucasus: combining species distribution modelling and ecological niche theory
vol. 17, pp. 120-131 (online: 30 April 2024)
Research Articles
The effectiveness of short-term microwave irradiation on the process of seed extraction from Scots pine cones (Pinus sylvestris L.)
vol. 13, pp. 73-79 (online: 13 February 2020)
Research Articles
Modeling compatible taper and stem volume of pure Scots pine stands in Northeastern Turkey
vol. 16, pp. 38-46 (online: 22 January 2023)
Research Articles
Incorporating management history into forest growth modelling
vol. 4, pp. 212-217 (online: 03 November 2011)
iForest Database Search
Search By Author
Search By Keyword
Google Scholar Search
Citing Articles
Search By Author
Search By Keywords
PubMed Search
Search By Author
Search By Keyword


