
Kinetic analysis of poplar wood properties by thermal modification in conventional oven
iForest - Biogeosciences and Forestry, Volume 11, Issue 1, Pages 131-139 (2018)
doi: https://doi.org/10.3832/ifor2422-010
Published: Feb 07, 2018 - Copyright © 2018 SISEF
Research Articles
Collection/Special Issue: COST action FP1407
Understanding wood modification through an integrated scientific and environmental impact approach
Guest Editors: Giacomo Goli, Andreja Kutnar, Dennis Jones, Dick Sandberg
Abstract
The kinetics of several poplar (Populus alba L.) wood properties during thermal modification conducted in conventional oven with air recirculation were analysed and modelled in this paper. A wide range of properties was assessed, such as: equilibrium moisture content, sorption diagram, shrinkage coefficients, specific shrinkage coefficients, mass loss, modulus of elasticity, strength and colour. The tests were executed at different temperatures ranging from 90 °C to 180 °C and with different durations. The time-temperature equivalency was checked and property modifications over time analysed through master curves in order to obtain a general model connecting together properties, treatment temperature and duration. Different activation energies arising from each property evolution with treatment temperature and duration are provided showing that every modification could occur with different kinetics.
Keywords
Poplar Wood Modification, Heat Treatment, Time-temperature Equivalency, Energy of Activation, Kinetic Analysis, Mechanical Properties, Hygroscopicity, Wood Colour
Introduction
The heat treatment of wood involves chemical and physical changes that improve some properties such as dimensional stability, decay resistance, and aesthetics, while simultaneously leading to cell wall degradation ([36]). The effects of heat treatments can be beneficial, and classified as “thermal modification”, or detrimental, then classified as “thermal degradation”. Since thermal modification induces wood degradation, the treatment conditions must be optimized to enhance the positive effects while mitigating the negative ones ([36]). Because heat treatment involves a large number of variables such as temperature, time, and type of atmosphere and treatment sequence, a large number of methods were developed over the years, and a considerable research is still on-going to get a better understanding of the reactions involved. As a consequence, many treatment technologies are actually available on the market ([42], [30]), and the general principles of wood thermal degradation are well documented in textbooks such as Navi & Sandberg ([37]) and Hill ([27]). The whole field of thermo-hydro processing of wood was subjected to large review papers such as Esteves & Pereira ([17]) and Sandberg et al. ([44]); those studies make partially the point on the different effects of thermal modification on properties.
A promising field of application for thermal modification is to consider the artificial aging of wood for special applications in cultural heritage. Many questions about the behaviour of wooden material during aging are still unanswered; wood researchers are more and more investigating cultural heritage problems ([34], [13]). Indeed, because it is often impossible to perform mechanical tests on wood from the cultural heritage, it is practically very difficult to describe the effect of aging on wood. Moreover, the previous conditions of any given specimen of historical wood is usually poorly documented and can only be guessed. Actually, it is well known that aged wood and freshly cut wood have significant hygro-mechanical differences ([17], [15]). The only alternative to destructive tests on cultural heritage artefacts, to get information about aged wood, is to make artificial aging via thermal modification ([40]). Previous works conducted in Japan (RISH Institute and Tsukuba University) have shown similarities in colour properties between naturally aged wood and thermally modified wood ([35], [36]). These studies were mainly carried out on Japanese softwoods traditionally used in construction. Other studies consider thermal modification as very close to natural aging ([20], [21]). As a first coarse approximation thermal modification in conventional oven seems to produce similar results than natural aging; however, the physical properties of aged wood depends also on its hygroscopic history ([16]). Strictly speaking, oven-heated wood is partially different from naturally-aged wood because natural ageing proceeds at moderate relative humidity and not at a dry state. In addition, chemical reactions induced by heating above 150 °C seems to be qualitatively different from those below 150 °C, according to Ganne-Chédeville et al. ([21]).
The data summarized in this study will be useful for modelling and simulating poplar wood modification process by heat treatment. Until now, several scientific works used general energies of activation to model the kinetic of mass-loss during drying process ([10], [41], [8]). The mass loss is widely considered as a good indicator of mechanical performances ([41]) and durability against insects ([9], [25]) and fungal attack ([31]). Nevertheless, considering all properties changes at the same moment with the same rate is not satisfying; the present work will enhance the understanding of wood properties evolution during heat treatment using objective descriptors already exposed in a previous work ([23]) on mass loss, but here extended to other physical and mechanical properties.
Material and methods
Specimens preparation and conditioning
The wood used for this study was Italian Populus alba L. with a density (ρ) of about 0.34 ± 0.02 g cm-3 at standard environmental conditions, 20 °C of temperature (T) and 65% of relative humidity (RH). The annual ring width was 10 ± 2 mm and the estimated age of the tree 30 years. In order to investigate the moisture relations, physical and mechanical properties of unmodified and thermally modified wood material, different types of specimens were cut from heartwood following the anatomical orientations: longitudinal (L), radial (R), tangential (T). A series named L-samples measuring 120 (L) by 20 (R) by 2 (T) mm3 were used to assess the colour variation in LR plane and the bending stiffness and strength in L direction. A series named R-samples measuring 2 (L) by 60 (R) by 10 (T) mm3 were used to assess the bending stiffness in R direction. Finally a series named RT-samples measuring 3 (L) by 40 (R) by 40 (T) mm3 were used to assess the R and T shrinkage. A detailed description of the specimens is given in Tab. 1.
Tab. 1 - Main properties of the unmodified material at oven dry conditions (0% MC).
| Properties | Variable | Series | ||
|---|---|---|---|---|
| L-samples | R-samples | RT-samples | ||
| Sample Characteristics | Dimensions (mm, L×R×T) | 120×20×2 | 2×60×10 | 3×40×40 |
| No. of samples | 288 | 314 | 110 | |
ρo (g cm-3) |
0.31 ± 0.03 | 0.31 ± 0.02 | 0.29 ± 0.01 | |
| MOEod (GPa) | 8.57 ± 0.72 | 0.66 ± 0.06 | - | |
| sMOEod (GPa kg m-3) | 27.30 ± 1.00 | 2.12 ± 0.11 | - | |
| MORod (MPa) | 93.90 ± 11.40 | 10.78 ± 0.93 | - | |
| sMORod (MPa kg m-3) | 0.30 ± 0.02 | 35.00 ± 2.00 | - | |
| L*od | 83.00 ± 1.50 | - | - | |
| a*od | 5.00 ± 0.90 | - | - | |
| b*od | 19.20 ± 1.70 | - | - | |
βS0-85%RH_R |
- | - | 0.13 ± 0.03 | |
βS0-85%RH_T |
- | - | 0.20 ± 0.02 | |
βS0-85%RH_L |
- | - | 0.03 ± 0.01 | |
| Measured Properties |
Colour | Yes | No | No |
| Mechanical tests | Yes | Yes | No | |
| Dimensions | Yes | Yes | Yes | |
| Mass | Yes | Yes | Yes | |
| Swelling coefficients | No | No | Yes | |
| Moisture content | No | No | Yes | |
| Sorption curve | No | No | Yes | |
Out of the total amount of specimens prepared (480 L-samples, 600 R-samples, and 175 RT-samples), a selection was done by removing from the experiment the specimens with a specific modulus of elasticity (sMOE) above or below the value of sMOE ± σ, ending to reduce the number of samples to 288 L-samples, 314 R-samples, and 110 RT-samples.
Thermal modification
The specimens were kept for 3 weeks at environmental standard conditions (20 ± 2 °C and 63 ± 2% RH with NaBr salt powder in excess in distilled water). To determine their dry mass before the thermal modification they were dried at 60 °C in a vacuum oven with P2O5 salts for 24 to 48 hours depending on their dimensions. The dried specimens were then thermally modified in a ventilated oven at four different temperatures: 90, 120, 150, and 180 °C. The 90 °C thermal modification treatment is a very mild treatment that can be very helpful to understand if other reactions take part at higher temperatures or if the model can be extended at lower temperatures. Goli et al. ([23]) studied the effect of air exchange rate (AER) on the modifications kinetic (mass loss); the heat treatments presented in this study had been performed at the same air exchange rate, AER = 220 AE day-1. The treatments schedule is presented in Tab. 2 and it was developed on the base of a time/temperature equivalence assumption, where a 10 °C increase in temperature results in dividing the treatment time by two as largely reported in literature ([46], [12]).
Tab. 2 - Schedule of thermal modification performed in ventilated oven. (a): about 7.5 months; (b): about 5.5 months; (c): about 1 month; (d): one week.
| - | Temperatures (°C) | |||
|---|---|---|---|---|
| 90 | 120 | 150 | 180 | |
| Thermal modification duration (h) |
311 | 43 | 4 | 0.5 |
| 643 | 66 | 9 | 1 | |
| 1056 | 139 | 20 | 2 | |
| 1539 | 209 | 26 | 3 | |
| 2569 | 338 | 44 | 5 | |
| 3602 | - | 60 | 7 | |
| 5542(a) | 643 | 82 | - | |
| - | 811 | 100 | 13 | |
| - | 980 | 130 | - | |
| - | 1171 | 166 | 23 | |
| - | 1539 | 214 | 31 | |
| - | 2323 | 334 | 36 | |
| - | 3072 | 411 | 51 | |
| - | 3842(b) | 504 | 62 | |
| - | - | 600(c) | 78 | |
| - | - | - | 103 | |
| - | - | - | 127 | |
| - | - | - | 168(d) | |
At 90 °C a treatment period up to 7.5 months was scheduled while at 180 °C only 168 hours (1 week) were necessary, showing the large sensitivity of the process to temperature. It is important to notice that most of the properties given in the following sections are measured at oven dry condition. Only equilibrium moisture content (EMC) and shrinkage coefficient involved tests at different moisture contents.
Colour measurement
Fig. 1 - (a) Colour evolutions due to the heat treatments performed measured under a D65 light source and an observe angle of 10°. (b) Colour evolution on samples treated at 180 °C depending on the time of treatment (in hours). (c) 3D representation of the CIE L*a*b* colour space. Markers are the experimental colour measurements and the lines are the application of the model proposed.
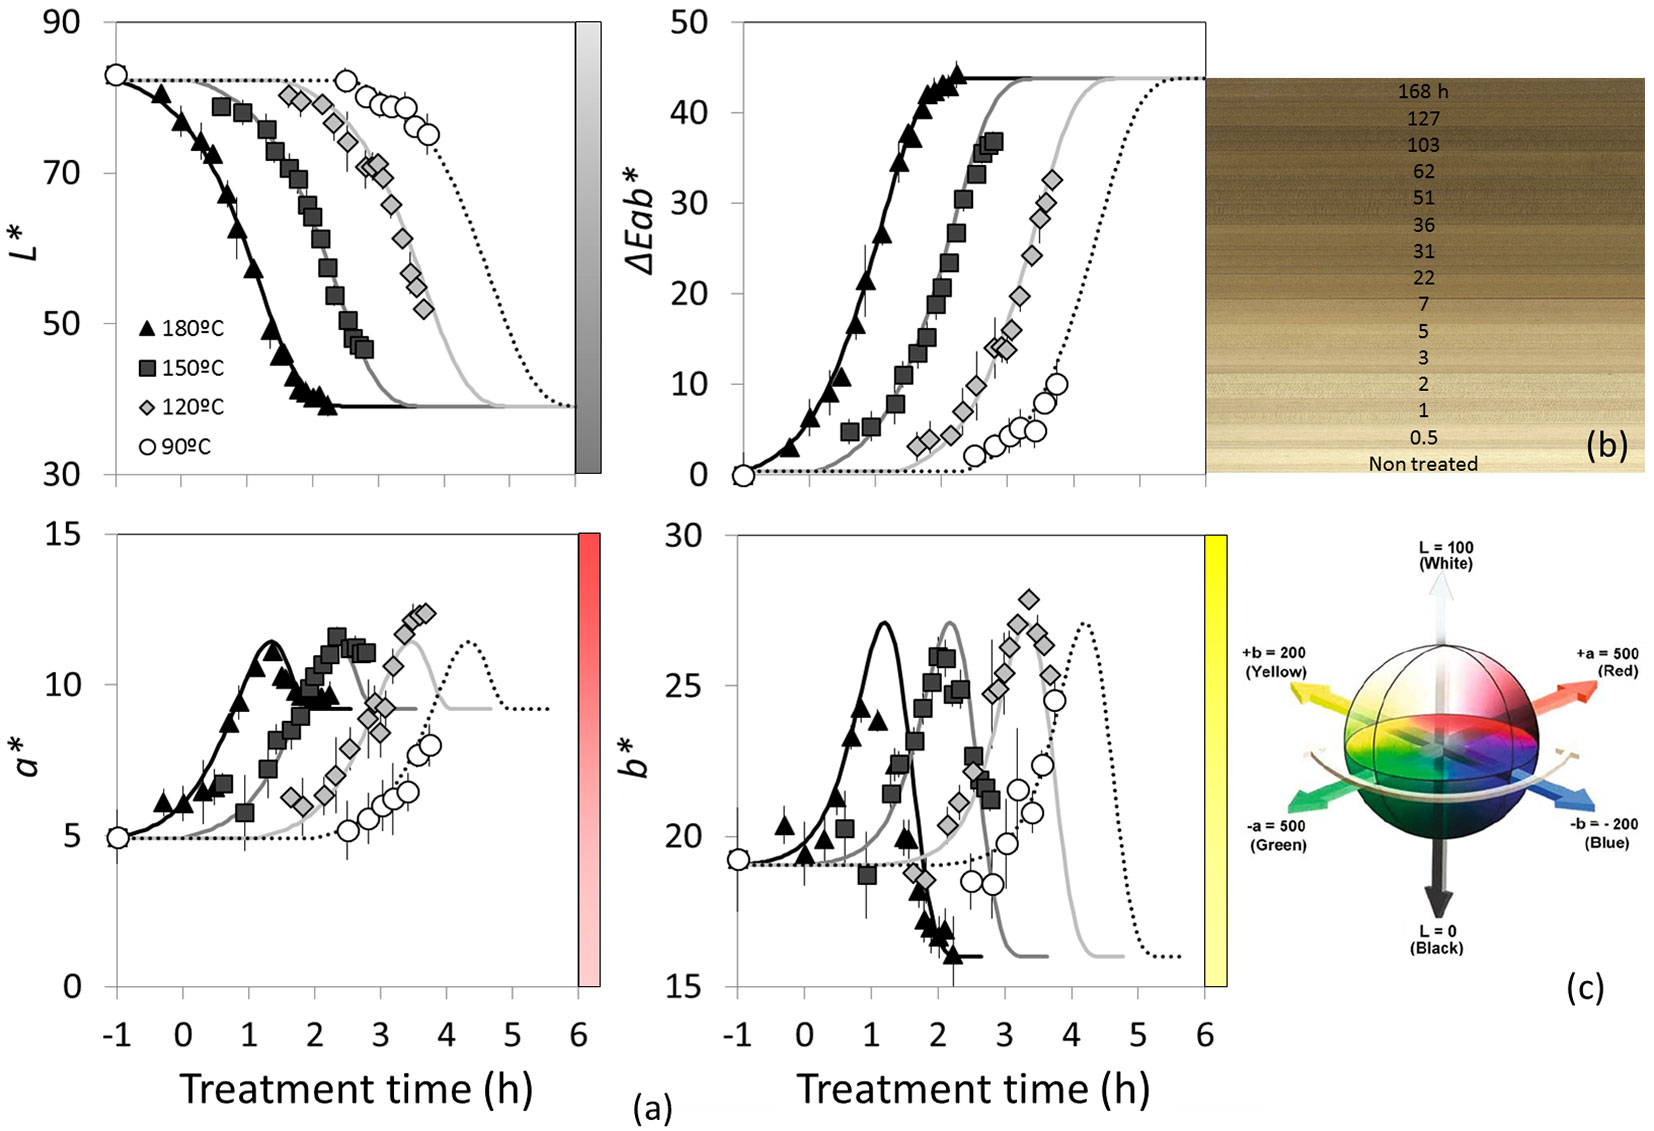
At each treatment step the colour was measured on the oven-dry samples using a Konica Minolta CM-2600d device and expressed with CIE-L*a*b* system. The parameters L*, a*, b* and ΔEab* under a D65 light source and an observation angle of 10° are reported (see Fig. 1c). The measuring area was a circle of 8 mm diameter. The colour measurement was done only for L-samples on the tangential face. On each specimen three measurements were done in three different locations and averaged. The variation of ΔL* , Δa*, Δb*, and the total colour variation ΔEab* were calculated using the following formulas ([4], [36] - eqn. 1, eqn. 2):
where L* is the lightness, a* and b* are the colour coordinates and “0” (in subscript) indicates the reference values obtained as the average of the 288 untreated specimens before heat treatment and in oven dry state.
Physical properties assessment
Samples dimensions in oven dry state were measured before and after the thermal modification by a self-designed apparatus implying Mitutoyo digital gauges with 0.001 mm of accuracy and dedicated spindle lifting cables to enhance test repeatability. The mass was determined by an analytical balance with 0.001 g accuracy. The dimensional variations during the treatment in the different anatomic directions was measured at dry state, while the dry mass losses determined as a relative mass loss from the initial value. The variation of density was also computed from mass and dimensions measurements.
Moisture relations assessment
The moisture relations is studied with two main purposes: to determine sorption isotherms of the modified material as well as the shrinkage coefficients. The sorption isotherms were determined for RT-samples using boxes at constant (20 °C inside a climatic chamber) and four RH levels: 35%, 52%, 63% and 85% obtained by salt dissolution technique as from Young ([52] - see Tab. 3 for details on the salts used).
Tab. 3 - Salts and environmental conditions used for the construction of the sorption isotherms and the computation of shrinkage coefficients.
| Techniques | Temperature (°C) | Relative humidity | Duration (days) |
|---|---|---|---|
| Vacuum oven-drying + P2O5 | 60 | ≈ 0% | > 1 |
| MgCl2 salt in excess | 20 | 35% | >14 |
| Climatic chamber Memmert© | 20 | 52% | >7 |
| NaBr salt in excess | 20 | 63% | >14 |
| KCl salt in excess | 20 | 85% | >14 |
The dry mass used as reference was obtained after a stage at 60 °C in a vacuum oven with P2O5 salts for 24 to 48 hours depending on the dimensions of the specimens and measured at 20 °C. At the different conditions, once the equilibrium moisture content was reached (this was checked by verifying the stability of the mass), the equilibrium moisture content (EMC) was determined according to eqn. 3:
with m(%RH) and mod are the weight of the samples at the given RH and oven dry state, respectively. The swelling coefficient (β) and the specific shrinkage coefficient (βS) were determined considering the dimension at the various EMC levels at 20 °C and the dimension at dry state and computed according to eqn. 4 and eqn. 5:
where dimR%RH is the measured dimensions of the RT-specimens in the given anatomical direction (here R stands for radial) at the equilibrium state with the different relative humidity conditions at 20 °C, dimRod are the same specimens measured at oven dry state, and EMC(RH) is the moisture content determined at the different equilibrium conditions. The isotherms were modelled using the Guggenheim, Anderson and Boer-Dent (GAB) expression. This model is particularly appropriate for food materials and widely used for multi-layer materials such as wood ([5]). GAB system general equation is reported in eqn. 6:
where EMC is the equilibrium moisture content, RH is the relative humidity, and wm, K, and C are the three free parameters characterizing sorption.
Mechanical assessment
Control (un-treated) and thermally modified samples were mechanically tested using a three-points bending test (environment condition of 24 °C and 50 ± 10% RH) with an Instron© material testing machine at oven-dry state. The mass of the tested samples was measured before and after the bending test; the moisture content variation through the test was lower than 2%. The tests were performed with a crosshead speed of 5 mm min-1. The following properties were determined: the Young’s modulus (MOE) and the strength (MOR) in L and R directions, the breaking strain (εm) and the breaking energy (W).
Kinetic analysis
It is widely accepted that the classical Arrhenius law suits very well for the time-temperature equivalence analysis ([47], [26], [22], [29], [11], [23]). The Arrhenius law in classical format is reported in eqn. 7:
where k is the rate constant (dimensionless) of the chemical reaction considered, AT is the pre-exponential factor (dimensionless) with temperature dependency, Ea the apparent activation energy (in kJ mol-1), R = 8.314 J mol-1 K-1 is the universal gas constant and T the absolute temperature (in °K) of the reaction. Considering the pre-exponential factor as a constant usually gives quite good results. This assumption leads to a linear variation in the Arrhenius plots as used for example in Goli et al. ([23]). To improve the accuracy of the method some modified Arrhenius law were proposed to express the temperature dependency, as in Brown ([6]) and Herrera et al. ([26]) who showed a bi-linear law instead of the widely used linear one and a constant pre-exponential factor, or in Dlouhá et al. ([12]) who added a softening effect with temperature. A non-constant pre-exponential factor is then introduced by ([33]) as shown in eqn. 8:
where the pre-exponential factor A is here a constant and the temperature power n is an empirical dimensionless constant typically lying in the range -1<n<1. The model is completed by the computation of the horizontal (log time) shift factor (aT) to reach the correspondence between the curve obtained at the given temperature T and the one at the reference temperature Tref as shown in eqn. 9:
Some authors discussed the validity of Arrhenius law linearity to explain reaction rates and time-temperature effects ([6], [1], [29], [48]). However, in the case of samples free from external loads during the thermal modification and at quite low temperature, there is no doubt on the relevance of the law application. Besides, others authors have applied the model to structural modification such as Repellin & Guyonnet ([43]).
Results and discussion
In this section, the Arrhenius law applicability is verified and the evolution of the physical and mechanical properties with treatment temperature and duration is reported; both experimental and modelled data are shown. The parameters used to perform the whole modelling are summarized in Tab. S1 (Supplementary material) on the theoretical basis of Goli et al. ([23]) improved with the pre-exponential factor dependency to temperature as presented in the following subsection.
Kinetic analysis
Fig. 2 - (a) Moisture content Arrhenius plot of the horizontal shift factor with different fitting strategies: a global linear regression (dashed grey line) highlights how the linear approach without pre-exponential factor (A(T)/A(T-ref) = 1) can be limited and how the use of a non-linear (purple continuous line) pre-exponential factor (A(T)/A(T-ref) ≠ 1) can be used to improve the fitting; aT is the horizontal shift factor. (b) The perfect fit of the model using the pre-exponential factor as linearly dependent of the treatment temperature is displayed.
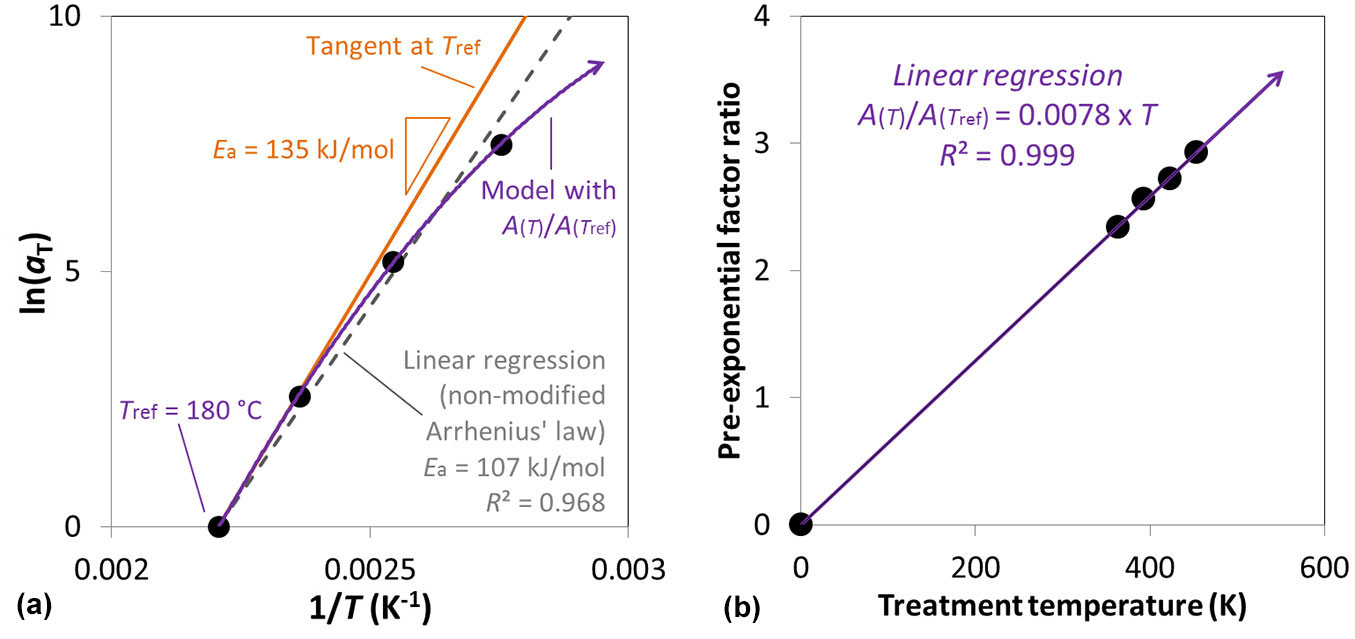
An observation of the Arrhenius plots of the moisture content evolution is presented in Fig. 2a; only this plot is shown out of all the analyses performed for the sake of brevity. As for the Arrhenius plots present in the extensive works of Matsuo et al. ([35], [36]), a simple non-modified Arrhenius law could exhibit some weakness. To be more specific, the non-modified approach is very suitable when it comes to model evolutions in the range of temperatures considered to identify the model (as for the previously cited works) and its energy of activation. For instance, the model accuracy is R² = 0.968 for a non-modified Arrhenius approach (Fig. 2a). Nonetheless, several authors expressed limitations and advices to reconsider the application of the non-modified Arrhenius law in favour to a modified one ([49], [2], [7]). Hence, to obtain a predictive model for temperature out of the temperature domain studied (used for the identification), it is absolutely necessary to improve the determination of the kinetic law. To such purpose, the present study introduces a new way to express the pre-exponential temperature dependency, since it seems logical to consider a constant energy of activation, constituting a material property of the wooden species for the considered property. Consequently, the energy of activation is determined as being the slope of the tangent at the chosen reference temperature (here Tref = 180 °C) divided by the universal gas constant (R). Hence, here is considered a pre-exponential factor function of the temperature considered, as define by the eqn. 10.
where the pre-exponential factor has to be identified experimentally and probably depends of the wooden species, as suggested by previous works ([35], [36]).
Fig. 2b shows the identification obtained using the EMC data and provides the evolution of the pre-exponential factor as (eqn. 11):
for Tref = 180 °C. This pre-exponential temperature dependency has been checked on the whole properties considered in this study and results as very accurate for all of them; those other plots are not presented. All the kinetic models proposed for all the properties, summarized in Tab. S1 (Supplementary material), are considering this pre-exponential dependency to temperature.
Colour modification
The effect of the thermal modification on the samples colour is shown in Fig. 1a. It has the effect to reduce considerably the lightness (L*) by 53% (from 89 to 39), resulting in an important darkening (Fig. 1b). This darkening leads to an increase in Eab*, which is mainly driven by a decrease in L*, since the variations of a* and b* are relatively less important. On the other hand, while L* presents a continuous reduction, the a* and b* chromatic parameters result in more complex behaviours, increasing at a first stage and decreasing in a second stage; this is the result of a first oxidation reaction followed afterward by a degradation of the constitutive hemicelluloses polymers. The hemicelluloses starts to decay at about 120 °C ([50]), through a deacetylation process that creates acetic acid acting as a catalyser for subsequent depolymerisation ([18], [50]) and a lignin reticulation ([46], [50], [43]). Emsley & Stevens ([14]) indicates that the cellulose compound experiences a decomposition process to furfural, then proceeds by a series of rearrangement and elimination reactions as also reported by Shafizadeh & Peter ([45]). Both a* and b* evolution are the result of those different chemical reactions occurring at different treatment times; they remain in the CIE-L*a*b* reddish and yellowish areas leading to the orange/brown colour.
For a* and b*, a moderate increase of their maximum value can be observed. Several authors ([29], [48], [12]) observed such effect and applied a vertical shift factor (usually referred as bT) in addition to the more classical horizontal shift factor (in log time axis); this effect is not taken into account in this model, since it has not been fully identified over a wide range of temperatures.
Physical properties modification
The relative reduction (%) of the oven-dry dimensions consecutive to the thermal modification are reported in Fig. 3. This reduction was measured separately for L, R and T directions. As it can be observed, the trends are very clear and the model follows the experimental results. The reduction is conspicuous for T and R directions, while it is negligible in the L direction. The ratio between T and R reduction is about 2, being the same as the T over R ratio of drying shrinkage coefficients for unmodified wood. These data confirm that hemicelluloses suffer a larger thermal degradation compared to the other wood constituents, considering their dominant contribution to the drying shrinkage in the transverse directions. On the other hand, the longitudinal bonds of wood are less affected since the shortening in this direction is negligible. The relative reduction in volume (%) at dry state shows a trend very similar to T and R directions with an excellent accuracy of the model. Oven-dry mass and oven-dry density show the same behaviour, highlighting how the main physical properties exhibit the same trends and how the model presents a good agreement with the experimental data.
Fig. 3 - Physical properties, measured at dry state, evolution over treatment duration for different modification temperatures. The markers are the experimental data while the lines are the identified model. The time axis scale is logarithmic.
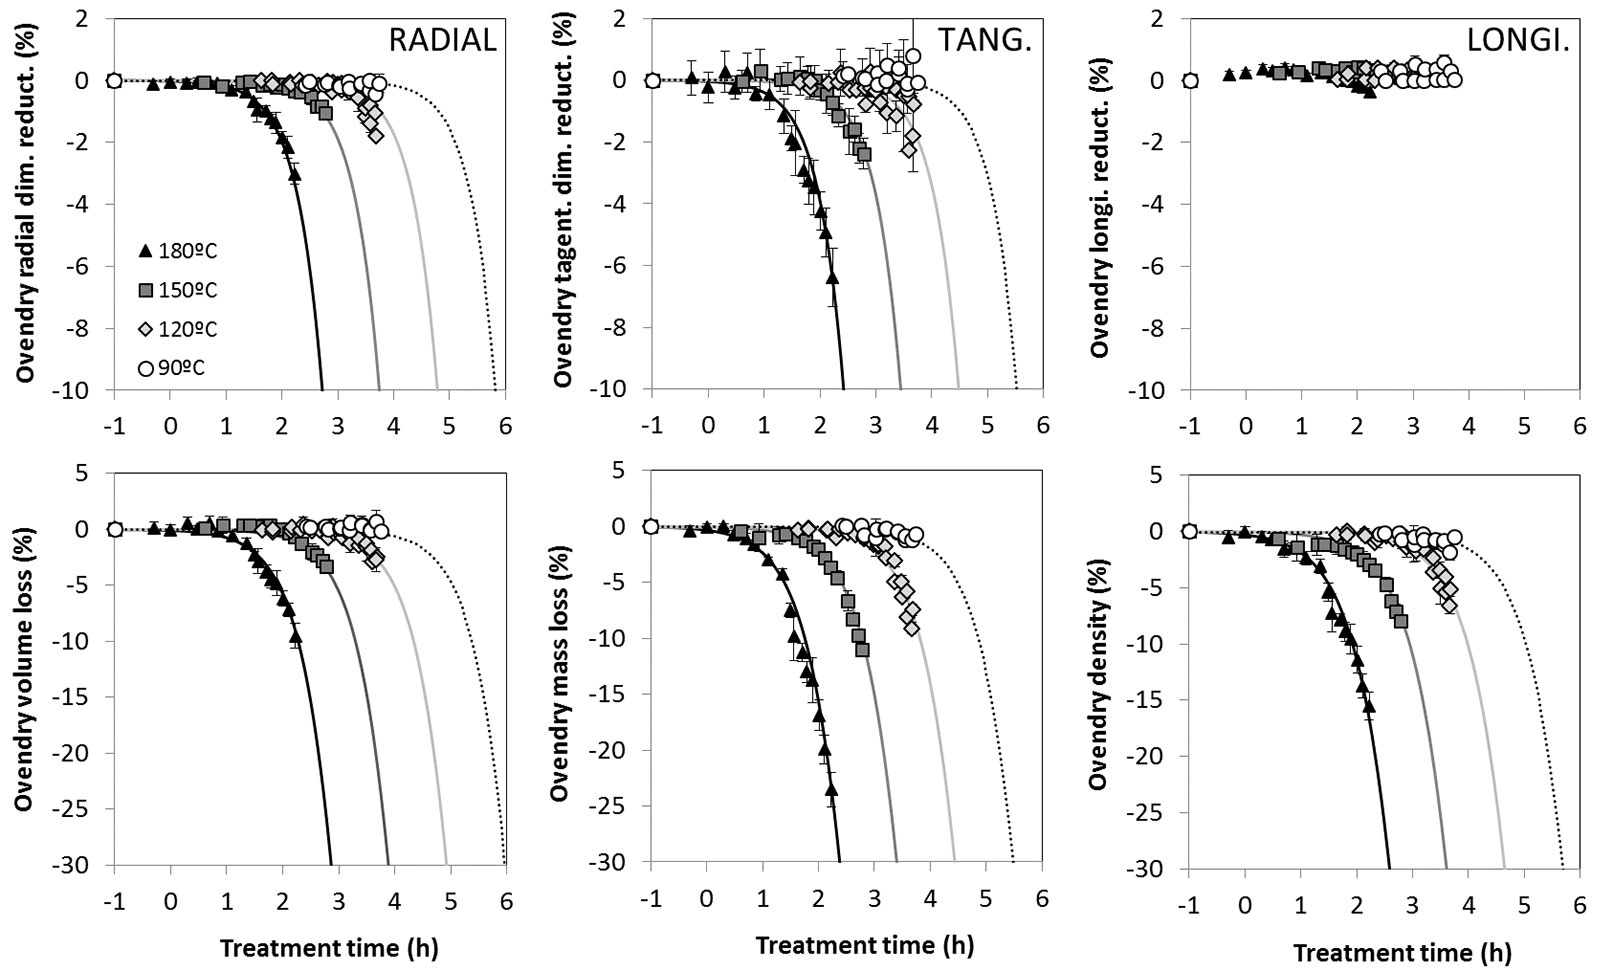
The high accuracy of the model, that fits well with different temperatures ranging from 90 to 180 °C, shows how the ongoing reaction is the same but made faster or slower because of the effect of temperature. In this case, as for the other properties studied, the time/temperature equivalency is effective: different temperatures can result with the same effects in different amount of time.
Moisture relations modification
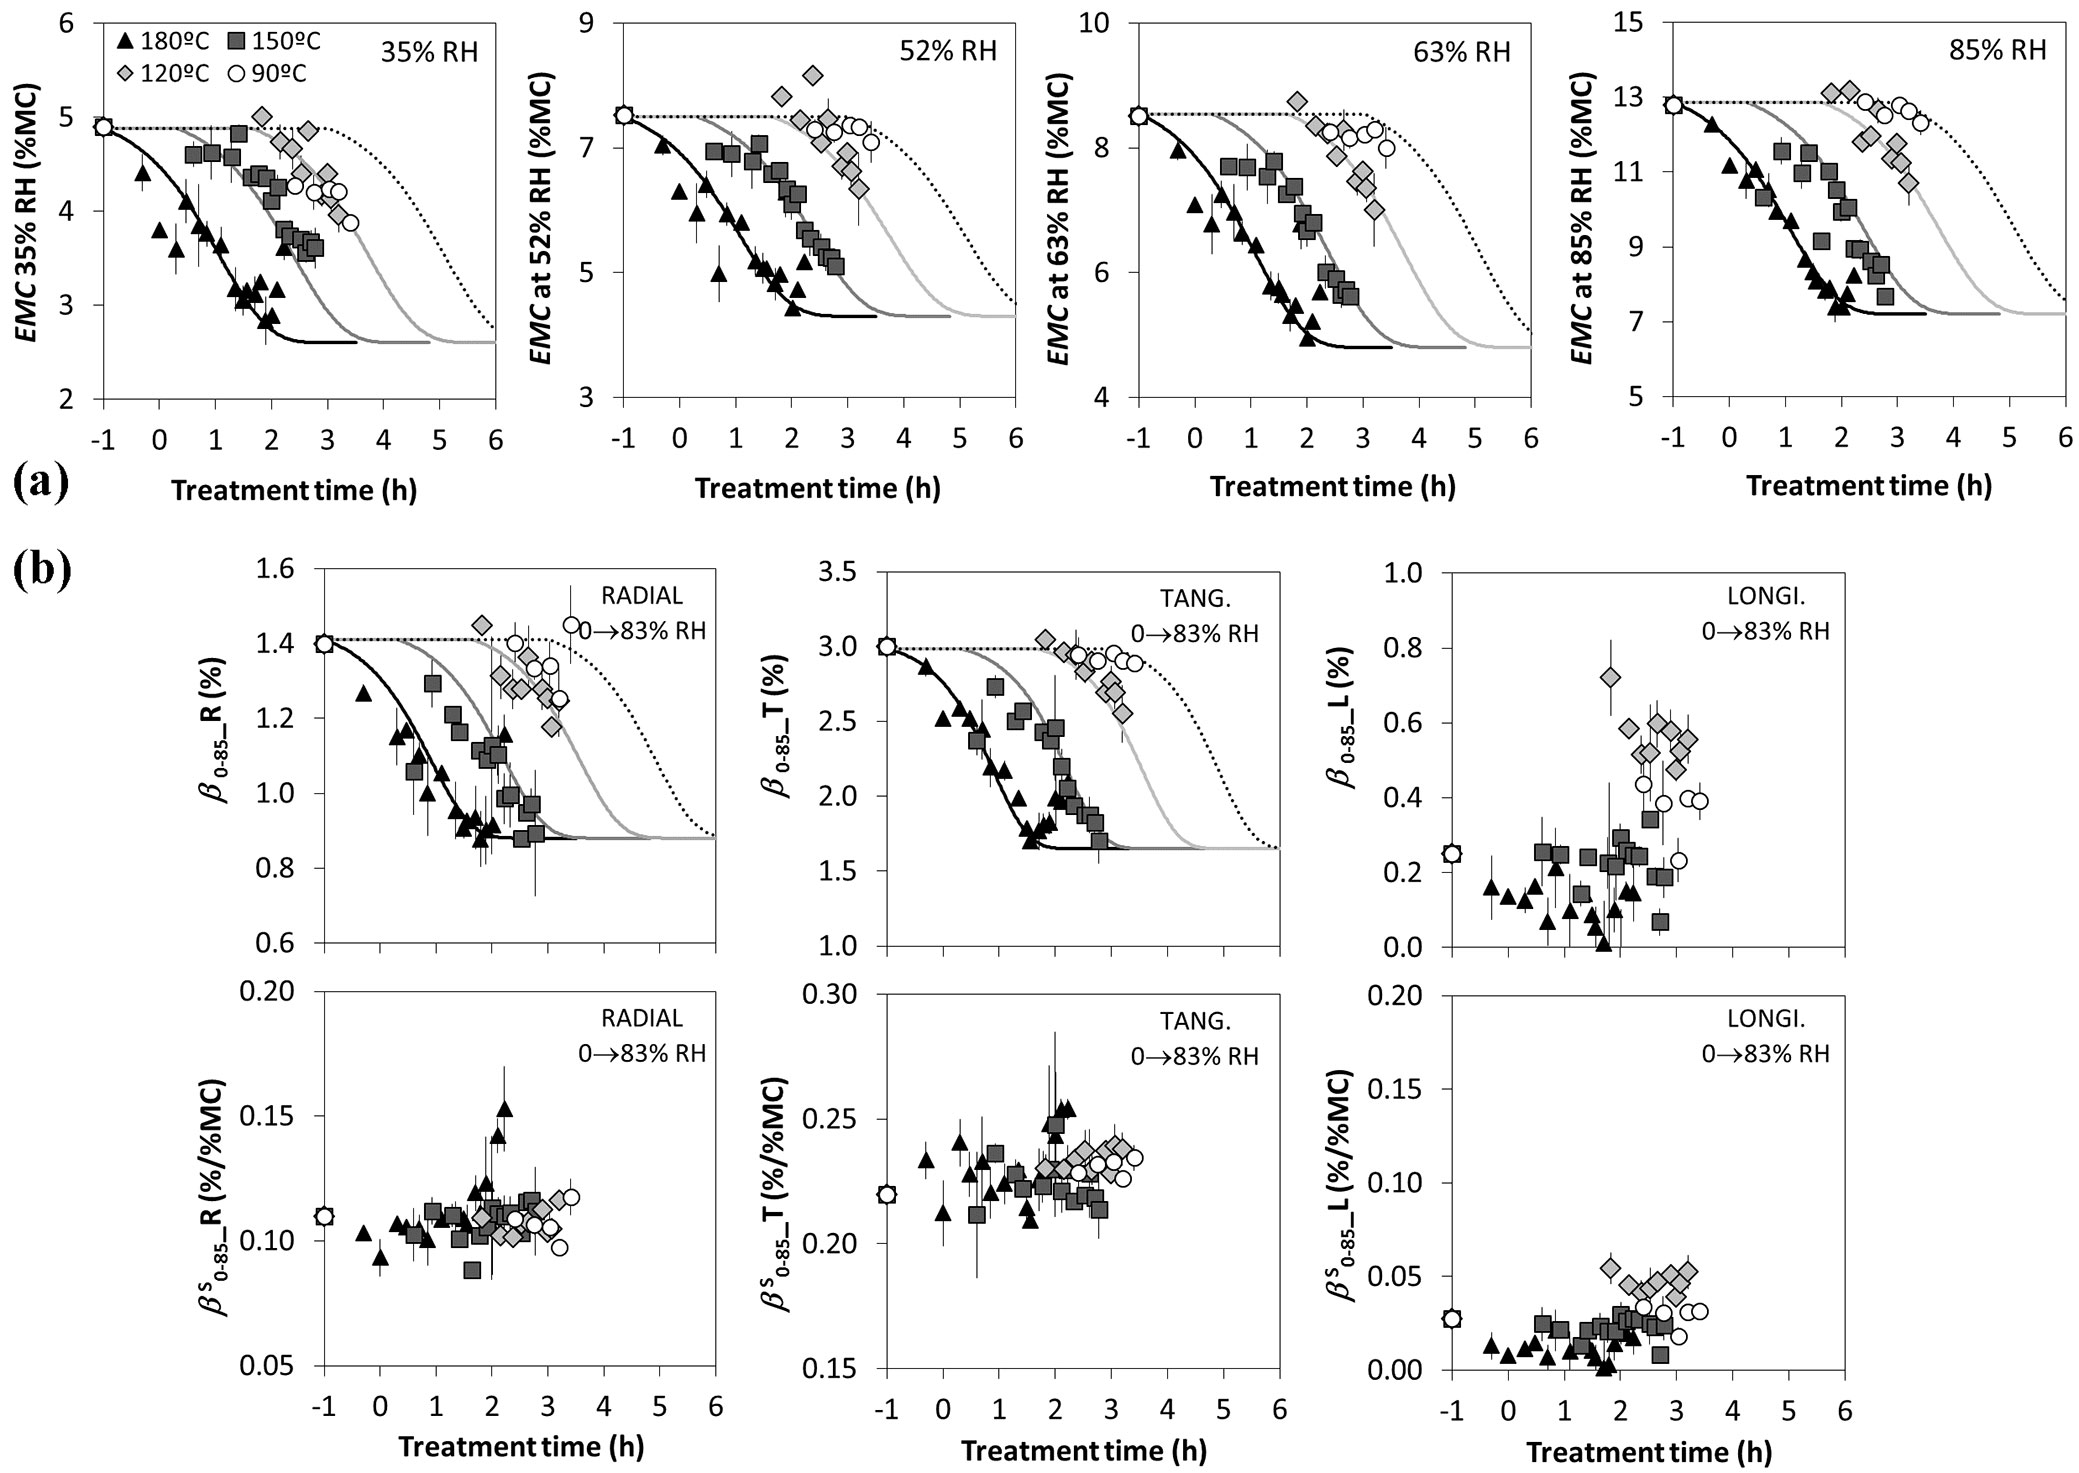
As shown in Fig. 4, the moisture content at different equilibrium conditions decreases significantly with the thermal modification intensity. The longer the treatment duration, the lower becomes the EMC; and the higher the treatment temperature, the faster the EMC reduction. The EMC reduction is generally ascribed to the degradation of hemicelluloses that leads to a reduction of hydroxyl groups and then to a lower capacity of the cell wall to bond with water. Crosslinking between molecules can also be part of the reason of reduction of water bonding sites. Esteves & Pereira ([17]) have also shown an enhanced inaccessibility of cellulose hydroxyl groups to water molecules due to the increase of cellulose crystallinity. Repellin & Guyonnet ([43]) studied the swelling of heat-treated beech wood by differential scanning calorimetry in relation to chemical composition, and concluded that the reduction of wood swelling could not be attributed only to the disappearance of adsorption sites by hemicellulose destruction, but other phenomena such as structural modifications and chemical changes of lignin might also play an important role. Fig. 4 also shows the behaviour of the shrinkage coefficients (β) in R, T, and L directions as determined from eqn. 4. The total shrinkage gradually decreases with the treatment intensity and it decreases faster at higher temperatures, showing a behaviour in line with the expectations and a good predictability by the model. The specific shrinkage coefficients (βs) as computed from eqn. 5 are also reported in Fig. 4: the T shrinkage coefficient is almost twice as the R shrinkage coefficient, while the L is negligible (this behaviour is in line with the expectations). It is not surprising that the specific shrinkage coefficients does not vary significantly with the treatment temperature and duration while the total shrinkage coefficients (β) decreases, the EMC also decreases. This statement is supported by Hill ([27]) and Hill et al. ([28]) and finds its rationale in the fact that, even if sorption sites are lost during thermal modification, in order to get to the same shrinkage or swelling, the same amount of water must be lost or adsorbed. As a direct consequence, it is important to consider that the observed increase in dimensional stability (largely exposed in literature) is mainly due to a general reduction of the equilibrium moisture content.
Fig. 4 - Moisture relations vs. treatment temperature and duration (time axis is in logarithmic scale). Symbols represent the experimental data, while the lines are the identified model. (a) Equilibrium Moisture Content (EMC) measured at 35%, 52%, 63% and 85% of relative humidity and 20 °C. (b) Values of the shrinkage coefficients (β) and specific shrinkage coefficients (βS) in the main anatomical directions (R, T and L) measured passing from the equilibrium condition with 85% RH and 20 °C to the oven dry state.
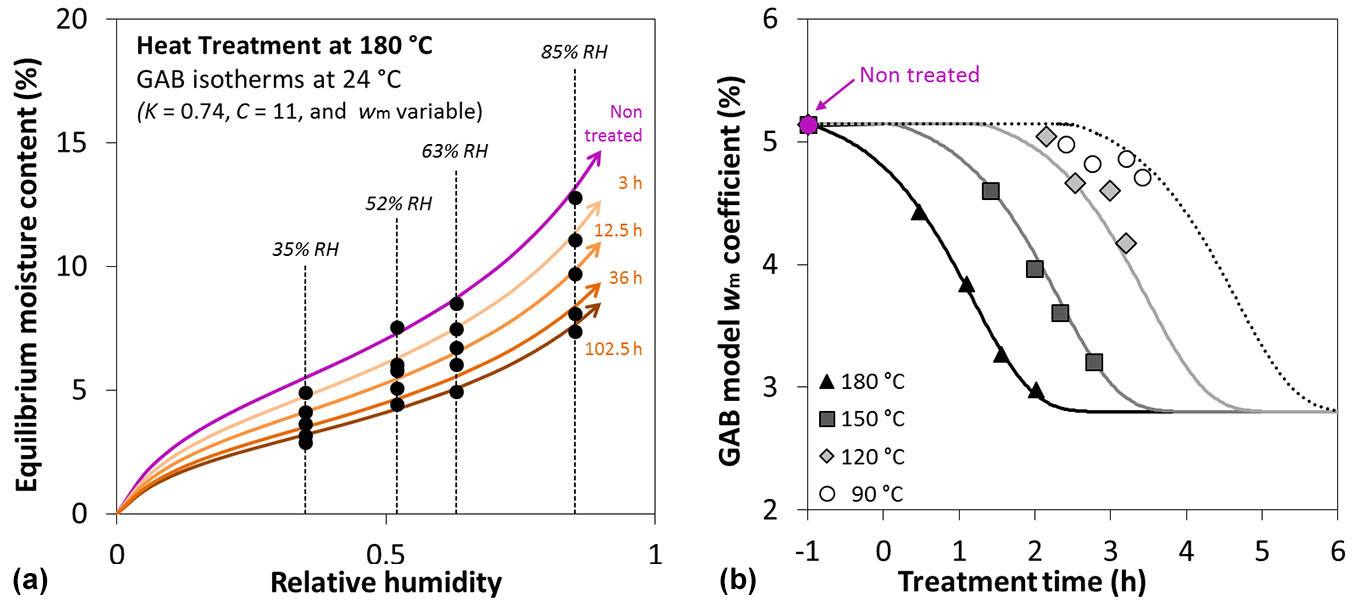
As regards the hygrothermal behaviour, the control samples (untreated) studied in this paper exhibit a sorption behaviour that leads to the following GAB coefficients: wm= 5.1%, K = 0.74, and C = 11.0. The fitting performed to identify the GAB coefficients for the different moisture contents, the treatment durations, and the different temperatures highlights that GAB coefficient wm is influenced by the heat modification, while both the GAB coefficients K and C remain unchanged regardless of the temperature and duration of the treatment. In Fig. 5a, the EMC of poplar wood treated at 180 °C for different durations is reported for an isotherm at 24 °C. It clearly shows how modified wood presents a lower EMC than the control and how the treatment duration affects the EMC decrease. The effect is the same for all the tested modification temperatures. This is a very important factor for modified wood because a generally lower EMC results in a better resistance to biological degradation. It can also be noted how the EMC reduction is higher for high RH than for low RH. In Fig. 5b, the evolution of wm with different treatment temperatures and durations is shown. The trends clearly shows how the kinetic analysis can be successfully applied also to GAB coefficients.
Fig. 5 - (a) Adsorption isotherm of a sample thermally modified at 180 °C at different durations. Sorption curves (plain lines) arise from a GAB sorption model identified on the experimental data (dots). (b) Evolution of the GAB model coefficient wm over heat treatment time (horizontal axis, in logarithmic scale) and duration; symbols represent the experimental points and the lines are the identified model.
Mechanical properties modifications
The changes in mechanical properties due to thermal modification, measured at dry state, are reported in Fig. 6.
Fig. 6 - Longitudinal (left column) and radial (right column) mechanical properties evolution over modification time (horizontal axis, in logarithmic scale); symbols represent the experimental points and the lines are the identified model.
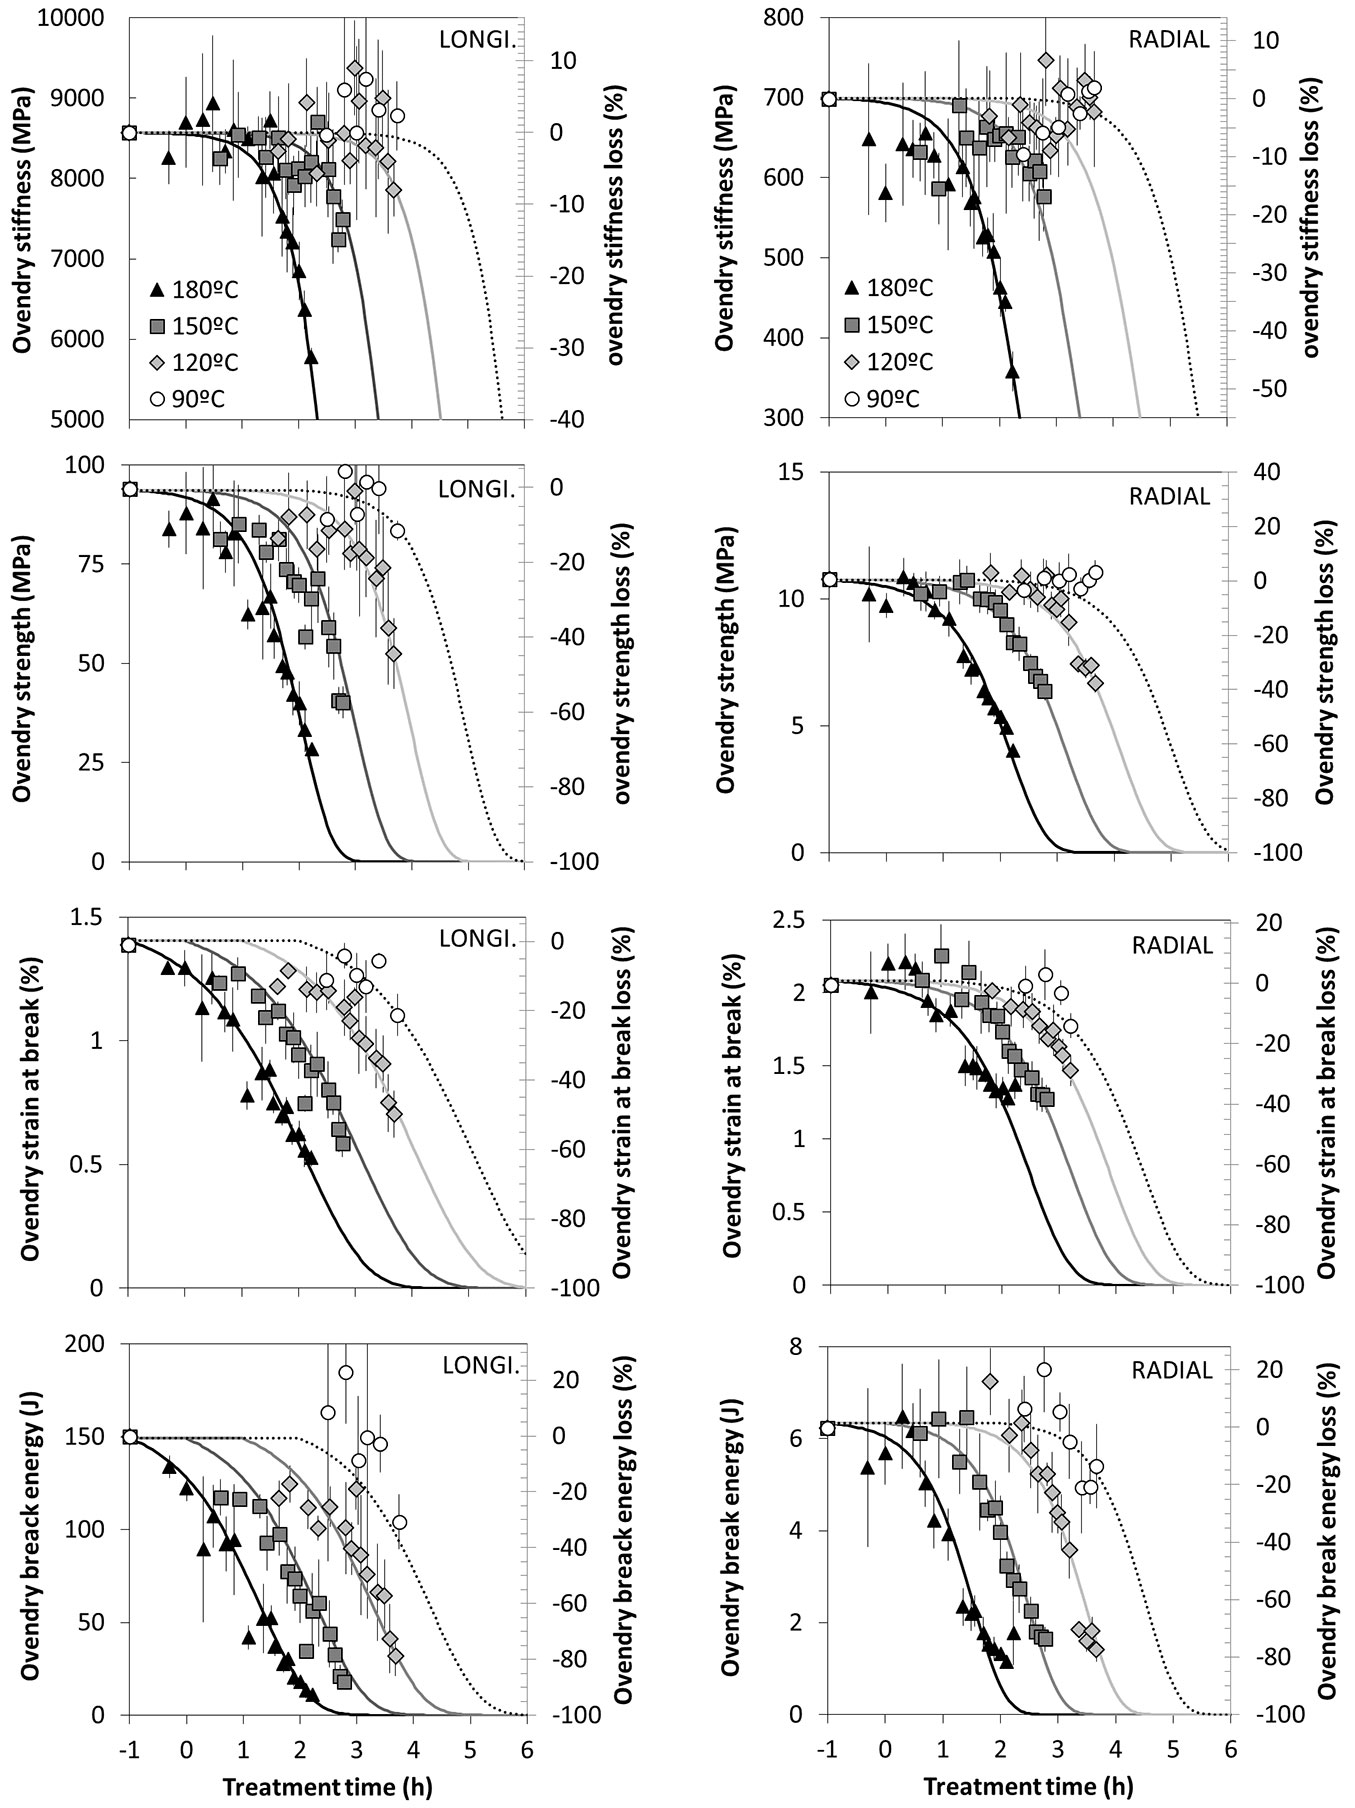
As a general rule the mechanical performances are markedly reduced by the thermal modification. The higher the treatment duration, the higher the reduction. The temperature, as for the other processes, accelerates the reaction. This reduction directly depends on the cell wall loss, that has a negative effect on the stiffness (MOE) both in L and R directions. This behaviour is widely described in the literature (e.g., [3], [38]). Several research works report the fact that thermal modifications improve the stiffness of the material in the initial phase ([17]) before dropping drastically afterward. It is worth pointing out that the experimental data shown in Fig. 6 are not exhibiting such behaviour. The above authors believe that this behaviour is a direct consequence of the dry state condition prepared for testing the specimen. The thermal modification results in loss of cell wall material but also in a decreased EMC that could result in an apparent stiffness increase. Thus, the conclusions on the increase of the initial stiffness generally observed by the aforementioned authors has to be mitigated, since the moisture content is reduced as well during the heat treatment. In order to understand the role of cell wall loss and EMC variation on the stiffness at low modification rates, the stiffness measured at dry state was corrected according to the empirical model proposed by Guitard ([24]) and reported in eqn. 12 (see below). The stiffness at 20 °C of temperature and 65% of relative humidity MOELEMC was then computed according to the EMC levels measured in this work as follows (eqn. 12):
As shown in the Fig. S1 (Supplementary material), the oven dry stiffness does not increase at low modification rates but remains constant before decreasing. On the other hand, the apparent stiffness computed at standard environmental conditions (20 °C of temperature and 65% of relative humidity) increases at low modification rates as a consequence of the moisture content reduction due to the thermal modification. According to Esteves & Pereira ([17]), some authors explain the increased stiffness by the increase of cellulose crystallinity. Because this behaviour was not observed in our experimental work at dry state, only the variation of the equilibrium moisture content seems to justify the initial improvement in stiffness. Similar conclusions could be drawn on the strength trend and other mechanical properties when an apparent improvement for low modification rates is reported ([19]).
To summarize, during the thermal modification: (a) for low modification rates (under 5% of mass loss), the stiffness reduction because of the cell wall degradation cannot compensate the stiffness increase due to lessening of moisture content, resulting in an apparent improvement of the stiffness; (b) for higher modification rates (greater than 5% of mass loss), the trend is reversed because the cell wall degradation has a stronger impact than the moisture content reduction on the apparent stiffness. As regards the natural aging of wood, some authors ([32], [39]) gave the same conclusions about the improvement of the mechanical properties during the first 300 years of natural aging before a drop of the performances.
The strength (MOR) is lowered severely as well, e.g., by 80% while the MOE had been reduced by about 30% at the end of the 168 hours of heat treatment at 180 °C. MOR can drop until being almost null for very extreme treatments (high temperature and/or long exposure time). Several authors studied the strength modification after heat treatment ([51], [20]) and observed the same effects. The maximal strain at breaking and the energy needed to break the samples in flexural tests are provided in Fig. S2 (Supplementary material); those properties exhibit the same trends than the MOE and the MOR. The kinetic model proposed and fitted to the experimental data follows very accurately the mechanical properties over treatment duration and temperatures.
Properties relations to mass loss
The property modifications occurring under thermal modification in conventional oven can be also related to mass loss. This is important because mass loss is one of the easiest parameters to be measured during the treatments and one of the best indicators of treatment intensity, as reported by Candelier et al. ([9]). Hence, all relevant properties (those significantly affected by heat treatment) are plotted against mass loss variation in Fig. S2 (Supplementary material). The relation between mass loss and a given property variation can be very different depending on the property considered: monotonous and linear relationships are observed in some cases or much more complex relations in others. First, the modifications are all strongly related to the mass loss; second, the heat treatment temperature does not produce significant differences, since all experimental points, whatever the temperature, are overlapping. The trends, being independent on the temperature, clearly confirm the time-temperature equivalency principle. For several property variations, such as oven-dry dimensions, oven-dry volume, and oven-dry density, the trends are very close to linearity up to very large mass loss rates; in those specific cases, a linear approximation is provided in the graphs allowing to compute the property variation, from a measured mass loss, in an easier way than fully applying the kinetic models proposed in this work. For the other properties, the behaviour could be simplified with a linear relation but up to 5% mass loss only. The absence of a linear trend above that level suggest that the properties do not follow the same kinetics and that heat treatments are complex processes to understand and control.
Nevertheless, the kinetic model seems not to be perfectly accurate to predict the variations of few properties such as moisture content, swelling/shrinkage coefficients, and strain at break for mass losses greater than 20%. These unexpected results, concerning a limited number of conditions, are possibly due to experimental issues since an increase of the moisture content appears not plausible.
Conclusions
The present work has made an assessment of the changes of most properties of poplar wood when subjected to thermal modification applied with different temperatures and durations in a conventional atmosphere. The variation of the physical and mechanical properties as well as the wood-moisture relations were modelled with a modified Arrhenius law approach and a pre-exponential dependency to temperature was identified; the model parameters identifications for each properties are summarized in the Tab. S1 (Supplementary material). The proposed models showed a very good ability to describe the experimental data for temperatures ranging from 90 to 180 °C. This approach has shown to work well up to 260 °C ([23]). The kinetic model proposed is evidently accurate for colour, mass loss and hydric shrinkage. However, a noticeable deviation was observed in hygroscopic and mechanical parameters for heating at low temperatures (90 °C). This could be due to different chemical reactions occurring at higher temperatures compared to those at lower temperatures; this statement should be mitigated by the few data obtained to check the model reliability at that low temperature, because of the very long treatment duration (10 months of treatment has allowed only to obtain 4 experimental points).
This kind of model could be profitably used in industry to predict any property variation resulting from a treatment ranging between the experimental maximal and minimal temperature. The good agreement of the data from 90 °C to 180 °C with the model predictions shows how the chemical degradation processes occurring at the different temperatures are not very far the one from the other. However, the present study highlights the fact that properties are modified at different time and with different kinetics during the heat treatment. Moreover, the good fit of very low treatment temperatures with the other data suggests that possibly the thermal modification of wood cannot be considered very far from conventional aging of wood.
The model proposed could help modelling the whole set of properties variation in a given material for any industrial treatment, even though it has some limitations in terms of risk of fire under such conditions. Our results demonstrates that it is possible to target a specific final product quality and to choose the suitable treatment to apply. The direct transposition of the results of this work to actual industrial wood modification processes is currently ongoing under steam environment.
Acknowledgments
The authors acknowledge funding from JSPS (Japan Society for the Promotion of Science) and Professor Shuichi Kawai from the RISH, Ky0to University (Japan) for hosting in his research team. Special thanks to Prof. Luca Uzielli (Dept. GESAAF, Florence University, Italy) who provided the wood material for this study and for the discussion and advises over many years on wood science and cultural heritage wooden artefacts preservation.
References
CrossRef | Gscholar
Online | Gscholar
Gscholar
Gscholar
Gscholar
Gscholar
Gscholar
Gscholar
Gscholar
Online | Gscholar
Gscholar
Authors’ Info
Authors’ Affiliation
GESAAF, University of Florence, Florence (Italy)
Laboratory of Sustainable Materials, University of Kyoto, Kyoto (Japan)
Laboratory of Bio-Material Physics, University of Nagoya, Nagoya (Japan)
CNRS, University of Clermont Auvergne, Institut Pascal, Clermont-Ferrand (France)
Graduate School of Advanced Integrated Studies in Human Survivability, University of Kyoto, Kyoto (Japan)
Corresponding author
Paper Info
Citation
Marcon B, Goli G, Matsuo-Ueda M, Denaud L, Umemura K, Gril J, Kawai S (2018). Kinetic analysis of poplar wood properties by thermal modification in conventional oven. iForest 11: 131-139. - doi: 10.3832/ifor2422-010
Academic Editor
Giacomo Goli
Paper history
Received: Mar 09, 2017
Accepted: Nov 23, 2017
First online: Feb 07, 2018
Publication Date: Feb 28, 2018
Publication Time: 2.53 months
Copyright Information
© SISEF - The Italian Society of Silviculture and Forest Ecology 2018
Open Access
This article is distributed under the terms of the Creative Commons Attribution-Non Commercial 4.0 International (https://creativecommons.org/licenses/by-nc/4.0/), which permits unrestricted use, distribution, and reproduction in any medium, provided you give appropriate credit to the original author(s) and the source, provide a link to the Creative Commons license, and indicate if changes were made.

Web Metrics
Breakdown by View Type
Article Usage
Total Article Views: 54249
(from publication date up to now)
Breakdown by View Type
HTML Page Views: 44233
Abstract Page Views: 4723
PDF Downloads: 4092
Citation/Reference Downloads: 16
XML Downloads: 1185
Web Metrics
Days since publication: 3052
Overall contacts: 54249
Avg. contacts per week: 124.42
Article Citations
Article citations are based on data periodically collected from the Clarivate Web of Science web site
(last update: Mar 2025)
Total number of cites (since 2018): 19
Average cites per year: 2.38
Publication Metrics
by Dimensions ©
Articles citing this article
List of the papers citing this article based on CrossRef Cited-by.
Related Contents
iForest Similar Articles
Research Articles
Improving dimensional stability of Populus cathayana wood by suberin monomers with heat treatment
vol. 14, pp. 313-319 (online: 01 July 2021)
Research Articles
Physical-mechanical properties and bonding quality of heat treated poplar (I-214 clone) and ceiba plywood
vol. 8, pp. 687-692 (online: 17 December 2014)
Research Articles
Heat treatment of poplar plywood: modifications in physical, mechanical and durability properties
vol. 16, pp. 1-9 (online: 09 January 2023)
Short Communications
Changes in Populus sp. wood subjected to heat treatment: anatomy and silica content
vol. 18, pp. 223-226 (online: 09 August 2025)
Research Articles
Thermo-modified native black poplar (Populus nigra L.) wood as an insulation material
vol. 14, pp. 268-273 (online: 29 May 2021)
Research Articles
Physical and mechanical characteristics of poor-quality wood after heat treatment
vol. 8, pp. 884-891 (online: 22 May 2015)
Research Articles
Examining the evolution and convergence of wood modification and environmental impact assessment in research
vol. 10, pp. 879-885 (online: 06 November 2017)
Research Articles
Physical, chemical and mechanical properties of Pinus sylvestris wood at five sites in Portugal
vol. 10, pp. 669-679 (online: 11 July 2017)
Technical Advances
Technical properties of beech wood from aged coppices in central Italy
vol. 8, pp. 82-88 (online: 04 June 2014)
Research Articles
Mechanical and physical properties of Cunninghamia lanceolata wood decayed by brown rot
vol. 12, pp. 317-322 (online: 06 June 2019)
iForest Database Search
Google Scholar Search
Citing Articles
Search By Author
Search By Keywords


