Big data and evaluation of cultural ecosystem services: an analysis based on geotagged photographs from social media in Tuscan forest (Italy)
iForest - Biogeosciences and Forestry, Volume 12, Issue 1, Pages 98-105 (2019)
doi: https://doi.org/10.3832/ifor2821-011
Published: Feb 11, 2019 - Copyright © 2019 SISEF
Research Articles
Abstract
The paper presents a methodology to quantify the suitability of forest stands for the potential delivery of cultural ecosystem services (CES). The quantification of CES represents a complicated task in the framework of ecosystem service valuation. Compared to traditional investigations, focusing on the study of the aesthetic appreciation of a particular territory, the use of geotagged photographs seems to be a promising alternative to appraise CES. Thus, in order to analyse CES with a particular focus on the aesthetic appreciation of forest stands, this study exploits big data through the analysis of photos shared on the Flickr social network. Crowdsourced datasets are used to depict the geographic location and density of pictures - expressed as the number of photos per unit of surface - as well as their relationship to forest variables and logistic characteristics. The implemented geostatistical model is used to spatialise the results at the regional level (Tuscany forests, Italy). Among the outputs, high values of CES are stressed for high forest and protected areas. From a forest species viewpoint, silver fir, coastal Mediterranean pine, beech and mixed forests seem to be more appreciated compared to other stand typologies such as oaks (e.g., pubescent or Turkey oak) and thermophilic broad-leaved species. Additional quantitative parameters (e.g., elevation, biomass stock and distance to main roads) were significant to the CES assessment. The potential applications of the technique to support forest planning and management are discussed.
Keywords
Forest Aesthetic Value, Social Network, Maximum Entropy Models, Tag-cloud, Geographic Information Systems
Introduction
The Millennium Ecosystem Assessment ([28]) defines cultural ecosystem services (CES) as “the non-material benefits that people obtain from ecosystems through spiritual enrichment, cognitive development, reflection, recreation and aesthetic experiences”. The review conducted by Milcu et al. ([27]) has shown that most of the research on CES has been focused on recreation, ecotourism and the aesthetic value of landscapes due to their strong economic importance ([18], [27]). Travel and tourism directly accounted for 3.1% of the global gross domestic product (GDP) in 2016 and is forecast to rise by 4.0% in the 2017-2027 period. Growth will mostly come from nature-based tourism ([3]); thus, the potential economic value is high and may have considerable potential to generate funds for conservation and people engaging with the environment. The World Tourism Organization estimates that ecotourism represents 2-4% of the entire world tourism market and has an annual growth potential of approximately 20%.
Monetisation can be a path for planning rural-related projects and the quantification of CES ([30]). However, among other categories of ecosystem services (ES), i.e., provisioning, supporting and regulating services, the quantification of the economic value of CES is a tricky issue. This is mainly due to its scarce tangibility and to the influence of subjective issues in valuation ([38]). Moreover, the difficulty of spatialising monetary values with proper detail (resolution) is highlighted in the literature ([8]). To cope with these challenges, a series of alternative methods, compared to those used in economic analysis, have been applied to quantify CES ([15], [29], [5], [43], [42], [34], [12]). Allowing for the subjective evaluation of participative processes, the above research represents a milestone for CES analysis.
Some advances have been recently introduced by the application of big data, and specifically by social media analysis ([22], [32]). Focusing on the study of the aesthetic appreciation of a particular rural area or landscape, compared to traditional investigation, the use of geotagged photographs seems to be a promising alternative to appraising CES. In the last decades, the evaluation of ES through web-based photographs has developed as a method for the analysis of rural landscapes and natural areas. The volume and spatial distribution of geotagged photographs uploaded to global online social media platforms (Instagram™, Panoramio™ or Flickr™), can be a useful source of data for mapping the distribution of CES ([7], [19], [24], [49]). The main advantages of using geotagged photographs as a proxy for people’s preferences are (i) using the observed preferences ([19]) and (ii) obtaining precise information on the actual provision of the service provided by the exact position in which the photos are taken ([2]). Levin et al. ([23]) found “strong and significant correlations between all crowdsourced data and visitation statistics, demonstrating the potential of using crowdsourced data to characterize the social and perceived importance of protected areas as a proxy for visitation statistics”.
Yoshimura & Hiura ([55]) and Walden-Schreiner et al. ([53]) have analysed the relationships between the shooting locations of georeferenced photos on Flickr™ with both the environmental characteristics of the territory and the presence of infrastructure. The aim of the authors was to deliver management strategies for the conservation of natural resources, while providing opportunities for tourism and recreation.
From a land use point of view, several studies have focused on mountainous areas to depict both landscape characteristics relevant for aesthetic appreciation ([52]) and the drivers used to map outdoor recreation supply, demand, and flow ([47]). Urban green spaces have been investigated with a focus on general (e.g., managed and spontaneous vegetation, including public parks, gardens as well as nature reserves - [41]) or specific land use typologies (mangrove urban forest - [40]).
According to the authors’ knowledge, there is a lack of specific studies dealing with the assessment of CES in forest stands using big data from social media, with a specific focus on aesthetic appreciation. In this context, a methodological approach to quantifying the aesthetic value of the forest environment and its spatial associations with the features of forest stands on a regional scale, is proposed. Specifically, the objectives of the work are: (i) to create a spatial model to evaluate the provision of aesthetic value in forests; and (ii) to identify which biophysical and infrastructural variables better explain the spatial distribution of this CES. The results can represent a preliminary step to guide policy- and decision-makers in planning as well as the management of forests to optimize the delivery of CES.
Methods
Study area
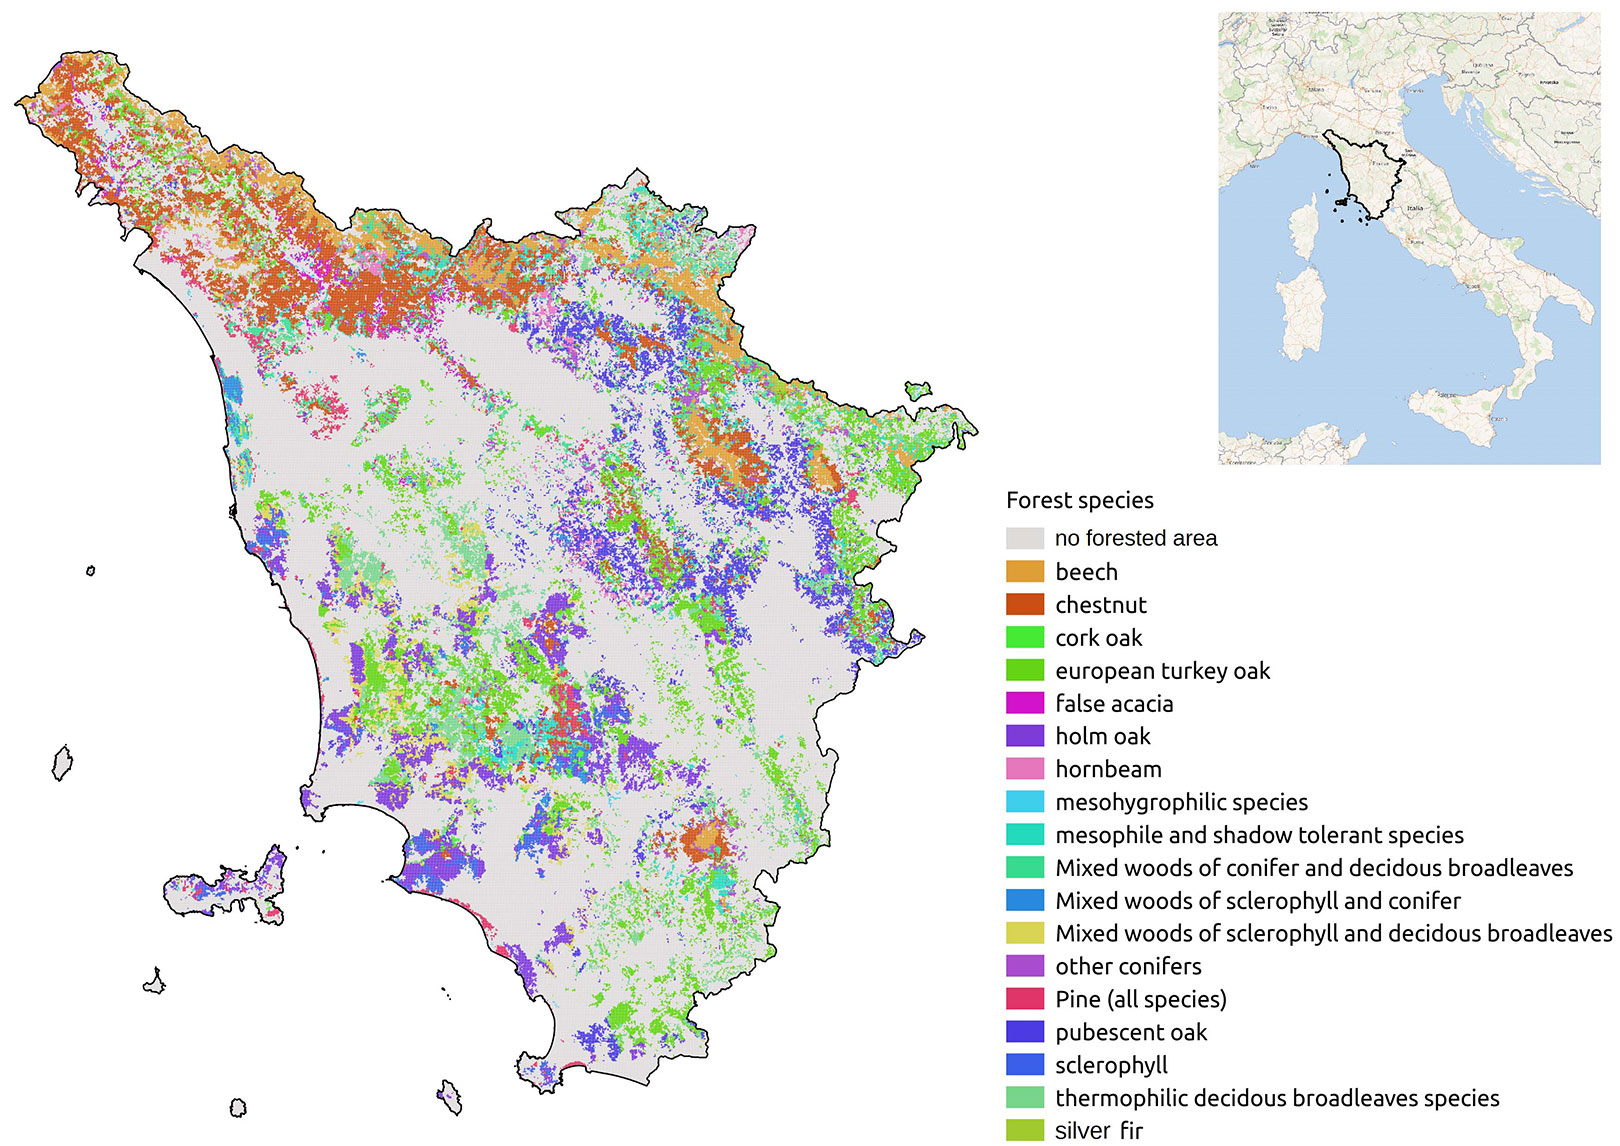
The CES provision has been set at regional level (Tuscany region, central Italy) because operational actions regarding the Common Agricultural Policy in Italy are delegated to the regions (NUTS-2 subdivision, according to Eurostat classification). This administrative level could favour the depiction and addressing of the EU funds available for particular agroforestry interventions. The forested area of Tuscany is 1,086,000 hectares, equal to 47% of the regional territory. The stand area is mainly composed by deciduous oak (primarily Turkey oak and downy oak with 414,000 ha), followed by forests with a prevalence of chestnut (177,000 hectares). The mountainous territory is characterized by beech (76,000 ha), firs (14,000 ha) and black pine (21,000 ha). In the coastal areas, there are widespread holm oak, Mediterranean scrub and Mediterranean pines (e.g., Italian umbrella pine and Maritime pine). From a silvicultural point of view, compared to the high forest (34%), there is a clear prevalence of coppice (66%), which is more concentrated in the mountainous forests, especially in the beech and oak stands (our elaboration on Tuscany region data - ⇒ http://www.regione.toscana.it/-/geoscopio). Fig. 1 shows the distribution of forest species in the study region.
Fig. 1 - Forest species distribution in Tuscany (central Italy).
Geotagged photo acquisition
Recently, there has been a rapid increase in the available data sources regarding voluntary geographical information. Social media applications such as Twitter™, Flickr™ and Facebook™ provide a collection of geographical information that can be queried via public application programming interfaces (APIs). In addition, a growing willingness of people to actively contribute in sharing their experiences of living in urban, rural and natural spaces is being witnessed. This phenomenon is known by the generic term “people as sensors” ([20]).
In this study, the most used platform to share photographic images, Flickr™, is used. Flickr™ has been involved in several scientific research studies focused on data sources in GIScience, geography, and tourism. The platform offers an accessible API and has experienced continuous growth ([1]). Previous studies ([23]) have shown how Flickr™ provides a source of information that is free, updated, and with good spatial as well as temporal resolution. The potential analysis of the tags’ contents is a further strength of the platform.
According to Nov et al. ([31]), the photographic data uploaded on Flickr™ imply an individual process that can be divided into two main phases: (i) the technical-creative phase of taking the photo; (ii) the social phase of sharing this photo integrated with an association of comment/s on it.
The action of taking a picture is not only linked to the characteristics of the surrounding environment; it also involves other aspects of interpretative cognition that people apply to that space (personal preferences, memories, opinions, etc. - [10], [48]). Both the act of taking a picture in a specific place and the action of choosing which photo to share reflect the quality perceived by the individual about that place.
Geotagged photos were queried from the Flickr™ API using the statistical software R (version 3.2.5). The downloaded attributes of geotagged photo include latitude, longitude, owner, acquisition date, text tag, accuracy evaluation, and image URL. Pictures taken during the period from 01/01/2010 to 31/12/2017 were downloaded for a total of over 1.6 million photos in Tuscany (Where On Earth Identifier - WOEID = 7153345), mainly in the city of Florence. A dataset containing the georeferenced photo points loaded during this period was created by means of an overlay with a forest map. The dataset contains 65,418 georeferenced photos. The positional accuracy was set at street level (provided level of positional accuracy from Flickr™ ≥ 12 - [14]). The records were analysed in R and converted into a shapefile for geospatial analysis using the QGIS software. The pictures containing tags relevant to forest depiction (e.g., wood, forest, tree and other synonyms and related words) were filtered using a QGIS query whose extended expression is provided in the Supplemental material. This step is needed to select the photos inside the forest that focus on wood-related elements. Eventually, specific filters were applied to avoid distortions due to photos being repeated many times in a single location by a single photographer. The final dataset contained 7,986 photographic points. To verify the correctness of the final database, a frequency analysis of the words contained in the tags was carried out.
Variable data sources
Explanatory variables are used to understand which characteristics of the forest influence an individual’s decision to take a picture and publish it on Flickr™. The variables used are the distance from main roads to forest paths, the distance to the coast line, the geomorphological characteristics (altitude and slope), the forestry parameters (forest species and regeneration, i.e., management system, fertility class and biomass stock), and the level of environmental protection (national parks, regional parks, reserves and other protected areas). The distance to the main roads was chosen because roads are the main access infrastructure to the forest. Furthermore, this factor is a component of management plans and represents the ways in which agencies provide services to visitors and mitigate impacts. The coast in Tuscany denotes the non-urban localization of greater tourist pressure. The forests close to it (mainly with a prevalence of Italian umbrella pine) are particularly vulnerable to tourist overload. In the study area, the altitude and the slope are strongly correlated to the climate (rainfall and temperature) and influence the use of the forest. The forestry variables were chosen based on the literature on recreation in forests ([11], [21]). None of these variables had a significant correlation to each other (all r < 0.4), thus excluding the risk of multicollinearity. All the independent variables were original or were resampled at a resolution of 1 ha (cell size 100 m). The list of variables and their sources are shown in Tab. 1.
Tab. 1 - Description of the geographical dataset used in the analysis.
| Dataset | Source |
|---|---|
| Forest species map. Categories: (1) holm oak; (2) cork oak; (3) pubescent oak; (4) european turkey oak; (5) hornbeam; (6) chestnut; (7) false acacia; (8) beech; (9) silver fir; (10) sclerophyll; (11) thermophilic decidous broadleaves species; (12) mesohygrophilic species; (13) mesophile and shadow tolerant species; (14) Pine (all species); (15) other conifers; (16) Mixed woods of sclerophyll and conifer; (17) Mixed woods of sclerophyll and decidous broadleaves; (18) Mixed woods of conifer and decidous broadleaves. | Tuscany Region - ⇒ http://www.regione.toscana.it/-/geoscopio |
| Regeneration system map. Categories: (1) high forest; (2) coppice. | Tuscany Region - ⇒ http://www.regione.toscana.it/-/geoscopio |
| Protected areas map. Categories: (1) national parks; (2) regional parks; (3) nature reserves; (4) local parks; (5) unprotected forests. | Tuscany Region - ⇒ http://www.regione.toscana.it/-/geoscopio |
| Digital Terrain Model (DTM) | Tuscany Region - ⇒ http://www.regione.toscana.it/-/geoscopio |
| Slope | DTM processing using QGIS software |
| Road map | Tuscany Region - ⇒ http://www.regione.toscana.it/-/geoscopio |
| Map of distance from road | Elaboration of the road map via QGIS software |
| Coastline map | National Geoportal, Ministry of Environment - ⇒ http://www.pcn.minambiente.it/mattm/ |
| Map of distance from coastline | Elaboration of the coastline map via QGIS software |
| Soil fertility map. Categories: Ordinal classes progressively increasing from 1 (high fertility) to 7 (low fertility). | Tuscany Region - ⇒ http://www.regione.toscana.it/-/geoscopio |
| Biomass stock map | Geolab laboratory, University of Florence |
Statistical model
The purpose of the statistical analysis was to create a map of the probability that an individual takes a photo of a forest and shares it on the Flickr™ platform. This map can be considered as a proxy for the value of CES ([46]). Maximum entropy models (MaxEnt) have been applied with success in managing visitor impacts on natural resources including human-nature interactions ([4]) and off-road recreational behaviour prediction ([9], [54]). MaxEnt has only recently been applied to the estimation of CES through correlations between the locations of Flickr photos with the environmental characteristics of the territory ([55], [53]). The MaxEnt models integrate continuous and categorical predictive variables, minimize over-treatment and evaluate the influence of each covariate.
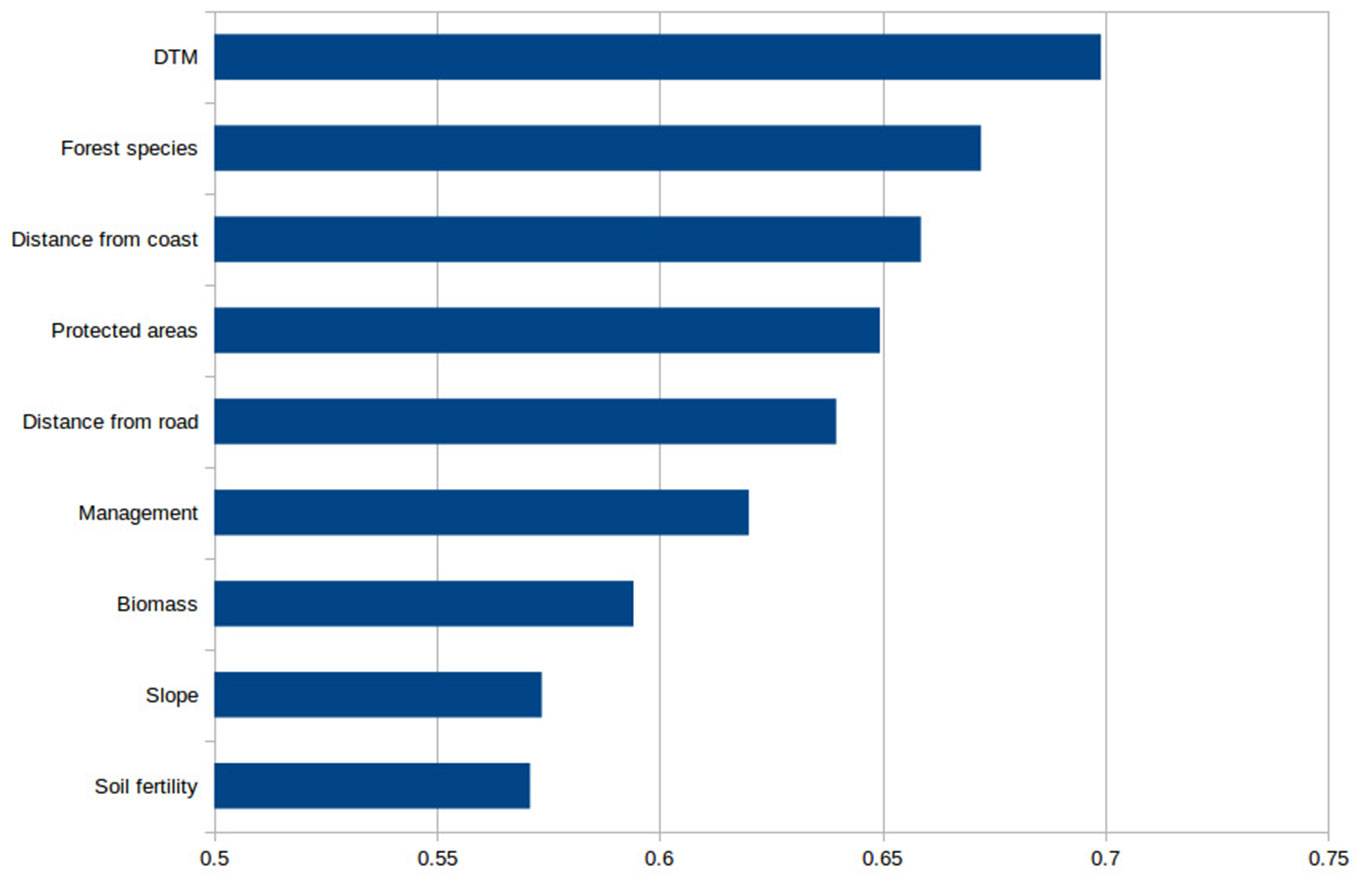
The applied model was based on 30 replicas. The maximum number of background points has been set to 10.000 with a convergence threshold of 0.00001 ([35], [37], [26]). The area under the curve (AUC) of the receiver operating characteristic (ROC) chart was used as a first parameter to validate the MaxEnt model ([36]). ROC can measure the efficiency of a binary classifier such as the MaxEnt model, and the AUC represents the probability of sensitivity. An AUC value of 0.5 indicates a random pattern, while a value of 1 indicates a model that perfectly classifies the data presence. An AUC value of 0.50-0.70 suggests a fairly accurate model, a value of 0.70-0.90 suggests an accurate model, and a value greater than 0.90 indicates an extremely accurate model ([50]). A useful result of the MaxEnt model is the response curve. The curve shows how the probability of prediction varies with each environmental variable, keeping all the other variables at the average value of the sample. Subsequently, a jackknife analysis was used to indicate the most informative variables. The jackknife test obtained from MaxEnt allows an analysis of the contribution of each environmental variable to taking and sharing pictures. When running the model, this approach excludes all variables apart one at a time.
Results
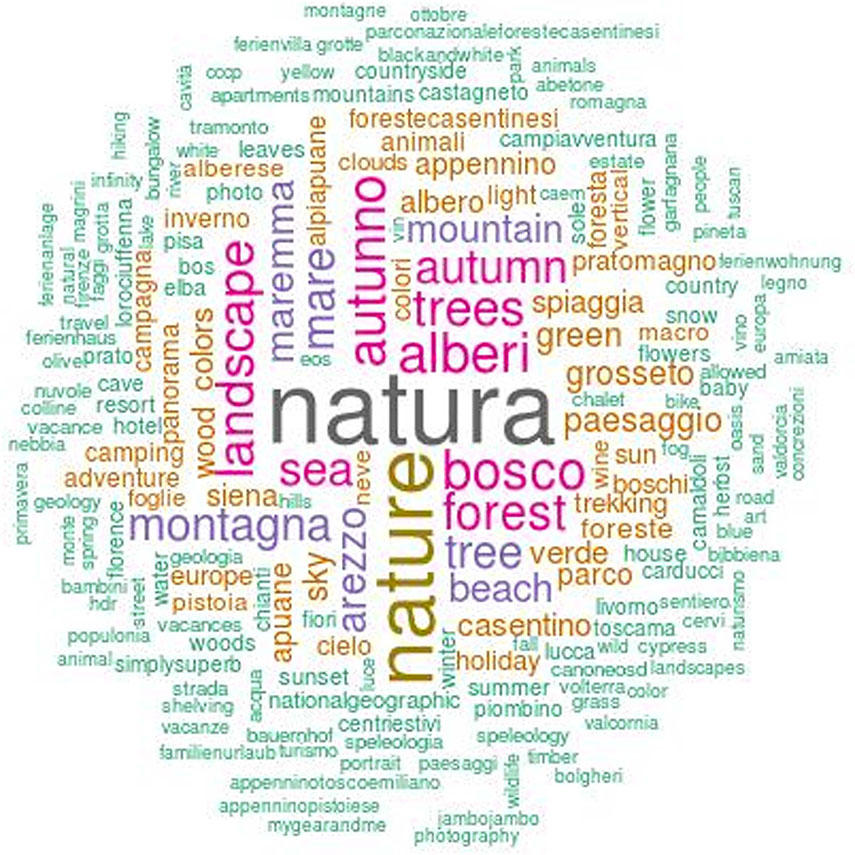
The tag-cloud shown in Fig. 2 demonstrates the relationship between the photos shared on Flickr™ and the primarily perceived forest element/s. Indeed, the word clouds not only show what people have seen but also what has been perceived as significant from an experiential/emotional viewpoint. The main aspects that emerge from the word cloud are related to the identification of the subject of the photos (e.g., the terms “nature/natura”), as well as the combination of places (Foreste Casentinesi, Alpi Apuane, Maremma, etc.) with other components. In particular, the words that seem to be relevant are related to recreational experiences (hiking, beach, camping, adventure, etc.), the characteristics of the forest ecosystem (mountain, chestnut, leaves, flowers, colours, etc.), the seasons of the year, and additional generic terms and perceived aspects (sea, light, green, etc.). The correct localization of the Flickr™ points is confirmed by the combination of some tags related to the protection level (Foreste Casentinesi is a national park and Alpi Apuane and Maremma are regional parks), with words identifying the perception of forest and tree species (forest, cypress, pine, chestnutwood, etc.).
Fig. 2 - Tag-cloud of filtered photo points.
The probability map of visitor presence (Fig. 3) shows high probabilities along the coastal areas, in the mountains of the Apennines and in the south-eastern area of the region (Monte Amiata). The MaxEnt model predicts an AUC of 0.792 (Fig. 4), stressing a good discrimination. The response curves (Fig. 5) show that visitors prefer forests with a prevalence of silver fir, pine, beech or mixed forests of conifers and broadleaved trees. The species that are less preferred by the visitors are the forest of pubescent and Turkey oak as well as the thermophilic broad-leaved woods. The contribution to the probability is rather differentiated, with a maximum of 0.87 for the silver fir and a minimum of 0.26 for the thermophilic forest. From a management perspective, the high forests are strongly preferred to coppices (the contribution to the probability is 0.67 and 0.31, respectively). The level of protection is significant for CES quantification: the presence of natural protected areas highlights a relevant difference (contribution to the probability is 0.76) compared to forests without protection (contribution to the probability is 0.34). The response curves of the quantitative variables (Fig. 6) indicate how the distance from the roads to forest paths has a decreasing trend, with a very low probability of visitor presence for distances over 500 metres. Instead, the altitude and the distance to the coast are bimodal, with a high probability at sea level and in mountain areas, and low probability for intermediate elevations. The results of the jackknife test (Fig. 7) stress that the environmental variable with the maximum gain when used in isolation is the elevation (DTM), followed by forest species and distance to the coast. The results obtained confirm previous studies performed at various scales. In particular, see Grêt-Regamey et al. ([17]) for a review of the extensive existing literature on the effect of distance from roads and routes on the supply of CES, and Paracchini et al. ([33]) for the relationship between CES supply and distance from the coastline.
Fig. 3 - Probability map of visitor presence.
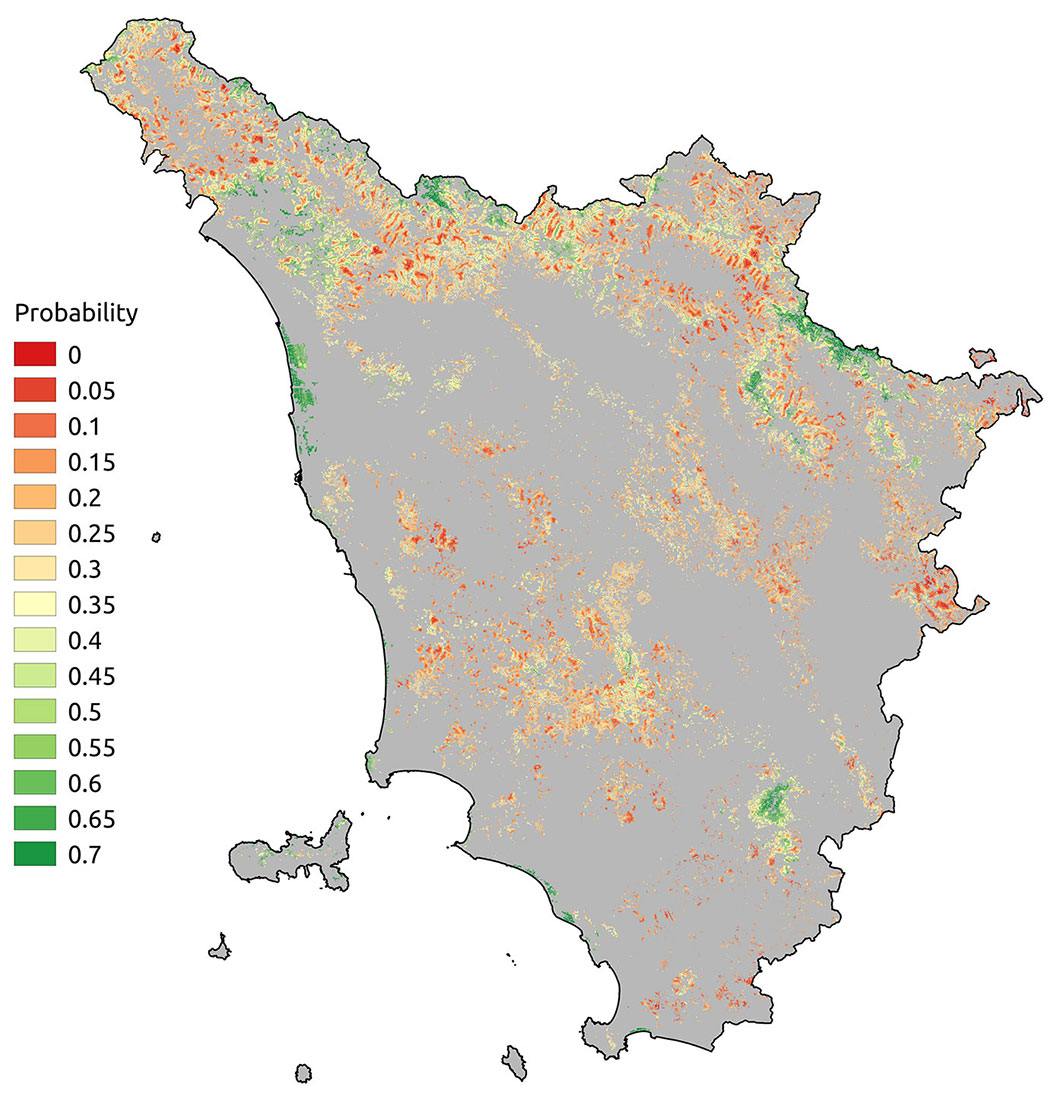
Fig. 4 - Receiver operating characteristic (ROC) curve.
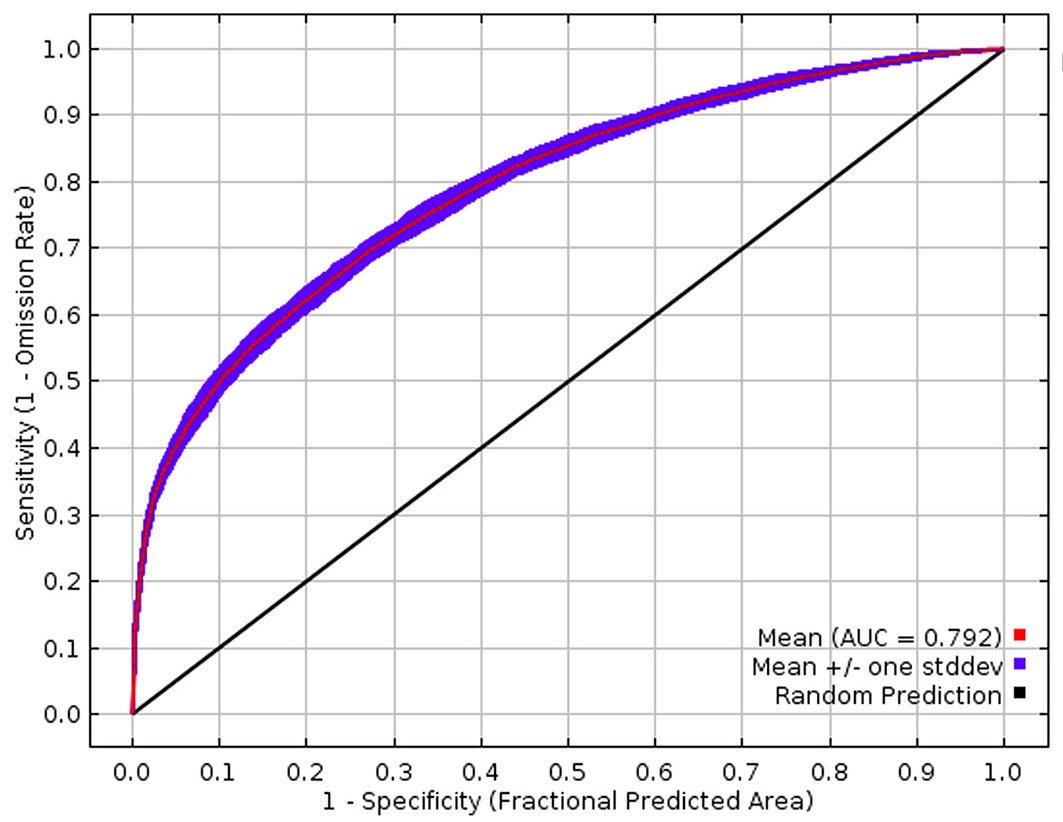
Fig. 5 - Marginal response curves for the qualitative variables.
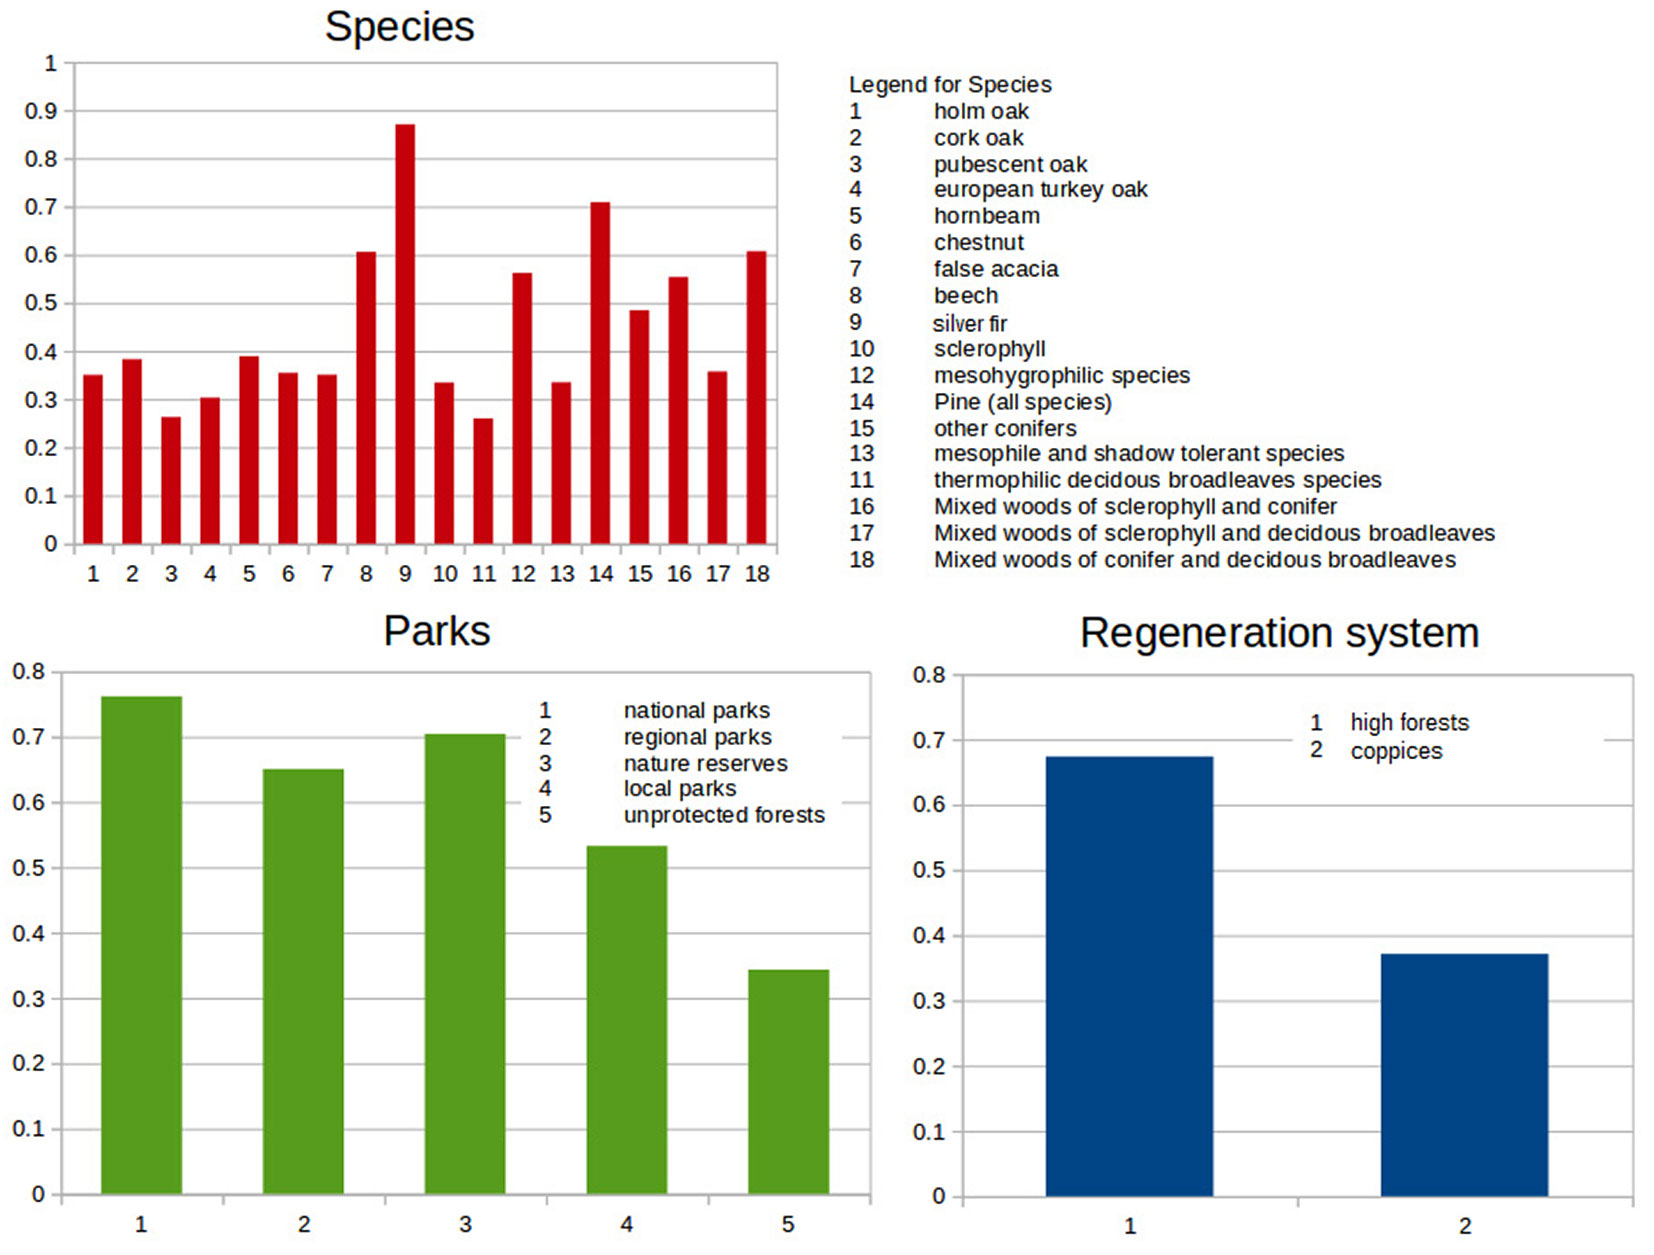
Fig. 6 - Marginal response curves for the quantitative variables. (a) Elevation (DTM, in m a.s.l.); (b) distance to coast (DistCost, m); (c) distance to roads (DistRoad, m); (d) biomass stock (Biomass, m3).
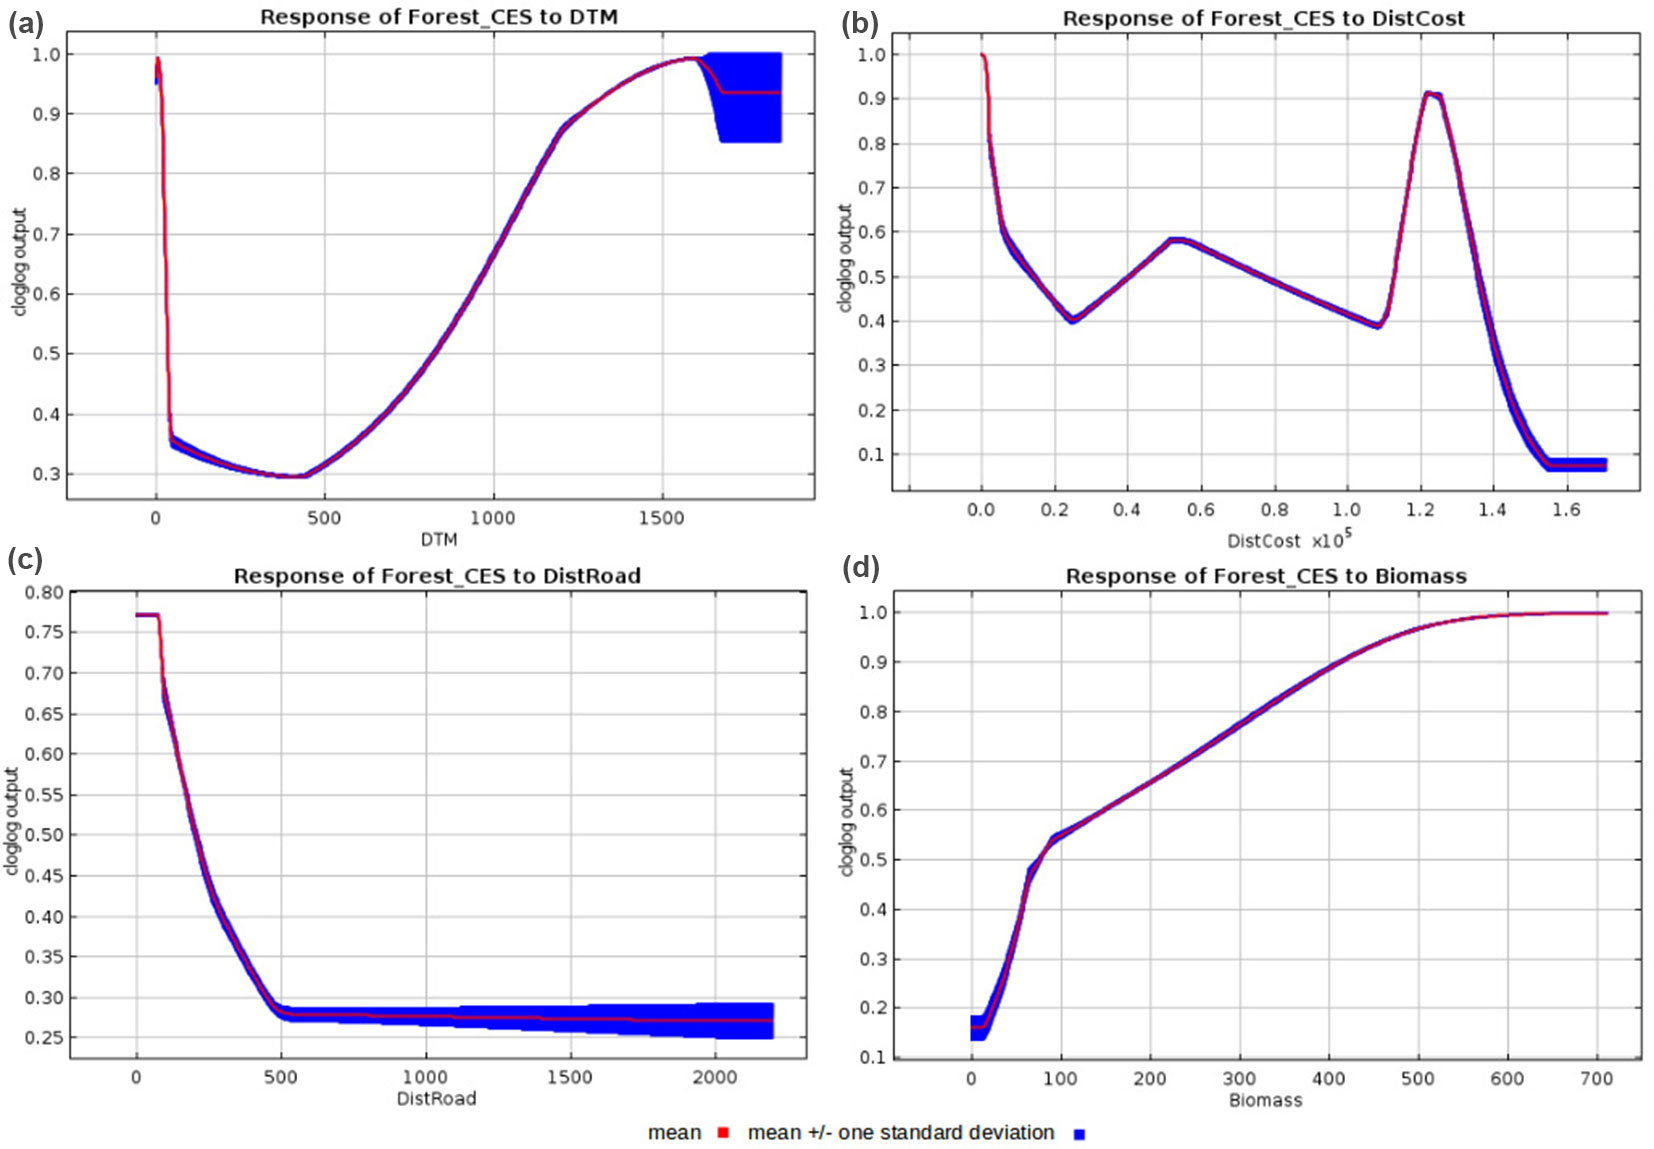
Fig. 7 - Results of the jackknife test (x-axis: AUC).
Discussion
The literature stresses how dendrometric and management characteristics are of strong importance in the aesthetic appreciation of forests ([39], [25]). This assertion seems to be confirmed by the above results; for example, high forests have a greater appreciation compared to coppices, probably due to the larger diameters of single trees. Diameter is of twofold importance: bigger trees are directly related to the perceived good aesthetic value ([39]); moreover, larger diameters are indirectly related to stand density. As reported in the literature ([51]), lower density can favour scenic beauty. In fact, due to the major relevance of open areas, lower density makes the forest more beautiful and suitable for recreation.
Coastal areas highlight relevant CES values associated with Mediterranean pine forests (mainly with a prevalence of Italian umbrella pine). This territory is also associated with higher inhabitant-density as well as touristic areas. Thus, in future works, an investigation into the relative importance of forest stands compared to these variables would be worthwhile. In addition, the closer a managed stand is to the coast, the more rest areas tourists can find. Under a modelling point of view, this information could bias the picture taken in other areas of the case study (e.g., hilly areas of central Tuscany and mountainous areas of the Apennines, more distant from the coast). However, the bimodal trend of the response curve related to the distance to the coast (Fig. 6) and the significance of this parameter in the jackknife test (Fig. 7), highlight the significance of the variable and the absence of distortion.
The distance to the main roads is significant for photo taking, with an indirect proportion stressing the importance to this activity of facilities being near forest characteristics. This aspect could be relevant for different reasons. Hernández-Morcillo et al. ([18]) reported how a CES value should be directly correlated with the number of scenic roads in a natural area. Schirpke et al. ([45]) highlighted how viewpoints and forest clearings along roads or hiking trails are important to allow long vistas and to improve CES provision. Differences in the perception of roads could also emerge according to socio-demographic characteristics: for example, Schirpke et al. ([46]) affirmed that local people assign significantly higher values to open views (subalpine and alpine landscapes in the case study), whereas tourists value the presence of a forest road more positively. Although some authors ([13], [21]) revealed how major roads can be a cause of CES depletion due to noise pollution, the results do not evidence this assertion, probably due to the local characteristics of roads close to forests.
An interesting output is linked with biomass stock. The response curve follows a quasi-sigmoidal trend, which is similar to the growing stock function in stands. This aspect seems to be confirmed by the trend of aesthetic value, which shows a maximisation from young to mature stands ([44]). The outputs report a low significance of slope and fertility variables.
As confirmed by the AUC values, the results are significant from a statistical viewpoint.
The above considerations could be of great importance to depict the guidelines for forest planning and management. If the valorisation of CES is a priority, the maintenance of even-aged high forests or a conversion from coppice to high forest management should be a valid option for analysis. In the case of creating photography hunting paths, particular attention could be paid to the establishment of openness in the proximity of main roads as well as forest tracks. In general, at regional level, silvicultural practices take place only if there is an economic advantage (positive stumpage value from final harvesting or thinning - [16]). These typologies of intervention are mainly focused on provisioning services and the extraction of timber and firewood. Specific silvicultural treatments for the valorisation of CES focused on aesthetic improvement are not frequent in the study area. The negative stumpage values limit the interventions in public forests to the maintenance of safety standards for visitors. Scientific evidence for the relationship between forest management and the improvement of CES could promote suitable silvicultural practices for aesthetic enhancement. For example, Tahvanainen et al. ([51]) revealed how small clear cutting had a positive effect on scenic beauty, depending on different variables such as the size of the gap, its adaptability to the landscape and the amount of logging residues left in the cutting area. Additional, future evaluations related to forest management should focus on the differences between photos concerning internal forest characteristics and scenic (landscape) beauty, e.g., through an automatic classification of image content. In fact, different authors have highlighted that thinning reduces the scenic value of the landscape, but it seems to have had no significant effect on the recreational value ([6], [51], [25]). On the other hand, a natural state of the forest can be appreciated for recreational use but had no effect on scenic beauty ([51]). Territorial marketing activities can be promoted by means of the application of big data to create a web-based localization of high quality CES delivery areas.
A criticism of this method could be that often social media are used more to complain than to appreciate things in a positive way. However, thanks to the words associated with the pictures and provided on Flickr’s post (Fig. 2), the photos could be classified as representing positive appreciation.
Conclusion
We believe that the method we applied can promote an advancement in CES localization and quantification compared to available literature focusing on forest systems. The indicators and variables derived from social media represent useful information for rapid and cost-effective assessments of CES. Thanks to the availability of API queries, the suggested technique and database can be easily updated and transferred to other case studies. The methodology facilitates application from small- to large-scale analyses.
Future analyses can attempt to apply methods for automating the content analysis of social media photographs. In this sense, the online machine learning algorithm based on Google Cloud Vision™ could be tested to classify the content of images in forested areas ([41]). Further improvement should consider the seasonality of aesthetic appreciation and the time-dependence of geotagged photographs. The application of the proposed methodology to support forest management and planning for CES promotion should however consider spatial and temporal (intra-rotation period) variability, as well as trade-off and potential impacts among different ecosystem services at local or regional level.
References
CrossRef | Gscholar
CrossRef | Gscholar
Gscholar
CrossRef | Gscholar
CrossRef | Gscholar
Supplementary Material
Authors’ Info
Authors’ Affiliation
Gherardo Chirici
Sandro Sacchelli
Department of Agricultural, Food, Environment and Forestry, University of Florence, p.le delle Cascine 18, v. S. Bonaventura 13, Firenze (Italy)
Corresponding author
Paper Info
Citation
Bernetti I, Chirici G, Sacchelli S (2019). Big data and evaluation of cultural ecosystem services: an analysis based on geotagged photographs from social media in Tuscan forest (Italy). iForest 12: 98-105. - doi: 10.3832/ifor2821-011
Academic Editor
Susanna Nocentini
Paper history
Received: Apr 19, 2018
Accepted: Nov 22, 2018
First online: Feb 11, 2019
Publication Date: Feb 28, 2019
Publication Time: 2.70 months
Copyright Information
© SISEF - The Italian Society of Silviculture and Forest Ecology 2019
Open Access
This article is distributed under the terms of the Creative Commons Attribution-Non Commercial 4.0 International (https://creativecommons.org/licenses/by-nc/4.0/), which permits unrestricted use, distribution, and reproduction in any medium, provided you give appropriate credit to the original author(s) and the source, provide a link to the Creative Commons license, and indicate if changes were made.

Web Metrics
Breakdown by View Type
Article Usage
Total Article Views: 48858
(from publication date up to now)
Breakdown by View Type
HTML Page Views: 38861
Abstract Page Views: 4562
PDF Downloads: 4492
Citation/Reference Downloads: 13
XML Downloads: 930
Web Metrics
Days since publication: 2648
Overall contacts: 48858
Avg. contacts per week: 129.16
Article Citations
Article citations are based on data periodically collected from the Clarivate Web of Science web site
(last update: Mar 2025)
Total number of cites (since 2019): 26
Average cites per year: 3.71
Publication Metrics
by Dimensions ©
Articles citing this article
List of the papers citing this article based on CrossRef Cited-by.
Related Contents
iForest Similar Articles
Research Articles
Mapping fungi from below ground: online genetic resources and ectomycorrhizal geographic distributions
vol. 4, pp. 252-255 (online: 13 December 2011)
Research Articles
Forest fire occurrence modeling in Southwest Turkey using MaxEnt machine learning technique
vol. 17, pp. 10-18 (online: 02 February 2024)
Research Articles
Analyzing regression models and multi-layer artificial neural network models for estimating taper and tree volume in Crimean pine forests
vol. 17, pp. 36-44 (online: 28 February 2024)
Research Articles
A geographically weighted deep neural network model for research on the spatial distribution of the down dead wood volume in Liangshui National Nature Reserve (China)
vol. 14, pp. 353-361 (online: 27 July 2021)
Research Articles
Use of LIDAR-based digital terrain model and single tree segmentation data for optimal forest skid trail network
vol. 8, pp. 661-667 (online: 22 December 2014)
Review Papers
Integration of forest mapping and inventory to support forest management
vol. 3, pp. 59-64 (online: 17 May 2010)
Research Articles
Application of indicators network analysis to support local forest management plan development: a case study in Molise, Italy
vol. 5, pp. 31-37 (online: 27 February 2012)
Research Articles
Are we ready for a National Forest Information System? State of the art of forest maps and airborne laser scanning data availability in Italy
vol. 14, pp. 144-154 (online: 23 March 2021)
Research Articles
Nonlinear mixed model approaches to estimating merchantable bole volume for Pinus occidentalis
vol. 5, pp. 247-254 (online: 24 October 2012)
Research Articles
Tree volume modeling for forest types in the Atlantic Forest: generic and specific models
vol. 13, pp. 417-425 (online: 16 September 2020)
iForest Database Search
Search By Author
Search By Keyword
Google Scholar Search
Citing Articles
Search By Author
Search By Keywords
PubMed Search
Search By Author
Search By Keyword


