Application of indicators network analysis to support local forest management plan development: a case study in Molise, Italy
iForest - Biogeosciences and Forestry, Volume 5, Issue 1, Pages 31-37 (2012)
doi: https://doi.org/10.3832/ifor0603-009
Published: Feb 27, 2012 - Copyright © 2012 SISEF
Research Articles
Abstract
Forest management plans and Criteria and Indicators are the most important tools to support sustainable forest management. Due to the important role of forests in contributing to humans’ well being through the numerous ecosystem services they provide, in the last two decades many efforts have been made to develop new forest management tools at different scale levels. Territorial Forest Plan and Criteria and Indicators for SFM are considered as the innovative tools to support forest management. A participatory approach, providing a better knowledge of social framework conditions and trends on local markets, is considered the focus of new forest management tools. Territorial Forest Plan allows to identify the main function of forest stands at territorial level, based on both forest type and stakeholders’ opinions. On the other hand, the Indicators Network can be helpful to support forest management because it allows to identify the main causal paths and crucial linkages involving the indicators and to offer decision makers the opportunity to manage the forest ecosystem in a more holistic way. In this work, an application of indicators network analysis to support Territorial Forest Plan development in the Nature 2000 site has been studied. Based on the results obtained, an integrated use of both approaches may provide an added value to sustainable forest management.
Keywords
Participatory, Forest planning, Indicators network, Sustainable forest management
Introduction
Forests provide several goods and services to people and their multifunctional role has largely been recognized at a global level since UNCED ([35]). For this reason, numerous stakeholders are involved in the forest sector and forest resources are continuously undergoing strong pressure. As a result, man has profoundly modified over the years the natural environment, leading to a spatial mosaic of distinct and interacting types of rural land uses ([31]). Consequently, environmental concerns have led to important modifications in forest planning models ([18]), paying mostly attention on the well being of rural population, shifting from wood production and economic goals to no-timber goals ([4]), including habitat protection and wildlife. Forest planning plays a strategic role in applying Sustainable Forest Management (SFM) principles. Although both Natura 2000 sites and protected areas contribute towards biodiversity conservation, they are more effective when decision making and management considers the local inhabitants as the key actors of management goals ([15], [11]).
Forest research contributes to this important task by developing an array of tools to support forest management planning at different scales, as outlined by European processes like the Forest Action Plan and FOREST EUROPE ([8]). Planning occurs usually at many levels in forestry: forest holding level, regional or landscape level and national level.
In Italy, several efforts have been made to improve the forest planning activities and new tools like the Territorial Forest Plan (TFP) have been developed ([1]). Based on Forest Type and the participatory approach, TFP mainly aims at identifying unit areas with the same forest type and similar main function through Multi-Criteria Decision Analysis (MCDA), and also at providing forest management guidelines for each unit area ([2]).
As numerous studies have shown, the appropriate size of territorial scale ([8], [17], [16]) coupled with the participatory approach, which provides a better knowledge of social framework conditions and trends on local markets ([20], [22]), are required in order to consider the forest resources in a holistic way.
The aim of this work is to examine the research question if a coupled use of TFP and Criteria and Indicators (C&I) network may create an additional value to SFM.
The first set of Criteria and Indicators was gained by FOREST EUROPE ([19]) in 1998, and ever since it is considered the most important forest management tool developed in Europe ([13]), not only as for reporting on forest management, but also because C&I have shown to be useful in making more efficient analysis by identifying key indicators ([37], [36], [27]). Indicators network helps to understand different relationships between multiple dimensions of SFM and to implement SFM in consideration of many conflicts of interests at different scales and within different forest regions ([29]).
After a brief description of the recent progress on forest planning in Italy, this contribution describes the approach to build the indicators network within the Natura 2000 site in Italy.
The main topic of this study is the application of indicators network analysis to support the local forest management plan through public participation. For this reason, some local stakeholders have been selected to identify the main relationship between pan-European indicators set to sustain the conservation function inside the Site of Community Importance (SCI) in Molise, Italy. The individual outcomes have been summarized and the new matrix has been gained, and finally the main centrality parameters have been calculated. The results show that protection indicators, forest management plan, naturalness and services are the key indicators in this context. The conclusion of this work is focused onto the practical applicability, the approach of indicators network can be useful to improve the public participatory process in developing the Territorial Forest Plan and to promote SFM allowing the development of rural areas.
Recent progress on forest planning in Italy
In Italy there are three main scale levels which implement forest management plans, moving from less detailed ones at national level, to more detailed ones at unit level. All plans are important forest policy instruments with the common goals to improve the multiple role of forest management and to promote the SFM combining economic, ecological and social aspects to human well being.
Although monitoring programs can be carried out at all levels, often at national and regional level the size is too big to schedule accurate forest activities. Most of the changes in well-being occur at smaller spatial scale ([9]), but at the unit level the size is too small to consider all the aspects of the multiple role of forest, such as forest connectivity ([24], [30]), or also watershed management ([34]). Management of forests for a stable supply of amenities requires planning over broad spatial areas ([39]). Forest planning models should include spatial aspects associated with the protection of wildlife, biodiversity, scenic beauty, reduction in water sedimentation and soil erosion ([3]), but also recreational activities and other socio-cultural aspects. For this reason, to ensure the maintenance of healthy ecosystems ([40]) a forest management plan requires a landscape perspective ([33], [3]). This requirement is particularly obvious in the Mediterranean basin, where some regions have only isolated forest patches and the management of wildlife and biodiversity along with the adaptation of plants and animals to environmental changes are impaired ([31]).
In the last 2 decades, a new tool to support management and decision making activities has been developed in Italy, thanks to the funds of the Italian Ministry of Agriculture, Food and Forestry Policies through the national research project named “Ri.Selv.Italia”, 2001-2007, (“Forest Land Planning”, subproject 4.2 - [12], [1], [5]). The geographic range of application of Territorial Forest Plan (TFP) is at an intermediate level between single forest management unit level plans and regional forest plans ([1]). There is no minimum or maximum size of scale, and therefore TFP can be applied at watershed scale, mountain community scale or within a Natura 2000 site (for example a Site of Community Importance SCI, as mentioned in the Habitats Directive 92/43/EEC).
After developing many pilot studies in Italy ([2], [8], [7]), and taking into account the multiple roles of forests (productive, protective, ecological and socio-cultural, including the development of local populations), TFP represents the most appropriate tool used to support sustainable forest management.
Study Area
The forest landscape considered in this investigation is in Molise, southern Italy. The study area is a Site of Community Importance (SCI) IT 7222287 “La Gallinola - Monte Miletto - Monti del Matese” located in the southern part of Molise, along the border between Molise and Campania regions (14° 23’ 10” E, 41° 28’ 20” N - Fig. 1).
Fig. 1 - The study area, SCI La Gallinola - Monte Miletto - Monti del Matese.
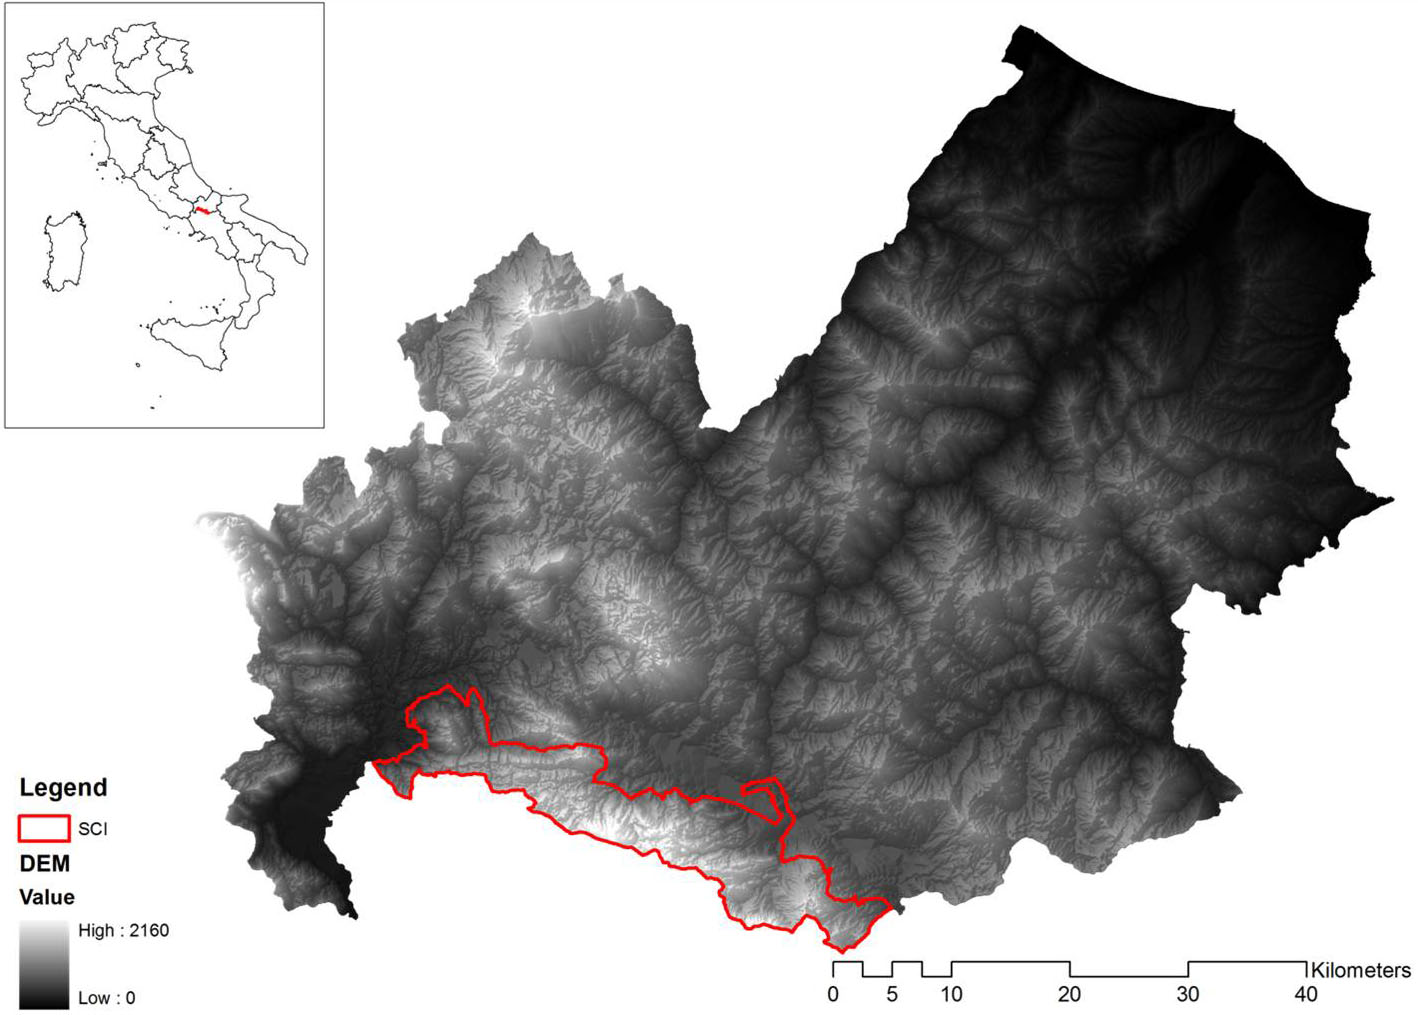
The SCI is located in the southern part of the Apennine Mountains and it covers about 25 000 ha, with an elevation ranging from 275 to 2050 m a.s.l. It represents a wide calcareous relief located in southern Italy. The highest peaks are Mt. Miletto (2050 m), La Gallinola (1923 m) and Mt. Mutria (1823 m).
Due to the large extension and the wide elevation range, the rural area is characterized by many different and interconnected environments, both natural and humanized.
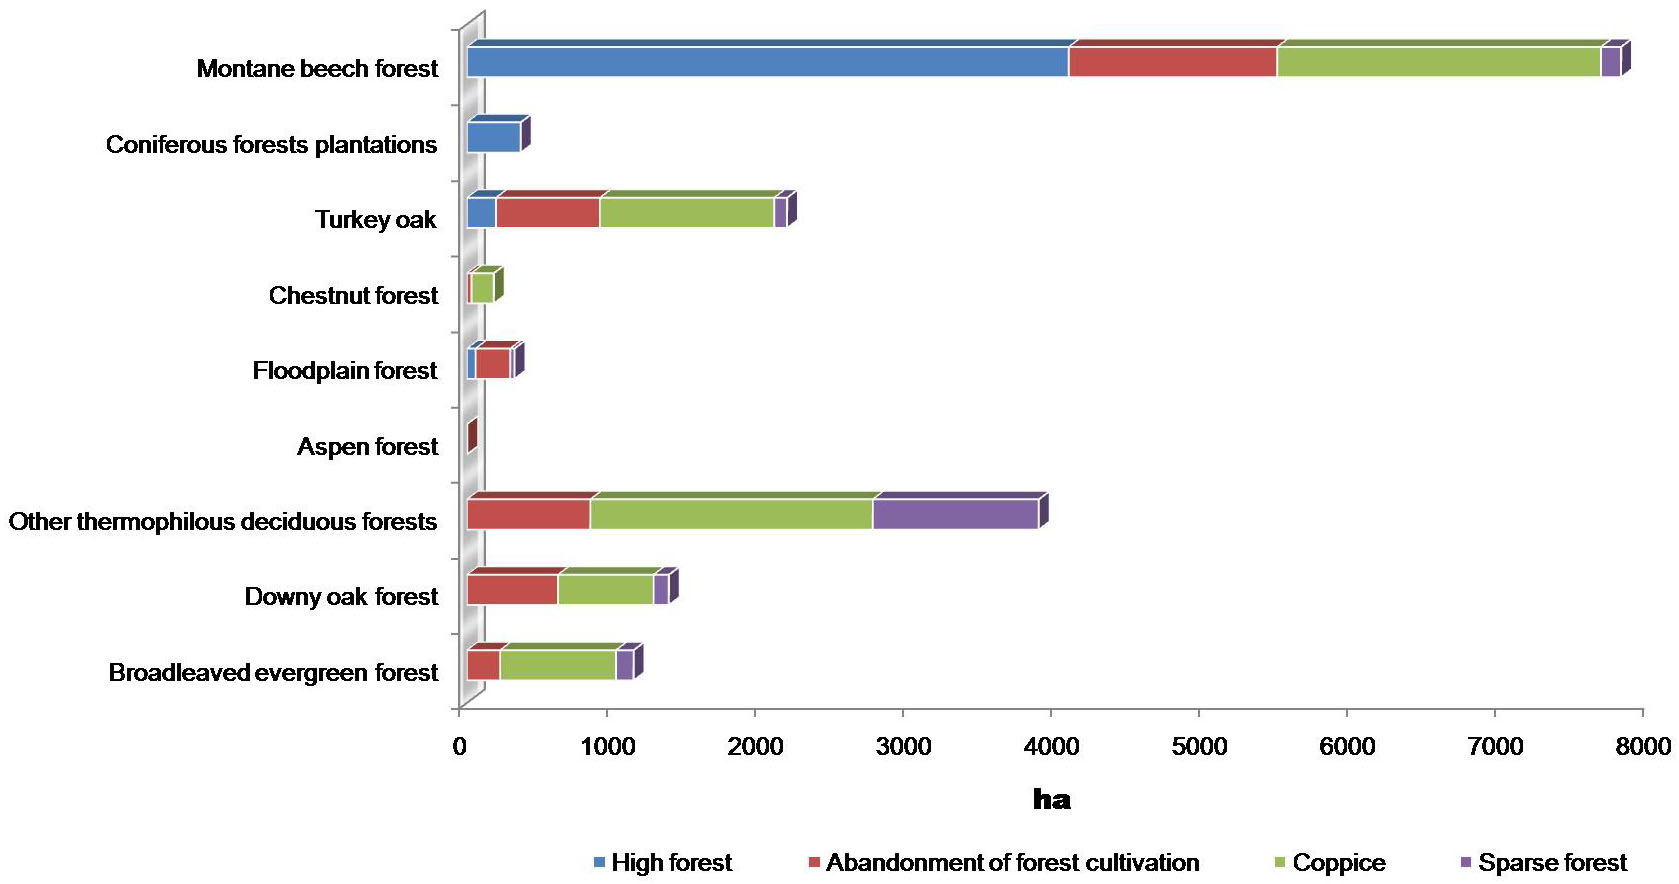
The forest covers 70% of the total area with 9 different forest types ([10]). The most common type is beech forest, about 8000 ha (Fig. 2); most part of forest are coppices resulting from past forest management.
Fig. 2 - Forest Types in the study area, according to the New European Forest Types.
Over the past few decades, deep socio-economic changes (like rural migration and mechanization) have led to a shift from a predominantly agropastoral system to an unmanaged rural area, a common phenomenon in Molise ([7]). This trend was reinforced by the decline or abandonment of certain traditional practices which once helped to control shrub encroachment on pasture, affecting the landscape mosaic. Overall the area consists of 13 villages between two provinces and across two community level administrations. The site represents the main source of water for the neighboring regions and the main source of revenue for the rural sector. Thanks to the higher environmental value, SCI plays an important role in conserving biodiversity. In fact, there are 16 different protected habitat types (Habitats Directive Annex I) and 46 flora species according to standard formulary of Natura 2000. Moreover, the great aesthetic value and the wide framework of mountain trails and picnic areas available for recreational purposes are quite developed. Furthermore, in the middle of SCI on the top of Monte Miletto, there is the snow park called “Campitello Matese”, which represents one of the main destinations for winter holidays in Molise.
The major incomes of local people are from tourism and quality farm products ([12]) because of the marginal rural areas. Although in these areas the main goals of forest management are protection and socio-cultural functions on one hand and biodiversity conservation on the other, the main role of forests has been to produce timber for firewood; these results are obtained from the regional forest service archives.
Material and methods
The cognitive mapping theories are perfectly adapted to the implementation of participatory approaches; for this reason in this study an example of participatory network building is tested and described.
Accurate public participation allows a better understanding of the complex relationship that lies between the local community and stakeholders ([21], [38]). The decision on who participates and who decides is thus a crucial one and requires a balanced interest in the representation process ([26]), therefore an accurate definition of the above parameters is desirable before management activities are initiated ([2], [32]).
According to Mendoza & Prabhu ([21]) network analysis is a participatory tool to discuss, conceptualize and assess SFM in specific contexts. Before building the network map, not only is the territorial framework required, but also the policy scenario must be defined. In this case, because of the area of study is a Site of Community Importance, the policy scenario selected to test the indicator network approach consists in a conservation function. Even if the cognitive map is subjective and dependant on a personal point of view, the different backgrounds of local stakeholders involved represented a clear advantage for drawing a holistic picture of SFM.
The workshop “Giornata Forestale della Regione Molise”, held at the University of Molise (Italy), provided the ideal opportunity to select a group of people with different backgrounds. The participants to the workshop were PhD students, researchers from different institutions, National Forest Services and local policy decision makers working on a wide range of issues going from forest economy to climate change to forest ecology. During the workshop 6 people with different backgrounds were selected to build network maps: 2 researchers, 2 from National Forest Service, 1 decision maker and 1 forestry consultant.
After that, the policy scenario was established and the first network was built by each participant individually. Practically the actors had to select the main indicators involved in this context from the pan-European set and subsequently they had to connect them by building the networks. Finally, the networks of all the participants were gathered and the data was transformed into contingency matrices, processed by UCINET software, drawn as networks and analyzed.
The basic approach adopted is to apply a one-mode network analysis ([14]). A network (or matrix) is generally defined by nodes and ties. In this study the nodes correspond to the 35 pan-European indicators and the ties reflect the relationships between those components ([6], [27]). The ties linking the indicators to each other correspond to the different logical influence paths or cause-effect relationships existing between these, according to the participants’ opinion.
Network maps facilitate the representation of highly complex elements in a structured graph ([27]). In addition, several analytical network parameters can also be calculated in order to verify results and evaluation gained from generated correlation maps. The most relevant network parameters are reported below.
Networks size (Ns) corresponds to the numbers of actors or nodes forming part of a network (eqn. 1):
Network density (Nd) corresponds to the proportion of existing ties as compared to all the possible ties. If all the nodes are connected each other, the density is 1. In a valued network the density is the sum of all the tie values divided by the maximum number of ties (eqn. 2):
Centrality reflects how an indicator is central or prevailing within the network. Centrality of an indicator is described by the number of relations within a network. Studying the centrality of the indicators of a network aims to assess how strategic is their position in the network. The most applied parameter within undirected networks to describe centrality is the Degree (eqn. 3):
Indegree reflects on how many ties the indicator receives and the Outdegree shows how many ties the indicator sends to other indicators.
Betweenness centrality is based on the number of times a node in the network is “between” other nodes on the causal paths. The Betweenness reflects on how many links depend on this particular node (eqn. 4):
where ∂st is the number of shortest paths from s to t, and ∂st(v) is the number of shortest paths from s to t that pass through a vertex v.
K-core consists in the identification of particular subsets of the network. A k-core is a maximal group of actors, all of which are connected to some number (k) of other members of the group. If an actor has ties to a sufficient number of members of a group, they may feel tied to that group, even if they do not know many, or even most members. It may be that identity depends on connection, rather than on immersion in a sub-group.
Results
The main objective of this study has been to map a first description of the interactions between the different indicators of the pan-European C&I set through the application of indicators network analysis to support local forest management plan.
As can be seen from the resulting network in Fig. 3, not all the indicators of Pan-European C&I set have been included in the network, but the indicator 1.2, 3.2, 6.2 and 6.3 (Growing stock, Roundwood, Contribution of forest sector to GDP and Net revenue) were missing. The network size is 31, including 145 ties and the density of the network is 15%.
Fig. 3 - Network of the indicators considered in this study. For more details on indicators’ labels, see Tab. 1.
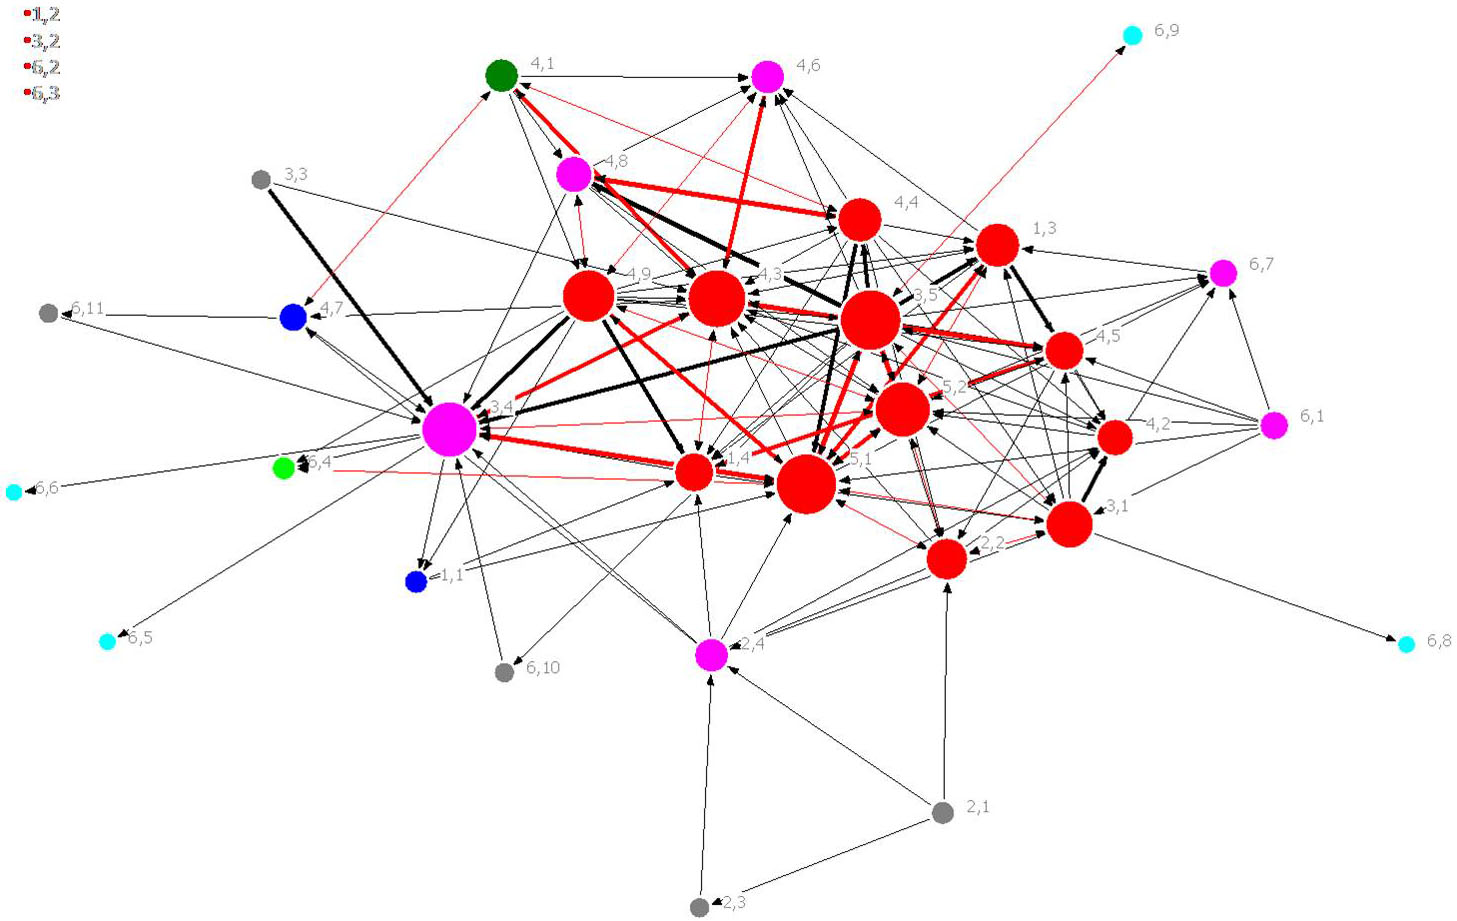
The node size reflects the value of Degree for each indicator, while the color shows the cohesion inside the network, k-core based. A k-core is a maximal group of actors, all of which are connected to some number (k) of other members of the group ([14]). The k-core approach aims at the identification of a particular subset of the graph called k-core, 7 in this case, each obtained by recursively removing all the vertexes of Degree smaller than k, until the Degree of all remaining vertexes is larger than or equal to k. Larger values of coreness (displayed in red in Fig. 3) correspond to indicators with a more central position in the network structure. Almost all the indicators of criterion number 6 “Maintenance of other socio-economic functions and conditions” had lower values of k-core and centrality, and therefore are located on the network border (Fig. 3).
The thickness of ties in the diagram represents their strength, and is proportional to the number of actors who traced them, while ties color reflects the type of relationship between two linked nodes. Reciprocal ties are in red, while non-reciprocal ties are in grey.
The centrality analysis revealed that indicators 3.5 “Forest under management plans” and 5.1 “Protective forests - soil, water and other ecosystem functions” are the more central indicators here, with a Degree of 22, followed by indicator 4.3 “Naturalness” with a Degree of 21 and indicators 5.1 “Protective forests - infrastructure and managed natural resources” and 3.4 “Services”, with a Degree of 19.
The management plan is the tool which is the basis of the implementation of new strategies and thus the most direct way to transpose policy changes in the field. In fact, the indicator 3.5 has the biggest Outdegree value (15). This means that according to stakeholders the “Forest under management plan” is the indicator with the most positive influence on the other indicators (Tab. 1).
Tab. 1 - Results of the centrality analysis on the indicators’ network. For more details, see text.
| Indicator Name |
Indicator label |
Degree | Outdegree | Indegree | Betweenness | K-core |
|---|---|---|---|---|---|---|
| Forests under management plans | 3.5 | 22 | 16 | 6 | 108.65 | 7 |
| Protective forests - soil, water and other ecosystem functions | 5.1 | 22 | 10 | 12 | 135.08 | 7 |
| Naturalness | 4.3 | 21 | 6 | 15 | 105.47 | 7 |
| Protective forests - infrastructure and managed natural resources |
5.2 | 19 | 8 | 11 | 70.853 | 7 |
| Services | 3.4 | 19 | 7 | 12 | 149.248 | 6 |
| Protected forests | 4.9 | 18 | 13 | 5 | 53.378 | 7 |
| Increment and fellings | 3.1 | 15 | 9 | 6 | 53.641 | 7 |
| Introduced tree species | 4.4 | 14 | 10 | 4 | 19.508 | 7 |
| Age structure and/or diameter distribution | 1.3 | 14 | 7 | 7 | 31.221 | 7 |
| Soil condition | 2.2 | 13 | 6 | 7 | 31.105 | 7 |
| Deadwood | 4.5 | 12 | 5 | 7 | 12.874 | 7 |
| Carbon stock | 1.4 | 12 | 4 | 8 | 25.613 | 7 |
| Threatened forest species | 4.8 | 10 | 6 | 4 | 3.333 | 6 |
| Regeneration | 4.2 | 10 | 3 | 7 | 5.821 | 7 |
| Tree species composition | 4.1 | 9 | 6 | 3 | 23.615 | 5 |
| Forest damage | 2.4 | 9 | 5 | 4 | 43.994 | 6 |
| Genetic resources | 4.6 | 9 | 2 | 7 | 4.03 | 6 |
| Forest holdings | 6.1 | 6 | 6 | 0 | 0 | 6 |
| Landscape pattern | 4.7 | 6 | 3 | 3 | 31.167 | 4 |
| Energy from wood resources | 6.7 | 6 | 1 | 5 | 0.7 | 6 |
| Forest area | 1.1 | 4 | 2 | 2 | 1.7 | 4 |
| Occupational safety and health | 6.4 | 4 | 1 | 3 | 0 | 3 |
| Deposition of air pollutants | 2.1 | 3 | 3 | 0 | 0 | 2 |
| Non-wood goods | 3.3 | 2 | 2 | 0 | 0 | 2 |
| Defoliation | 2.3 | 2 | 1 | 1 | 0 | 2 |
| Expenditures for services | 6.10 | 2 | 1 | 1 | 0 | 2 |
| Forest sector workforce | 6.11 | 2 | 1 | 1 | 0 | 2 |
| Cultural and spiritual values | 6.9 | 2 | 1 | 1 | 0 | 1 |
| Wood consumption | 6.5 | 1 | 0 | 1 | 0 | 1 |
| Trade in wood | 6.6 | 1 | 0 | 1 | 0 | 1 |
| Accessibility for recreation | 6.8 | 1 | 0 | 1 | 0 | 1 |
The indicators 4.9 “Protected forest” has a Degree of 18 and the following (according to their descendant Degree) is indicator 3.1 “Increment and fellings” with a Degree of 15. After this there are two indicators, 4.4 “Introduced tree species” and 1.3 “Age structure, diameter distribution”, both with a Degree of 14. The Degree of the indicator 2.2 “Soil condition” is 13, followed by indicators 4.5 “Deadwood” and 1.4 “Carbon stock”, having a Degree of 12. Tab. 1 summarizes the full results of the centrality measures, including Degree, Outdegree, Indegree, Betweenness and K-core. Indicators are sorted in the table based on their value of Degree, from the largest to the lowest.
Overall, the network shows that “Forest under management plan” is the indicator with the biggest Outdegree. According to the stakeholders, this means that “Forest under management plan” has a relevant effect on all the other indicators. “Naturalness” is the indicator with the largest Indegree value in this network. According to stakeholders’ opinion, this indicator plays an important role inside the SCI, since it is influenced by numerous other indicators and needs more monitoring efforts, such as “Protective forest” (both indicator 5.1 and 5.2, “soil, water and other ecosystem functions” and “infrastructure and managed natural resource”, respectively). Finally, “Services” is the indicator with the highest value of Betweenness, the proportion of times that it is “between” other nodes on the causal paths and “Protective forests - soil, water and other ecosystem functions” is the second one. The Betweenness reflects on how many relations depend on this particular node.
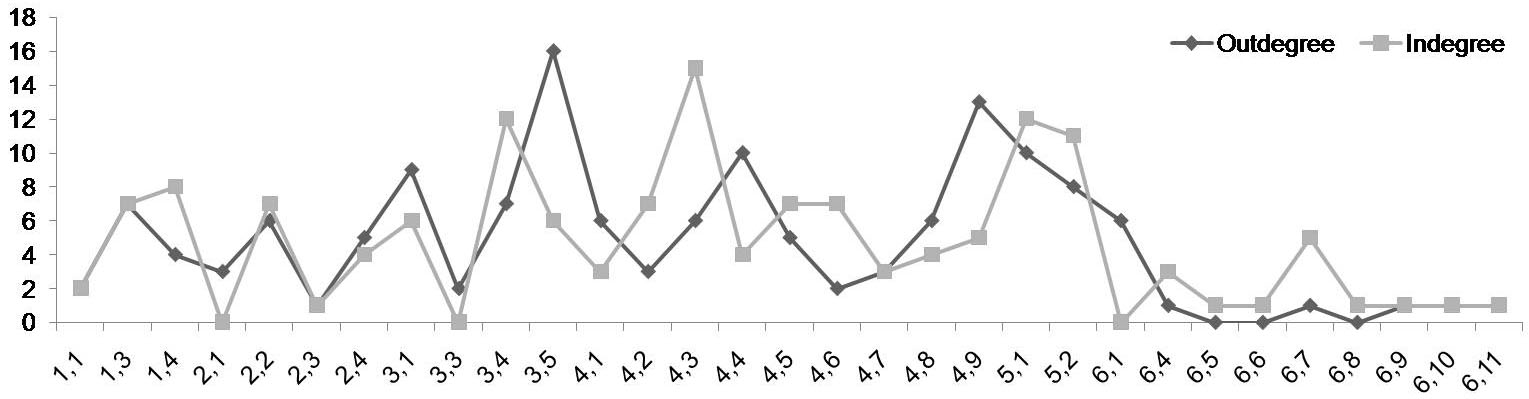
Diagram in Fig. 4 displays the Outdegree values, corresponding to the ties sent by each node, and the Indegree values, corresponding to the number of ties received from the other nodes, for each indicator involved in the network’s structure. “Naturalness”, “Services” and both indicators of criterion 5 are the indicators with higher Indegree. According to the actors’ opinions, this means that these indicators are the most susceptible ones in the network. On the other hand, “Forest under management plan” and “Protected forests” are the indicators with higher Outdegree, i.e., which affect the other indicators to ensure the conservation function, followed by “Introduced tree species” and “Increment and felling” indicators. Except for indicator 6.7 “Wood consumption”, it is clear that all the indicators of socio-economic functions and conditions are considered less central in this context.
Fig. 4 - Degree value for the indicators considered in this study. For more details on indicators’ label, see Tab. 1.
Aggregation of the data based on criteria revealed that criteria are very unbalanced as to the amount of indicators. As displayed in Fig. 5, the average Degree for criteria confirms that the socio-economic criterion is significantly less central in the network. On the other hand, the protective function is the most central criterion in the network, despite it is represented by only 2 indicators.
Fig. 5 - Average of degree at criteria level.
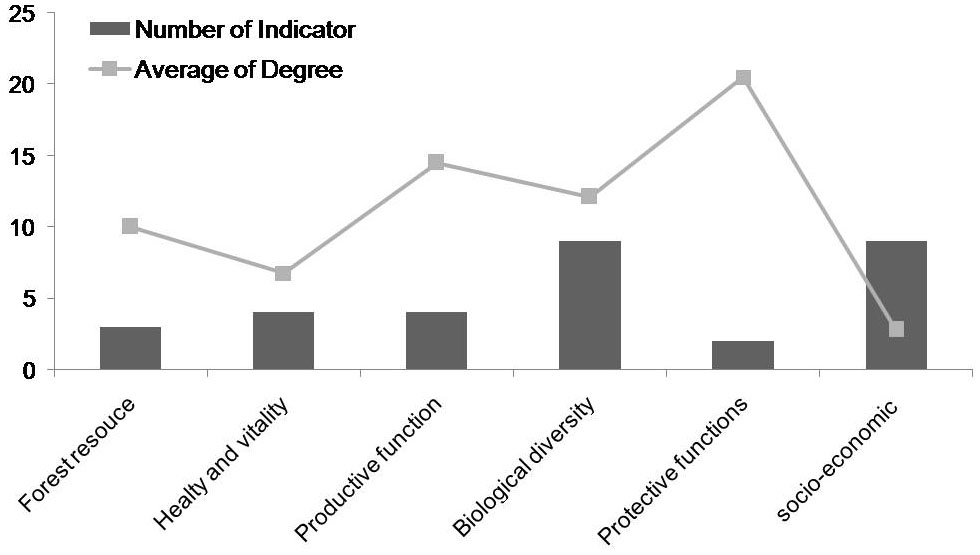
“Maintenance and Encouragement of Productive function of forests, wood and non wood” is the second central criterion followed by “Maintenance, conservation and appropriate enhancement of biological diversity in forest ecosystems”.
Discussion
The study examined the possibility to improve participatory process inside the implementation of the TFP with indicators network and the results obtained confirm this possibility. TFP has many reasons to be considered as a positive tool of SFM. For instance, the large scale of applicability allows a better consideration of the goods and services supplied to local people by forests. For this reason, TFP allows a better allocation of forest functions, maintaining the forest in a good state of conservation. Furthermore, it might be the best option to solve the conflict of interest through the participatory approach and MCDA ([2]). Finally, TFP also allows to develop and test by field observations verifier indicators, which are the basis for standardized indicator measurement and assessment in a specific local context and for comparable forest type ([23], [25]). On the other hand, the practical use of indicators network can be incorporated in the TFP implementation.
As many studies argue, usage of indicator sets without considering their relationship will cause shortcomings in the evaluation and assessment procedures of a complex issue like SFM ([37], [27], [21]). In this context, in which the policy scenario is promoting the conservation function, the actors consider the protective function of forests as the most important criterion to be monitored. In addition, they strongly believe that the presence of a management plan can influence positively a lot of other indicators, therefore contributing to conservation functions.
Despite this is only one of the multiple approaches to built a network structure, the results of this investigation suggest that the methodology adopted may be helpful to identify the core indicators according to the participants’ opinions, to be included in the definition of the forest management guidelines by TFP.
Although cognitive mapping methods are strongly subjective and dependant on a personal point of view, as other authors have reported ([6], [27]), the indicators network may be easily adapted to the implementation of participatory approaches. To this aim, we suggest the organization of an ad-hoc workshop for enlarging the number of local stakeholders involved and building more exhaustive networks. This may have the advantage to improve both the public knowledge on C&I for SFM and the different mechanisms involved in the SFM systems in order to simulate how decision makers can impact on SFM issues. At the same time, the participants’ feedback on the indicator interaction, in the local context and in the specific policy scenario, may be collected in order to understand the public opinion’s views concerning SFM.
TFP implementation provides many opportunities of meeting local stakeholders, and one of them can be planned for collecting inputs for the indicators network approach. In particular, the questionnaire on the choice of the most important function ([2]) may be improved with the indicators network and the function selected as the more important could represent the policy scenario on which to build the indicators network.
The indicators network approach can help to assess the sensitivity of the indicator set to system changes through the Degree measures (Indegree and Outdegree), and to identify the main and most important causal paths involving the indicators. This information offers decision makers the opportunity to manage the forest ecosystem in a more holistic way.
Obviously, a larger number of responders with many different backgrounds may increase the network size and density, and also the centrality indicator may change. In this study, the application of the indicators network has emphasized that protective function, services and naturalness are the indicators requiring a more intensive monitoring, such as forest management plan, which is the indicator with the biggest Outdegree value. In this context, the socio-cultural indicators are considered the ones with the least centrality. This observation is crucial because touristic and recreational activities, such as expenditures for services, forest sector workforce and energy from wood resource, represent a good opportunity to promote rural development and to contrast the population migration phenomena.
In general, the 35 quantitative indicators analyzed in this study were very unevenly distributed across criteria ([6], [27]). Indeed, the criterion 5 “Protective functions” had the smallest number of indicators, but it was considered very important as revealed by the larger average value for Degree and Betweenness.
In conclusion, indicators network allows to visualize SFM indicator interactions consistently, identify key indicators and crucial linkages, and also determine which indicators or criteria play the strategic role in the specific context, but there is still lack to assess the centrality value at higher level in SFM between ecological, social and economic aspect ([28]).
Conclusions
The results of this work are in agreement with the the theory that C&I are not only the tool used to monitor and assess forest resources, but they may also help the decision-making process.
TFP is a cognitive tool that allows to manage the forest resources considering the multifunctional role of forest, based on the stakeholders’ opinions through the participatory approach. TFP represent the planning over broad spatial areas that allow to achieve the stable supply of forest amenities for human well being.
The main results of this study show that TFP can be improved with the inclusion of the indicators network with the aim of identifying the core and isolated indicators based on the public opinion. In particular, our results show that, although the Indicators network is subjective, it allows a better understanding for stakeholders of the SFM. Furthermore, it is possible to include the stakeholder’s point of view in the silvicultural guidelines and to apply them through the TFP in a specific context. Of course, the inclusion of more actors with a different background and more policy scenario may improve the final outcome.
Finally, through TFP forests can be considered the core of rural environment. Forest management plan has to aim at maintaining the forest ecosystem in a good state of conservation, allowing at the same time the production of goods and services for rural development in a more efficient way.
Acknowledgements
We wish to thank Nicola Pavone, Armando Cardillo, Daniela Tonti, Claudia Cocozza, Mattia Scirè and Guido Milanese for building the network maps. We also thank the EFICEN-OEF staff.
References
Gscholar
Gscholar
Gscholar
Gscholar
Gscholar
Gscholar
Gscholar
Gscholar
Gscholar
Authors’ Info
Authors’ Affiliation
Dipartimento di Scienze Animali, Vegetali e dell’Ambiente (SAVA), Università del Molise, I-86100 Campobasso (Italy)
European Forest Institute, Central European Regional Office and Observatory for European Forests (EFICENT-OEF), 8 rue Baron Louis, F-54000 Nancy (France)
Dipartimento di Scienze e Tecnologie per l’Ambiente e il Territorio (STAT), Università del Molise, c.da Fonte Lappone, I-86090 Pesche, IS (Italy)
Corresponding author
Paper Info
Citation
Santopuoli G, Requardt A, Marchetti M (2012). Application of indicators network analysis to support local forest management plan development: a case study in Molise, Italy. iForest 5: 31-37. - doi: 10.3832/ifor0603-009
Academic Editor
Agostino Ferrara
Paper history
Received: Sep 01, 2011
Accepted: Jan 03, 2012
First online: Feb 27, 2012
Publication Date: Feb 27, 2012
Publication Time: 1.83 months
Copyright Information
© SISEF - The Italian Society of Silviculture and Forest Ecology 2012
Open Access
This article is distributed under the terms of the Creative Commons Attribution-Non Commercial 4.0 International (https://creativecommons.org/licenses/by-nc/4.0/), which permits unrestricted use, distribution, and reproduction in any medium, provided you give appropriate credit to the original author(s) and the source, provide a link to the Creative Commons license, and indicate if changes were made.

Web Metrics
Breakdown by View Type
Article Usage
Total Article Views: 58122
(from publication date up to now)
Breakdown by View Type
HTML Page Views: 47597
Abstract Page Views: 4039
PDF Downloads: 4765
Citation/Reference Downloads: 37
XML Downloads: 1684
Web Metrics
Days since publication: 5234
Overall contacts: 58122
Avg. contacts per week: 77.73
Article Citations
Article citations are based on data periodically collected from the Clarivate Web of Science web site
(last update: Mar 2025)
Total number of cites (since 2012): 13
Average cites per year: 0.93
Publication Metrics
by Dimensions ©
Articles citing this article
List of the papers citing this article based on CrossRef Cited-by.
Related Contents
iForest Similar Articles
Research Articles
Usefulness and perceived usefulness of Decision Support Systems (DSSs) in participatory forest planning: the final users’ point of view
vol. 9, pp. 422-429 (online: 02 January 2016)
Research Articles
Public participation in sustainable forestry: the case of forest planning in Slovakia
vol. 7, pp. 414-422 (online: 19 May 2014)
Research Articles
Indicators for the assessment and certification of cork oak management sustainability in Italy
vol. 11, pp. 668-674 (online: 04 October 2018)
Research Articles
Communicating spatial planning decisions at the landscape and farm level with landscape visualization
vol. 7, pp. 434-442 (online: 19 May 2014)
Technical Reports
Decision making in forest road planning considering both skidding and road costs: a case study in the Hyrcanian Forest in Iran
vol. 6, pp. 59-64 (online: 21 January 2013)
Review Papers
Public participation: a need of forest planning
vol. 7, pp. 216-226 (online: 27 February 2014)
Research Articles
The concept of green infrastructure and urban landscape planning: a challenge for urban forestry planning in Belgrade, Serbia
vol. 11, pp. 491-498 (online: 18 July 2018)
Research Articles
Use of multi-criteria analysis (MCA) for supporting community forest management
vol. 5, pp. 60-71 (online: 12 April 2012)
Research Articles
Use of LIDAR-based digital terrain model and single tree segmentation data for optimal forest skid trail network
vol. 8, pp. 661-667 (online: 22 December 2014)
Review Papers
Integration of forest mapping and inventory to support forest management
vol. 3, pp. 59-64 (online: 17 May 2010)
iForest Database Search
Search By Author
Search By Keyword
Google Scholar Search
Citing Articles
Search By Author
Search By Keywords
PubMed Search
Search By Author
Search By Keyword


