Mapping fungi from below ground: online genetic resources and ectomycorrhizal geographic distributions
iForest - Biogeosciences and Forestry, Volume 4, Issue 6, Pages 252-255 (2011)
doi: https://doi.org/10.3832/ifor0599-008
Published: Dec 13, 2011 - Copyright © 2011 SISEF
Research Articles
Abstract
We used DNA sequences of 20 ectomycorrhizal fungal species obtained from roots in Britain and Germany to find location data within Europe for these fungi in the public DNA databases. These data were used to plot species presence on maps, environmental layers were laid over these maps, and information from those sites was extrapolated using geographic information systems. Through randomization tests the significant factors for each species from available data were tested. Similar methodology was used for fungal samples identified using morphology from the Global Biodiversity Information Facility to compare data quality and quantity. This analysis exposed the need for uniform methodology and greater distribution of sampling in order to create viable species distribution models for ectomycorrhizas.
Keywords
GIS, Geographic Information Systems, Ectomycorrhiza, GenBank, Ribosomal DNA, Fungi
Introduction
Ectomycorrhizal (ECM) fungi are obligate plant mutualists and they are among the most functionally important soil organisms in forest ecosystems ([18]). However, as the delimitation and identification of many ECM species is problematic and their life cycles largely subterranean, the geographic ranges for species are unknown. There is a need to establish current distributions in the face of changing environmental conditions, because without them even large changes in mycorrhizal distributions may go undetected.
Some ECM fungal species have conspicuous fruiting bodies that can thus be used to generate species distribution maps, e.g., Amanita phalloides ([19]). This is often not possible as many ECM species are cryptic and difficult to observe in this fashion, e.g., truffles and resupinate crusts. For these fungi an approach using their mycorrhizas for identification is more practical. DNA sequences of the internal transcribed spacer (ITS) region of the nuclear ribosomal DNA provide a universal genetic marker for fungi. This study makes use of their growing availability in online DNA databases to obtain spatial presence data for ECM species thus far unmapped.
Ryberg et al. ([17]) studied the strength of GenBank for meta-analysis and identification of ECM fungi with a focus on illustrating the gaps in identification for the genus Inocybe, but they also analysed the location of fungal species from GenBank providing a rough idea of their distribution on a whole-country basis. This was an early example demonstrating the potential for a DNA sequence method for mycorrhizal mapping. Two recent studies have applied spatial data on fungal presence to generate Species Distribution Models (SDM). Wollan et al. ([20]) used herbarium mushroom records to create a fungal SDM for Norway, and Wolfe et al. ([19]) gathered mushroom data from Europe to create a powerful predictive SDM for North American Amanita phalloides. The application of MAXENT software shows promising results for niche modelling based on presence-only data ([20]) which are often the only data available for fungi. Before applying niche modelling software this study sought to test the quality of DNA data and the available environmental layers.
Studies by Cox et al. ([2], [3]) inferred ECM responses to nitrogen deposition at large geographic scales that differ from those at local scales. Here too the argument was made for using DNA to identify ECM in large-scale spatial analysis, but the problems and methodological incongruences of combining multiple studies were also noted. To enable this new facet of mycorrhizal ecology, Lilleskov & Parrent ([14]) called for a unified approach to fungal root sampling. We envision that georeferenced fungal DNA sequence data will continue to accumulate rapidly to eventually reveal fungal species distributions. This study explores what signal indicating the environmental preferences of ECM might be already hidden in the growing online databases.
Methods
Twenty different ECM fungi were delimited to species level using ITS DNA sequences from ectomycorrhizas; these were found to be among the most common ECM present at diverse forest and heathland sites ([4], [2]). Location points from Europe were gained using NCBI-BLAST matches from the Genbank and UNITE databases (Fig. 1). High thresholds of similarity were employed (97% for Basidiomycetes and 98% for Ascomycetes - [15]) with a minimum sequence coverage of 80% and a minimum sequence length of 400bp to improve confidence of species matches.
Fig. 1 - Spatial locations of all data gathered from ITS matches using BLAST, from GenBank, UNITE and associated literature.
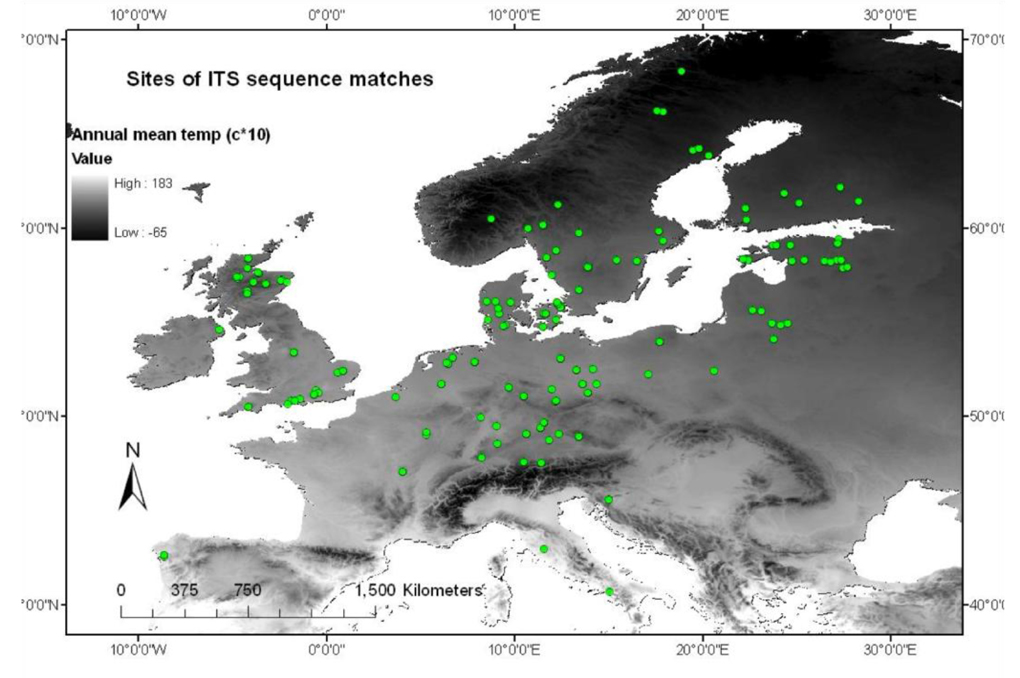
In some cases annotated data on GenBank/ UNITE records was used to establish latitude and longitude coordinates, but as this information was often unavailable, associated publications were used to establish source locations. In two cases authors were contacted directly and responded with coordinates (Yarwood SA & Rudawaska M, pers. comm.). Where there were insufficient data for a BLAST match the point was discarded.
Bioclimatic, altitude and soil pH values were extrapolated from the presence of these various fungi using layers obtained from United Nations Spatial Data Infrastructure (nitrogen, soil pH, drainage) WorldClim (bioclimatic and altitude - [9]) in ArcGIS. These different species were then tested through randomisation using R version 2.7.2 to examine significant environmental variables. Gathered values were put into a matrix and randomised 1000 times. Where values were below 0.05, the observed environmental variables for that species were considered significantly non-random.
In a separate analysis, presence data gathered for three of the tested fungi were gathered from a source that includes morphologically identified specimen records, the Global Biodiversity Information Facility ([6]), and compared with the data gathered from DNA databases to address issues of data quantity and quality.
Results
The total data set for all 20 species was 321 points. Sample sizes per species ranged from 35 Xerocomus badius to 9 Thelephoraceae spp. The most significant results relate to the annual mean temperature (Tab. 1). There is strong evidence that the results extrapolated from that data are non-random.
Tab. 1 - Fungi from randomisations with significance or near significance for each environmental variable (ITS matches). (~): near significance values of <0.1; (*): randomisation significance of <0.05; (**): randomisation significance of <0.005.
| Variable | Species |
|---|---|
| pH | Atheliaceae sp. (n=22)* Thelephora terrestris (n=27)* Scleroderma citrinum (n=13)~ |
| Elevation | Hydnotrya tulasnei (n=11)* |
| Drainage | Cenococcum sp. (n=14)~ |
| Nitrogen | Hydnotrya tulasnei (n=11)* |
| Annual mean temperature | Cantharellaceae sp. (n=18)* Elaphomyces granulatus (n=13)* Russula paludosa (n=12)*, Xerocomus badius (n=34)** |
| Annual precipitation | Piloderma sp. (n=13)* Cenococcum sp. (n=14)~ Elaphomyces granulatus (n=13)~ |
When a similar analysis was carried out using data from GBIF, the much larger size of the data set per species should have provided a more representative result (183 for Elaphomyces granulatus against 13 BLAST matches). However, these samples suffered heavily from spatially autocorrelated sampling with over half of the samples for Lactarius rufus and Xerocomus badius originating from Norway. In an attempt to compensate for this, randomised sub-sets of the data were generated and used in the statistical tests.
Discussion
Overall, the bioclimatic variables yielded more significant results than the other environmental layers. Variables such as soil pH have a proven effect on the presence of different ectomycorrhizas ([10]), as well as on the presence of different host tree species. The lack of significance when extrapolating from their values in this analysis is likely to be a result of high variability at local scales (e.g., nested pockets of high acidity) and low layer resolution. The significant results found through this analysis, in particular those of the bioclimatic variables ([9]), were extrapolated from layers of much higher resolution. These types of variables are more accurately quantified at large spatial scales than soil variables.
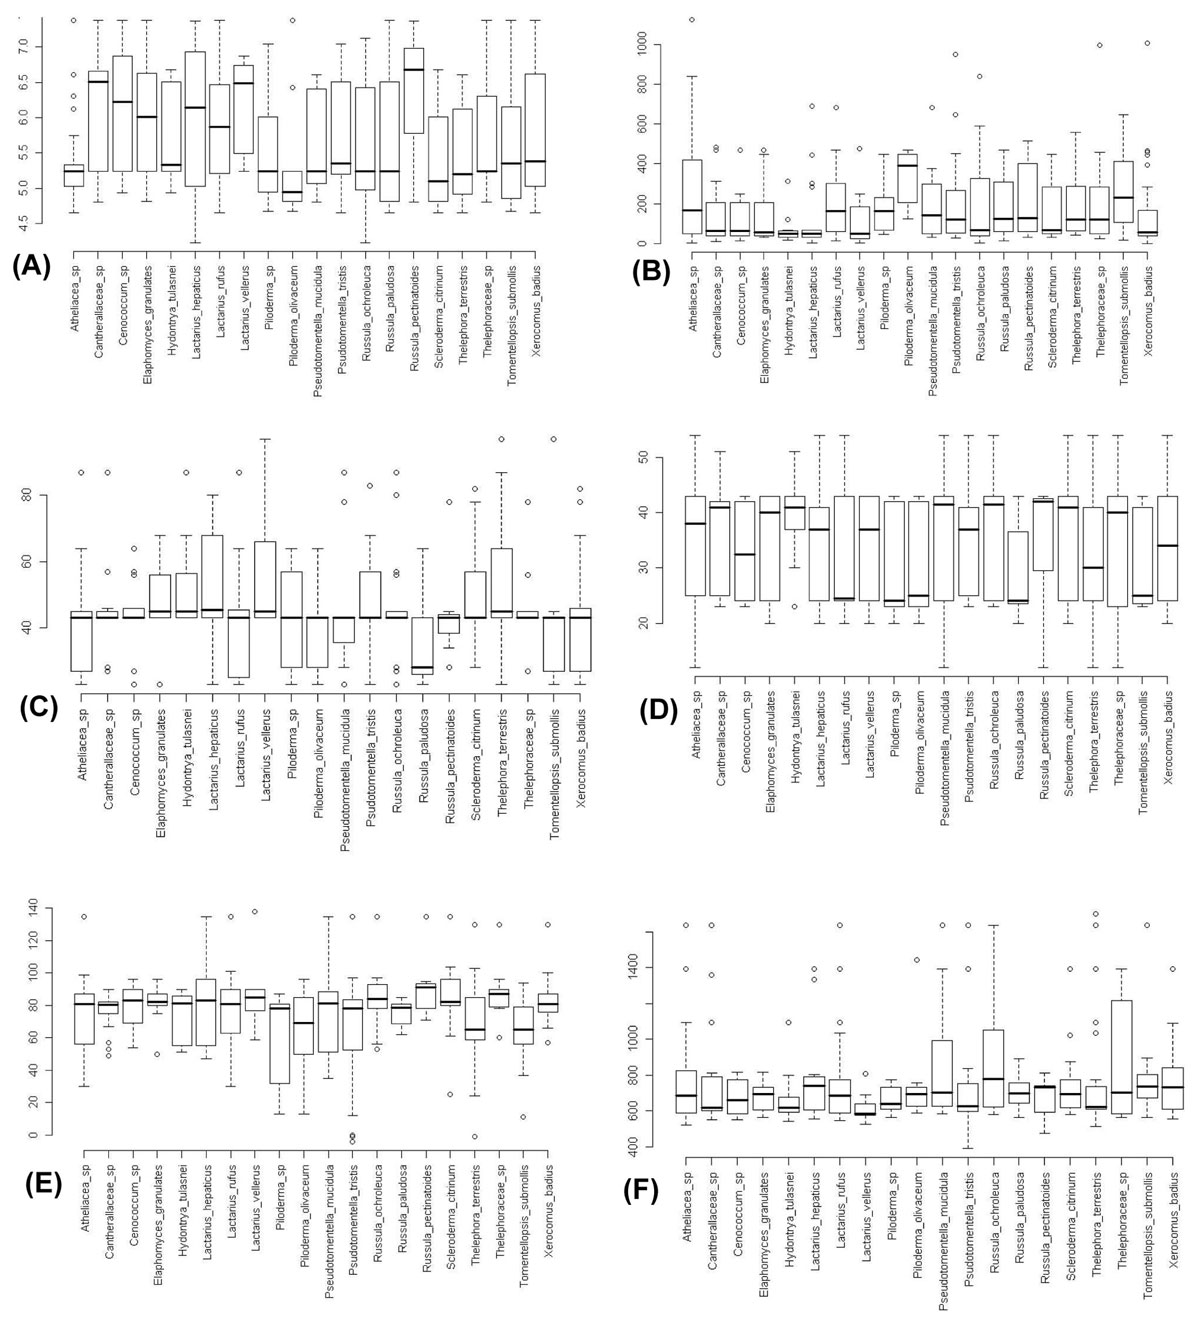
Cox et al. ([3]) showed nitrogen as a determinant of fungal diversity across geographical scales but not at a local level. Soil nitrogen was only a significant variable in the present analysis in one case with low sample size; this is most likely also due to layers of low resolution. This can be seen in the generally high levels of variation (Fig. 2). If the annotated information on GenBank records provided information on soil nitrogen, drainage and pH, then the accuracy of environmental layers could be measured by comparing values gained in GIS with those drawn from GenBank and UNITE, prior to statistical testing.
Fig. 2 - Boxplots for environmental data collected from all ITS sequence sites (including F. Cox sites). (A): pH; (B): elevation (meters above sea level); (C): soil drainage (% saturation); (D): soil nitrogen (% of 1%); (E): Annual mean temp (°C x 10); (F): Annual precipitation (mm). Boxes represent inter-quartile range, centre bar represents median, whiskers represent 5th to 95th percentile range.
This study sought to test the quality and quantity of data available as much as the data itself; thus, our results show a number of areas which need to be improved for a DNA-based approach to be further used to create SDMs. The extent of this study could soon be improved with new ITS sequence data based on next generation sequencing technologies ([16]).
The issue of data quantity and fungal species identification is being addressed through the continual growth of online databases and Hibbett et al. ([8]) review the resulting recent progress made in fungal taxonomy. In order to create an SDM a large number of location points is required to verify the respective strengths of environmental variables. That is why this study takes only a preliminary look at a large number of ECM species. Biological GIS data may be subject to three types of bias: taxonomic, temporal and spatial. Gathering data through the use of BLAST aims to reduce taxonomic bias. Although there is variability in the reliability of morphological identification techniques, ITS DNA presents standardized reliable results especially if backed up by multi-locus species delimitation (e.g., [7]). Where sporocarp material is relied on, a temporal bias can only be countered by continued sampling effort across fruiting periods. As this is logistically difficult it may be more feasible to use mycorrhizas because they can be temporally stable ([1], [11], [13]). Spatial bias is currently the most detrimental to the use of online databases for creating fungal SDMs and is illustrated by this analysis. The DNA sequences drawn from Genbank and UNITE were predominantly from Denmark, Britain and Sweden even though the original samples were gathered predominantly from Britain and Germany. Results of significance, extrapolated from fungi taxa locations, were not significantly more spatially auto correlated than those taxa without significant results. This indicates that spatial bias was not responsible for significant results. Although there are issues of spatial bias inherent in this type of data, they are being addressed through the growth of online databases.
Although the quantity of morphologically-identified data from GBIF was large, and some of the results highly significant, the spatial autocorrelation of the data was also high. Even with a randomised subset of data taken from Norway, the proportion of the data from this area skewed the results. For spatial analysis and particularly for SDMs a large number of locations is required for presence-only data. However, as there was spatial sampling bias for these taxa, in addition to the inherent ambiguity of morphologically identified fungal samples, this method would be better served by the growth of fungal databases.
Large scale range maps for ECM only exist for some species at a national level, are based on the presence of fruiting bodies (e.g., [5]) and are absent from the European Atlas of Soil Biodiversity ([12]). A standardised sampling method using DNA identification and gaining data on ECM community composition, soil variables and location would take future analyses closer to SDMs for a multitude of species. Cox et al. ([2]) highlight the potential of ICP Forests for generating uniform data quality. These forests are intensively monitored for biodiversity, atmospheric deposition, soil chemistry, foliar nutrient levels and water balances among other factors across 41 European countries providing both large enough scale and a reliable, scientific resource of historical environmental data for the development of ECM range maps. In addition to this, the data from these sources could be used to create powerful SDMs to predict the presence of ECM species in unsampled areas.
Conclusion
This analysis has shown that the data present in online genetic databases for some ectomycorrhizal fungi can be used to map fungi. However, the validity of this method requires high resolution and accurate environmental layers, an understanding of the variability of environmental factors at different spatial scales and an evenly distributed sampling effort. Low data quantity means that these results cannot yet be used to make a reliable SDM.
There is need for a standardised level of data collection regarding ECM DNA and the variables of the environment in which they are found. As the strength of spatial data and its extrapolated information is based fundamentally on a larger number of evenly distributed sample locations, the use of online DNA databases provides a reliable means to increase data quality for the development of ECM SDMs.
References
Gscholar
Gscholar
Gscholar
CrossRef | Gscholar
Gscholar
Authors’ Info
Authors’ Affiliation
Royal Botanic Gardens, Kew, Richmond TW9 3DS (England)
Imperial College London, London SW7 2AZ (England)
Corresponding author
Paper Info
Citation
Tse-Laurence MA, Bidartondo MI (2011). Mapping fungi from below ground: online genetic resources and ectomycorrhizal geographic distributions. iForest 4: 252-255. - doi: 10.3832/ifor0599-008
Academic Editor
Alberto Santini
Paper history
Received: Jun 15, 2011
Accepted: Sep 02, 2011
First online: Dec 13, 2011
Publication Date: Dec 13, 2011
Publication Time: 3.40 months
Copyright Information
© SISEF - The Italian Society of Silviculture and Forest Ecology 2011
Open Access
This article is distributed under the terms of the Creative Commons Attribution-Non Commercial 4.0 International (https://creativecommons.org/licenses/by-nc/4.0/), which permits unrestricted use, distribution, and reproduction in any medium, provided you give appropriate credit to the original author(s) and the source, provide a link to the Creative Commons license, and indicate if changes were made.

Web Metrics
Breakdown by View Type
Article Usage
Total Article Views: 60185
(from publication date up to now)
Breakdown by View Type
HTML Page Views: 50233
Abstract Page Views: 4326
PDF Downloads: 4108
Citation/Reference Downloads: 19
XML Downloads: 1499
Web Metrics
Days since publication: 5323
Overall contacts: 60185
Avg. contacts per week: 79.15
Article Citations
Article citations are based on data periodically collected from the Clarivate Web of Science web site
(last update: Mar 2025)
Total number of cites (since 2011): 7
Average cites per year: 0.47
Publication Metrics
by Dimensions ©
Articles citing this article
List of the papers citing this article based on CrossRef Cited-by.
Related Contents
iForest Similar Articles
Research Articles
Potential spread of forest soil-borne fungi through earthworm consumption and casting
vol. 8, pp. 295-301 (online: 26 August 2014)
Research Articles
Ectomycorrhizae of Norway spruce from its southernmost natural distribution range in Serbia
vol. 12, pp. 43-50 (online: 10 January 2019)
Review Papers
Soil fungal communities across land use types
vol. 13, pp. 548-558 (online: 23 November 2020)
Research Articles
Effect of plant species on P cycle-related microorganisms associated with litter decomposition and P soil availability: implications for agroforestry management
vol. 9, pp. 294-302 (online: 05 October 2015)
Short Communications
Not all long-distance-exploration types of ectomycorrhizae are the same: differential accumulation of nitrogen and carbon in Scleroderma and Xerocomus in response to variations in soil fertility
vol. 14, pp. 48-52 (online: 18 January 2021)
Research Articles
Ectomycorrhizal fungal community associated with autochthonous white poplar from Serbia
vol. 9, pp. 330-336 (online: 12 November 2015)
Research Articles
Effects of arbuscular mycorrhizal fungi on microbial activity and nutrient release are sensitive to acid deposition during litter decomposition in a subtropical Cinnamomum camphora forest
vol. 16, pp. 314-324 (online: 13 November 2023)
Research Articles
Fungal and bacterial communities in a forest relict of Pinus pseudostrobus var. coatepecensis
vol. 16, pp. 299-306 (online: 09 November 2023)
Short Communications
Culturable fungi associated with wood decay of Picea abies in subalpine forest soils: a field-mesocosm case study
vol. 11, pp. 781-785 (online: 28 November 2018)
Research Articles
Ectomycorrhizal diversity in a mature pedunculate oak stand near Morović, Serbia
vol. 16, pp. 345-351 (online: 22 November 2023)
iForest Database Search
Search By Author
Search By Keyword
Google Scholar Search
Citing Articles
Search By Author
Search By Keywords
PubMed Search
Search By Author
Search By Keyword


