Microclimate regulating functions of urban forests in Changchun City (north-east China) and their associations with different factors
iForest - Biogeosciences and Forestry, Volume 11, Issue 1, Pages 140-147 (2018)
doi: https://doi.org/10.3832/ifor2466-010
Published: Feb 07, 2018 - Copyright © 2018 SISEF
Research Articles
Abstract
Microclimate regulating functions of urban trees and their associations with environmental factors and tree-growth characteristics are important for management and ecological evaluations. In this study, a total of 637 trees distributed in the Changchun urban region (ca. 400 km2, northeastern China) were sampled in four different types of urban forests (AF: affiliated forests; RF: roadside forests; LF: landscape and relaxation forests; EF: ecological welfare forests). Tree growth-related parameters and environmental factors (inside and outside the forest) were simultaneously measured, and location-dependent differences in shading, cooling and humidifying effects were assessed, along with their associations with the measured variables. We found that urban forests in Changchun reduced the incident sunlight by 74-86% and increased air relative humidity by 3-7%, on average. Air, soil, and upper-canopy temperatures were decreased approximately by 3 °C, <1 °C and 1 °C, respectively, showing a 3-dimensional cooling effect of urban forests on both air and soil. Shading, cooling and humidifying effects significantly differed among the four forest types, with AF stands showing the highest comprehensive scores for all the microclimate regulation functions. Regression analyses and redundancy analysis revealed that urban forests had much stronger effect in terms of microclimate regulation at sunny days with high temperature, and low air humidity. In general, stands with larger trees showed the higher regulating functions, regardless of the stand structure and composition. The results of this study may help urban forest management and planning aimed at maximizing their ecological services.
Keywords
Urban Forest Types, Shading Effect, Cooling Effect, Humidifying Effect
Introduction
The main functions of urban forests is to create favorable habitats for biological survival and provide excellent working, living and relaxing environment for urban residents ([41], [16], [22], [30]). So far, studies on environmental benefits of urban forests have mostly focused on reducing urban heat island effect ([5], [33]), comparing the cooling effect of different tree species and community types ([42], [7], [21]), exploring their relations with biodiversity and trees growth ([29], [32]) or investigating the physiological mechanisms like photosynthesis and leaf transpired water loss ([48], [43]), in order to provide suggestions for urban forest management. Remote sensing technology and the corresponding model inversion methods have also been used to assess the environmental benefits of urban green space ([25], [17], [8], [28]).
In China, urban forests are usually classified into affiliated forests (AF: mainly located in schools, institutes, university, residential areas, etc.), roadside forests (RF: forests surrounding the main streets), landscape and relaxation forests (LF: parks, botanical gardens, etc.) and ecological and public welfare forest (EF: mainly distributed in the urban-rural interface area, such as farmland protection forests and other forests of estuarine-coastal areas or water supply areas - [14]). This kind of functional type division has become the basis of urban forests management in China.
Comprehensive studies focusing on multi-regulation functions (such as shading, temperature cooling, soil and air humidity regulation, etc.) demonstrated that urban forests contribute to optimize local microclimate, although differences among species have been reported ([50], [45], [47]). Previous studies on the cooling function of urban forests mainly focused on differences in air temperature between inside and outside the forest in horizontal direction ([35], [19], [23]), although vertical temperature regulation is becoming more and more a concerning problem in urban areas, due to the increase in building height and the greater use of sky space ([13]). Moreover, leaf transpiration has been demonstrated to exert a relevant effect on air humidity in arid and semiarid regions of northern China ([24]). Further, the soil of urban forests influences many ecological services, including soil biodiversity and plant growth ([15]), but its cooling effect and the underlying mechanisms have been poorly studied so far.
Urban forests management will greatly benefit from better understanding the relationships between microclimate regulation functions, urban forest structure, and local environmental conditions ([47], [39]). Recent studies have demonstrated that higher trees have a better regulation capacity in terms of sunlight interception, air temperature and humidity ([10]).
Changchun, the capital city of the Jilin Province (northeast China), has a 100-yrs urban settlement history and is currently surrounded by a system of 5-ring roads in its suburbs (Fig. 1a). Recently, a large development of urban forests and green spaces has taken place in Changchun ([44]), but a large-scale survey of their regulating effect on local microclimate is still missing.
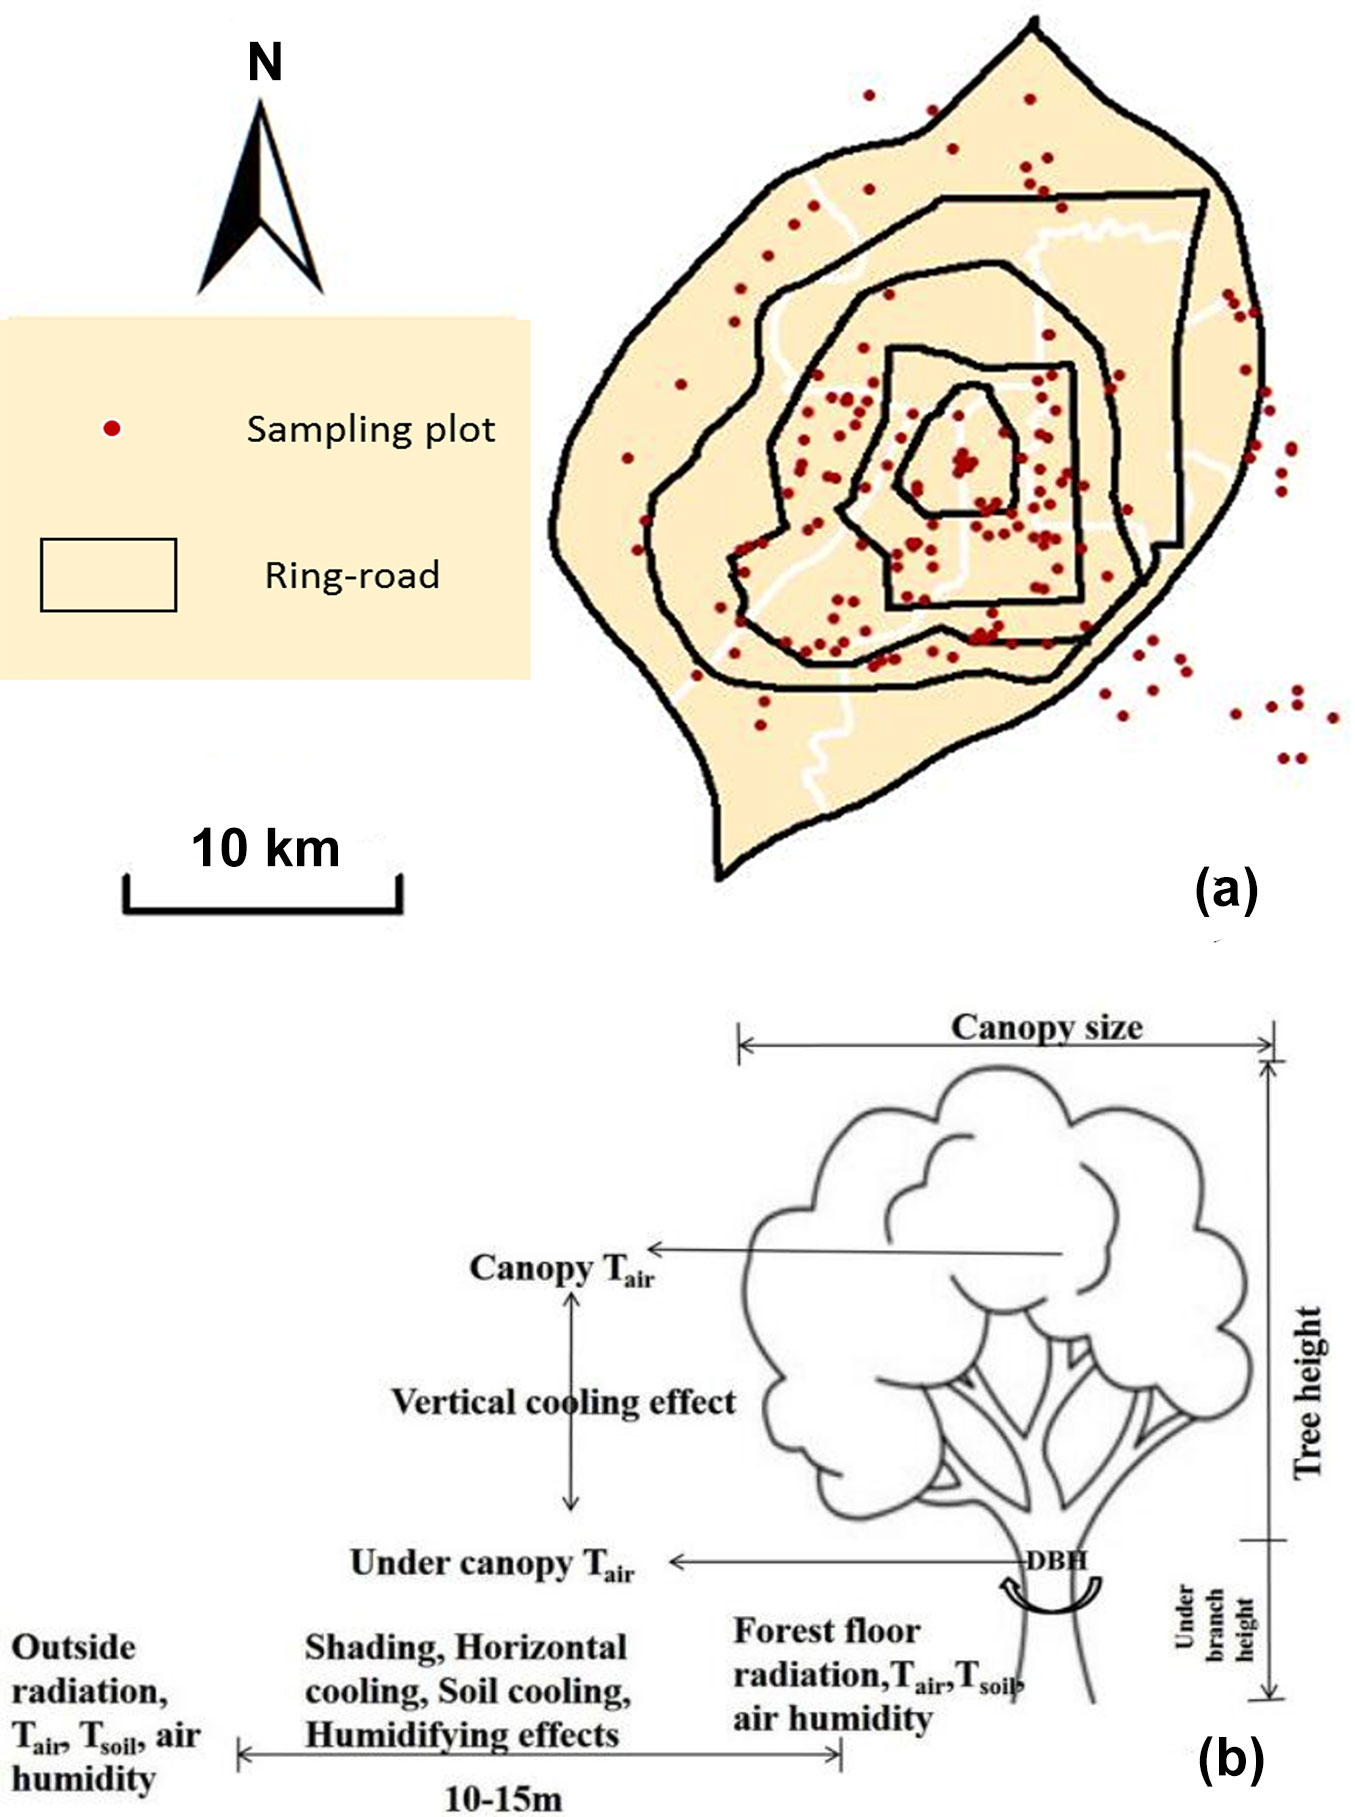
Fig. 1 - (a) Spatial distribution of the 160 sampling plots in the Changchun urban area (red dots); (b) Sketch map of shading, cooling (horizontal, vertical, and soil cooling) and humidifying effects measured or calculated at each sampled tree (late June to July of 2014). Tair and Tsoil indicate air and soil temperature, respectively.
In this study, a field survey was carried out with the aim of testing whether the different forests types have different microclimate regulating functions, and whether these differences were associated with local climatic conditions and/or with tree characteristics. We will answer the following questions: (i) is there any difference among the four forest types (AF, EF, LF, and RF) in their shading, cooling and humidifying effects? (ii) Which are the relations between these regulating functions, environmental factors, and tree growth characteristics? (iii) What suggestions can be put forward for urban forests management?
The results of this study could provide a useful basis for policymakers, urban planners and forest managers to better manage and plan different urban forest types.
Materials and methods
Study site
The study sites were located in the Changchun urban area (43° 05′ - 45° 15′ N and 124° 18′ - 127° 02′ E), Jilin Province (northeast China). The climate is a continental monsoon climate of the North Temperate Zone. The annual average temperature is 4.8 °C and the average annual precipitation is 567 mm. Our study area is primarily located within the 5th-ring road of Changchun (Fig. 1a). The main tree species occurring in urban forests are Populus cathayana, Salix babylonica, Picea spp., Syringa spp., and Pinus thunbergii ([34], [44]). A stratified sampling method was adopted to ensure a balanced survey of all urban forests over the City. The spatial distribution of the 160 plots included in the survey is shown in Fig. 1. In AF and LF stands, 20 × 20 m plots were established for field measurements, while in RF and EF stands measurements were carried out within belts of 50-100 m, depending on the forest characteristics; in the latter cases, several rows of trees were measured, and all the existing trees were sampled when the forest width was less than 20 m.
Microclimate factors and tree growth-related parameters
In each plot, 4 healthy trees belonging to the main tree species were selected. For each tree, we measured tree height and under-branch height (m) using a NIKON® forestry PRO laser tree height meter (Nikon, Japan). Tree circumference was measured by a regular soft tape at 1.3 m height above the ground, and the diameter at breast height (DBH) calculated. Canopy size (m2) was estimated as the elliptic area of the crown projection by measuring its radii in east-west and north-south directions.
Environmental factors (sunlight radiation intensity, air temperature, air humidity, soil temperature, under-canopy temperature and canopy temperature) were simultaneously measured during plot inventory measurements. These data were used for computing cooling effect, shading effect, and humidifying effect due to trees. The point where that measures were taken for each variable is reported in Fig. 1b. Air temperature and relative humidity were recorded with a handheld temperature and humidity meter (Victor 231, Victory Hi-tech Co., Shenzhen, China). Solar radiation was recorded using a digital radiation meter (Tes-1330a, Tai Electronic Industry Co., China). Soil temperature was measured with a thermorecorder (Wanyunshan, Fuzhou, China) with a needle thermometer at 5 cm soil depth. Canopy temperature and under-canopy temperature were recorded by an infrared hand-held temperature measurement gun (303b Victor, Victory Hi-tech Co., Shenzhen, China). Three measurements were averaged for each variable. According to local sunrise and sunset time (4:30-19:30), all data were collected from 8:00 to 18:00 in sunny days to guarantee for their precision. A preliminary statistical analysis did not reveal significant diurnal differences (between morning and afternoon) for any of the recorded variables.
Calculation of shading, cooling and humidifying effects
The shading effect (ΔE, expressed as kLux) was calculated as the difference between outside-forest radiation and under-canopy radiation. Shading degree (in percentage) was also calculated as ΔE/outside radiation. The horizontal cooling effect (ΔT1, °C) was estimated as the difference in air temperature between outside the forest and the forest floor (ΔT1 = outside forest Tair - forest floor Tair). The vertical cooling effect (ΔT2, °C) was calculated as the difference in air temperature between canopy and under-canopy (ΔT2 = canopy Tair - under-canopy Tair). The soil cooling effect was expressed as ΔT3 (°C), being ΔT3 = outside forest Tsoil - forest floor Tsoil. Finally, the humidifying effect was quantified as ΔRH (%), where ΔRH = forest floor RH - outside forest RH ([47]).
Data analysis
ANOVA was performed using the software package SPSS® ver. 17.0 (SPSS Inc. Chicago, IL, USA). According to the statistics of multiple comparisons, shading, cooling and humidifying of the four forest types were signed with different letters for indicating significant differences. A comprehensive score was recomputed according to the significant differences; for example, a score value of 3, 2, 1 was given to differences labelled with a, b, c, respectively, while differences including double letters took average score, e.g., ab score = (3 + 2)/2 (see Tab. 1). All scores for different microclimate regulations were added in order to obtain a comprehensive score for each forest type. Using this method, higher scores indicate higher microclimate regulation functions. Data standardization and the comprehensive scoring method were adopted from Lu et al. ([26]) and Wang et al. ([38]).
Tab. 1 - Differences and scores in shading, cooling and humidifying effects of four different types of urban forests. Different lowercase letters indicate significant differences between different forest types after Duncan’s post-hoc test (p<0.05). (AF): Affiliated forests; (RF): roadsize forests; (LF): landscape and relaxation forests; (EF): public welfare forests.
| Microclimate regulation functions | Forest types | |||
|---|---|---|---|---|
| AF | RF | LF | EF | |
| Shading degree (%) | 84.98 a | 86.22 a | 82.39 ab | 73.86 b |
| Score in shading effect | 2 | 2 | 1.5 | 1 |
| Horizontal Tair differences (ΔT1,°C) | 3.85 a | 3.51 a | 3.16 a | 3.43 a |
| Score for ΔT1 | 1 | 1 | 1 | 1 |
| Vertical Tair differences (ΔT2, °C) | -0.68 b | -1.39 a | -0.81 ab | -1.36 a |
| Score for ΔT2 | 1 | 2 | 1.5 | 2 |
| Tsoil differences (ΔT3, °C) | 1.27 a | 0.83 ab | -0.18 bc | -0.03 c |
| Score for ΔT3 | 3 | 2.5 | 1.5 | 1 |
| RH differences (ΔRH, %) | 6.69 a | 3.38 c | 5.94 ab | 4.32 bc |
| Score for ΔRH | 3 | 1 | 2.5 | 1.5 |
| Comprehensive score sum | 10 | 8.5 | 8 | 6.5 |
A regression analysis using environmental factors and tree growth parameters as predictors of microclimate regulation functions was performed using the software JMP® ver. 10 (SAS, Cary, NC, USA). Best-fit coefficient of determination (R2) was used to quantify the proportion of the total variance accounted for by each tested climatic or tree structural factor used as predictor. Mean R2 and its standard deviation was calculated both for environmental and tree growth variables and then compared. Furthermore, redundancy analysis (RDA) was used to graphically represent the associations of microclimate regulating function with outside-forest climatic conditions and tree growth characteristics. CANOCO ver. 5.0 (Biometrics, Netherlands) was used for RDA analysis.
Results
Differences in microclimate regulations among forest types
The shading percentage across the four different forest types was 80%, on average. No significant differences were found in horizontal cooling effect (ΔT1) among the four forest types (p > 0.05). As shown in Tab. 1, the vertical cooling effect (ΔT2) is higher (2 °C) in RF and EF stands than in the other forest types. The soil cooling effect (ΔT3) of AF stands (1.27 °C) was the highest, followed by RF (0.83 °C). The humidifying effect (ΔRH) of AF and LF stands was 6-7% in relative humidity, which was significantly higher than that (3-4%) recorded for RF and EF types (Tab. 1). Data standardization scoring showed that the AF stands had the highest score (10), which was much higher than the other three forest types (average of 7.6).
Shading effect
The shading effect ΔE (i.e., the difference in radiation between outside and under-canopy) was closely associated with outside light intensity. All the four different types of urban forests showed a similar trend, i.e., a positive correlation was found between the shading effect and outside radiation. Compared with outside radiation, shading effect was less associated with under-canopy radiation (Tab. 2a). In the case of AF type, the R2 obtained using outside-forest radiation as predictor was over 7.5-fold higher than that obtained using under-canopy radiation (R2 = 0.98 vs. 0.13, respectively). RF and EF stands had an R2 as high as 100%, indicating that almost all the variation in the shading effect could be explained by the outside radiation (Tab. 2a).
Tab. 2 - Relationships between shading differences and environmental factors (a), as well as between under-canopy radiation and tree growth factors (b) in different urban forest types (non-significant relationships are not listed). (Ind. Var.): independent variable in the regression analysis.
| Ind. Var. | Forest types |
Regression equation | R2 | p-value | N |
|---|---|---|---|---|---|
| (a) Shading effect (ΔE) |
AF | = -3.199 + 0.949 × Outside radiation | 0.98 | <0.0001 | 108 |
| = 20.795 + 10.504 × Log(Under-canopy radiation) | 0.13 | <0.0001 | 108 | ||
| RF | = -2.474 + 0.963 × Outside radiation | 1 | <0.0001 | 112 | |
| = 19.449 + 6.62 × Under-canopy radiation | 0.23 | <0.0001 | 112 | ||
| LF | = -1.542 + 0.893 × Outside radiation | 0.97 | <0.0001 | 273 | |
| = 20.192 + 2.338 × Under-canopy radiation | 0.21 | <0.0001 | 273 | ||
| EF | = -10.92 + 1.003 × Outside radiation | 1 | <0.0001 | 144 | |
| All kinds | = -5.61+0.99 × Outside radiation | 0.996 | <0.0001 | 637 | |
| = 16.33e 0.1049 × Under-canopy radiation | 0.24 | <0.0001 | 637 | ||
| = -3.926 + 2.8484 ln(Under-canopy radiation) | 0.32 | <0.0001 | 637 | ||
| (b) Under-canopy radiation |
LF | = 9.989 -0.45 × Tree height | 0.15 | <0.0001 | 273 |
| = 7.016 -0.302 × Under branch height | 0.03 | 0.0019 | 273 | ||
| = 7.074 -0.045 × Canopy size | 0.05 | 0.0002 | 273 | ||
| EF | = 16.179 -0.599 × Tree height | 0.1 | <0.0001 | 144 | |
| = 12.711 -0.038 × DBH perimeter | 0.05 | 0.002 | 144 | ||
| = 12.647 -0.89 × Under branch height | 0.06 | 0.0038 | 144 | ||
| = 12.787 -0.099 × Canopy size | 0.08 | 0.0008 | 144 |
The under-canopy radiation of different types of urban forests (Tab. 2b) was significantly related with the tree-growth characteristics, but the best-fit R2 was much smaller than those obtained for the environmental factors. Moreover, a significant relationship between under-canopy radiation and tree growth parameters was only found in the LF and EF forest types. Tree height accounted for only 10-15% of the total variance in under-canopy radiation, while the other tree growth variables had even smaller R2 (less than 0.08 - Tab. 2b).
Horizontal cooling effect
As expected, the horizontal differences in air temperature (ΔT1) were associated with outside Tair, radiation, and humidity. The four different forest types showed a similar trend. Overall, the horizontal cooling differences were more strongly related with outside Tair (R2 = 0.47) and outside humidity (R2 = 0.33) rather than outside radiation (R2 = 0.12 - Tab. 3). Outside Tair explained 37-63% of the variance in horizontal cooling effect across different forest types, and RF stands showed the highest R2 (0.63). The air humidity was negatively correlated with horizontal cooling differences and the highest correlation was found for AF stands (R2 = 0.49 - Tab. 3).
Tab. 3 - The relationship between horizontal air temperature differences and environmental factors (a), as well as between the forest floor Tair and tree growth parameters (b) in different urban forest types. Non-significant relationships are not listed. (Ind. Var.): independent variable in the regression analysis.
| Ind. Var. | Forest types |
Regression equation | R2 | p-value | N |
|---|---|---|---|---|---|
| (a) Horizontal Tair differences (ΔT1) |
AF | = 0.109 + 0.082 × Outside radiation | 0.71 | <0.0001 | 108 |
| = -11.313 + 0.469 × Outside forest Tair | 0.51 | <0.0001 | 108 | ||
| = 12.301 -0.158 × Outside air humidity | 0.49 | <0.0001 | 108 | ||
| = 11.532 -0.13 × Forest floor humidity | 0.17 | <0.0001 | 108 | ||
| RF | = 0.684 + 0.047 × Outside radiation | 0.44 | <0.0001 | 112 | |
| = 1.653 + 0.342 × Under-canopy radiation | 0.11 | <0.0001 | 112 | ||
| = -11.712 + 0.48 × Outside forest Tair | 0.63 | <0.0001 | 112 | ||
| = - 4.401 + 0.273 × Forest floor Tair | 0.08 | <0.0001 | 112 | ||
| = 9.037 -0.103 × Outside air humidity | 0.28 | <0.0001 | 112 | ||
| = 12.079 -0.145 × Forest floor humidity | 0.34 | <0.0001 | 112 | ||
| LF | = 1.784 + 0.032 × Outside radiation | 0.15 | <0.0001 | 273 | |
| = - 8.02 + 0.36 × Outside forest Tair | 0.37 | <0.0001 | 273 | ||
| = 5.482 -0.042 × Outside air humidity | 0.04 | <0.0001 | 273 | ||
| = 6.661 -0.056 × Forest floor humidity | 0.04 | <0.0001 | 273 | ||
| EF | = 1.522 + 0.182 × Under-canopy radiation | 0.39 | <0.0001 | 144 | |
| = -11.302 + 0.447 × Outside forest Tair | 0.62 | <0.0001 | 144 | ||
| = - 5.237 + 0.294 × Forest floor Tair | 0.11 | <0.0001 | 144 | ||
| = 10.541 -0.125 × Outside air humidity | 0.29 | <0.0001 | 144 | ||
| = 10.351 -0.113 × Forest floor humidity | 0.2 | <0.0001 | 144 | ||
| All kinds |
= - 10.207 + 0.432 × Outside forest Tair | 0.47 | <0.0001 | 637 | |
| = -0.193 + 0.982 × ln (Outside radiation) | 0.12 | <0.0001 | 637 | ||
| = 10.304 -0.123 × Outside air humidity | 0.33 | <0.0001 | 637 | ||
| (b) Forest floor Tair |
LF | = 9.989 -0.45 × Tree height | 0.15 | <0.0001 | 273 |
| = 7.0157 -0.302 × Under-branch height | 0.03 | 0.0019 | 273 | ||
| = 7.074 -0.0448 × Canopy size | 0.05 | 0.0002 | 273 | ||
| EF | = 16.179 -0.599 × Tree height | 0.1 | <0.0001 | 144 | |
| = 12.711 -0.038 × DBH | 0.05 | 0.002 | 144 | ||
| = 12.647 -0.89 × Under-branch height | 0.06 | 0.0038 | 144 | ||
| = 12.787 -0.099 × Canopy size | 0.08 | 0.0008 | 144 |
The associations between tree growth variables and forest floor Tair were significant; however, they were much weaker than those between horizontal differences and outside environmental parameters. R2 values were usually less than 0.05 in all the relationships between tree-growth parameters and forest floor Tair (Tab. 3).
Vertical cooling effect
As compared with horizontal cooling effect, the vertical Tair differences (ΔT2) were less associated with environmental factors. Significant relationships between vertical cooling differences and environmental factors were only found in LF and EF types (R2 < 0.1). Under-canopy Tair of LF and EF stands showed a close association with tree height with R2 > 10%, which was much larger than that observed for the horizontal cooling effect. This shows that higher trees were associated with a significant vertical cooling effect (Tab. 4, Fig. S1a, Fig. S1b, Fig. S1c, Fig. S1d in Supplementary material).
Tab. 4 - The relationship between vertical differences and environmental factors, as well as between under-canopy Tair and tree growth parameters in four different forest types in urban forests. Non-significant relationships are not listed. (Ind. Var.): independent variable; (a) relations between vertical Tair differences (ΔT2) and environmental factors; (b) relations between under-canopy Tair and tree growth parameters.
| Ind. Var. | Forest types |
Regression equation | R2 | p-value | N |
|---|---|---|---|---|---|
| (a) ΔT2 |
LF | = - 0.113 - 0.114 × Under-canopy radiation | 0.05 | 0.0001 | 273 |
| EF | = 3.609 - 0.081 × Shade air humidity | 0.08 | 0.0007 | 144 | |
| (b) Under- canopy Tair |
LF | = 25.657 - 0.251 × Tree height | 0.12 | <0.0001 | 273 |
| = 24.173 - 0.221 × Under branch height | 0.05 | 0.0003 | 273 | ||
| = 24.93 - 0.028 × DBH perimeter | 0.08 | <0.0001 | 273 | ||
| = 24.908 - 0.546 × Log (canopy size) | 0.03 | 0.0044 | 273 | ||
| EF | = 25.418 - 0.163 × Tree height | 0.1 | 0.0001 | 144 | |
| = 24.661 - 0.34 × Under branch height | 0.09 | 0.0003 | 144 | ||
| = 27.03 - 0.808 × Log (DBH) | 0.09 | 0.0005 | 144 |
Soil cooling effect
The soil cooling effect (ΔT3) in all the four different types of urban forests was significantly correlated with air temperature and air humidity (p < 0.05 - Tab. 5). Forest floor Tsoil was correlated with outside forest radiation and air humidity (p < 0.05 - Tab. 5). However, the R2 was as small as 0.01 or less, showing that the relationship was much weaker than air cooling effects (horizontal and vertical cooling).
Tab. 5 - The relationship between soil cooling differences and environmental factors. Non-significant relationships are not listed. (Ind. Var.): independent variable; (a) relations between soil cooling differences and environmental factors (all forest types); (b) relations between forest floor Tsoil and environmental factors (all forest types).
| Ind. Var. |
Regression equation | R2 | p-value | N |
|---|---|---|---|---|
| (a) ΔT3 | = -1.96 + 66.417 × (outside forest Tair)-1 | 0.006 | 0.0038 | 637 |
| = 2.023 - 0.032 × Outside air humidity | 0.01 | 0.0002 | 637 | |
| (b) Forest Tsoil |
= 26.586 + 0.007 × Outside radiation | 0.01 | <0.0001 | 637 |
| = 30.722 - 0.059 × Forest floor humidity | 0.01 | <0.0001 | 637 |
Air humidifying effect
As expected, differences in ΔRH among the four types of urban forests were mainly associated with air humidity (inside and outside forest). Forest floor RH (relative humidity) was mainly associated with the outside forest RH, explaining 66% of the total variation in the data. A higher outside forest Tair is usually related to a lower RH under-canopy (R2 = 0.32 - Tab. 6).
Tab. 6 - The relationship between RH differences (ΔRH) and environmental factors, as well as between forest floor RH and both environmental factors and tree growth parameters. Non-significant relationships are not listed. (a) Relations between ΔRH and environmental factors (all forest types); (b) relations of forest floor RH with environmental factors and tree growth parameters (all forest types).
| Ind. Var. | Regression equation | R2 | p-value | N |
|---|---|---|---|---|
| (a) ΔRH | = - 10.971 + 0.515 × Outside forest Tair | 0.09 | <0.0001 | 637 |
| = - 5.8 + 0.393 × Forest floor Tair | 0.03 | <0.0001 | 637 | |
| = 27.22 - 0.382 × Outside air humidity | 0.42 | <0.0001 | 637 | |
| = 1.373 + 1.064 × Log (Outside radiation) | 0.02 | 0.0005 | 637 | |
| (b) forest floor RH |
= 102.108 - 1.247 × Outside forest Tair | 0.32 | <0.0001 | 637 |
| = 104.462 - 1.482 × Forest floor Tair | 0.24 | <0.0001 | 637 | |
| = 27.22 + 0.618 × Outside air humidity | 0.66 | <0.0001 | 637 | |
| = 63.699 - 0.015 × Outside radiation | 0.02 | 0.0012 | 637 | |
| = 76.778 - 0.501 × Outside soil temperature | 0.04 | <0.0001 | 637 | |
| = 65.591 - 0.326 × Tree height | 0.02 | 0.0003 | 637 | |
| = 64.855 - 0.036 × DBH | 0.02 | 0.0008 | 637 |
R2 differences between environmental and tree-growth predictors
Based on the R2 values obtained from regression analysis (Tab. 2 to Tab. 6), we compared the proportion of the total variance in microclimate effects explained by environmental factors and tree growth parameters (Fig. 2a and Fig. 2b, respectively). Shading effect (ΔE) was mainly associated with environmental factors, that explained 8-fold more variance than tree growth parameters. Likewise, ΔT1 (horizontal cooling effect) and ΔRH (humidifying effect) were also mainly associated with environmental variables. Contrastingly, ΔT2 (vertical cooling effect) was mainly associated with tree growth parameters, rather than environmental factors, as displayed in Fig. 2a.
Fig. 2 - Mean proportion of variance explained (R2) using environmental factors and tree growth parameters as predictors in regression analysis. (a) Predicted variables: horizontal (ΔT1), vertical (ΔT2), and soil cooling (ΔT3), shading effect (ΔE and shading %) and humidifying effect (ΔRH); (b) Predicted variables: radiation, RH, Tsoil, forest floor Tair and under-canopy Tair. Error bars represent the standard deviation.
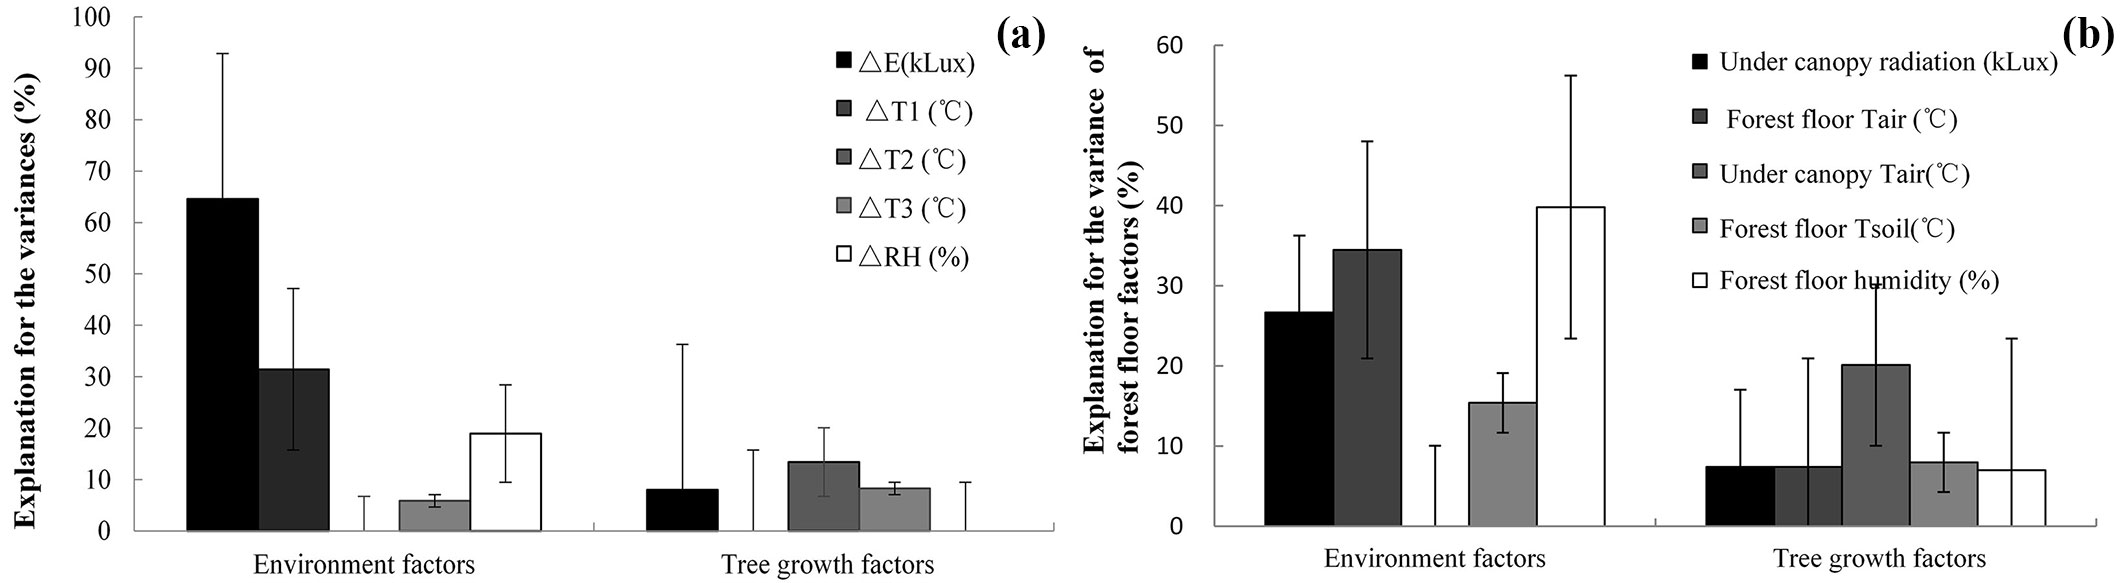
Environmental factors explained the largest amount of variation in floor microclimate parameters, except vertical cooling (ΔT3). Indeed, the fairly large variation explained by under-canopy Tair suggests that tree growth is important in regulating vertical cooling through the canopy (Fig. 2b). However, other microclimate effects had more close relations with outside forest environmental factors, compared to tree growth characteristics (Fig. 2a, Fig. 2b).
Redundancy analysis
Redundancy analysis revealed that tree growth variables and environmental factors accounted for 38.6% of the total variance in the microclimatic regulation effects. Radiation and RH outside forest explained the highest proportion (18.7% and 12.4%, respectively), while tree height and canopy size explained a lower proportion (1.5% and 0.7%, respectively - see Tab. S1a in Supplementary materials). However, all the measured variables showed significant loadings after multivariate analysis, except for DBH (Tab. S1a).
As expected, the shading effect (both ΔE and Shading%) was mostly related with the total amount of radiation, and the horizontal cooling (ΔT1) and the humidifying effect (ΔRH) with higher Tair and the lower Rhair. (Fig. 3a). Other microclimate effects were poorly explained by the measured variables, as indicated by the much shorter arrows displayed in the RDA biplot (Fig. 3a).
Fig. 3 - Redundancy analysis of the effect of environmental variables and tree growth parameters on microclimatic regulation functions. (a) Biplot of the measured variables vs. horizontal (ΔT1), vertical (ΔT2), and soil cooling (ΔT3), shading effects (ΔE and Shading%) and humidifying effect (ΔRH); (b) biplot of the measured variables vs. forest floor radiation, RH, Tsoil, Tair and under-canopy Tair.
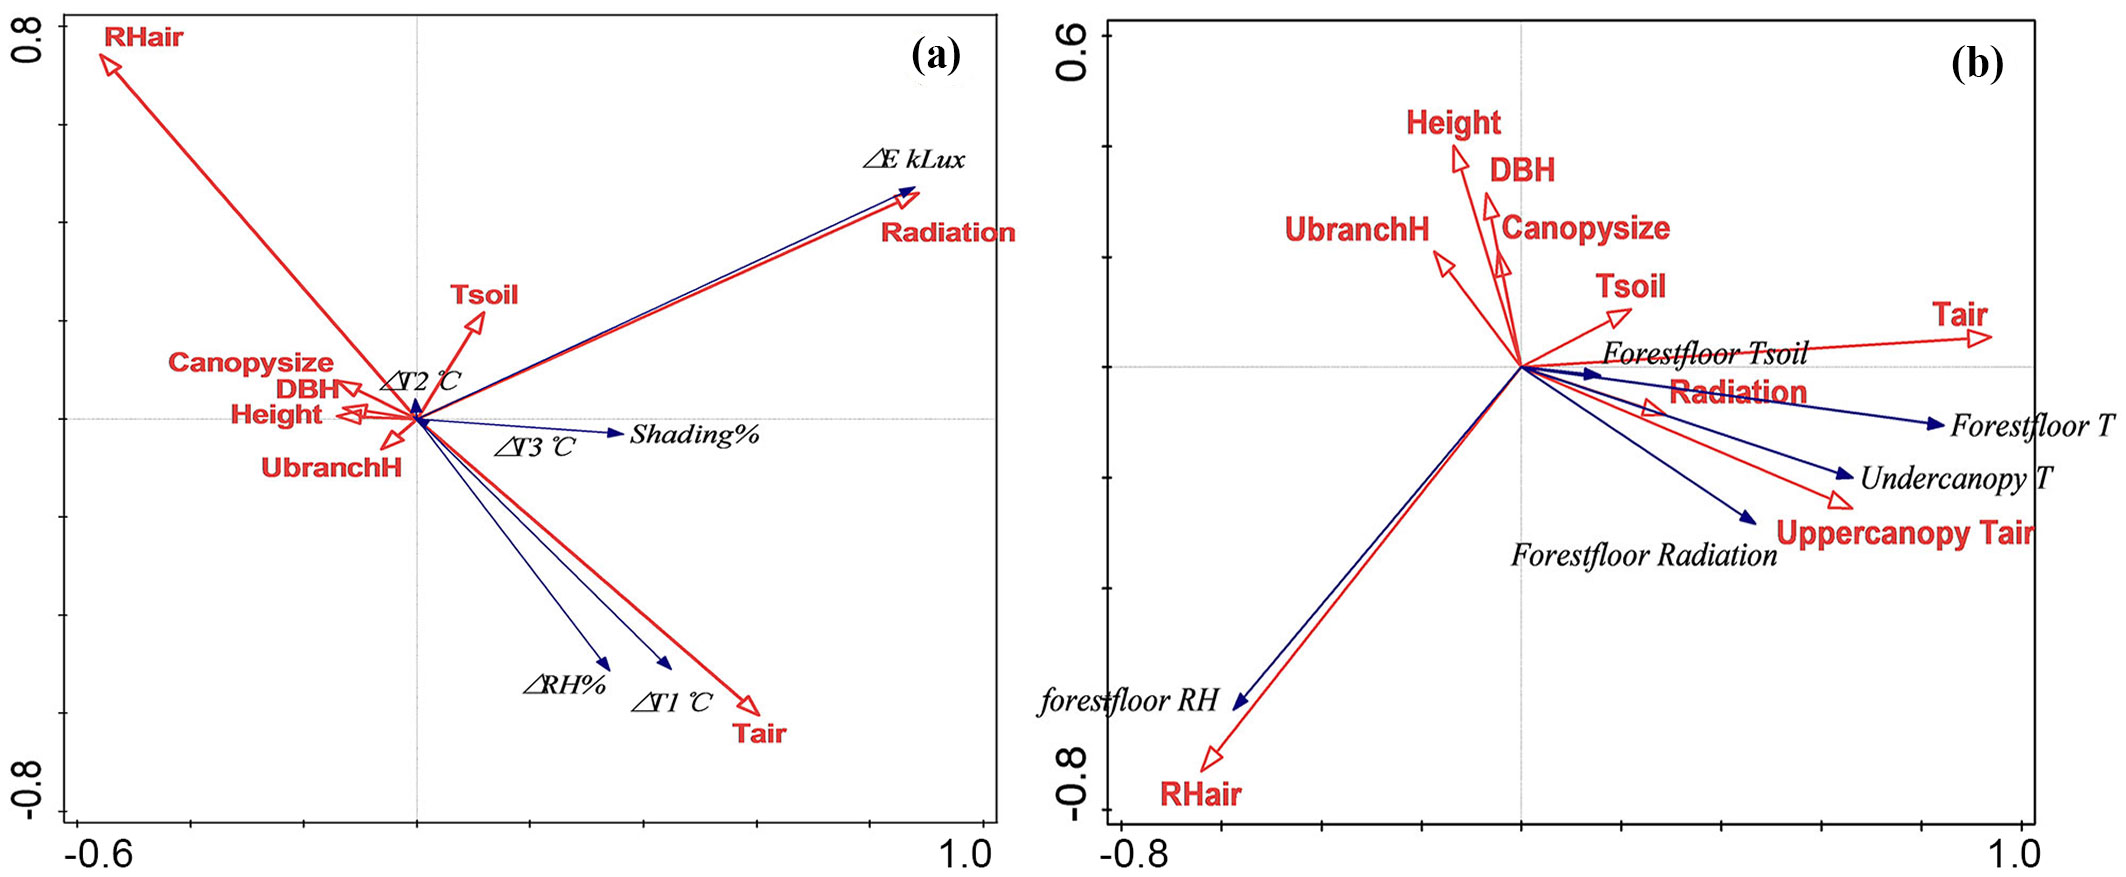
Forest floor microclimate was strongly associated with both outside forest climatic conditions and tree-growth variables (Fig. 3b). The overall variation explained was 57.4% (Tab. S2 in Supplementary material), being mostly due (6.7-30.7%) to outside forest climatic factors (Tair, RH, Tsoil and upper canopy Tair), and much less to tree characteristics (0.3-0.8%). The outside-forest environmental parameters were closely associated with the corresponding variables measured on the forest floor (Fig. 3b).
Discussion
Current studies on the ecological benefits of urban forests range from small-scale analysis of gardens or single trees ([29]), to remote-sensed, large-scale investigations of green spaces ([10]), to energy-balance modeling ([28]). In this study we carried out a field survey of different types of urban forests over an area of about 400 km2 in the urban region of Changchun (northeast China). Our results provide some useful hints that could contribute to a better understanding of urban forest functions.
In general, the four different types of urban forests investigated in this study showed different shading, cooling and humidifying effects. On average, the air temperature in the forest was reduced by about 3 °C in the horizontal direction as compared with the outside-forest environment, though no significant differences were found among the four forest types. Contrastingly, AF and LF types showed a higher humidifying effect than RF and EF stands (6-7% vs. 3-4%). This is particularly important in semi-dry and semi-moist climate regions like Changchun, where people usually suffer from dry air periods. Panno et al. ([30]) found that people visiting urban green areas experienced a greater well-being and lower stress associated with higher air temperature.
Wong & Yu ([40]) reported that urban forests could reduce the temperature up to 4.01 °C compared to the central business district. Spatial and temporal analysis of urban temperatures has revealed that vegetation-rich areas have lower temperatures ([1], [3]) and the cooling effect was different among different land uses ([12]). Georgi & Zafiriadis ([9]) found that maximum cooling and humidifying effects of urban parks were about 24% and 41%, respectively. Arx et al. ([4]) demonstrated that maximum daily temperature was lower up to 5.1 °C (mean: 1.8 °C) and minimum daily humidity was higher up to 12.4% (mean: 5.1%) in 14 urban forest stands in Switzerland.
Our results on the horizontal cooling effect and humidifying effect of urban forests in semi-arid regions are consistent with those reported in similar studies, and further confirm the importance of urban afforestation for local microclimate regulation. Moreover, our findings support the evidence that forest stands in different urban locations differ in their microclimate regulation efficiency, regardless of their composition and structure.
Several studies on ecosystem services assessment of urban forests have applied complex models (e.g., I-Tree) including environmental, tree-growth, and social variables ([36], [27]). In this paper, we successfully applied simple regression analysis to evaluate the microclimatic regulation functions of urban forest stands. For example, we found that shading effect was closely related with outside forest radiation, and different forest types showed quite similar relationships. Using data of solar radiation from local meteorological stations and remote sensing technology to map urban forest coverage, the overall shading effect of urban forest stands in a specific area could be estimated with high accuracy ([34]), regardless of the forest type. However, for some other functions (e.g., cooling and humidifying effect), forest type-related differences should be carefully considered.
Shading, cooling and humidifying effects of urban forests are usually stronger in sunny days with hig Tair, and lower air humidity. Our results strongly support this conclusion. Jim ([18]) argued that plants play a greater role in cooling when solar radiation is higher. Alexandri & Jones ([2]) found that the cooling effect of urban green spaces was remarkable in dry and hot weather. Wang et al. ([37]) reported that the cooling effect of trees in clear and hot days was twice as higher than in cloudy and cold days. Zhang et al. ([47]) demonstrated that canopy density, canopy area, tree height and solar radiation had a significant influence on temperature reduction and relative humidity increase.
Our findings strongly support previous results from similar studies on microclimate regulation of urban forests. Additionally, we also investigated the vertical air cooling and soil cooling effects, which were rarely analyzed in previous studies. Regression analysis revealed that vertical cooling, soil cooling and humidifying effect had a weak correlation with outside-forest climatic parameters and tree growth characteristics (R2 was often less than 0.5). This is important as rapid urbanization in China has resulted in a high utilization of sky spaces with taller buildings, and in a dramatic reduction of bare soil areas for plant survival. Li et al. ([20]) reported that the vertical cooling effect of green plant canopy in residential areas was significant above 1.5 m. Moreover, vertical greening vines or roof greening to enhance cooling and humidifying effects along the vertical profile have also been suggested ([2], [31], [18]). In this study, using infra-red temperature monitoring techniques, we found that canopy temperature was lower compared with under-canopy. More attention should be paid to both air cooling effect (horizontal and vertical) of trees and the cooling effect of bare soil, aiming to improve the microclimate regulation functions of urban forests.
Surprisingly, we found a weak association between under-canopy radiation and shading effect in all the forest types considered (Tab. 2). Previous studies have shown the importance of forest scale and structure on microclimate regulation functions of urban forests ([47]). The environmental benefits provided by urban trees has been assessed analyzing tree dendrometric variables (stem diameter, height, and crown width) at different ages ([29]). In this paper, the negative correlation between tree size and microclimatic effects (horizontal cooling, shading and humidifying effects) confirmed that a larger tree size is usually associated with lower light intensity and temperature under the tree canopy. Our study also suggested that trees along the roadside (RF), in universities and schools (AF), in gardens and parks (LF) and along farmland or riverbanks (EF) have different microclimate regulation efficiency, regardless of the forest structure and composition. These location-dependent functional differences should be carefully considered in the management and planning of urban forests.
Trees can intercept solar radiation and reduce air temperature through transpiration, thereby absorbing large amounts of heat from the environment and regulating atmospheric humidity ([24]). Urban forests management and planning should take the landscape structure into account to provide maximum ecological benefits. Based on our results, the following recommendations were formulated to improve the urban forest ecosystem services in Changchun city.
Firstly, to protect larger trees in the city and increase their frequency. At present, Changchun has a fairly low percentage of high trees (<10% of total measured trees); based on our field survey, 54% of trees ranged from 3 to 9 m in height, while only 8% are in the range 15-23 m. As for tree circumference, 35% trees ranged from 25 to 50 cm, while larger trees (100-230 cm) were only 10%. Under-branch height was 1-3 m for 54% of the sampled trees, and >6 m for only 6% of trees. Canopy projection area was <20 m2 in 63% of the trees, >50 m2 in only 9%. Our results clearly showed that larger trees (higher tree height and under-branch height, larger canopy projection area) can significantly enhance shading, cooling and humidifying effects under-canopy. Moreover, temperature and humidity in forests have proven to be closely related to tree cover and canopy density ([11], [50]). Zhang et al. ([47]) revealed the canopy density, crown size, tree height and radiation significantly influence cooling and humidifying effects. Tall tree species had stronger ability to regulate air temperature ([6]). These studies demonstrated the importance of tree structural characteristics rather than environmental factors in microclimate regulation, as well as air purification ([46], [49]). Furthermore, the conservation of old-growth trees in urban areas, besides their cultural and recreational value, may partly balance the loss of the original vegetation due to the rapid urbanization currently occurring in Chinese cities.
Secondly, urban forest management and planning should take into account the differences found among forest types. In this study, AF stands showed better microclimate regulation functions than the other forest types considered. AF stands usually grow close to universities, schools, institutes and government agencies, where intensive management is carried out in terms of watering, fertilizing, and tending. Similar activities, along with rational pruning and the choice of diverse species for afforestation purposes, should be extended also to other urban forest types in other locations to maximize their ecological benefits ([33]).
Acknowledgements
This study was financially supported by the National Science Foundation of China (41730641.3167069), Key projects from CAS (Y3H1051001, KFZD-SW-302), basic research funds for national universities from the Ministry of Education of China (2572017DG 04, 2572017EA03).
References
Gscholar
Gscholar
Gscholar
Gscholar
Authors’ Info
Authors’ Affiliation
Hongyuan Wang
Lu Xiao
Wei Zhou
Key Laboratory of Forest Plant Ecology, Ministry of Education, Northeast Forestry University, Harbin 150040 (China)
Hongyuan Wang
Lu Xiao
Xingyuan He
Wei Zhou
Qiong Wang
Chenhui Wei
Northeast Institute of Geography and Agricultural Ecology, Chinese Academy of Sciences, Changchun 130102 (China)
Corresponding author
Paper Info
Citation
Wang W, Wang H, Xiao L, He X, Zhou W, Wang Q, Wei C (2018). Microclimate regulating functions of urban forests in Changchun City (north-east China) and their associations with different factors. iForest 11: 140-147. - doi: 10.3832/ifor2466-010
Academic Editor
Raffaele Lafortezza
Paper history
Received: Apr 20, 2017
Accepted: Nov 21, 2017
First online: Feb 07, 2018
Publication Date: Feb 28, 2018
Publication Time: 2.60 months
Copyright Information
© SISEF - The Italian Society of Silviculture and Forest Ecology 2018
Open Access
This article is distributed under the terms of the Creative Commons Attribution-Non Commercial 4.0 International (https://creativecommons.org/licenses/by-nc/4.0/), which permits unrestricted use, distribution, and reproduction in any medium, provided you give appropriate credit to the original author(s) and the source, provide a link to the Creative Commons license, and indicate if changes were made.

Web Metrics
Breakdown by View Type
Article Usage
Total Article Views: 53516
(from publication date up to now)
Breakdown by View Type
HTML Page Views: 43664
Abstract Page Views: 4475
PDF Downloads: 4180
Citation/Reference Downloads: 56
XML Downloads: 1141
Web Metrics
Days since publication: 3048
Overall contacts: 53516
Avg. contacts per week: 122.90
Article Citations
Article citations are based on data periodically collected from the Clarivate Web of Science web site
(last update: Mar 2025)
Total number of cites (since 2018): 22
Average cites per year: 2.75
Publication Metrics
by Dimensions ©
Articles citing this article
List of the papers citing this article based on CrossRef Cited-by.
Related Contents
iForest Similar Articles
Research Articles
LIFE-CLIVUT, ecosystem benefits of urban green areas: a pilot case study in Perugia (Italy)
vol. 15, pp. 133-140 (online: 09 April 2022)
Research Articles
The concept of green infrastructure and urban landscape planning: a challenge for urban forestry planning in Belgrade, Serbia
vol. 11, pp. 491-498 (online: 18 July 2018)
Research Articles
Green oriented urban development for urban ecosystem services provision in a medium sized city in southern Italy
vol. 7, pp. 385-395 (online: 19 May 2014)
Review Papers
Green Infrastructure as a tool to support spatial planning in European urban regions
vol. 6, pp. 102-108 (online: 05 March 2013)
Technical Reports
Assessment of allergenic potential in urban forests: a case study of the Royal Park of Portici in Southern Italy
vol. 13, pp. 376-381 (online: 25 August 2020)
Research Articles
Evaluation of urban forest spatial distribution characteristics in Guangdong - Hong Kong - Macao Greater Bay Area
vol. 16, pp. 136-143 (online: 16 May 2023)
Research Articles
Forest and tourism: economic evaluation and management features under sustainable multifunctionality
vol. 2, pp. 192-197 (online: 15 October 2009)
Research Articles
Indicators for the assessment and certification of cork oak management sustainability in Italy
vol. 11, pp. 668-674 (online: 04 October 2018)
Research Articles
Photosynthetic parameters of urban greening trees growing on paved land
vol. 12, pp. 403-410 (online: 13 August 2019)
Research Articles
The nurse-plant effect under the dislodgement stress of landslides
vol. 16, pp. 78-85 (online: 16 March 2023)
iForest Database Search
Search By Author
Search By Keyword
Google Scholar Search
Citing Articles
Search By Author
Search By Keywords
PubMed Search
Search By Author
Search By Keyword


