Green oriented urban development for urban ecosystem services provision in a medium sized city in southern Italy
iForest - Biogeosciences and Forestry, Volume 7, Issue 6, Pages 385-395 (2014)
doi: https://doi.org/10.3832/ifor1171-007
Published: May 19, 2014 - Copyright © 2014 SISEF
Research Articles
Collection/Special Issue: RegioResources21
Spatial information and participation of socio-ecological systems: experiences, tools and lessons learned for land-use planning
Guest Editors: Daniele La Rosa, Carsten Lorz, Hannes Jochen König, Christine Fürst
Abstract
In southern Italy many cities are characterized by a lack of public urban greenspaces. Non-urbanized areas in these cities are suffering from surrounding urbanization pressures. These areas still provide important ecosystem services even if they are limited in size, highly fragmented and often neglected by local planning. New planning strategies are needed in order to protect and enhance the provision of ecosystem services delivered by existing Non-Urbanized areas, but municipalities usually have limited funds for acquiring public green areas via land expropriations. At the same time, requests for new urban development are still considerable. Consequently, it is not realistic to propose strategies for green areas that do not include new developments. The paper illustrates a strategy for a Green Oriented Urban Development (GOUD) that has been applied for the Master Plan of Catania, a medium sized city in Sicily (southern Italy). The strategy includes a limited amount of developments as well as new greenspaces in selected areas (Resource Zones), through the transfer of property and development rights between the municipality and developers. The strategy will allow to enhance the provision of ecosystem services, especially cultural services (thanks to a dramatic increase of accessibility to new greenspaces), regulating services (through climate regulation by new green land covers) and provisioning services such as urban agricultural products. Results show that it is possible to improve urban ecosystem services creating a more liveable and healthy urban environment at reduced cost for the municipal administrations.
Keywords
Introduction
The ecosystem service concept is frequently discussed with regard to air, land and water resources in rural and natural landscapes ([36]). The impact of cities on the environment has been considered more and more in recent years. The first studies on Urban Ecosystem Services (UES) date back to the mid-1990s ([9]) but they had spread worldwide by the end of the last century ([4]). According to a recent review by Hubacek & Kronenberg ([20]), different perspectives on the value of UES have been pointed out during the last decade, including economic, socio-ecological, psychological, cultural and spiritual perspectives.
UES include, among others, purification of air and water, mitigation of floods and droughts, detoxification and decomposition of waste, generation and renewal of soil fertility, regulation of climate, moderation of temperature extremes, provision of aesthetic beauty and intellectual stimulation ([4], [17]). The relationship between ecosystems and urban settlements is complex and multifaceted. In urban contexts, the diversity of land-covers results in heterogeneous typologies of Non-Urbanised Areas (NUAs - [29]). These areas are outdoor places with significant amounts of vegetation, mainly semi-natural areas that, especially in urban contexts, represent the last remnants of nature. They are often part of the agriculture and green infrastructure that produce ecosystem services ([26]) and can have different physical features, ecological and social functions. They feature a variety of urban ecosystems, depending on geographical regions where they are located. NUAs include urban forests, lawns and parks, cultivated land, abandoned farmlands, grasslands, historic gardens, wetlands, bodies of water, playgrounds, informal green areas, dumps and abandoned backyards. NUAs can contain a significant amount of vegetation, playing a fundamental role in maintaining urban biodiversity. They are often the main providers of UES, contributing to the economic, socio-ecological, psychological, cultural, and spiritual welfare of the community ([20], [29], [27]).
NUAs represent an opportunity for implementing sound planning policies aimed at increasing urban greenery and introducing agriculture in cities ([26], [27]). Land-use plans have to foster the enhancement of UES provision. This is a key issue, especially in densely built metropolitan areas, where these services are fundamental for the citizen well being. NUAs protection, obtained via land-use planning, can bring considerable environmental, social, economic and cultural benefits deriving from the constitution of a green infrastructure.
Effective planning strategies are needed in order to protect and enhance the provision of UES delivered by existing NUAs, but municipalities have limited funds for acquiring areas to establish new parks or greenspaces. At the same time, requests by the real estate market for new urban development in vacant lots of NUAs are still considerable. Consequently, it is not realistic to propose strategies for green areas that do not include new developments. The challenge is to devise feasible market-based planning tools able to protect existing NUAs and the related UES provision.
This paper discusses the experience of a Master Plan of a medium-size city aimed at enhancing the overall provision of UES. It presents a planning strategy, Green Oriented Urban Development (GOUD), that has been purposely developed and applied in the new Master Plan of Catania (Sicily, southern Italy). This strategy is aimed at improving the city’s network of greenspaces, through the transfer of properties and development rights. Landowners and developers will exchange a right to build on concentrated portions of property with the obligation to transfer to the municipality the remaining area, zoned for public use. This will increase the overall provision of public greenspaces and related ecosystem services at reduced costs for the municipality, and at the same time will protect the existing NUAs in the city. The novelty of the strategy lies in the attempt to link the protection of farmlands and other open spaces with the planning of a sustainable urban development. Moreover, the strategy is particularly relevant in the urban context under consideration, where planning has often not included sufficient provision of public greenspaces.
The paper is structured as follows. Firstly the study area is described and the strategy of Green Oriented Urban Development is presented. The application of the strategy, presenting the proposed GOUD is then discussed in details. Results of the strategy are shown. Finally, discussions on obtained results and involved UES are given.
The study area
Catania is the focus of a settlement system that stretches almost continuously along the eastern coast of Sicily (Fig. 1). The main city has 293 458 inhabitants, according to the last national census (2011). It is the tenth largest in Italy and the fourth largest in the southern regions. The municipality is the center of a conurbation forming the largest metropolitan area in Sicily, characterized by an extensive urban sprawl. The entire settlement is suffering from major problems, especially traffic congestion due to an inadequate road network and lack of an efficient transit system ([26]).
Fig. 1 - The municipality of Catania (Italy).
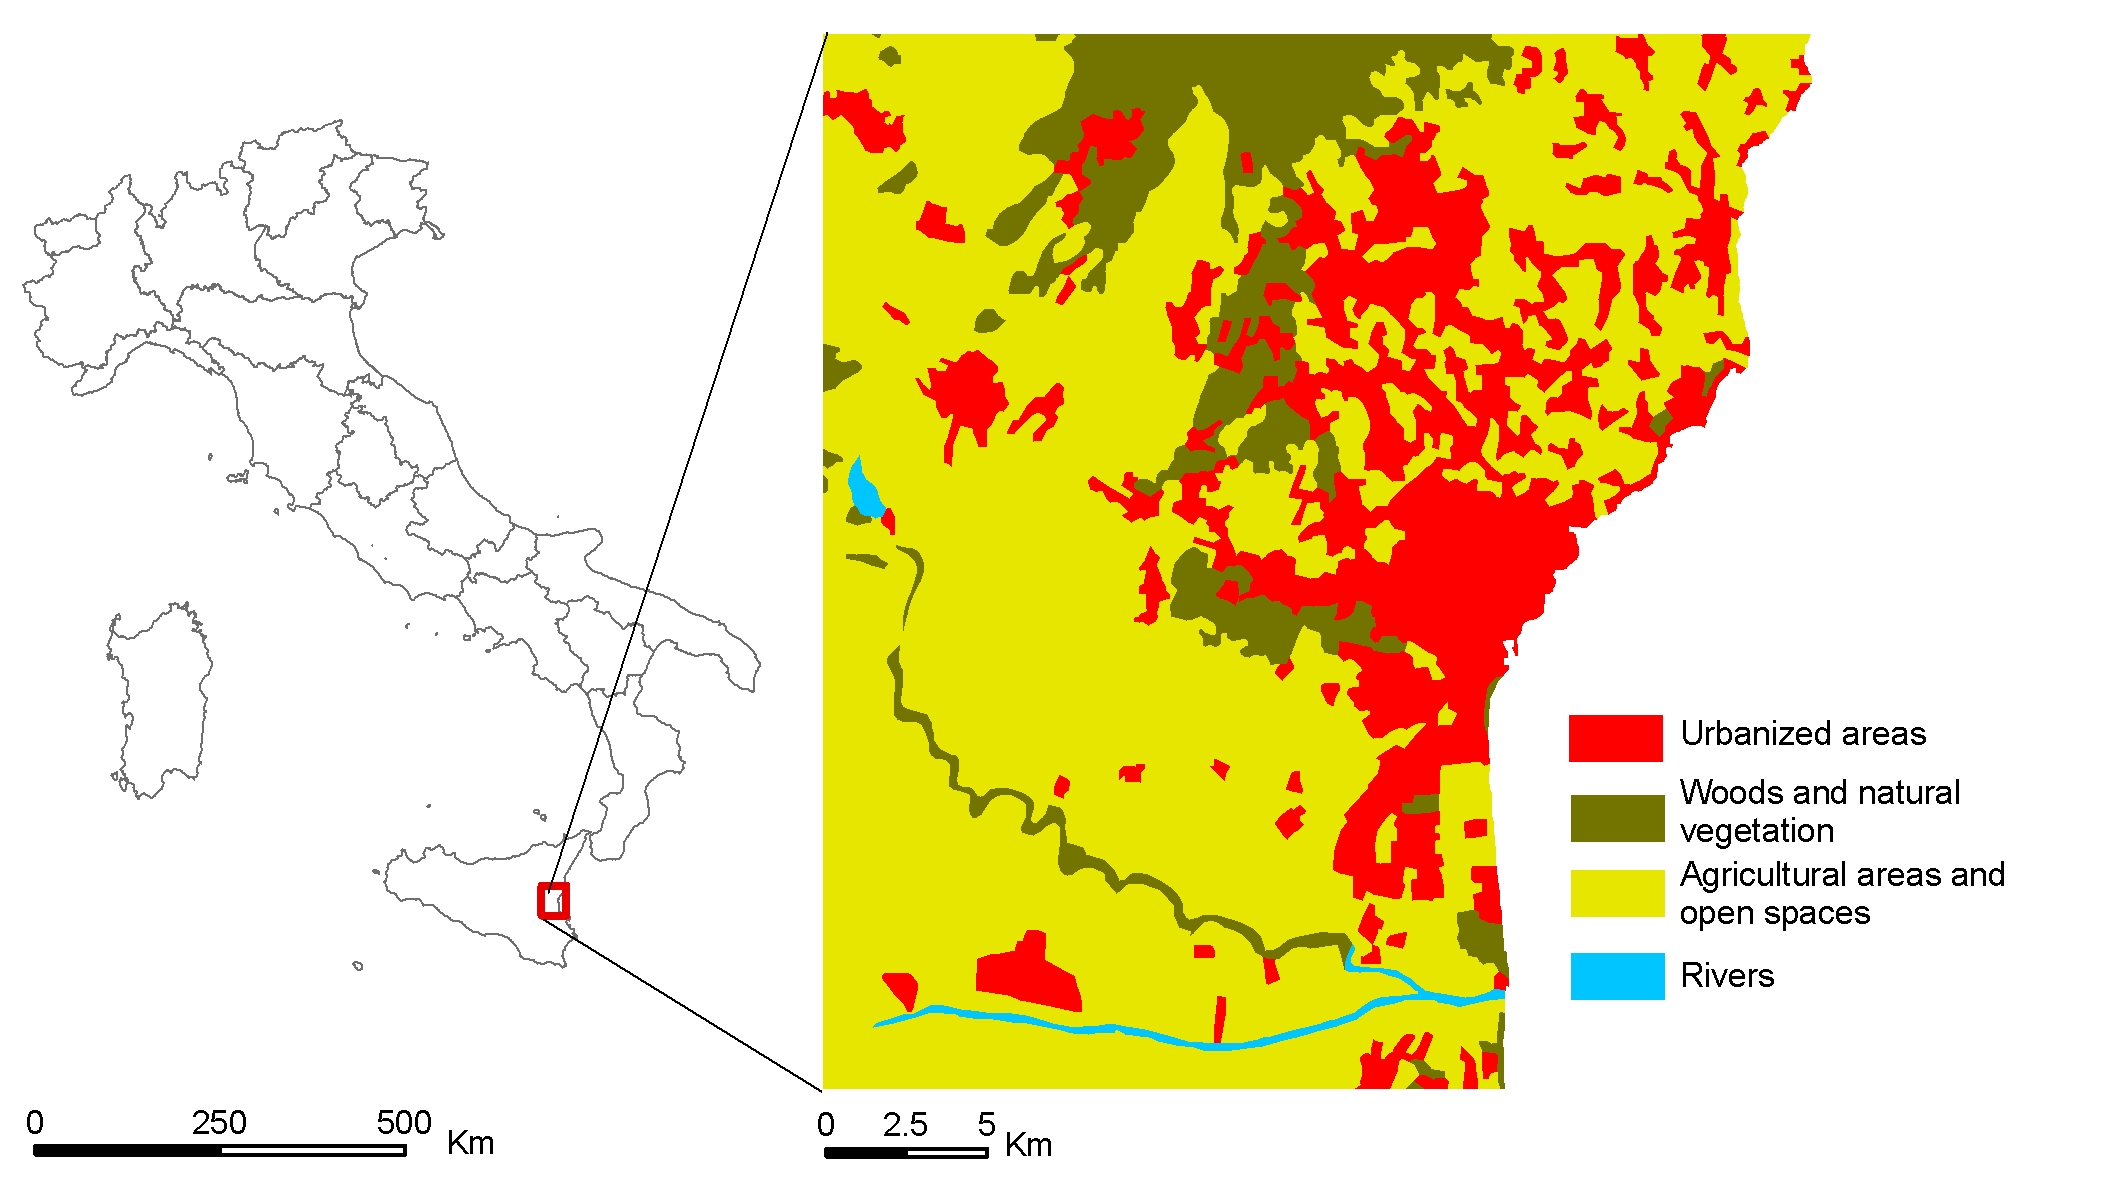
In the last 40 years, the settlement has expanded beyond the main administrative borders of the city, incorporating existing agricultural and fishing villages into one large metropolitan area. This phenomenon began in the late 1960s and has continued until the first decade of 21st century. This frantic building activity wiped out agricultural and natural areas ([26]). The overall result is a rather heterogeneous aggregate of settlements, both within the main city and the surrounding municipalities.
Today, the main city is still characterized by a shortage of public spaces and services, especially greenspaces. Currently, the public greenspaces are about 2.2 m2 per capita, much less than the minimum amount stated by the national legislation (9 m2). In addition, this reduced amount of green areas is unevenly distributed among the city districts (Tab. 1). In central areas, built since the end of 18th century up to 1960s, the amount of greenspaces is negligible. In the rest of the city it varies considerably, being the values per capita heavily influenced by few existing public parks, especially in districts no. 4, 6 and 10.
Tab. 1 - Distribution of existing greenspaces in municipal districts.
| District Name |
Urban fabric features |
Inhabitants | Green areas per capita (m2) |
|---|---|---|---|
| 1. Centro | 18th 19th century central historical district |
48334 | 1.58 |
| 2. Picanello Ognina | 20th north-east district | 46966 | 0.62 |
| 3. Borgo Tribunale | Built in late 19th-20th century north of historic centre |
44205 | 0.54 |
| 4. Barriera Canalicchio | Medium low density district, built mainly after wwII | 19921 | 4.56 |
| 5. S. G Galermo | Rural village surrounded by a large social housing scheme built in the 1970s | 13767 | 0.00 |
| 6. Cibali Trappeto | Historical garden city and late 1970s social housing |
24064 | 4.42 |
| 7. Monte Po - Nesima | Late 1960 social housing | 10905 | 10.07 |
| 8. Nesima | Different 1950-60s social housing scheme | 32106 | 1.76 |
| 9. Librino | The largest social housing scheme built in the late 1970s | 36286 | 0.79 |
| 10. Zia Lisa Plaja | Social hosing and holiday houses near the seashore | 16904 | 21.67 |
| Total | 293458 | 2.22 | |
In addition, the existing public gardens are mainly characterized by a design and localization inspired to formal academic principles of urban design. Accordingly, they are mainly located in the middle of urban squares, completely surrounded by streets. The few recent ones are often conceived as isolated plots surrounded by densely built-up areas or as street setbacks. The result is a highly fragmented distribution of greenspaces where each green patch is segregated from the others.
The new Master Plan of Catania
At the end of 2009, the municipality of Catania boosted the procedure for designing and approving a new Master Plan, based on the idea of achieving a more sustainable future for the city. The debate about the new Master Plan was initially centered on the burning issue of rising funds for expropriating areas for public uses, (parks, parkings, and other facilities). In 1998, the City Council approved the Master Plan Guidelines, establishing that the provision of public land has to be based on Transfer of Developments Rights (TDR) concept (see below).
The new Master Plan aims to enhance the overall environmental quality and to reduce the high level of congestion of the transport system. Particularly, it takes into account the extensive debate about the complex relationships among sustainability, urban form and transport choices. The nexus between transport and urban form has been summarized by Kenworthy ([23]) in ten principles. The ones that have been considered as the main foci of the plan proposal were:
- the design of compact, mixed-use urban form that uses land efficiently;
- the key role for the greenspaces as nodes of a green infrastructure and components of climate change adaptation;
- the increased role of transit, walking and cycling infrastructure, with a special emphasis on railways, instead of road infrastructure;
- a key role for sub-centers within the city that will emphasize modes of transport other than automobile.
The synthesis of the proposed planning strategy is to enhance the number of public greenspaces and their connection with a green infrastructure ([52], [2], [45], [32]). The continuity of existing and new, planned greenspaces can play a crucial role for managing the city problems mentioned above: they can be considered as an integrated and effective way of providing several ecosystem services, including climate regulation, biodiversity protection, spaces for cultural enrichment and new forms of agriculture ([1], [15]). Public greenspaces represent evapotranspiring and permeable areas contributing to the reduction of urban heat island and absorbing excessive storm waters ([6], [19]). They are also safe areas to shelter people after rescue from an earthquake, alternative connectors for pedestrians and cyclists who can move safely and comfortably along tree-shaded routes, a condition that is particularly valuable in hot south-Mediterranean climates ([1]).
The next section present the adopted planning strategy for the new municipal Master Plan, based on a Green Oriented Urban Development (GOUD), that aims at providing new, publicly accessible, greenspaces by allowing a limited amount of development. The Master Plan assigns the status of public greenspaces to a high number of NUAs, located mainly within the dense urban fabric. The municipality will obtain the ownership of these areas by using a transfer of development rights (TDR) programme, as explained in the next sections.
Method
Transfer of development rights (TDR)
Public acquisition of land has most often been carried out by public policy instruments for the primary purpose of protecting open space ([3]). In and around urban areas, land acquisition has almost exclusively served multiple goals, including the shaping of metropolitan form and the management of urban growth ([44]). Acquisition is the most powerful public policy instrument but it is also the most expensive for local governments ([22]) In addition, it causes resistance from private landowners. Traditional regulatory approaches such as subdivision exaction, cluster zoning, downzoning or large-lot zoning have also been used for managing urban growth and protecting open space. These kinds of policy instrument, generally, create a reduction in property values for which landowners are not compensated ([14]).
On the contrary, the issue of economic feasibility for managing urban growth and providing accessible public greenspaces could be addressed through incentive-based approaches. A large number of incentive- based policies have been developed and implemented in recent decades, such as development of impact fees, infill and redevelopment incentives, right-to-farm laws and agricultural districts ([3]). Several approaches have been developed to protect open spaces through acquisition of development rights severed from land that is near urban areas and threatened by development. These approaches include the Transfer of Development Rights (TDR) and the purchase of development rights or conservation easements. They are based on the idea that ownership of land involves a bundle of rights - such as mineral rights, surface rights, air rights, development rights, etc. - that can be separated ([53]). TDR allows the sale and transfer of development rights from a specific parcel of land to other properties. Future use of the original parcel is then protected from development by a permanent conservation easement or deed restriction prohibiting development. A TDR programme defines an area to be protected from development (sending area) and one where development will be allowed to occur (receiving area). Landowners can transfer the rights to develop one parcel of land to another one. As a consequence, the parcel from which the development rights are being transferred can no longer be developed, or developed only in a limited way ([7]). As a result, landowners are compensated for regulatory restrictions that reduce the property values ([41]).
TDR programmes allow more development than the one that might otherwise occur in the receiving site. The acquisition of the development rights is funded not by grants or taxes but by the developers of the receiving sites who acquire greater development potential, and therefore potential profit, by voluntarily using the TDR option. The sending sites are the areas that a community or municipal administration have identified as worthy of permanent preservation, and the receiving sites are the areas that are capable of accommodating additional development ([21]). TDR offers a planning policy that essentially redirects development rather than simply preventing it and thus recognizes that there are areas where development must be allowed and even encouraged ([38]).
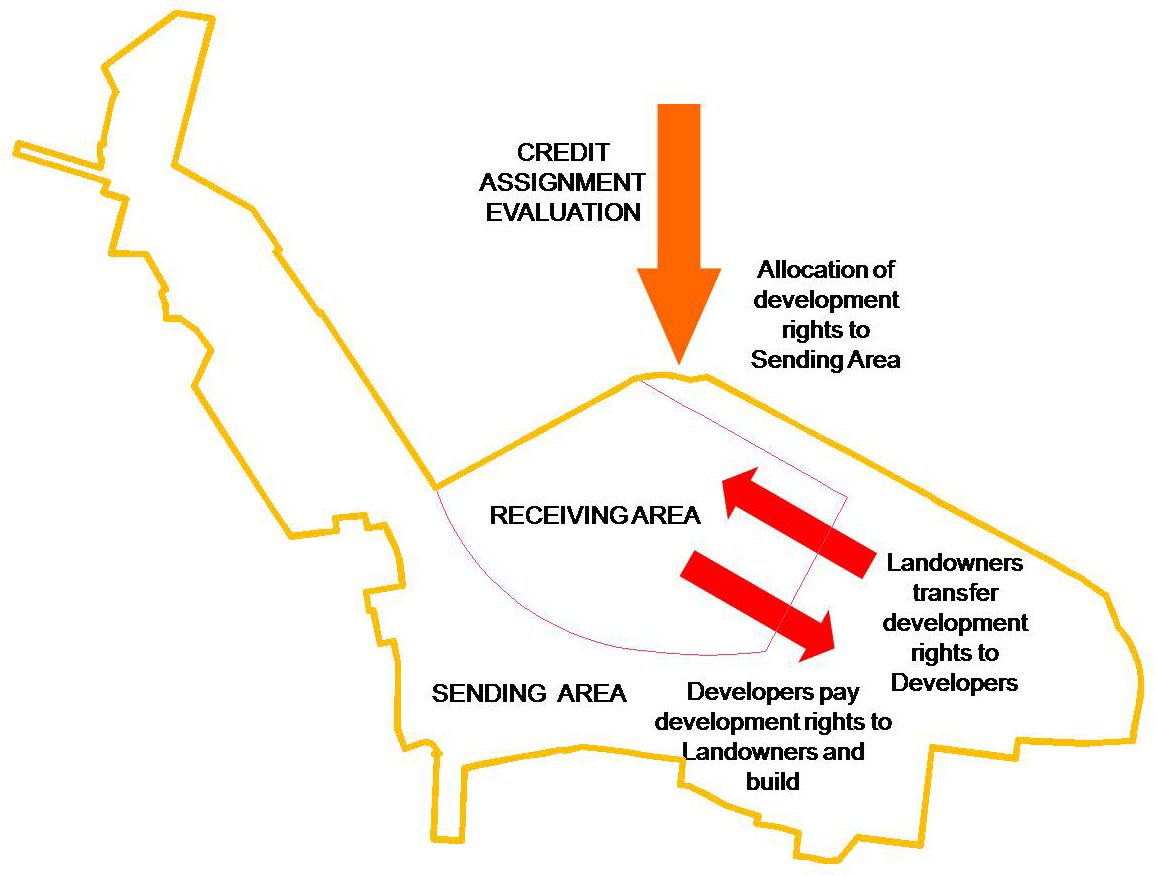
A TDR programme assigns development credits (rights to develop) to selected land parcels (sending zones) as a way to compensate the landowner for the acquisition of their land to public use. Development credits will be allocated to a receiving area that is a portion of the sending one. An example of a scheme of a TDR programme is reported in Fig. 2.
Fig. 2 - The Transfer of Development Right scheme.
Green Oriented Urban Development (GOUD)
The GOUD strategy is based on the acquisition by the municipality, at reduced costs, of areas zoned for publicly accessible greenspaces. This will happen within selected NUAs, zoned by the previous Master Plan as roads, public services and generic greenspaces. These are called in the proposed plan Resource Zones (RZ). RZ are large patches of NUAs included in the urban fabric and have been identified according to the following main criteria:
- their current land-use is abandoned farmland, shrubs or seasonal herbaceous vegetation;
- they are mainly non-built areas with high proximity to other residential areas or public transport nodes;
- within each RZ, the ownership of land must be mainly private;
- they have an appropriate location and shape for defining the city green infrastructure and enhancing the endowment of other key public services.
In the case of the Master Plan of Catania, the development credits are expressed using the Floor Area Ratio (FAR) parameter. This parameter is the ratio between the total covered area of all floors in the buildings on a plot and the area of the plot. It is applied to the entire sending zone and represents the capacity of this zone to generate urban development. A credit assignment evaluation process, conducted by a pool of experts, defined the spatial allocation of development credits within the municipality. The evaluation took into account current land uses, market values, accessibility, services endowment, presence of designated areas (environmental or historical value), microclimate and pollution conditions ([47]). The evaluation was carried out for each RZ and provided a value of development credits (FAR) for it.
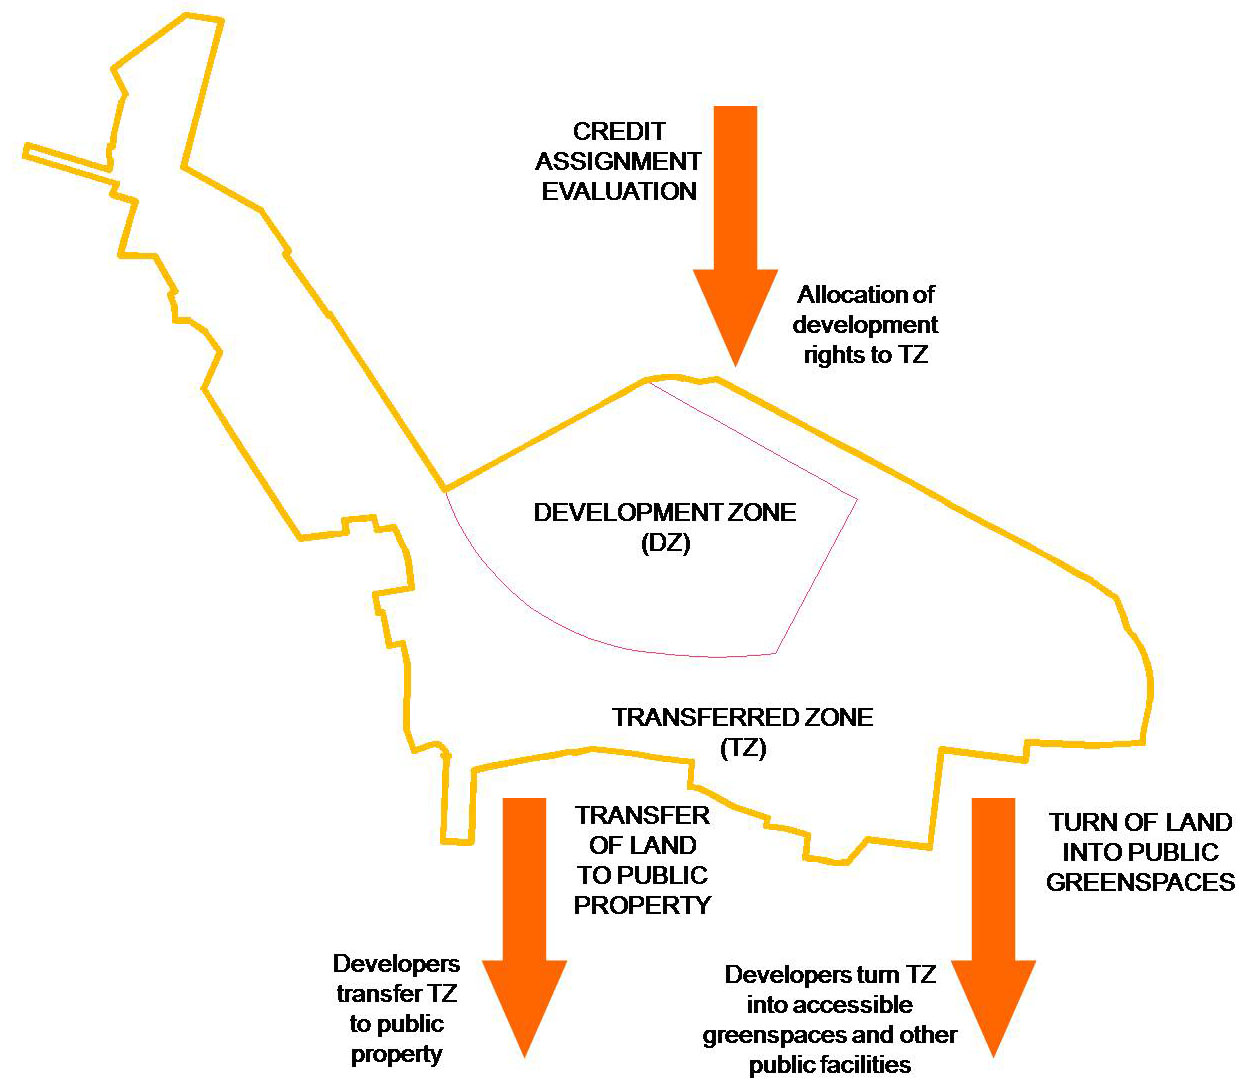
In RZs, landowners have the right to develop housing, retail and offices in designated portions called development zones. It will be possible to concentrate the credits generated by the entire RZ, which represents the sending area of the general TDR scheme, only in the development zones. In return, developers will transfer the ownership of the remaining part, called the transferred zone, to the municipality (Fig. 3). Transferred zones are designated mainly for public greenspaces, but include other public facilities (schools, roads, parking lots). The sum of the development zones and transferred zones areas is always equal to the area of the entire RZ.
Fig. 3 - The structure of a Resource Zone (RZ): Development Zones (DZ) and Transferred Zones (TZs).
Within each RZ, development and transferred zones have been designed according to the following criteria:
- a high percentage (> 60%) of TZ must be ensured in each RZ;
- within development zones, an appropriate level of permeability (30%) has to be maintained;
- new greenspaces in transferred zones must have a minimum percentage of tree cover (25%) in order to compensate for the negative effects of development allowed;
- the proposed green spaces’ layout is mainly linear and connected: they always include cycling and pedestrian lanes to enhance a sustainable use of urban spaces;
- each RZ is characterized by mixed uses (residential, trading, services, offices);
- development zones are located mainly along existing and newly designed roads in order to maintain the prevailing character of the city urban fabric.
The amount of developable area assigned to each development zone also takes into account the limited quantity of existing buildings: a TDR programme provides that existing buildings can be demolished to obtain an increase in developable floor area up to 100% in the zone where they were located. Accordingly, the Developable Floor Area (DFA) for new urban development is defined in each RZ by the following formula (eqn. 1):
DFA1 represents the amount of the area that can be developed according to the development credits in the entire RZ. It is expressed by (eqn. 2):
where FAR is the Floor Area Ratio defined by the credit assignment evaluation process for each RZ and A is the total area of the RZ.
DFA2 is the amount of building floor area that can be developed compensating for the demolition of existing buildings, with the increase in floor area above mentioned.
The area of the transferred zone that developers will transfer to the municipality is given by (eqn. 3):
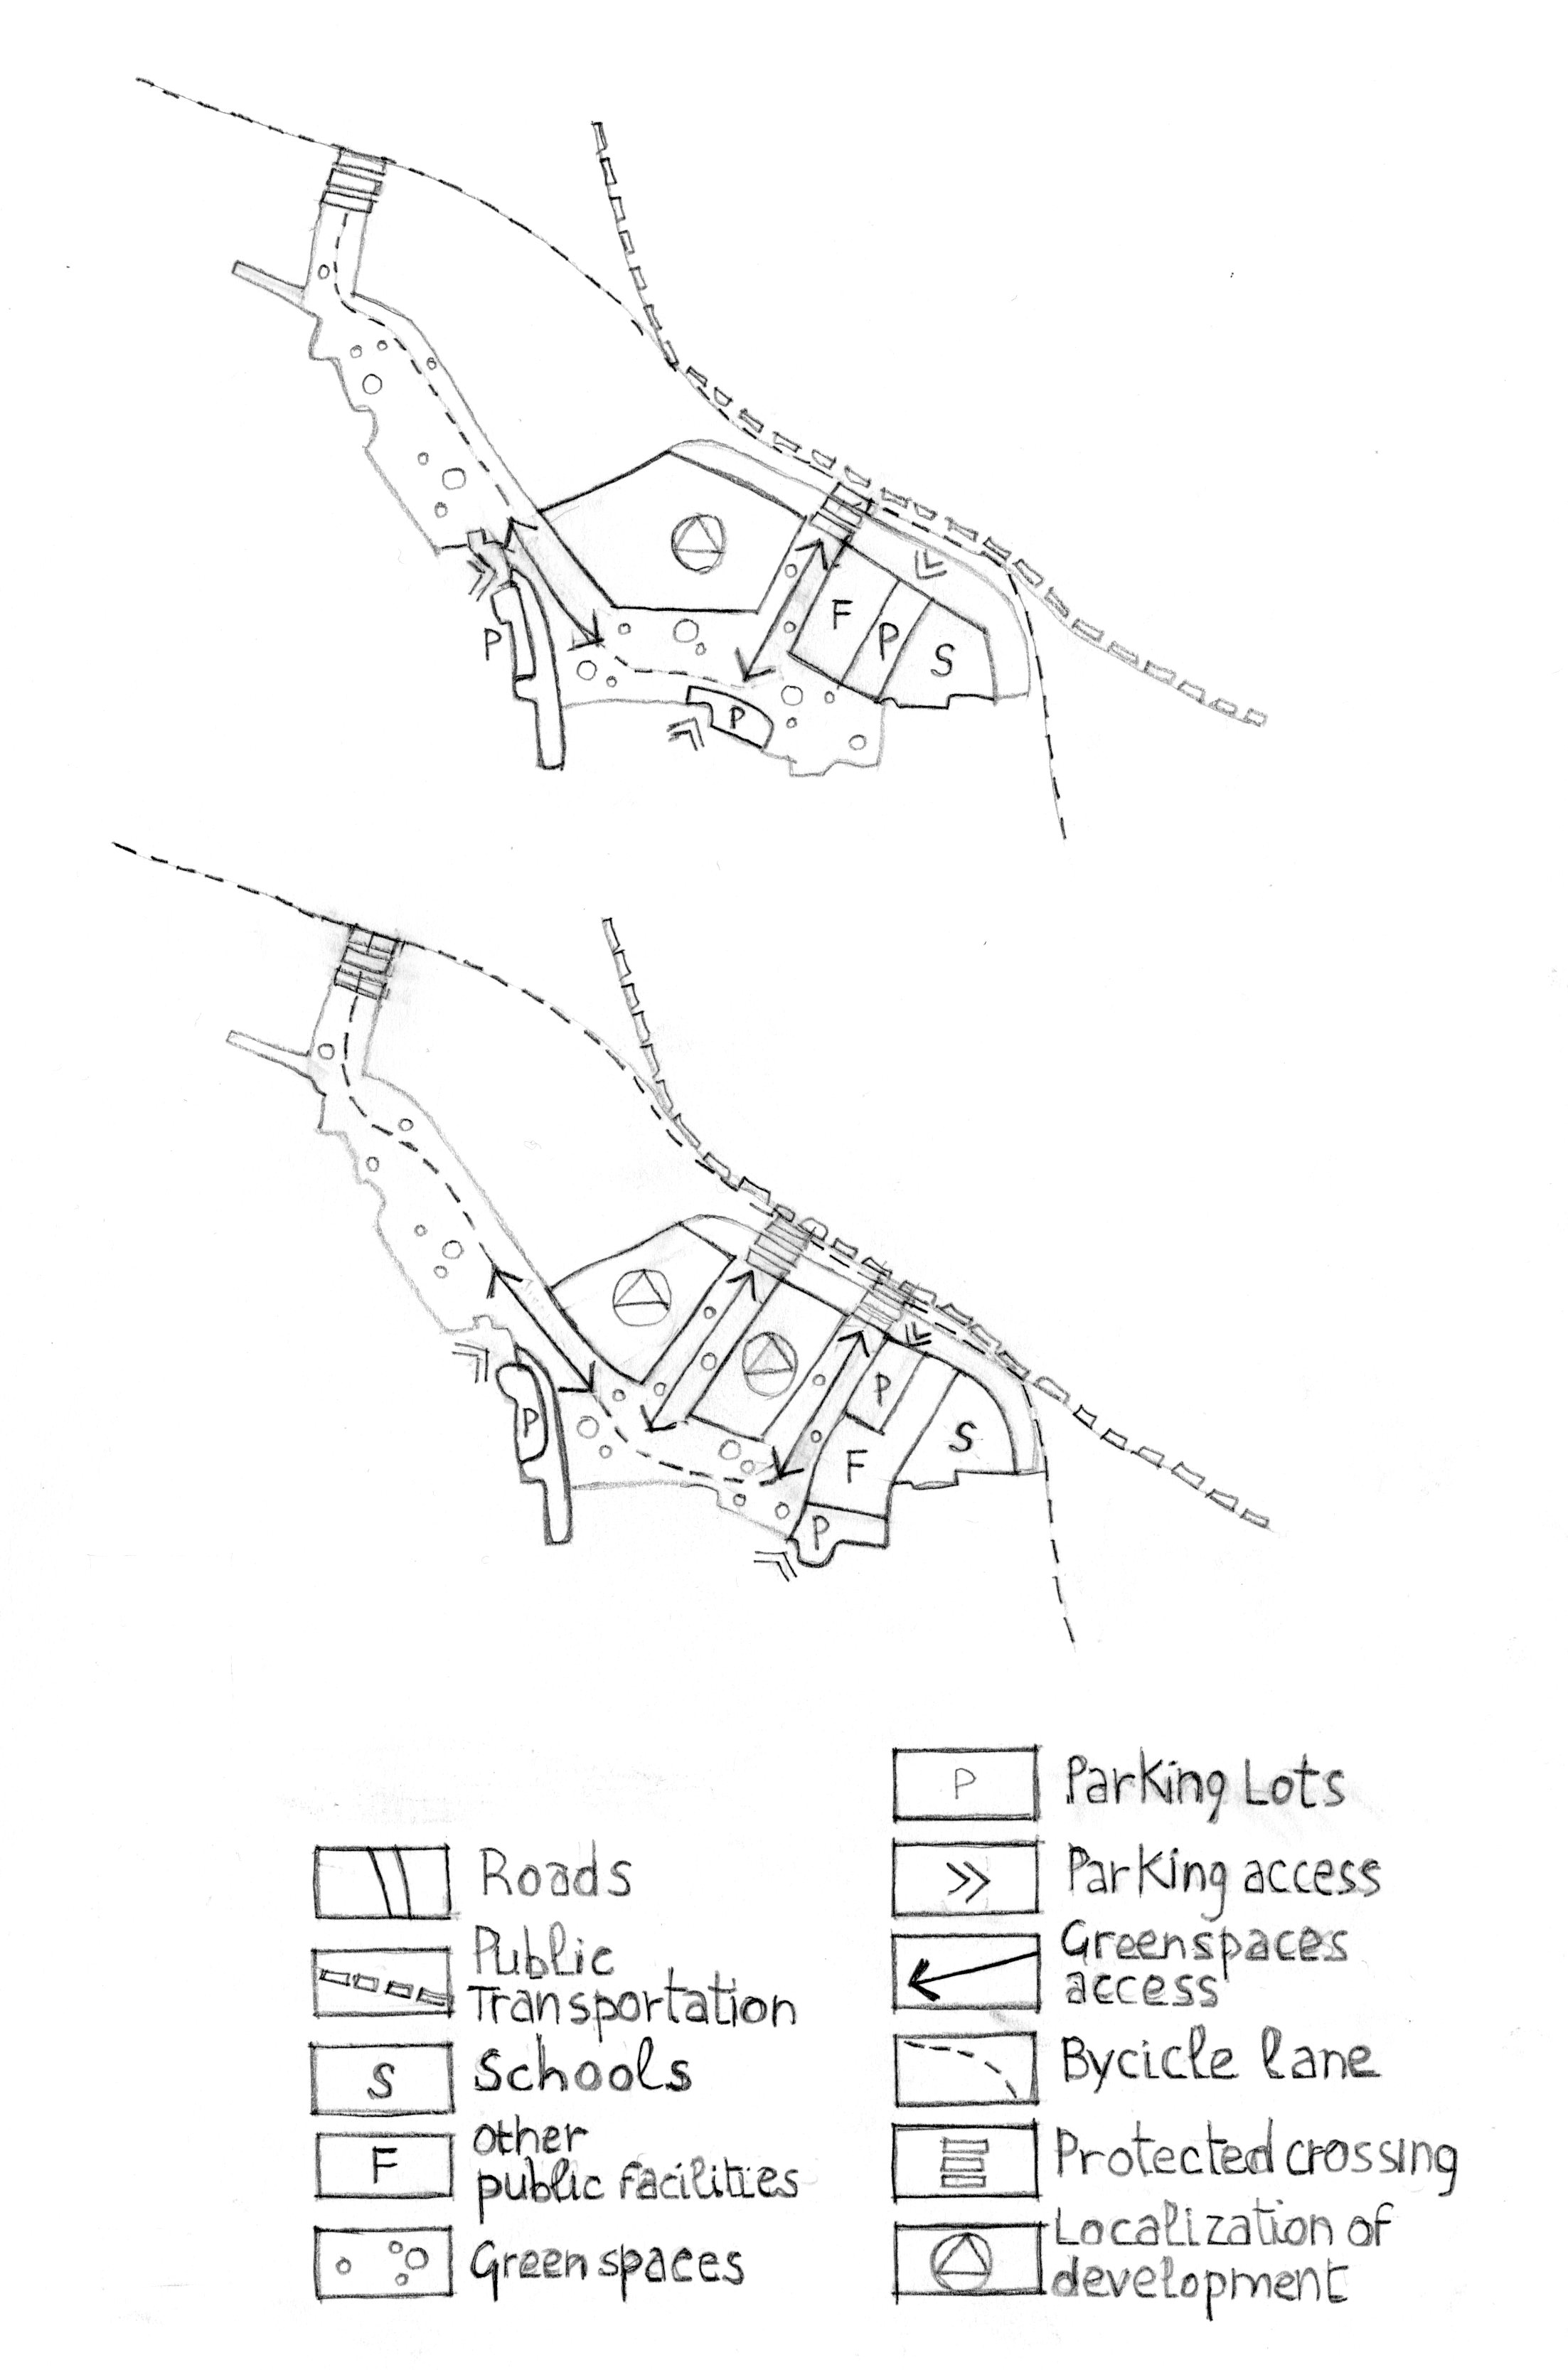
where TZP is the percentage of the RZ that will be transferred to the municipality and A is the total area of the RZ. TZP is not a pre-defined parameter, but it is rather the result of an iterative design process. Several design alternatives have been tested for each RZ, following the above mentioned design criteria and the one that satisfied the highest number of criteria was finally chosen. It is intended as a way of controlling the design process by gauging the total amount of public land obtained. Fig. 4 reports two sketches of design alternatives for one of the RZs.
Fig. 4 - An example of sketches for design alternatives of one RZ.
The amount of new development to be allocated to each RZ is concentrated in the development zone and would ensure the economic feasibility for private landowners (buyers and sellers of development credits). Moreover, new developments in the RZs have to comply with a detailed set of planning rules including maximum height, buildings’ alignment and permeability of open spaces adjacent to new buildings.
Available data
For the implementation of the method, the following geographical data were used. For the definition of Resource Zones, a land-use map was derived from the by Urban Atlas land-use layer ([11]). This layer for the city of Catania had an average scale of detail of 1: 12 000. To update and check the Urban Atlas land-use layer, a visual inspection of high-resolution regional orthophotos ([42]) and recent Google Maps images was performed. RZ were then designed based on the existing vector cartography available from the municipality at a scale of 1:2000. In each RZ, the spatial layout of transferred zones and development zones was then manually based on the previous cartographic sources.
Results
The application of the GOUD strategy in the Catania Master Plan resulted in the design of 36 RZs, located within the entire municipality, but mostly concentrated around the city center. Fig. 5 shows the localization of RZs in the municipal area and Tab. 2 summarizes their different features. They have very different sizes and characteristics, from small areas within dense urban fabric (e.g., 1.4, 2.2 - see Tab. 2) to more peripheral and larger ones (2.3, 8.1, 10.2).
Fig. 5 - Localization of Resource Zones in the municipality.

Tab. 2 - List of proposed Resource Zones (RZ) and relative characteristics and parameters.
| Resource Zones (RZ) |
Development credits - FAR (m2 m-2) |
Area (m2) |
TZP | TZ (m2) |
Public greenspaces (m2) |
% of public greenspaces |
|---|---|---|---|---|---|---|
| 1.1 Ex Cementificio | 0.65 | 90592 | 0.75 | 67 944 | 59982 | 66 |
| 1.2 Via D. Tempio | 0.20 | 70421 | 0.70 | 49 295 | 45965 | 65 |
| 1.3 Waterfront | 0.60 | 181218 | 0.75 | 135 913 | 135487 | 75 |
| 1.4 Corso Martiri della Libertà | 0.60 | 103951 | - | - | - | - |
| 2.1 Viale Mediterraneo Est | 0.40 | 216230 | 0.85 | 183 796 | 146944 | 68 |
| 2.2 Picanello Nord | 0.20 | 43158 | 0.80 | 34 526 | 15361 | 36 |
| 2.3 Viale G. Lainò | 0.30 | 286663 | 0.75 | 214 998 | 154848 | 54 |
| 2.4 Feudo Grande | 0.15 | 61278 | 0.75 | 45 958 | 38396 | 63 |
| 2.5 Via del Roveto | 0.20 | 22252 | 0.65 | 14 464 | 10802 | 49 |
| 2.6 Via del Rotolo | 0.60 | 60113 | 0.75 | 45 085 | 26 755 | 45 |
| 2.7 Viale Africa | 0.60 | 14391 | 0.75 | 10 793 | 6484 | 45 |
| 3.1 Via Milo | 0.30 | 179381 | 0.85 | 152 474 | 100195 | 56 |
| 3.2 Via G. Vagliasindi | 0.30 | 55929 | 0.80 | 44 743 | 25587 | 46 |
| 4.1 Via Due Obelischi | 0.20 | 58101 | 0.75 | 43 576 | 29165 | 50 |
| 4.2 Monte S. Paolillo | 0.08 | 318992 | 0.85 | 271 144 | 249215 | 78 |
| 4.3 Via Passo Gravina | 0.30 | 166303 | 0.80 | 133 043 | 94932 | 57 |
| 4.4 Via Cardinale Nava | 0.40 | 29360 | 0.80 | 23 489 | 16293 | 55 |
| 4.5 Viale della Costituzione | 0.40 | 33930 | 0.80 | 27 144 | 19908 | 59 |
| 4.6 Viale Mediterraneo Ovest | 0.20 | 34755 | 0.75 | 26 066 | 17470 | 50 |
| 5.1 Via Macello | 0.15 | 73979 | 0.70 | 51 786 | 37282 | 50 |
| 5.2 Via Calvario | 0.15 | 31189 | 0.75 | 23 392 | 13632 | 44 |
| 6.1 Viale Tirreno | 0.30 | 84059 | 0.80 | 67 247 | 59675 | 71 |
| 6.2 Via Calvario | 0.30 | 82758 | 0.70 | 57 931 | 38347 | 46 |
| 6.3 Orti di Cibali | 0.65 | 356457 | 0.60 | 213 874 | 138043 | 39 |
| 7.1 Nesima Nord | 0.20 | 276052 | 0.85 | 234 645 | 131284 | 48 |
| 7.2 Nuovo Garibaldi | 0.20 | 79025 | 0.75 | 59 268 | 41768 | 53 |
| 7.3 Via S. Pio X | 0.20 | 114918 | 0.75 | 86 188 | 58914 | 51 |
| 7.4 Via U. La Malfa | 0.20 | 57380 | 0.75 | 43 035 | 35517 | 62 |
| 7.5 Viale F. Fontana | 0.20 | 20247 | 0.70 | 14 173 | 8353 | 41 |
| 8.1 Parco Monte Po’ | 0.02 | 1889631 | 0.90 | 1 700 668 | 1481087 | 78 |
| 8.2 Via della Regione | 0.15 | 254742 | 0.90 | 229 268 | 199920 | 78 |
| 8.3 Curia | 0.30 | 74237 | 0.80 | 59 389 | 39147 | 53 |
| 8.4 Corso Duca d’Aosta | 0.30 | 166572 | 0.85 | 141 586 | 118683 | 71 |
| 10.1 Via Zia Lisa | 0.15 | 83279 | 0.80 | 66 623 | 51231 | 62 |
| 10.2 Acquicella | 0.30 | 1020633 | 0.75 | 765 475 | 609760 | 60 |
| 10.3 S. Giuseppe La Rena | 0.15 | 81611 | 0.85 | 69 369 | 51679 | 63 |
| TOTAL | - | 6436887 | 0.80 | 5 155 214 | 4066677 | 64 (average value) |
FAR varies from 0.02 to 0.6. Lower values are present in the less urbanized RZ (8.1, 4.2) where several Non Urbanised Areas are present: for these RZs only very limited developments are allowed. By contrast, the higher FAR values can be found in more central RZs (1.1, 1.3, 1.4, 2.6) in high-density urban fabric.
TZP values show a similar trend, varying from 60% for more urbanized RZs to 90% for peri-urban RZs. Transferred Zones total more than 540 ha in area, and are on average 80% of the area covered by the 36 RZs. Accordingly, for each hectare of RZ there will be 0.8 hectare of public land acquired by the municipality including greenspaces, roads and other public facilities. New greenspaces total more than 430 ha (64% of the total TZs area).
The major result of the application of the GOUD strategy will be the creation of a substantial number of public greenspaces, over a total of 430 ha, differently distributed among all the RZs. These greenspaces represent an average percentage of 64% of the area of all RZs.
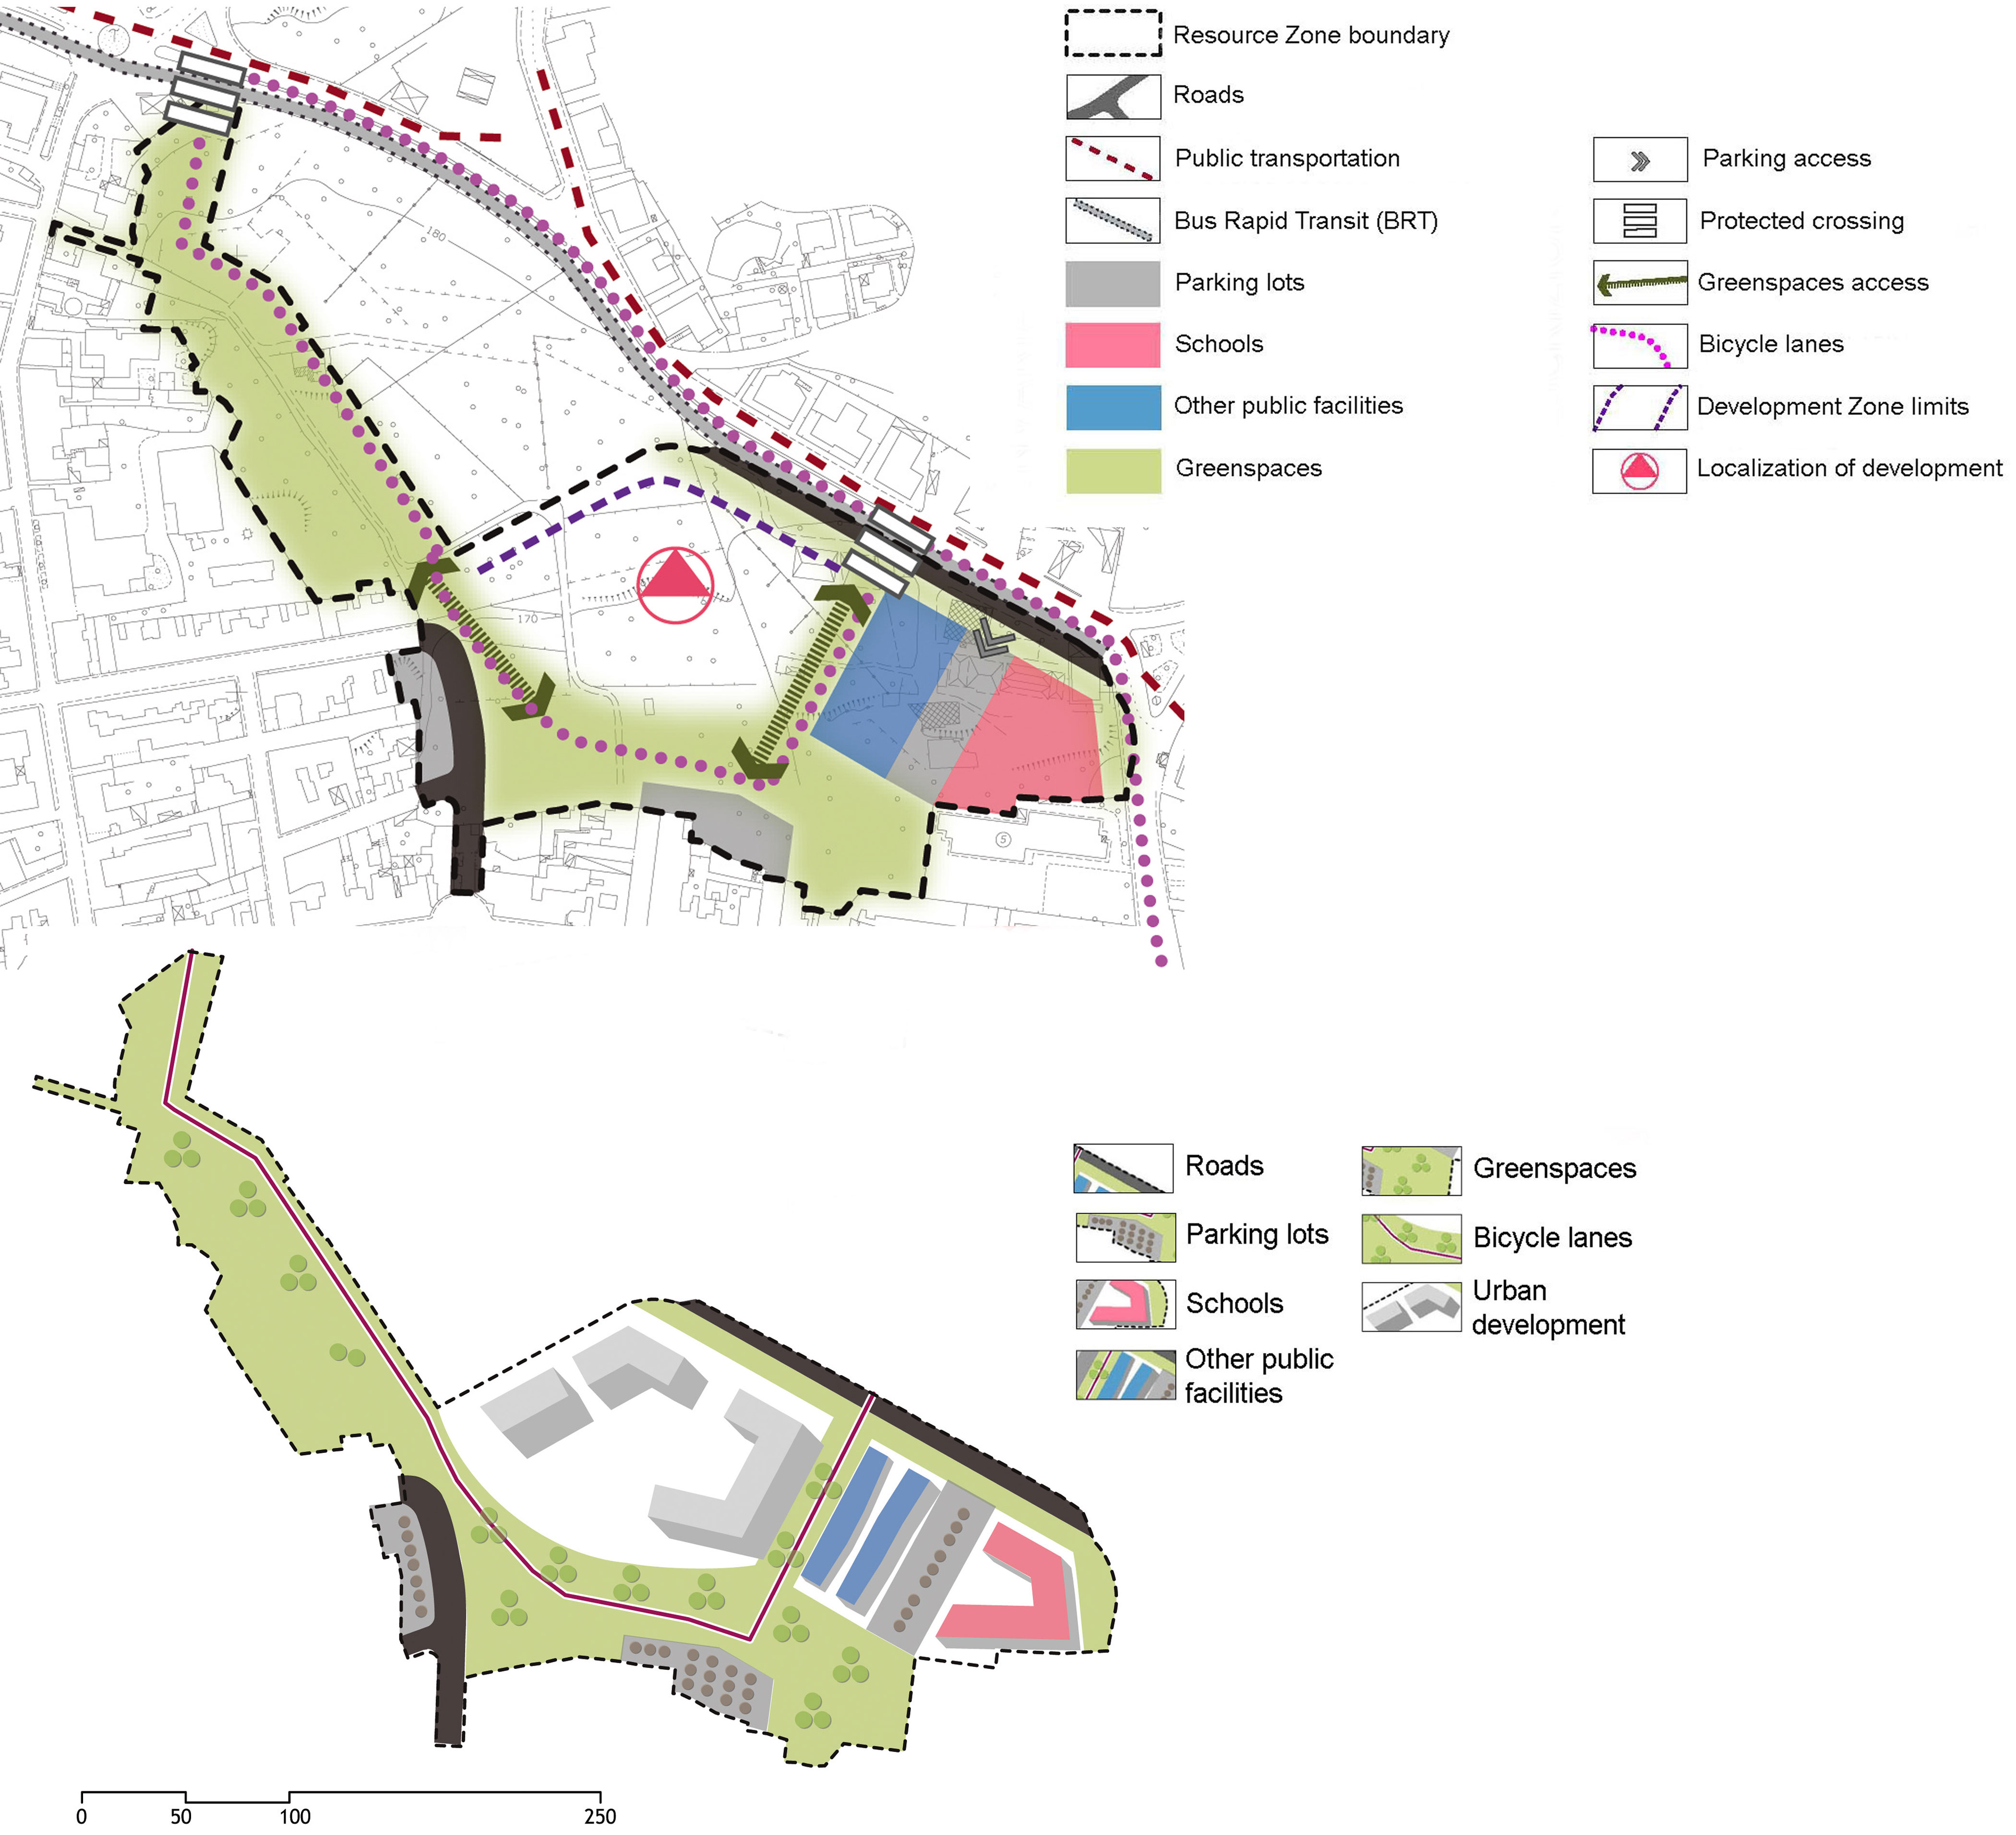
A detailed example of an RZ is given in Fig. 6, showing the chosen design alternative and a detailed layout of buildings, public facilities and greenspaces. Relative parameters of the design are also reported in Tab. 3.
Fig. 6 - Example of a design layout of a Resource Zones (4.1): schematic design (top) and detailed layout of urban development, greenspaces and public facilities (bottom).
Tab. 3 - Urban development parameters and incentives for demolishing existing buildings referred to RZ 4.1.
| Group | Parameters | Label / Formula | Value | Units |
|---|---|---|---|---|
| Urban development parameters | Total Area | A | 58100.81 | m2 |
| Floor Area Ratio | FAR | 0.2 | m2 m-2 | |
| Developable Floor Area 1 | DFA 1 = A x FAR | 11620.16 | m2 | |
| Percentage of Residential Area | %RA | 30 | % | |
| Developable Residential Floor Area 1 | DRFA 1 | 3486.05 | m2 | |
| Incentives for demolishing existing buildings |
Existing Residential Floor Area | ERFA | 582 | m2 |
| Existing Non Residential Floor Area | ENRFA | 419.78 | m2 | |
| Increase in residential floor area | PI | 100 | % | |
| Increased Residential Floor Area | IRFA = ERFA x PI | 582 | m2 | |
| Developable Floor Area 2 | DFA 2 = ERFA + ENRFA + IRFA | 1583.78 | m2 | |
| General parameters | Transferred Zone Percentage | TZP | 75 | % |
| Transferred Zone | TA = A x TZP | 43162.68 | m2 | |
| Developable Floor Area | DFA = DFA 1 + DFA 2 | 13203.94 | m2 | |
| Type of buildings | multi-storey apartments | - | - | |
| Maximum number of storeys | - | 5 | - | |
| Percentage of permeability within DZ | - | 30 | % | |
| New land uses for urban greenspaces | Community Supported A farms - allotment gardens | |||
| Tree-cover within TZ/greenspaces | - | 25 | % | |
This RZ has an area of 58 100 m2, with a FAR of 0.20. The incentive for demolishing existing residential floor area is 100%. The total Developable Floor Area (DFA) is 13 203 m2. Within the two designated Development Zones, multistory apartments, buildings for offices and retails up to five stories can be allocated, maintaining a required minimum percentage of permeability of 30%. Developers will compensate the municipality by transferring 75% of entire property (43 162 m2) and turning it into public greenspaces (29 164 m2), roads (3465 m2), area for a school building (3452 m2), parking lots (4528 m2) and other public facilities and services (3102 m2). New public greenspaces represents 50% of Transferred Zones and their tree coverage has to be higher than 25% of the Transferred Zone area. In order to reduce maintenance costs for the municipality, new land uses such as allotment gardens and Community Supported Agriculture farms can be included according to the Master Plan indications.
Discussion
Relevance of the green oriented urban development strategy
Many countries with increasing urbanization processes are contending with a host of land-use challenges (e.g., agricultural land conservation, habitat fragmentation, historic preservation, affordable housing and infrastructure planning) and seek market-based policy solutions ([35]). One potential market-based solution is the TDR, which allows severing of the right to develop land in a free-market system of willing sellers and buyers ([21]). While some scholars have pointed to the potential of TDR to preserve natural resources at low public costs ([31]), others have highlighted benefits of its flexibility as a market-based tool ([37]).
In the case of the Catania Master Plan, the attractiveness of the TDR mechanism for developers is ensured by setting the values of FAR parameter according to real estate market values (see above). Moreover, landowners and developers will be encouraged to invest (even if in a limited portion of the RZs) in areas that are mainly zoned for public services and thus without any opportunity for development.
The GOUD strategy adopted in the Catania Master Plan will allow the acquisition of about 430 ha of new accessible public greenspaces, an increase of a staggering 600 % from the existing 70.2 ha. This will remarkably increase the number of inhabitants who have the opportunity to access to good quality greenspaces, considering that these areas are currently abandoned, privately owned and thus not accessible by citizens. On the other hand, the cost of the proposed strategy is the provision of developable zones, representing about 108 ha (20% of the total area of RZs). Within these areas, built up zone can be at most 70% (about 75 ha in the entire municipality), while the rest must be maintained non-built and permeable, even if privately owned. This also means that it would be possible within the Developable Zones to design solutions that can enhance the overall evapotranspiration and permeable features. This will be insured by the compliance with the norms imposing the minimum amount of trees coverage and the percentage of permeable surface.
UES usually tend to decline as urban density increases. For this reason an appropriate design of greenspaces based on extensive tree cover within dense urban fabric can enhance ecological performance and thus the provision of ecosystem services ([50]). In the proposed RZ the prospective increase of tree canopy can partly compensate for the loss of permeable soil due to new development providing a greater amount of carbon storage, carbon sequestration and air cleaning. In addition, other UES are represented by the enhanced accessibility to greenspaces for recreational and cultural purposes: this accessibility can be achieved by creating a new cycle-pedestrian based on existing road network and new greenspaces ([1]).
Recent reviews of policies for urban greenspaces planning highlight the numerous benefits of the incorporation of these areas into higher density built environments, spanning the economic, social and environmental dimensions ([8], [34]). Moreover, a well-designed and integrated greenspaces can attract new residents to invest in their communities, making more appealing the standard of living in higher density built environments and thus resulting as a source of financial resources for municipalities, as confirmed by recent experiences of urban planning in Malmö, Brisbane or Stockholm ([8], [51]). For the case study of Catania municipality, a particular challenge the proposed GOUD strategy has to face is the extremely high density settlement. The type of urban fabric requires particular policies dealing with the limited amount of existing greenspaces, reduced availability of open spaces to be used as new greenspaces and, at the same time, the pressures of the real estate market calling for new land to develop. For this reason, Transfer of Development Rights programs coordinated by municipal administration could be an effective solution ([3], [41]).
Different typologies of policy tools for the management of greenspaces are available, mostly depending on scale (urban, regional, national), national regulations and aims: public acquisition of land, regulatory approaches, and incentive-based approaches are among these tools ([3]). Different scholars have pointed out the critical phase of the implementation for these tools, linking the impact of urban policies on their real implementation ([40]). Another critical point is the identification of the correct administrative level to be chosen for the management policy of the greenspaces ([3]). In Italy, land-use planning and policy have long been the domain of municipal administration. Municipal Master Plans have always gathered the interests of different categories of stakeholders. For this is the reason, this administrative level might be the more appropriate to develop land policies aimed at the preservation and enhancement of public greenspaces.
As all planning process, the complete implementation of a Master Plan is a very long-term process, where planning choices about land-use might require several years for their complete application. This is even more true for this case study, where the GOUD strategy is part of a Master Plan which is currently under the approval by the city council. For this reason the real effects of the GOUD strategy will need an extended time to be proved to be effective.
Green oriented urban development and urban ecosystem services
According to the Millennium Ecosystem Assessment classification ([36]), several categories of UES can be increased following the application of the GOUD approach. Among “provisioning services”, the supply of crops (mostly fresh vegetables and fruit) might be a relevant effect of GOUD. New forms of agriculture such as community-supported agriculture are environmentally sound since they reduce “food miles” ([30]) thanks to the proximity between producers (urban farmers) and consumers (citizen) ([5]). The provision of new habitats can also be achieved, including the establishing in time of novel urban ecosystems ([25]). Less relevant but not negligible is the timber production that can be obtained from the maintenance of greenspaces ([54]).
For “regulating services”, new greenspaces in each RZ can contribute to microclimate regulation through evapotranspiration processes and shading effect ([6]). New greenspaces can directly affect air quality in two different ways: by increasing dry depositions and by decreasing biogenic volatile organic compound (BVOC) emissions that can act as precursors of secondary air pollutants ([12]). Carbon storage/sequestration by urban trees is another regulating service in urban areas, mainly depending on tree size, lifespan, growth rate, and tolerance to urban stress. A moderate increase of pollination mechanisms can also be observed, especially in relation to new forms of agriculture that can be implemented in the new city green infrastructure.
The “cultural service” is defined as the “recreational pleasure people derive from natural or cultivated ecosystems” ([36]). Even if this service may be less tangible than the material ones, it is one of the most important and crucial in urban areas, as people are willing to acknowledge the contribution of open spaces to well-being, cultural and spiritual enrichment ([36], [13]). By integrating new greenspaces in the existing urban fabric, the GOUD strategy might be able to increasing the amount of green area available for citizens. Finally, there are the positive effects of an interconnected network of greenspaces on urban mobility. Tree canopy can provide shade along cycle and pedestrian paths, a key element for encouraging sustainable means of transport, considering the climate condition of the city characterized by long and hot summers.
Possible indicators for UES
GOUD strategy needs to be based on a careful evaluation of involved UES. Consequently, a set of indicators has to be established and calculated, according to UES to evaluate available data. The first criterion for choice of indicator is the possibility of performing a small-scale assessment using detailed land-use/land cover data. Ecosystem services are often assessed from land-use data, but general data (such as Corine land cover or other regional land-use data sets) do not have a sufficient resolution at the urban scale. A second critical element is the resolution of spatial units for their calculation, as administrative units such as NUTS statistical areas ([33]) cannot be suitable. For these reasons, high-resolution land-use data (below 1:10 000 scale) and sub-communal units (districts or neighbourhoods) should be used in the assessment. Moreover, land-cover data should be preferred to land-use ones, as many UES are dependent on land cover features such as trees, shrubs and grass cover ([28]).
Several indicators for the evaluation of the UES have been proposed by many studies ([32], [18], [17]). However, it is often hard to have access to data needed to calculate such vast set of indicators, especially for public administration with financial constraints. Moreover, some of the available indicators are designed to be evaluated at scales not adequate for evaluating local environmental effects of municipalities’ Master Plans. In Tab. 4 a set of indicators is proposed. Each indicator is not intended to evaluate one or more UES exhaustively but should be considered as its proxy.
Tab. 4 - Indicators for involved UES in the green oriented development strategy.
| Indicator | Provisioning Services |
Regulating Services |
Cultural Services |
|---|---|---|---|
| New urban farmlands [ha] | Crops | - | - |
| New urban ecosystems [ha] | Habitat Service | - | - |
| Carbon storage [tons ha-1 year-1] ([39], [10]) |
- | Air quality regulation | - |
| Carbon sequestration [tons ha-1 year-1] ([39]) |
- | Air quality regulation | - |
| Cleaning air production [m3] ([24]) |
- | Microclimate regulation, air quality regulation | - |
| Accessibility to urban greenspaces ([27]) |
- | - | Spiritual, eesthetic, recreation, education |
| Connectivity of new greenspaces ([1]) |
- | - | Spiritual, eesthetic, recreation, education |
A detailed assessment aimed at quantifying the effects of UES is currently in preparation. So far, results data referring to a limited set of RZs (4.1, 4.2, 4.3) have shown that the provision of new greenspaces generates an overall increase of accessibility of 410%. The accessibility indicator calculates the number of inhabitants (obtained by vector census tracts) that can access each green patch and weighs this number with the inverse of the distance from each residential patch. Within a buffer radius of 2 km from each new planned greenspace, the total number of inhabitants that have access to it is more than quadrupled.
In the proposed approach, a direct relationship between greenspaces and UES is assumed, as existing greenspaces are considered to be the main providers of UES. For this reason, a complete assessment of the increase of UES according to chosen indicators can be made if the new greenspaces in all RZs are designed in detail. Only after this can the total increase of UES be accounted. Therefore, the detailed design of all RZs is a fundamental prerequisite.
There are some critical issues concerning the use of indicators for the UES assessment produced by greenspaces. The most significant one is the relation between urban greenery and carbon sequestration. Simplified models ([43]) assume an uniform relationship between tree cover and net carbon uptake. However, this relationship is much more complex and depend, among other things, on the canopy structure and its composition of species ([39]). This means that very detailed land cover data - supported or integrated by some direct on-ground surveys - might be necessary in order to perform a more accurate assessment, even if this activity may often not be financially sustainable for local public administrations.
Planning processes and ecosystem services
A consideration is needed regarding the relationship between planning processes and the concept of ecosystem services. The latter could be of high value for facilitating the exchange between stakeholders involved in the planning process, increasing the consensus on shared objectives and balancing conflicts between private and public stakeholders. The communication of the role of UES may be of the utmost importance in planning process. This becomes even more crucial when resources for public land acquisition are limited, and their optimization is often seen as the most important priority for public decision makers. It is therefore fundamental to choose the most appropriate way to communicate efficiently the relation between land-use planning choices and UES. This calls for a first definition of shared common values and services provided by ES among the panel of stakeholders in the urban planning process. Maps and GIS web-mapping tool ([46]) might facilitate the exchange of information and shared values on UES under exam. This would create a higher acceptance of the co-developed planning choice, policies and accepted trade-offs. In this direction the use of simplified layout maps as the one showed in Fig. 4 might help stakeholders and communities in proposing alternative of land uses and discussing related pros and cons.
Conclusions
The adoption of the ecosystem services concept by urban planners is a relevant step forward in the evolution of land-use planning. Planners have also to be aware of the diversity of perspectives on ecosystem services and they have to take that diversity into account when making relevant decisions ([20]). However, decisions oriented to ecosystem services protection and enhancement have to take into account limitations in the availability of funds for their implementation.
Urbanization, if properly planned, can potentially contribute to strengthen biodiversity and ecosystem service provision in urban systems. Although a high number of researches has highlighted the importance of UES in city planning, few studies or planning experiences have proposed criteria and meaningful solutions on how urban development can be planned taking into consideration UES. Existing references show only general criteria for increasing city compactness ([48], [49], [50]), or propose applications of urban design at limited geographical extension ([16]). The Green Oriented Urban Development proposes an approach to urban development planning that increases the urban ecosystem services at reduced costs for the municipality, based on the application of a TDR programme. The aims of this process are public acquisition of greenspaces through the use of market incentives and a focus on a sound design for these newly acquired spaces. In the examined case it is possible to obtain a relevant amount of new public greenspaces (more than 400 ha) that are paid for by transferring and exchanging development credits.
Cultural and regulating ecosystem services are considerably increased through the improvement of accessibility of greenspaces and the increase of tree land cover. Part of these areas will be available for urban agriculture contributing to the production of food at local level, reducing at the same time maintenance costs for the municipality.
The GOUD approach is particularly relevant in contexts where local administrations do not have enough funds to implement public policies for protecting open spaces and turning them into accessible urban greenspaces.
References
Gscholar
Gscholar
Gscholar
Gscholar
Gscholar
Gscholar
Gscholar
Gscholar
Gscholar
Gscholar
Gscholar
Gscholar
Authors’ Info
Authors’ Affiliation
Daniele La Rosa
Riccardo Privitera
Department of Architecture, University of Catania, v. S. Sofia, I-95125 Catania (Italy)
Corresponding author
Paper Info
Citation
Martinico F, La Rosa D, Privitera R (2014). Green oriented urban development for urban ecosystem services provision in a medium sized city in southern Italy. iForest 7: 385-395. - doi: 10.3832/ifor1171-007
Academic Editor
Raffaele Lafortezza
Paper history
Received: Oct 31, 2013
Accepted: Dec 27, 2013
First online: May 19, 2014
Publication Date: Dec 01, 2014
Publication Time: 4.77 months
Copyright Information
© SISEF - The Italian Society of Silviculture and Forest Ecology 2014
Open Access
This article is distributed under the terms of the Creative Commons Attribution-Non Commercial 4.0 International (https://creativecommons.org/licenses/by-nc/4.0/), which permits unrestricted use, distribution, and reproduction in any medium, provided you give appropriate credit to the original author(s) and the source, provide a link to the Creative Commons license, and indicate if changes were made.

Web Metrics
Breakdown by View Type
Article Usage
Total Article Views: 63062
(from publication date up to now)
Breakdown by View Type
HTML Page Views: 50904
Abstract Page Views: 4762
PDF Downloads: 5577
Citation/Reference Downloads: 58
XML Downloads: 1761
Web Metrics
Days since publication: 4420
Overall contacts: 63062
Avg. contacts per week: 99.87
Article Citations
Article citations are based on data periodically collected from the Clarivate Web of Science web site
(last update: Mar 2025)
Total number of cites (since 2014): 26
Average cites per year: 2.17
Publication Metrics
by Dimensions ©
Articles citing this article
List of the papers citing this article based on CrossRef Cited-by.
Related Contents
iForest Similar Articles
Research Articles
The concept of green infrastructure and urban landscape planning: a challenge for urban forestry planning in Belgrade, Serbia
vol. 11, pp. 491-498 (online: 18 July 2018)
Review Papers
Green Infrastructure as a tool to support spatial planning in European urban regions
vol. 6, pp. 102-108 (online: 05 March 2013)
Research Articles
LIFE-CLIVUT, ecosystem benefits of urban green areas: a pilot case study in Perugia (Italy)
vol. 15, pp. 133-140 (online: 09 April 2022)
Technical Reports
Assessment of allergenic potential in urban forests: a case study of the Royal Park of Portici in Southern Italy
vol. 13, pp. 376-381 (online: 25 August 2020)
Research Articles
Microclimate regulating functions of urban forests in Changchun City (north-east China) and their associations with different factors
vol. 11, pp. 140-147 (online: 07 February 2018)
Research Articles
Evaluation of urban forest landscape health: a case study of the Nanguo Peach Garden, China
vol. 13, pp. 175-184 (online: 02 May 2020)
Research Articles
The willingness of inhabitants in medium-sized city and the city’s surroundings settlements to pay for recreation in urban forests in Poland
vol. 14, pp. 483-489 (online: 27 October 2021)
Research Articles
A Decision Support System for trade-off analysis and dynamic evaluation of forest ecosystem services
vol. 11, pp. 171-180 (online: 19 February 2018)
Research Articles
Communicating spatial planning decisions at the landscape and farm level with landscape visualization
vol. 7, pp. 434-442 (online: 19 May 2014)
Research Articles
Magnolia grandiflora L. shows better responses to drought than Magnolia × soulangeana in urban environment
vol. 13, pp. 575-583 (online: 07 December 2020)
iForest Database Search
Search By Author
Search By Keyword
Google Scholar Search
Citing Articles
Search By Author
Search By Keywords
PubMed Search
Search By Author
Search By Keyword


