Evaluation of urban forest spatial distribution characteristics in Guangdong - Hong Kong - Macao Greater Bay Area
iForest - Biogeosciences and Forestry, Volume 16, Issue 3, Pages 136-143 (2023)
doi: https://doi.org/10.3832/ifor4268-016
Published: May 16, 2023 - Copyright © 2023 SISEF
Research Articles
Abstract
To understand the health and ecological benefits of scenic recreational forests, we elucidated their spatial distribution characteristics, which can be used to create guidelines and reveal strategic issues regarding the spatial distribution of tree species. We randomly set up 900 m2 quadrats in scenic recreational forest communities in Guangzhou, Foshan, and Zhuhai, and surveyed each tree using LiDAR. We then calculated the living vegetation volume (LVV) and amount of recreational space on the forest floor (RSFF), and analyzed the differences in spatial distribution characteristics across cities, locations, and forest types. The spatial distribution characteristics of trees differed between different cities, but were similar among different locations and forest types. Urban scenic recreational forest areas are thus configured based on aesthetics, recreational functions, and the spatial distribution characteristics of different tree species. Additionally, the relationship between the tree crown LVV and the RSFF was generally synergistic, yet contradictory. Although an increase in LVV can effectively improve ecological benefits, it may also reduce RSFF and other benefits provided by tree crowns to urban residents.
Keywords
Urban Forests, Living Vegetation Volume, Forest Floor Recreational Space, Spatial Distribution Strategy
Introduction
The urban heat island effect is being exacerbated by the increase in impervious surfaces caused by the rapid expansion of urbanization ([23], [12], [22], [6]). This is leading to high energy consumption ([27]) and changes in the habitats of animals and plants, and is adversely affecting the physiology and psychology of urban residents ([28], [1]), resulting in psychological anxiety, respiratory and skin diseases, and even death. In particular, the Guangdong - Hong Kong - Macao Greater Bay Area (GBA), located at a low latitude, is frequently exposed to extreme weather events, such as consistently high temperatures, periodic droughts, and floods. According to the latest monitoring data, the average temperature recorded in the months of January, July, and November in 2020 was 23.5 °C, which is 1.0 °C higher than the usual value recorded, marking the highest recorded temperature since 1961 (2021 GBA Climate Bulletin - August 10, 2021). The number of hot days in 2021 was 39.0, 19.6 days more than that recorded in typical years, also marking the highest number of hot days recorded since 1961 (2021 GBA Climate Bulletin - August 10, 2021).
As an important component of green infrastructure ([13]) and a nature-based solution ([9]), urban forests can mitigate the urban heat island effect and reduce ambient temperatures ([2], [24], [25]). Urban forests have aesthetic value, create recreational space on the forest floor (RSFF), and contribute to thermal buffering, shading, and transpiration ([16], [35]). The forest canopy layer is the most direct and dynamic interface between a forest and the external environment ([21]). The canopy structure and its changes have a crucial impact on several ecological factors and processes, such as forest lighting conditions, microclimates, hydrology, nutrient cycles, health, and biodiversity ([44], [10], [36]). The canopy layer is a complex, three-dimensional spatial structure, and the canopy leaf area index can well reflect the heterogeneity in the spatial structure of urban greening. These structural characteristics objectively reflect the utilization of spatial resources in forests ([14]) and can also be applied to optimize ecological functions, such as the cooling and heat reduction benefits of urban forests ([19]). While the ecological landscape functions of urban forests are manifested through the main canopy, they are also demonstrated through the forest floor structure. Therefore, it is essential to study both the living vegetation volume (LVV) of the tree canopy and the RSFF.
Previous forest canopy research has mainly focused on evaluating the vegetation volume of the urban forest canopy ([7], [41], [42], [3]), studying the differences in the light environment ([14], [33]) and the microclimate differences ([37], [29], [20], [11]) between the canopy and understory, among others. However, relatively few studies have examined the relationship between the canopy structure and the RSFF. Therefore, in this study, we focused on urban forest communities. We quantified the relationship between the LVV and RSFF for different forest types in the core urban areas (CUA), semi-urban areas (SUA), and urban fringe areas (UFA) of three cities (Guangzhou, Foshan, and Zhuhai) and optimized the spatial distribution of trees in urban forests to guide the effective development of ecological service functions. This was achieved by addressing three main research questions: (i) What are the spatial distribution characteristics of different tree species in urban forests? (ii) What are the spatial distribution characteristics of urban forests in different cities, locations, and forest types? (iii) How can the spatial distribution strategy be optimized according to the characteristics of different tree species to obtain more ecological benefits?
Materials and methods
Study areas
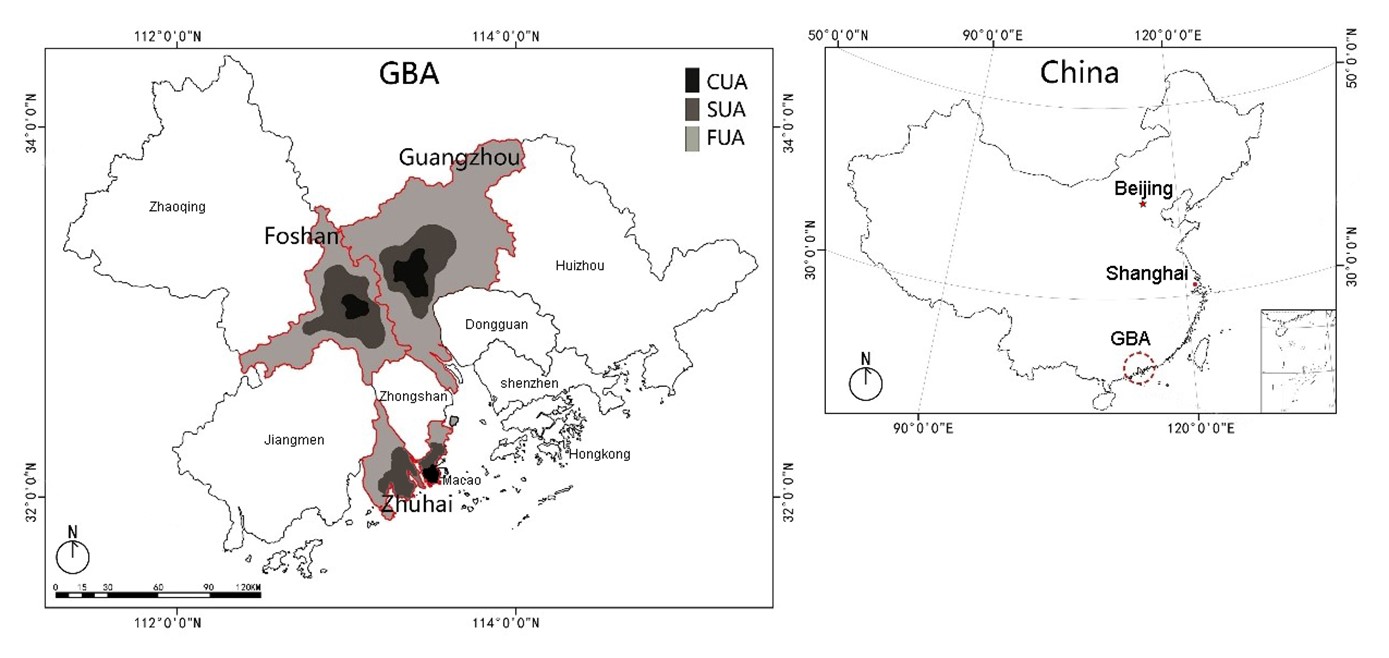
Three cities in the GBA, i.e., Guangzhou, Foshan, and Zhuhai, were selected as the study areas (Fig. 1). Guangzhou City (22° 26′ - 23° 56′ N, 112° 57′ - 114° 03′ E), located in the south-central part of Guangdong Province and the north-central edge of the Pearl River Delta, is large and located at the confluence of three rivers, the Xijiang, Beijiang, and Dongjiang. It has a subtropical monsoon climate characterized by warm weather and rain, abundant sunshine, long summers, and short winters. The annual average temperature is 21.9 °C, having the smallest annual average temperature difference compared with the other two cities studied. Foshan City (22° 38′ - 23° 34′ N, 112° 22′ -113° 23′ E) is located in the south-central part of Guangdong Province, in the hinterland of the Pearl River Delta, adjacent to Guangzhou in the east and Zhongshan in the south. It has a subtropical monsoon climate characterized by a mild climate and abundant rainfall, with an annual average temperature of 23.2 °C. Zhuhai City (21° 48′ - 22° 27′ N, 113° 03′ - 114° 19′ E) is located in the southern part of Guangdong Province on the west bank of the Pearl River Delta, facing Hong Kong across the sea in the east and Macao in the south. It has a subtropical monsoon oceanic climate, with high annual temperatures and abundant rainfall. The average annual temperature is 22.5 °C and the annual average rainfall can reach up to 2061.9 mm.
Fig. 1 - Schematic illustration of location of the study areas. The core urban area (CUA), semi urban area (SUA), and urban fringe area (UFA) of Guangzhou, Foshan, and Zhuhai are represented by black, dark gray, and light gray colors, respectively.
Sampling method
Each city was divided into CUA, SUA, and UFA based on the distance from the target area to the city center. Using a random sampling method, 100 sample plots (30 × 30 m) were established in each area of the three cities. Most of the selected sample plots primarily included urban forests, and those with mainly buildings, roads, or lakes were excluded. A total of 193 quadrats were studied (Tab. 1). For CUA, 15 plots were located in Guangzhou, 20 in Foshan, and 26 in Zhuhai; for SUA, 25 were in Guangzhou, 40 in Foshan, and 14 in Zhuhai; and for UFA, 20 were in Guangzhou, 20 in Foshan, and 13 in Zhuhai.
Tab. 1 - City population (million) and area (km2) of Guangzhou, Foshan, and Zhuhai, respectively. The core urban area (CUA), semi urban area (SUA), and urban fringe area (UFA) were classified based on their distances to the city center in each city. The numbers of the sample plots containing urban forests are provided for all specified areas.
| Cities | Population (million) |
Area (km2) |
CUA | SUA | UFA | |||
|---|---|---|---|---|---|---|---|---|
| Scope (km) |
Plots | Scope (km) |
Plots | Scope (km) |
Plots | |||
| Guangzhou | 15.3 | 7434 | < 7 | 15 | 7-14 | 25 | > 14 | 20 |
| Foshan | 7.9 | 3797 | < 4 | 20 | 4-8 | 40 | > 8 | 20 |
| Zhuhai | 2.0 | 1711 | < 3 | 26 | 3-6 | 14 | > 6 | 13 |
Based on the classification principle of forest parks, the quadrats in the forest areas were classified as core or edge forest according to the different distributions of the sample plots. The core forest was further divided into core closed forest and core open woodland (hereafter referred to as closed forest and open woodland), and the edge forest was divided into forest areas close to water bodies and forest areas adjacent to buildings. In the closed forest, the furthest side of the quadrat was more than 50 m away from water bodies or buildings, and the quadrat had a canopy density of more than 0.20. In the open woodland, the furthest side of the quadrat was at a distance greater than 50 m from water bodies or buildings, and the quadrat had a canopy density between 0.10 and 0.19. In the forest areas close to water bodies, the side of the quadrat closest to the water’s edge was less than 50 m away from the water body. In the forest area adjacent to buildings, the quadrat closest to the edge of the building was less than 50 m away from the building ([38]).
For all species, each tree with a diameter at breast height (DBH) ≥ 5 cm within the opposite quadrat was examined, and a total of 4216 trees were surveyed across the three cities. The species names were recorded and matched with the data obtained using a handheld SLAM-100 LiDAR scanner (see below).
Index evaluation method
LVV
All samples were scanned using a handheld SLAM-100® LiDAR scanner (Feima, Shenzhen, China) according to the following procedure: (i) after activation, the scanner powered up for 10 s. When the status indicator turned green, the scanner was held in front of the body, directing the laser head upwards, and the area was scanned while walking steadily and slowly around the quadrat. (ii) We set the vertices of four quadrats as the control points, aligned the center of the crosswire of the scanner base with the center of the control point, and oriented the head of the scanner in multiple directions to ensure that the elapsed time was more than 10 s. (iii) We avoided human facial obstructions at the laser emission area and vigorous movement of the scanner during the data collection process.
All data from the laser scans were stored on SD cards and retrieved in the laboratory. The LiDAR360 system (Beijing GreenValley Technology Co., Ltd., Beijing, China) was used for analysis. First, noise was removed from the point cloud, ground points were obtained, and a digital elevation model (DEM) was generated. Using point cloud computing tools to normalize the DEM, high-precision point cloud seed points of the quadrat were generated. The error and interference points in the seed points were deleted using the TLS editor included in the system, and the batch processing function was used to separate all individual trees in the sample plot. After separating all individual trees in the quadrat, their tree height, DBH, crown width, height, projection area, volume, and other data were calculated using the individual tree detection tool included in the system. Thereafter, the above data parameters could be used to calculate the crown volume of a single tree, also referred to as the LVV.
RSFF
The amount of RSFF reflects the size of the space provided by the forest for human movement and recreational use. Based on relevant research ([40]), we defined the amount of RSFF as the product of the vertical projection area of the tree crown and the clearance under the tree branches (the clearance under the branches higher than 2.2 m). The specific formula is (eqn. 1):
where VC refers to the amount of RSFF (m3), n refers to the number of trees with a clearance of more than 2.2 m under the branches, Mi is the vertical projection coverage area of the i-th tree’s crown (m2), and Hi refers to the clearance under the branch of the i-th tree (m). The Mi and Hi data were acquired using a handheld SLAM-100 LiDAR scanner.
Spatial distribution characteristics
The LVV and RSFF are the main functions provided by different forest tree species occupying a particular space. We defined the values of the spatial distribution characteristics based on SA, which is the ratio of the LVV (VG) to the amount of RSFF (VC - eqn. 2):
where SA is the value of the spatial distribution characteristic, VG represents the LVV (m3), and VC represents the amount of RSFF (m3). SA < 1.0 indicates that the tree species of the forest will tend toward having more RSFF than LVV. SA < 0.5 indicates that the RSFF has an absolute advantage. SA between 0.5 and 1.0 shows that RSFF has a slight advantage over the LVV. SA ≥ 1.0 indicates that the LVV has an advantage over the RSFF. SA between 0.5 and 3.0 indicates a strong diversity in the spatial distribution of urban forests.
Results
SA in different cities
SA was compared by analyzing the top 30 tree species in the study areas of the three cities.
SA in Guangzhou
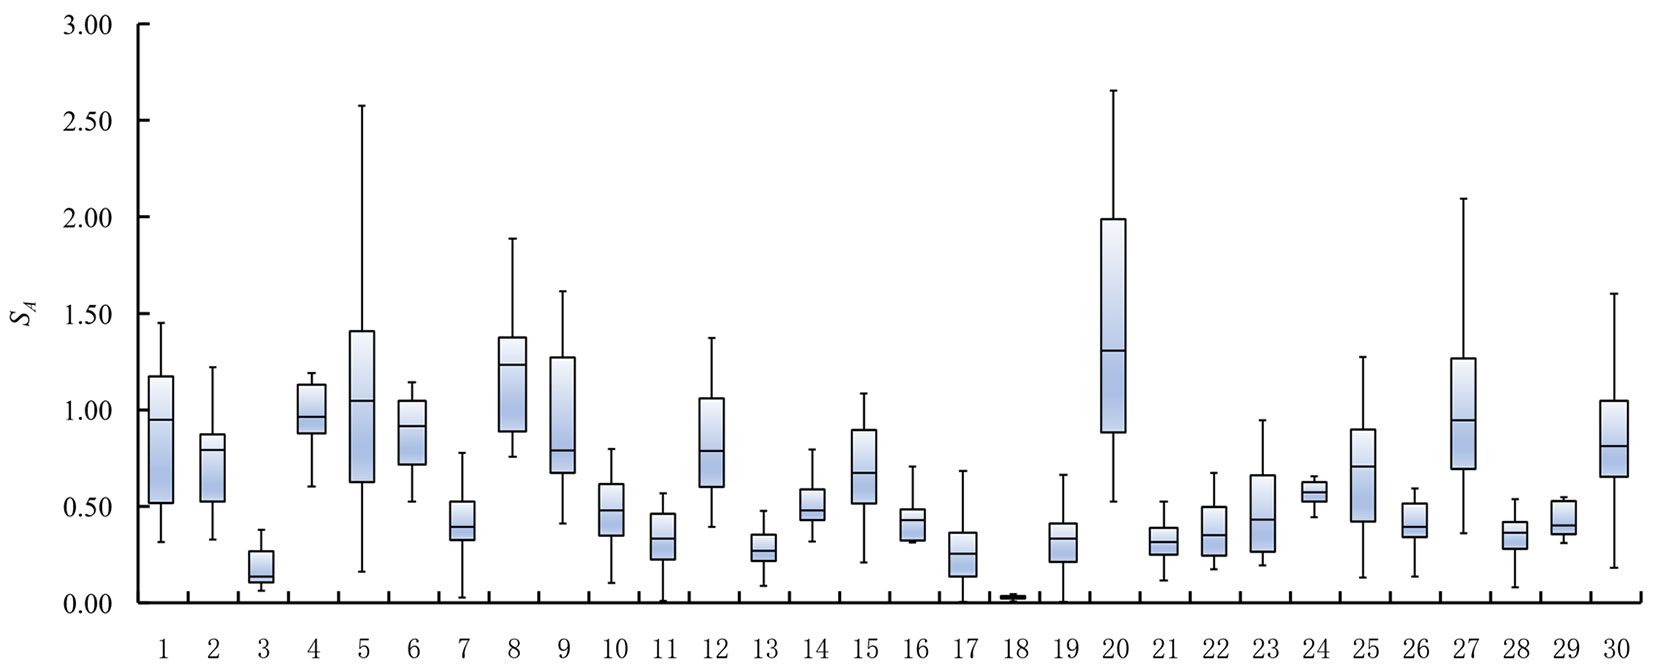
As shown in Fig. 2, among the top 30 tree species in urban forests in Guangzhou, the proportion of individual trees with SA < 1.0 was 78%. This finding indicates that the RSFF was relatively large in the forests of urban parks.
Fig. 2 - SA of different tree species in Guangzhou. The numbers on the x-axis represent tree species: 1, white champaca (Michelia alba); 2, tiger’s claw (Erythrina variegata); 3, giant crepe-myrtle (Lagerstroemia speciosa); 4, Cuban royal palm (Roystonea regia); 5, earleaf acacia (Acacia auriculiformis); 6, Kashi holly (Ilex rotunda); 7, African mahogany (Khaya senegalensis); 8, royal poinciana (Delonix regia); 9, council tree (Ficus altissima); 10, Hong Kong orchid tree (Bauhinia blakeana); 11, araguaney (Handroanthus chrysanthus); 12, sea hibiscus (Hibiscus tiliaceus); 13, Changkhen (Heteropanax fragrans); 14, African tulip tree (Spathodea campanulata); 15, cockspur coral tree (Erythrina crista-galli); 16, hairy-fruited elaeocarpus (Elaeocarpus apiculatus); 17, golden shower tree (Cassia fistula); 18, Indian mahogany (Chukrasia tabularis); 19, floss silk tree (Ceiba speciosa); 20, cotton tree (Bombax ceiba); 21, Moluccan albizia (Albizia falcataria); 22, blackboard tree (Alstonia scholaris); 23, sacred fig (Ficus religiosa); 24, burflower-tree (Neolamarckia cadamba); 25, Timor white gum (Eucalyptus urophylla); 26, herba ficus (Ficus concinna); 27, Java apple (Syzygium samarangense); 28, mountain ebony (Bauhinia variegata); 29, Indonesian cinnamon (Cinnamomum burmannii); and 30, camphor tree (Cinnamomum camphora). The numbers on the y-axis represent the value of SA.
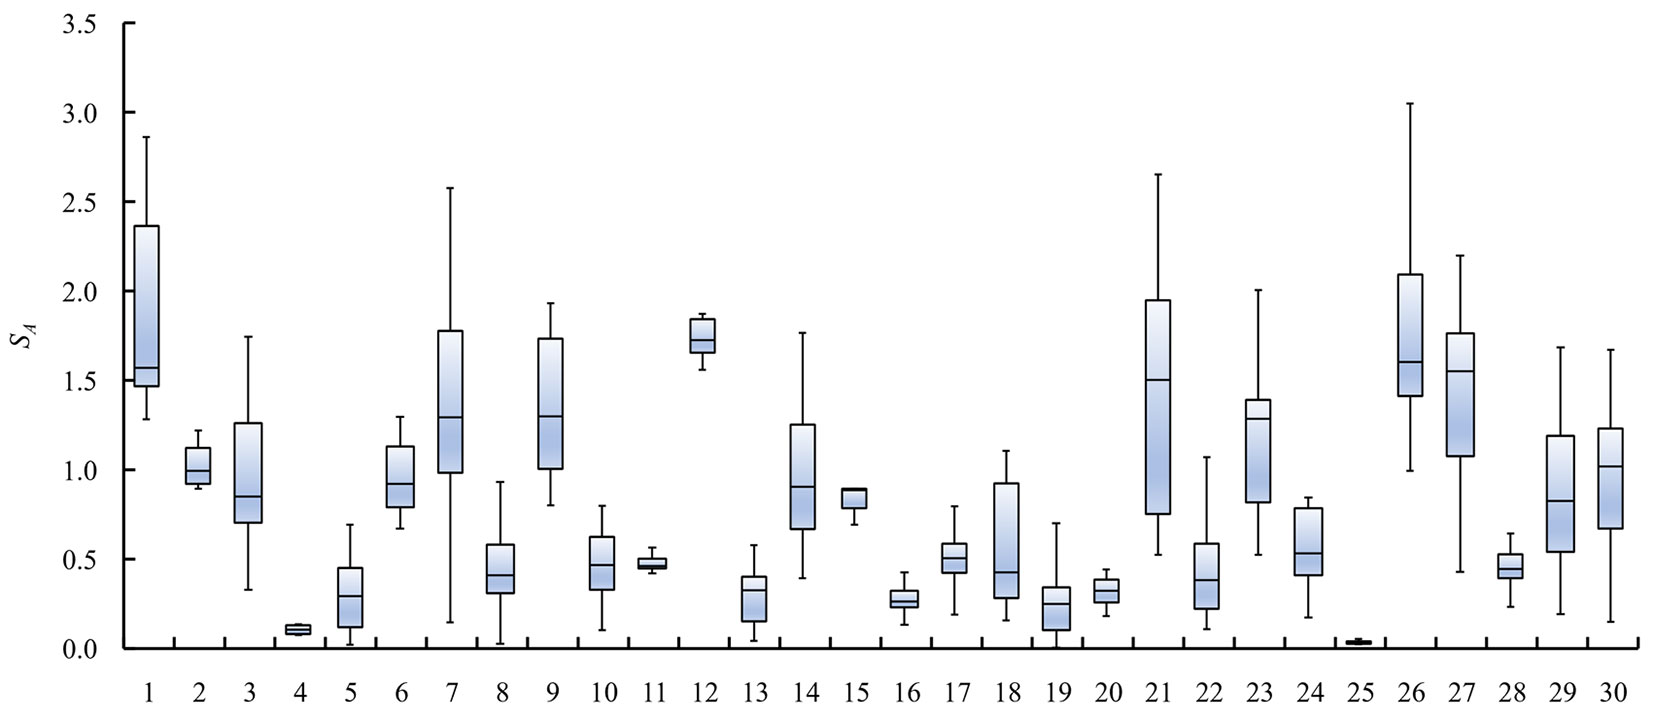
The tree species with SA ≥ 1.0 included white champaca (Michelia alba), African mahogany (Khaya senegalensis), council tree (Ficus altissima), sea hibiscus (Hibiscus tiliaceus), Moluccan albizia (Albizia falcataria), sacred fig (Ficus religiosa), herba ficus (Ficus concinna), and Java apple (Syzygium samarangense). This indicates that the LVV of these tree species was more advantageous than their RSFF. However, the SA of Kashi holly (Ilex rotunda), African tulip tree (Spathodea campanulata), and camphor tree (Cinnamomum camphora) ranged from 0.5 to 3.0, indicating that the spatial distribution of these tree species on the forest floor was diverse.
SA in Foshan
The proportion of the individual trees among the top 30 tree species in urban forests in Foshan with SA < 1.0 was 80% (see Fig. S1 in Supplementary material for SA of different tree species in Foshan). This indicates that the RSFF was relatively large in the urban forest parks.
The tree species with a ratio of SA > 1.0 included weeping paperbark (Melaleuca leucadendron) and Moluccan albizia, indicating that the LVV of these tree species was slightly more advantageous than their RSFF. However, SA values of African mahogany, council tree, eugenia cumini (Syzygium hainanense), bishop wood (Bischofia javanica), and herba ficus were generally between 0.5 and 2.0, indicating that the spatial distribution of these tree species on the forest floor was diverse.
SA in Zhuhai
The proportion of the individual trees among the top 30 tree species in urban forests in Zhuhai with SA < 1.0 was 94% (see Fig. S2 in Supplementary material for SA of different tree species in Zhuhai), indicating that most RSFFs were relatively large in urban forest parks.
Chinese fan palm (Livistona chinensis) presented SA > 1.0, indicating that the LVV of this tree species was slightly more advantageous than its RSFF. However, the SA of the flame bottletree (Brachychiton acerifolius) was between 0.5 and 3.0, indicating that the spatial distribution of this tree species on the forest floor was diverse.
Differences in SA in different cities
In this study, we analyzed tree species present in all three cities and found that the SA of the same tree species differed between different urban forests (Tab. 2).
Tab. 2 - SA of respective tree species in different cities. Classes: I, SA < 0.5; II, SA 0.5-1.0; III, SA ≥ 1.0; IV, SA 0.5-3.0.
| Common name |
Scientific name |
Spatial distribution characteristics SA | Deciduous/ evergreen | Flowering period | Flowering/foliage | ||
|---|---|---|---|---|---|---|---|
| Guangzhou | Foshan | Zhuhai | |||||
| White champaca | Michelia × alba | III | II | II | Evergreen | Apr-Sept | Flowering (white), foliage |
| Giant crepe-myrtle | Lagerstroemia speciosa | II | II | II | Deciduous | May-Jul | Flowering (purple) |
| Royal poinciana | Delonix regia | I | II | I | Deciduous | Jun-Jul | Flowering (red) |
| Araguaney | Handroanthus chrysanthus | I | I | I | Deciduous | Mar-Apr | Flowering (yellow) |
| Floss silk tree | Ceiba speciosa | I | II | I | Deciduous | Oct-Dec | Flowering (pink) |
| Cotton tree | Bombax ceiba | I | II | I | Deciduous | Mar-Apr | Flowering (red) |
| Blackboard tree | Alstonia scholaris | I | II | I | Evergreen | Jun-Sept | Foliage |
| Herba ficus | Ficus concinna | III | IV | II | Evergreen | Mar-Jun | Foliage |
| Mountain ebony | Bauhinia variegata | I | II | I | Deciduous | May-Apr | Flowering (pink) |
| Camphor tree | Cinnamomum camphora | IV | II | II | Evergreen | Apr-May | Foliage |
The white champaca, a flowering foliage tree, was dominant in the LVV in Guangzhou and RSFF in Foshan and Zhuhai. Herba ficus, a foliage plant, showed differences in dominance across the three cities. The camphor tree, a foliage tree species, exhibited strong diversity in spatial distribution in Guangzhou, and was dominant in the RSFF in Foshan and Zhuhai. The flowering tree species of giant crepe-myrtle (Lagerstroemia speciosa), royal poinciana (Delonix regia), araguaney (Handroanthus chrysanthus), floss silk tree (Ceiba speciosa), cotton tree (Bombax ceiba), and mountain ebony (Bauhinia variegata), as well as the foliage species of the blackboard tree (Alstonia scholaris), were dominant in the RSFF.
SA in different regions
The top 30 tree species in the forest land located in CUA, SUA, and UFA were analyzed to compare the SA values of different tree species.
SA values of different tree species in the CUA
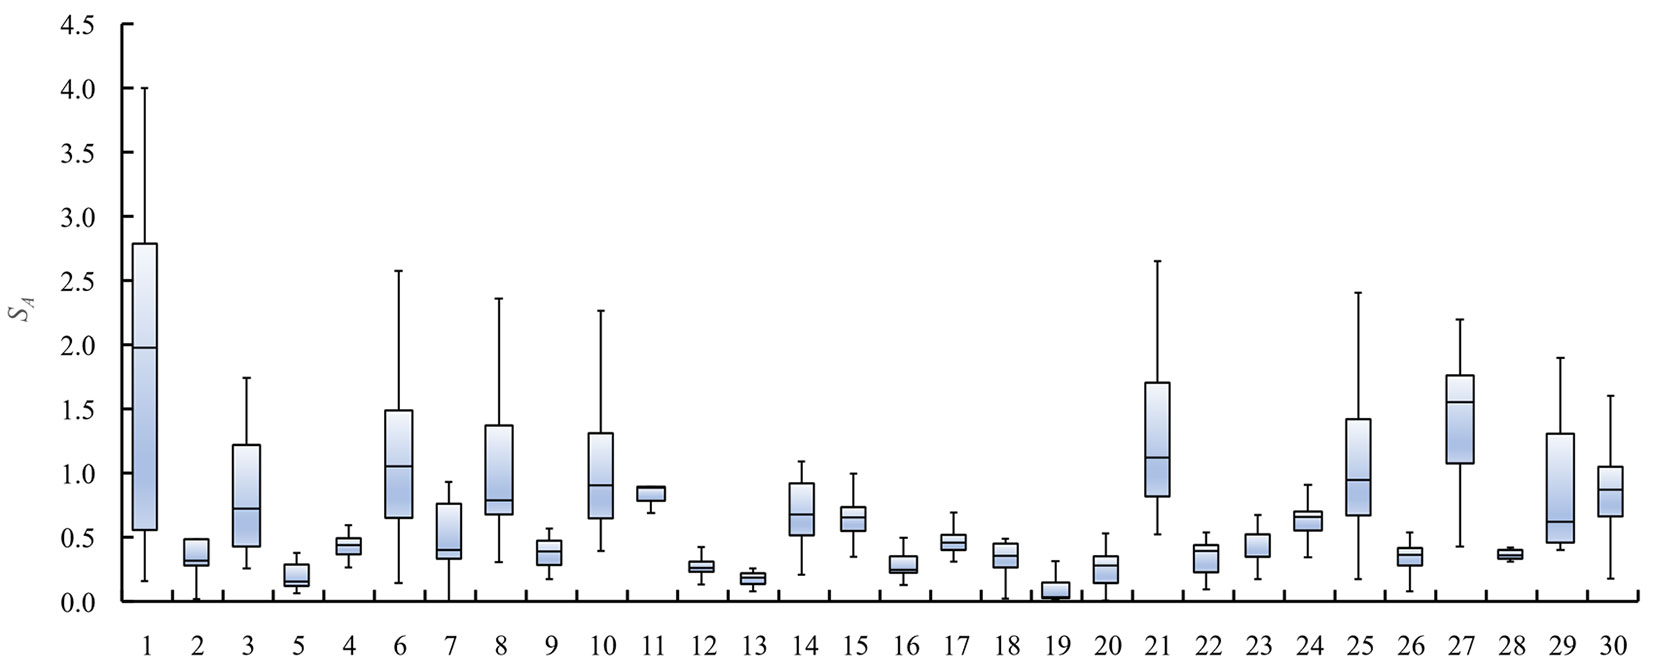
As shown in Fig. 3, the proportion of individual trees among the top 30 tree species in the forest communities in CUA with an SA < 1.0 was 78%, indicating that the RSFF of most trees in the urban forest was relatively large. The tree species with SA > 1.0 were Moluccan albizia and Java apple. This indicates that the LVV of these tree species was slightly more dominant than their RSFF. The SA for the flame bottletree, African mahogany, and herba ficus was 0.5 to 3.0, indicating that the vertical spatial distribution of these tree species was diverse.
Fig. 3 - SA of different tree species in CUA. The numbers on the x-axis represent tree species: 1, flame bottletree; 2, Australian umbrella tree (Brassaia actinophylla); 3, giant crepe-myrtle; 4, earleaf acacia; 5, Cuban royal palm; 6, African mahogany; 7, royal poinciana; 8, eugenia cumini; 9, araguaney; 10, African tulip tree; 11, cockspur coral tree; 12, hairy-fruited elaeocarpus; 13, blue jacaranda (Jacaranda mimosifolia); 14, Queensland peppermint (Eucalyptus exserta); 15, Indian mahogany; 16, Masson’s pine (Pinus massoniana); 17, mango (Mangifera indica); 18, floss silk tree; 19, pygmy date palm(Phoenix roebelenii); 20, cotton tree; 21, Moluccan albizia; 22, blackboard tree; 23, Chinese fan palm; 24, bishop wood; 25, herba ficus; 26, purple bauhinia (Bauhinia purpurea); 27, Java apple; 28, mountain ebony; 29, narra (Pterocarpus indicus); and 30, camphor tree. The numbers on the y-axis represent the value of SA.
SA of different tree species in SUA
The proportion of individual trees among the top 30 tree species in the forest communities in the SUA with SA < 1.0 was 94% (see Fig. S3 in Supplementary material for SA of different tree species in SUA), indicating that the RSFF of most trees in the urban forest was relatively large. The only tree species with SA > 1.0 was the sacred fig. This indicates that the LVV of this tree species was slightly more dominant than its RSFF. The SA was 0.5 to 3.0 for white champaca, indicating that the vertical spatial distribution for this tree species was diverse.
SA of different tree species in UFA
The proportion of individual trees with an SA < 1.0 was 83% among the top 30 tree species in the forest communities in UFA (see Fig. S4 in Supplementary material for SA of different tree species in UFA), indicating that the RSFF of most trees in the urban forest was relatively large. The tree species with SA > 1.0 were weeping paperbark, lofty fig (Ficus virens), African mahogany, sea hibiscus, and Moluccan albizia, indicating that the LVV of these tree species was slightly more dominant than their RSFF. The SA was 0 to 1.5 for Kashi holly and herba ficus, indicating that the vertical spatial distributions of these tree species were diverse.
SA values of the same tree species in different areas
We analyzed tree species in CUA, SUA, and UFA and found that the SA values of the same tree species were very similar in different areas (Tab. 3). African mahogany, a foliage tree, was more spatially diverse in CUA. It was dominant in the RSFF in SUA and in the LVV in UFA. Other tree species were relatively dominant in the RSFF.
Tab. 3 - SA of respective tree species in core urban areas (CUA), semi-urban areas (SUA), and urban fringe areas (UFA). Classes: I, SA < 0.5; II, SA 0.5-1.0; III, SA ≥ 1.0; IV, SA 0.5-3.0.
| Common name |
Scientific name |
Spatial distribution characteristics SA | Deciduous/ evergreen | Flowering period | Flowering/ foliage | ||
|---|---|---|---|---|---|---|---|
| CUA | SUA | UFA | |||||
| Giant crepe-myrtle | Lagerstroemia speciosa | II | II | II | Deciduous | May-Jul | Flowering (purple) |
| African mahogany | Khaya senegalensis | IV | I | III | Evergreen | Mar-May | Foliage |
| Royal poinciana | Delonix regia | I | II | I | Deciduous | Jun-Jul | Flowering (red) |
| Araguaney | Handroanthus chrysanthus | I | I | I | Deciduous | Mar-Apr | Flowering (yellow) |
| African tulip tree | Spathodea campanulata | II | II | II | Deciduous | Apr-May | Flowering (red) |
| Floss silk tree | Ceiba speciosa | I | II | I | Deciduous | Oct-Dec | Flowering (pink) |
| Cotton tree | Bombax ceiba | I | II | I | Deciduous | Mar-Apr | Flowering (red) |
| Blackboard tree | Alstonia scholaris | I | II | I | Evergreen | Jun-Nov | Foliage |
| Chinese fan palm | Livistona chinensis | I | I | I | Evergreen | Apr | Foliage |
| Bishop wood | Bischofia javanica | II | I | I | Evergreen | Apr-May | Foliage |
| Mountain ebony | Bauhinia variegata | I | II | I | Deciduous | Mar-Apr | Flowering (pink) |
| Camphor tree | Cinnamomum camphora | IV | II | II | Evergreen | Apr-May | Foliage |
SA of different types of urban forests
SA of different tree species in closed forests
Fig. 4 shows that the proportion of individual trees with SA < 1.0 was 84% among the top 30 tree species in closed forests, indicating that the RSFF of most tree forests in the urban forest was relatively large. The tree species with SA > 1.0 were council tree and Moluccan albizia, suggesting that their LVV was more dominant than their RSFF. SA was 0 to 2.0 for the sausage tree, African mahogany, eugenia cumini, and herba ficus, indicating that the vertical spatial distribution of these tree species was diverse.
Fig. 4 - SA of different tree species in closed forests. 1, white champaca; 2, giant crepe-myrtle; 3, Cuban royal palm; 4, sausage tree (Kigelia africana); 5, African mahogany; 6, Taiwanese sweet gum; 7, royal poinciana; 8, council tree; 9, eugenia cumini; 10, Hong Kong orchid tree; 11, araguaney; 12, African tulip tree; 13, hairy-fruited elaeocarpus ; 14, golden shower tree; 15, Queensland peppermint; 16, mango; 17, floss silk tree; 18, pygmy date palm; 19, cotton tree; 20, Moluccan albizia; 21, blackboard tree; 22, Chinese fan palm; 23, bishop wood; 24, Hainan oil-fruit tree; 25, burflower-tree; 26, Madagascar almond tree (Terminalia neotaliala); 27, dieng-kachiri; 28, purple bauchinia; 29, mountain ebony; and 30, camphor tree. The numbers on the y-axis represent the value of SA.
SA of different tree species in open woodlands
The proportion of individual trees among the top 30 tree species in open woodland with SA < 1.0 was 90% (see Fig. S5 in Supplementary material for SA of different tree species in open woodlands), indicating that the RSFF of most trees in the urban forest was relatively large. The SA of golden jasmine tree (Radermachera hainanensis) was > 1.0. This suggested that the LVV of this tree species was more dominant than its RSFF. The SA for the flame bottletree, African mahogany, and council tree was 0 to 2.5, indicating that the vertical spatial distributions of these tree species were diverse.
SA of different tree species in forest areas close to water bodies
The proportion of individual trees among the top 30 tree species in forest areas close to water bodies with SA < 1.0 was 88% (see Fig. S6 in Supplementary material for SA of different tree species in forest areas close to water bodies), indicating that the RSFF of most trees in the urban forest was relatively large. The tree species with SA > 1.0 were the Cuban royal palm (Roystonea regia), lofty fig, the blackboard tree, and Chinese fan palm, suggesting that the LVV of these tree species was more dominant than their RSFF. The SA for weeping paperbark was 0 to 2.0, indicating that the vertical spatial distribution of this tree species was diverse.
SA of different tree species in forest areas beside buildings
The proportion of individual trees among the top 30 tree species in forest areas beside buildings with SA < 1.0 was 83% (see Fig. S7 in Supplementary material for SA of different tree species in forest areas beside buildings), indicating that the RSFF of most trees in the urban forest was relatively large. The tree species with SA > 1.0 were white champaca, weeping paperbark, African mahogany, and eugenia cumini. This indicates that the LVV of these tree species was slightly better than their RSFF. The SA for tiger’s claw (Erythrina variegata) and sacred fig was 0 to 2.0, indicating that the vertical spatial distribution of these tree species was diverse.
SA of same tree types in different urban forests
Analyzing the tree species in the closed forest, open woodland, forest areas close to water bodies, and forest areas beside buildings revealed that the SA values of the same tree species were very similar in different types of urban forests (Tab. 4). The LVV of the forest areas close to water bodies was dominated by Cuban royal palm and the blackboard tree, which are foliage tree species. The closed forest, open woodland, and forest areas beside buildings primarily contributed to the RSFF. Different tree species were relatively dominant in the RSFF in different types of urban forests.
Tab. 4 - SA of the same tree species in different types of forests. Classes: I, SA < 0.5; II, SA 0.5-1.0; III, SA ≥ 1.0; IV, SA of 0-3.0.
| Common name |
Scientific name |
Spatial distribution characteristics SA | Deciduous/ evergreen | Flowering period | Flowering/ foliage | |||
|---|---|---|---|---|---|---|---|---|
| Closed forest |
Open woodland |
Forest areas close to water bodies |
Forest areas beside buildings |
|||||
| Giant crepe-myrtle | Lagerstroemia speciosa | II | II | II | II | Deciduous | May-Jul | Flowering (purple) |
| Cuban royal palm | Roystonea regia | I | I | III | I | Evergreen | Mar-Apr | Foliage |
| Araguaney | Handroanthus chrysanthus | I | I | I | I | Deciduous | Mar-Apr | Flowering (yellow) |
| Mango | Mangifera indica | I | I | II | I | Evergreen | Jan-Feb | Foliage |
| Floss silk tree | Ceiba speciosa | I | I | II | I | Deciduous | Oct-Dec | Flowering (pink) |
| Cotton tree | Bombax ceiba | I | I | I | I | Deciduous | Mar-Apr | Flowering (red) |
| Blackboard tree | Alstonia scholaris | I | I | III | I | Evergreen | Jun-Nov | Foliage |
| Bishop wood | Bischofia javanica | I | II | I | I | Evergreen | Apr-May | Foliage |
| Madagascar almond tree |
Terminalia neotaliala | I | I | I | I | Evergreen | - | Foliage |
| Mountain ebony | Bauhinia variegata | I | I | I | I | Deciduous | Mar-Apr | Flowering (pink) |
| Camphor tree | Cinnamomum camphora | II | II | II | II | Evergreen | Apr-May | Foliage |
Discussion
Point cloud generated by LiDAR scanner can obtain LVV and RSFF
In this study, we used a handheld SLAM-100 LiDAR scanner to survey every tree in the quadrats. Compared with the research time and cost of previous research methods ([43], [30], [8], [32], [5]) that used empirical formulas to calculate the LVV and RSFF using tree crown and branch height data, the research time and cost in this study were greatly reduced ([45], [46]). Using LiDAR to generate point cloud data, without considering tree shape, reduced the requirement for personnel and the research accuracy was improved ([34]). The LiDAR scanner was used to monitor LVV and RSFF for a prolonged period and to analyze the temporal pattern of the spatial distribution characteristics of trees. This would allow the Urban Landscaping Department to formulate corresponding strategies to consider the LVV and RSFF in order to achieve ecological and social benefits. However, the LiDAR scanner still had some limitations in terms of tree recognition, similar to the conclusion of research based on the use of backpack LiDAR ([17]). In this study, the tree species identification method involved artificial statistics, and a fully automatic process for calculating the LVV and RSFF was not achieved. When the sample size of trees was large or the density of shade was high, the calculation efficiency was limited. Therefore, a tree species identification algorithm should be used in the future to produce a rich database of the basic morphology of different tree species so that they can be identified intelligently and accurately, and the LVV and RSFF of urban forests can be obtained fully automatically.
Regional differences affect the spatial distribution characteristics of urban forests
The spatial allocation strategy for urban forests in cities did not only fully elucidate and efficiently utilize the limited urban land resources, but improved the landscapes of urban forests and provided high-quality environments for citizens and animals ([18]). The spatial distribution characteristics of urban forests changed with the climate environments and greening management strategies of different cities. This study indicated that the proportion of LVV of royal poinciana, floss silk tree, cotton tree, blackboard tree, and mountain ebony in Guangzhou and Zhuhai was less than 0.5, whereas the proportion of LVV in Foshan was greater than 0.5. The vertical structural distributions of these trees in different cities may differ due to various factors, such as planting time and soil conditions. The distribution of foliage tree species, such as herba ficus and camphor tree, was more diverse in the LVV than in the RSFF in different cities. This may occur because these tree species are strongly disturbed by human activity in urban forests. In the process of forest community development, the vertical structure of trees will be affected by factors such as competition and trees in the understory. Additionally, spatial heterogeneity, human disturbance, disasters, and other environmental factors also affect the vertical structural distribution of trees. The main influencing factors of the RSFF are the crown projection area and the lowest point of branching.
Assessing the potential of social media for estimating the RSFF of urban forests
Similar to previous research, this study took the size of the RSFF as a proxy to estimate the recreational potential of urban forests. The main factor influencing the RSFF observed in this study was the relationship between the canopy projection area and the lowest branch point. In the urban environment, the empty understory, small trees, and shrubs together constitute the RSFF ([39]). The small trees and shrubs play an important role in regulating the RSFF and LVV. Chen et al. ([4]) studied the LVV of artificial green spaces in a rehabilitation hospital, reporting that trees and shrubs should be reasonably allocated in developing the plant configuration of small-scale artificial green spaces and that the vertical coverage area of greenery should be expanded. In addition, trees with a large crown should be planted, and indiscriminate tree planting should be avoided. However, the focus of the above research was the size of the RSFF. People are the key users of urban forests. The quality and function of the RSFF cannot be accurately evaluated without monitoring people’s recreational activities ([31]). Such monitoring data was often difficult to obtain in previous large-scale RSFF assessments. Owing to the rapid development of social media, such as WeChat, Weibo, and 2bulu, we can evaluate the utilization of the RSFF with the aid of relevant positioning data. It is possible to conduct a comprehensive evaluation of the size and usage frequency of the RSFF using social media, and it can more reasonably reflect and estimate the RSFF of urban forests. This is also the mainstream direction of recreational urban forest use estimation worldwide ([15]).
Dynamic assessment of the spatial distribution characteristics and their impact on the ecological function of urban forests
Dynamic temporal changes in the spatial distribution of LVV and RSFF are caused by forest succession, growth, and phenology; evaluating these changes is one of the most effective strategies to further explore the ecological and landscape services provided by urban forests. By considering the LVV and RSFF, this study focused on factors such as tree size, spatial distribution, and distribution strategy, providing static research results; however, we did not consider the effect of time in relation to the spatial distribution of the LVV and RSFF. This remains a limitation of this research - the dynamics of the LVV and RSFF change over time with changes in forest succession, growth, and phenology. Therefore, the construction of index parameters reflecting this dynamic process can aid in scientifically evaluating the ecological and recreational landscape functions of urban forests, such as the temporal stability of the LVV and RSFF. In addition to the visual landscape of the LVV and recreational effects of the RSFF mentioned in this study, the spatial distribution characteristics and forms of urban forests will also affect ecological functioning, such as the thermal comfort and cooling effects of tree shading ([26]). Therefore, it is necessary to study the characteristics and forms of LVV and RSFF in detail in the future and conduct correlation analysis of the functions of urban forests in order to maximize their ecological benefits.
Conclusions
Comparing the LVV with the RSFF revealed the following: the LVV of flowering tree species, such as giant crepe-myrtle, royal poinciana, araguaney, floss silk tree, cotton tree, blackboard tree, and mountain ebony, was relatively small in different cities. The LVVs of foliage trees, such as white champaca, herba ficus, and camphor tree, were relatively large in Guangzhou, whereas they were relatively small in Zhuhai. In the CUA, SUA, and UFA of urban forests, the same tree species accounted for small proportions of the LVV. Among them, African mahogany, a foliage tree, showed a highly diverse spatial distribution in CUA; its RSFF was dominant in SUA, while its LVV was dominant in UFA. The proportion of the LVV of foliage trees, such as Cuban royal palm and blackboard tree, in the forest areas close to water was relatively large, whereas the proportions of the LVVs of araguaney, mango, floss silk tree, cotton tree, blackboard tree, bishop wood, Madagascar almond tree, mountain ebony, and camphor tree in the closed forest, open woodland, forest areas close to water bodies, and forest areas beside buildings were relatively small.
Urban forests should be configured according to the spatial distribution characteristics of different tree species. For example, the SA of giant crepe-myrtle was stable and ranged between 0.5 and 1.0 in different cities, regions, and types of urban forests, whereas the LVV of araguaney was less than 0.5, suggesting that external interference did not considerably affect these two species. Araguaney is a flowering tree; its yellow flowers are highly ornamental when in full bloom. However, its crown width is small after the flowering period, and the LVV is small as well. Therefore, this tree is suitable for planting in areas with ornamental landscaping requirements, but not in areas that require shade for recreational purposes.
The LVV and RSFF are both complementary and contradictory. An increase in the LVV can effectively improve ecological benefits. However, it may also decrease the RSFF and reduce the cooling benefits of the tree crown for urban residents. Therefore, the spatial distribution strategy of tree species should be carefully considered according to the main functional requirements when allocating urban trees.
Abbreviations
CUA: Core urban areas; DBH : Diameter at breast height; DEM: Digital elevation model; GBA: Greater Bay Area; LVV: Living vegetation volume; RSFF: Recreational space on the forest floor; SUA: Semi urban areas; UFA: Urban fringe areas.
Author contributions
QZ: conceptualization, methodology, formal analysis, writing the original draft, review and editing; CZ: writing, review, editing and supervision; RH: investigation; WQ: investigation; YW: software and investigation.
Acknowledgments
We are grateful to all the participants who generously shared their opinions. We are thankful to Editage (⇒ https://www.editage.cn/⇒ https://www.editage.cn/) for English language editing.
Funding
This study was supported by the Forestry Science and Technology Innovational Specific Project of Guangdong Province (grant no. 2022KJCX009 and no. 2021KJCX009).
References
Gscholar
Gscholar
Gscholar
Gscholar
Gscholar
Gscholar
Gscholar
Gscholar
Gscholar
Gscholar
Gscholar
Gscholar
Gscholar
Gscholar
Gscholar
Gscholar
Gscholar
Gscholar
Gscholar
Gscholar
Gscholar
Gscholar
Gscholar
Authors’ Info
Authors’ Affiliation
Chi Zhang 0000-0002-5301-0312
Rouxuan Hu
Wanhui Qian 0000-0001-8079-1348
Guangdong Academy of Forestry, Guangdong Provincial Key Laboratory of Silviculture Protection and Utilization, Guangzhou 510520 (China)
Guangdong Lingnanyuan Exploration and Design Co., Ltd., Guangzhou 510663 (China)
Corresponding author
Paper Info
Citation
Zhao Q, Zhang C, Hu R, Qian W, Wei Y (2023). Evaluation of urban forest spatial distribution characteristics in Guangdong - Hong Kong - Macao Greater Bay Area. iForest 16: 136-143. - doi: 10.3832/ifor4268-016
Academic Editor
Raffaele Lafortezza
Paper history
Received: Nov 19, 2022
Accepted: Feb 26, 2023
First online: May 16, 2023
Publication Date: Jun 30, 2023
Publication Time: 2.63 months
Copyright Information
© SISEF - The Italian Society of Silviculture and Forest Ecology 2023
Open Access
This article is distributed under the terms of the Creative Commons Attribution-Non Commercial 4.0 International (https://creativecommons.org/licenses/by-nc/4.0/), which permits unrestricted use, distribution, and reproduction in any medium, provided you give appropriate credit to the original author(s) and the source, provide a link to the Creative Commons license, and indicate if changes were made.

Web Metrics
Breakdown by View Type
Article Usage
Total Article Views: 25787
(from publication date up to now)
Breakdown by View Type
HTML Page Views: 19873
Abstract Page Views: 3155
PDF Downloads: 2281
Citation/Reference Downloads: 0
XML Downloads: 478
Web Metrics
Days since publication: 1136
Overall contacts: 25787
Avg. contacts per week: 158.90
Article Citations
Article citations are based on data periodically collected from the Clarivate Web of Science web site
(last update: Mar 2025)
(No citations were found up to date. Please come back later)
Publication Metrics
by Dimensions ©
Articles citing this article
List of the papers citing this article based on CrossRef Cited-by.
Related Contents
iForest Similar Articles
Research Articles
The concept of green infrastructure and urban landscape planning: a challenge for urban forestry planning in Belgrade, Serbia
vol. 11, pp. 491-498 (online: 18 July 2018)
Research Articles
Evaluation of urban forest landscape health: a case study of the Nanguo Peach Garden, China
vol. 13, pp. 175-184 (online: 02 May 2020)
Review Papers
Green Infrastructure as a tool to support spatial planning in European urban regions
vol. 6, pp. 102-108 (online: 05 March 2013)
Research Articles
The willingness of inhabitants in medium-sized city and the city’s surroundings settlements to pay for recreation in urban forests in Poland
vol. 14, pp. 483-489 (online: 27 October 2021)
Technical Reports
Assessment of allergenic potential in urban forests: a case study of the Royal Park of Portici in Southern Italy
vol. 13, pp. 376-381 (online: 25 August 2020)
Research Articles
How do urban dwellers react to potential landscape changes in recreation areas? A case study with particular focus on the introduction of dendromass in the Hamburg Metropolitan Region
vol. 7, pp. 423-433 (online: 19 May 2014)
Research Articles
Estimation of fuel loads and carbon stocks of forest floor in endemic Dalmatian black pine forests
vol. 13, pp. 382-388 (online: 01 September 2020)
Research Articles
Green oriented urban development for urban ecosystem services provision in a medium sized city in southern Italy
vol. 7, pp. 385-395 (online: 19 May 2014)
Research Articles
The recreational valuation of a natural forest park using travel cost method in Iran
vol. 2, pp. 85-92 (online: 10 June 2009)
Research Articles
Scale dependency of the effects of landscape structure and stand age on species richness and aboveground biomass of tropical dry forests
vol. 16, pp. 234-242 (online: 23 August 2023)
iForest Database Search
Search By Author
Search By Keyword
Google Scholar Search
Citing Articles
Search By Author
Search By Keywords
PubMed Search
Search By Author
Search By Keyword


