
The concept of green infrastructure and urban landscape planning: a challenge for urban forestry planning in Belgrade, Serbia
iForest - Biogeosciences and Forestry, Volume 11, Issue 4, Pages 491-498 (2018)
doi: https://doi.org/10.3832/ifor2683-011
Published: Jul 18, 2018 - Copyright © 2018 SISEF
Research Articles
Abstract
The beginning of the 21st century has witnessed a growth in our understanding of the importance of planning urban landscapes in the context of urban population growth and unpredictable climatic conditions. In the search for responses to the challenges set by the development of contemporary urban landscapes, researchers have offered solutions based on the concept of sustainable and resilient cities, whose spatial development would be based on an interdisciplinary approach to strategy development: biodiversity, urban ecological networks and connectivity, multifunctionality and modularity. Although the concepts of a green infrastructure, in their spatial and functional dimensions, allow the application of such strategies, there are still problems when it comes to implementation and measuring the results achieved. At the same time, there is a growing discussion of the important role played by urban forestry in the context of the collaborative planning of urban landscapes and the application of the ideas of a green infrastructure. The key question is: what are the modalities of application of the concept of green infrastructure in the process of planning the development of the modern city and how can the resulting benefits be evaluated? With the modalities of application of the concept of green infrastructure in mind, we discuss its multi-scale and multifunctional dimensions as applied in the case of Serbia. The realisation of the green infrastructure concept is presented through the example of the Urban Forest Management Plan for the City of Belgrade - Mladenovac Municipality. The results of using the spatial-ecological approach in creating the plan and establishing connectivity as a new aim in forest management planning show that the implementation of the green infrastructure concept, and the achieved multifunctional ecosystem values, can be presented on the basis of the parameters of landscape metrics. In light of the new urban world, future research should focus on the application of the landscape ecological approach of the green infrastructure concept in collaborative planning at the urban landscape scale, which allows the creation of ecosystem services and benefits to human well-being.
Keywords
Green Infrastructure (GI), Urban Landscape Planning, Urban Forestry, Ecosystem Services, Biodiversity, Recreation, Connectivity
Introduction
The 21st century is the century of the new urban world. Today, more than 80% of the European population lives in cities, which has led to a spatial expansion of cities that is four times greater than the expansion of the population ([39], [40], [46]). These processes are changing the urban landscape pattern, as can be seen in the homogenisation of the landscape structure (a dramatic expansion of built-up areas and sealed soil - [49], [43]) and the functional disintegration of urban landscapes ([6]). These changes are leading to a loss of landscape connectivity and a consequent decline in the level of landscape stability. Taking into account the impact of climate change on the urban landscape, all these factors mean that the quality of urban life has become quite unpredictable.
There has be a recent surge of interest in approaching urban landscapes “in the sense of being new and different from what was known before”, where “novel urban ecosystems have “no analog” and are increasingly the subject of research to understand their origins, ecological trajectories and opportunities for developing new management goals and approaches” ([3]). Ahern ([2]) suggested some strategies for interdisciplinary discourse on urban sustainability and resilience in urban landscape planning. These include: biodiversity, urban ecological networks and connectivity, multifunctionality, redundancy and modularity and adaptive design. Much research adopts a response to the challenges of modern urban development by utilising the concept of green infrastructure (GI), which is ontologically based on Ahern’s strategies for urban landscape planning ([2], [33], [28], [24]).
The concept of green infrastructure is defined as a strategically planned network of natural and semi-natural elements (abbreviated hereafter to NSN) with other environmental features designed and managed to deliver a wide range of ecosystem services ([20]). This concept integrates two important dimensions. First, a green infrastructure has the multi-scale spatial dimension of a coherent ecological network based on the physical (spatial) and functional connectivity between different types of green areas at various spatial levels (local, regional, national, international - [1]), with various elements going to make up its physical structure ([7]). Second, a green infrastructure has multifunctional dimensions that are realised through a variety of ecosystem services, which are classified in the MA ([34]) as provisioning, regulating, cultural and supporting services. Supporting services maintain other ecosystem services where biodiversity, through natural habitats and the services of their plant and animal communities, has a central role ([46]).
As a result of all the predicted benefits, the European Union’s recent climate adaptation strategy ([20]) promotes the adoption of green infrastructure and ecosystem-based approaches. In particular, Lafortezza et al. ([28]) presented a comprehensive analysis of green infrastructure initiatives across Europe, which resulted in the proposal of a new “Green Infrastructure Framework” as a unifying human-centred approach to multi-scale (spatial and temporal) planning for ecosystem and well-being services. It consists of “ecological hubs, links and multi-functionality in land-use management” but adds “drivers” for GI planning: ecosystem services, human well-being, social cohesion, biodiversity and sustainable development ([28]). According to Hansen & Pauleit ([24]) the multifunctionality of a green infrastructure network needs to take connectivity into account, because connectivity represents the spatial distribution and relationships of GI elements and, consequently, the distribution of the benefits they provide. Among examples of the realisation of the green infrastructure concept on different scales in Europe, urban landscapes appear to be an especially useful level at which to develop, implement and deliver a green infrastructure.
Despite a variety of purposes that go beyond the concept of green infrastructure, we lack the tools and approaches to measure the impact of the actual implementation and delivery, i.e., the social and environmental benefits ([35], [18], [25], [28]). At the same time, the lack of quantitative data is often mentioned in scientific literature as a problem when applying ecosystem services and a green infrastructure in practice ([4]).
Ahern ([1], [2]) describes the concept of planning a landscape as a green infrastructure where landscape ecology has a central role in providing tools to understand, model and manage the frequency, magnitude and extent of urban ecosystem dynamics. The main principles of the landscape ecology approach that are relevant to the implementation of a green infrastructure in urban landscape planning are:
- a landscape-scale approach with an explicit recognition of the relationships between pattern and process and an emphasis on structural and functional connectivity ([9], [36]);
- a multifunctional approach which aims to combine and link different ecosystem services with a connectivity dependent function (i.e., in relation to human health (recreation) and secure intact ecological systems and biodiversity) and, in that way, use the limited urban space more effectively ([1], [2], [28]).
In light of the new urban world, Randrup et al. ([42]) have stressed that forestry is becoming more urban and urban forestry is at least as much about urbanity as it is about forestry. Urban forests serve as areas for recreation and entertainment and also spaces of high attention in the maintenance of biodiversity. According to the new urban world, new urban forestry should be seen as “only one of a series of strategic, interdisciplinary and participatory approaches aimed at optimising the planning and management of urban green structure in order to multiply the benefits to urban society” ([42]). This has led to the emergence of new, integrated concepts and approaches. In this regard, as a result of exploring approaches and forest issues, Lafortezza et al. ([29]) reached the conclusion that forest planning and management have to be made within the landscape context with the integration of landscape ecology principles.
As result of the ratification of the European Landscape Convention, the Spatial Plan of The Republic of Serbia recognises a green infrastructure as one of the ways of applying the landscape-ecological principle of connectivity within spatial planning at the national level ([47]). At the regional level, the Draft Plan for the General Regulation of Green Spaces of the City of Belgrade (2014) developed a green infrastructure and its elements through the core, inner and outer ring of the green spaces system. There is an obvious problem of legal adoption and implementation at the local level of planning and managing due to the lack of instruments for its delivery.
Recognising the importance of the green infrastructure concept for the urban landscape future, as well as the problems of its implementation and the lack of tools for measuring its values, in this paper we aim to find modalities of application of the GI concept in the process of planning the development of the modern city and to find how the resulting benefits can be evaluated. Using the examples of the Urban Forest Management Plan for the City of Belgrade - Mladenovac Municipality ([32]), this is achieved through addressing the following objectives: (1) analysing the connectivity as a multifunctional value unifying biodiversity and recreation as ecosystem services that are represented by NSN elements relevant to the urban landscape pattern; (2) proposing measures (landscape metric parameters) for connectivity as outcomes of a green infrastructure; (3) providing directions for future research by proposing a landscape ecology approach and structural and functional connectivity between green infrastructure elements (which provide different ecosystem services) as one of the new goals in the practice of urban forestry planning.
Material and methods
Study area
The investigation area is defined by the administrative boundaries of the Municipality of Mladenovac (44° 26′ 56.68″ N, 20° 41′ 50.16″ E) located in the central part of Serbia (Fig. 1). The Municipality of Mladenovac, a suburban part of the administrative area of the Belgrade metropolitan area, covers 338.64 km2. The municipality has a population of more than 53,000 inhabitants, of whom more than half live in rural parts of the municipality.
Fig. 1 - Location of the Municipality of Mladenovac in the European, Serbian and Belgrade metropolitan context.
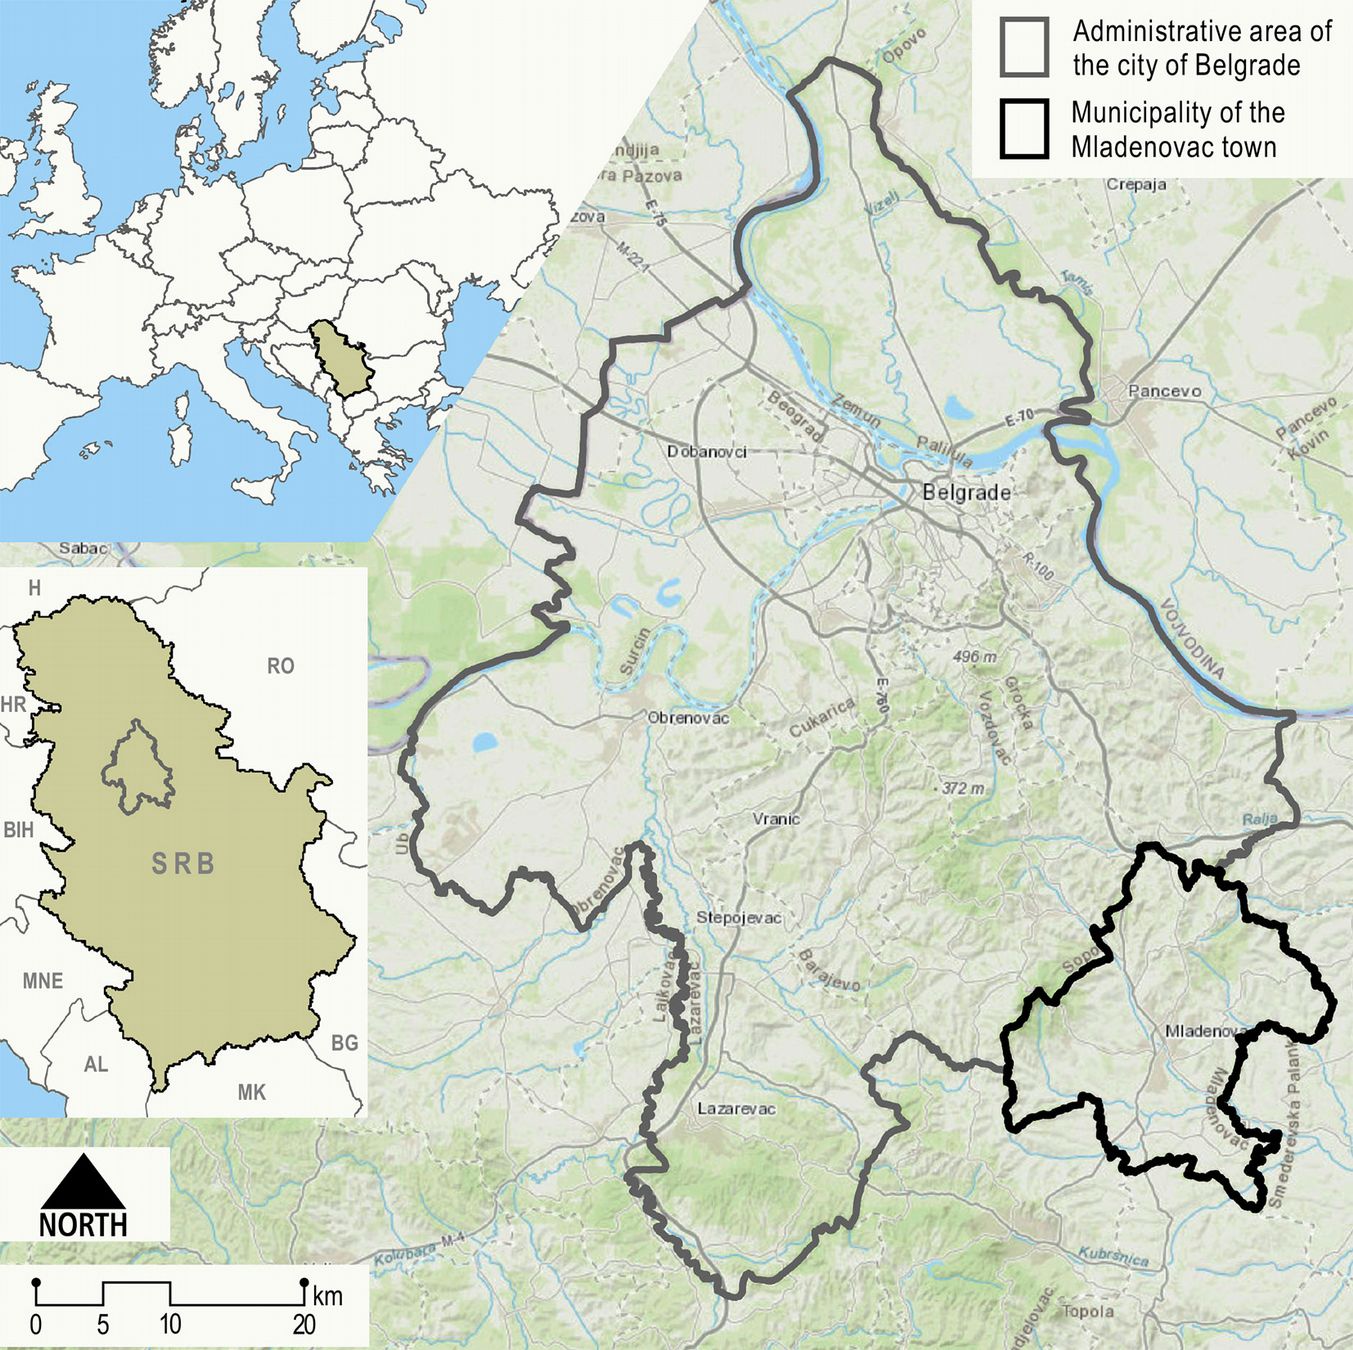
The landscape of the municipality is defined as a broad valley with undulating relief consisting of smaller spatial units between alluvial plains of varying width. In morphological terms, it can be characterised as a combination of flatlands and hilly relief with altitudes ranging from 113 to 518 m a.s.l. The climate is of the mild continental type, with an annual average temperature of 10.7 °C and average annual precipitation of 649 mm.
Urbanisation has the form of unplanned settlements characteristic of the urban fringe, whose creation and development were determined mainly by natural conditions, transport infrastructure and the vicinity of Belgrade. More significant settlement expansion and urbanisation have been recorded in recent decades.
The expansion of settlements and the destruction of autochthonous vegetation in the municipality constitute key factors of structural modification in the use of space, resulting in a drastic reduction of the area under forest from over 50% to the current level of about 12.5%. Land use indicates the importance of agricultural activity (agricultural land use accounts for about 68.8% of the total municipal area), which is the reason why most of the natural forests have been destroyed. On the whole, forests mostly constitute remnant landscape elements of Hungarian and Turkish oak forest (Quercetum frainetto-cerris) that have survived the expansion of urban and agricultural land-use during the last and current centuries. This part of Serbia is a segment of the largest ecoregion in Europe, temperate broadleaf and mixed forests which are simultaneously, on a European level, areas subject to intensive urbanisation. At the global level this ecoregion is the most frequently analysed in the context of biodiversity loss and conservation ([14]).
Considering the global trends of urbanisation and land use changes on the urban fringe, the Assembly of the City of Belgrade adopted the Belgrade Afforestation Strategy in 2011 on the basis of the Law on Environmental Protection. The implementation of this Strategy through the Urban Forest Management Plan ([32]), has resulted in the afforestation of 416.86 ha of land owned by the municipality. The specific topography of the sites and the ceno-ecological zonality of the landscape were the main guides for the selection of tree species which belong to the units of natural potential vegetation of broader areas: forests of Hungarian Oak and Turkish Oak (Quercetum-fraineto cerris), forests of Common Oak and Tall Greenweed (Quercetum roboris, Genisto elatae) and forests of Sessile Oak and Hornbeam (Quercio-Carpinetum).
Theoretical background of connectivity as a multifunctional value
The first step towards the establishment of a theoretical methodological basis was to analyse the functional and spatial (structural) dimensions of the concept of green infrastructure, with the aim of establishing the landscape metric parameters suitable for measuring connectivity as the main multifunctional outcome of a green infrastructure.
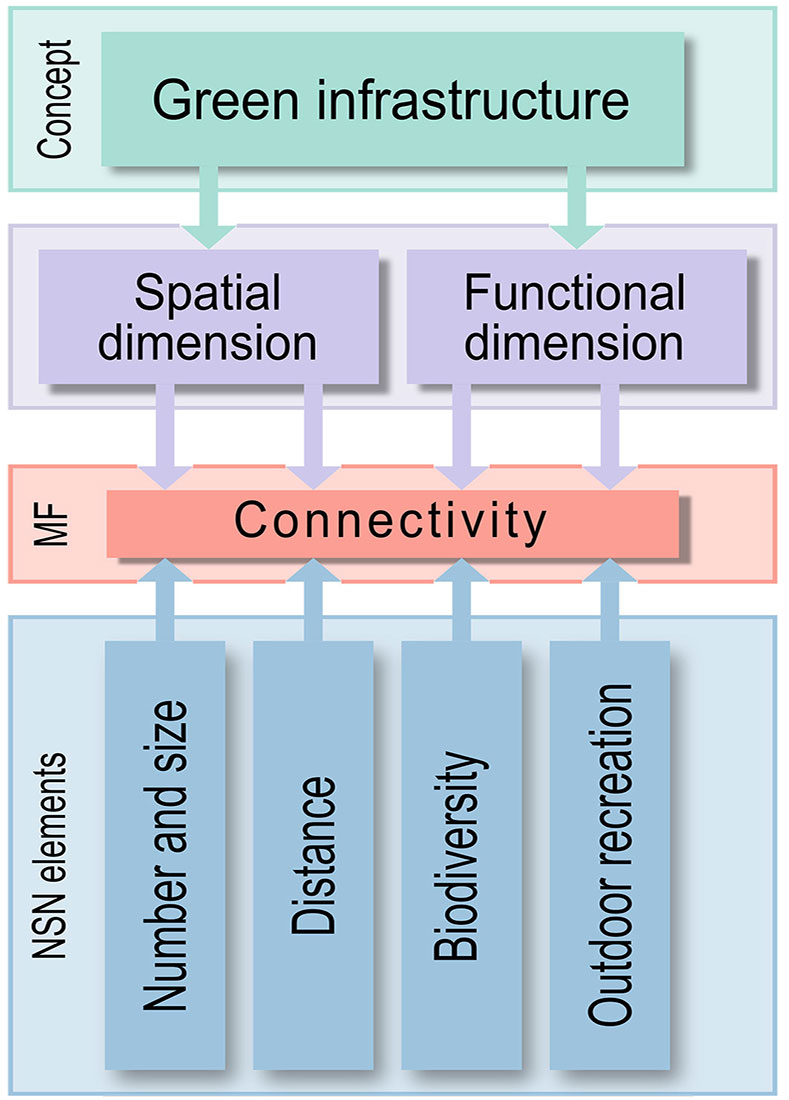
The spatial dimension of the concept of green infrastructure is shown through the presence and extent of NSN elements and the degree of the physical connection between them. The physical connectivity of the NSN landscape elements can be taken as the basic indicator of the degree of realisation of gene movement through species and population migrations, which are a dominant force in defining biodiversity at various spatial and organisational levels ([37], [45]). The multifunctional dimension of a green infrastructure is shown through ecosystem services, the function of which depends on the degree of connectivity (Fig. 2). Although connectivity is usually understood as ecological connectivity, in urban areas it is also seen as an important aspect of recreation as a social well-being or cultural ecosystem service ([38], [16]).
Fig. 2 - Conceptual framework for measuring connectivity as a multifunctional value. Lines between main boxes indicate relationships between the concept of GI, its dimension and indicators for measuring connectivity as a multifunctional value of ecosystem services and GI.
The size of landscape elements is one of the fundamental metric parameters that alone can provide essential information about the characteristics of a landscape at different organisational levels ([31]). Landscape metric parameters such as the number and size of NSN landscape elements, which indicate the intensity of fragmentation, define the value of biodiversity at the landscape level ([21]). The size metric of landscape elements strongly correlates with “species richness and the occurrence and abundance of some species” ([31]) and can be interpreted as a spatial indicator of the biodiversity level ([8], [27]). However, this metric has several limitations, among which is that it cannot illustrate spatial properties and the distribution of elements across the analysed landscape ([10]). Furthermore, working with a metric class which refers only to the size or number of NSN elements yields weaker results than using an integral metric of the structural relationship inside a landscape matrix that is hostile to natural processes (human dominated matrix types - [41]). We can, therefore, conclude that the thrust of our analysis is focused on the zones in which the influence of NSN elements is reduced or absent.
Among the various services that have a pronounced spatial aspect and for which there are also concise instruments for assessment, cultural services are poorly integrated into the measurable landscape value framework and often characterised as “intangible” and “subjective” ([11]). In the complex process of perception of the landscape, both by locals or visitors, it has been concluded that areas with a significant number of interconnected elements that are carriers of naturalness are recognised as desirable, and are thus valued more highly ([15], [30]). Although some studies identify recreation as a threat to the vitality of the ecosystem, properly planned and managed recreation can help provide a better understanding of ecological values in the area where recreation can become one of the instruments of conservation of valuable habitats ([19]). Regarding outdoor recreation, we used some of the conclusions reached in previous studies, primarily Chan et al. ([12]) and Weyland & Laterra ([48]). According to these authors, the possibility of accomplishing outdoor recreation is conditioned by the degree of naturalness of the landscapes and the presence of NSN elements in the landscape structure. According to studies that analysed perceptions of the possibility of using forests or natural areas for recreation, for optimal usage such areas should be within walking distance and optimally within 1 km ([26]).
Measuring connectivity
In this study, connectivity was measured within the structure of the landscape at two time intervals. For the interpretation of the spatial structural elements we used the patch-corridor-matrix model ([22]). The first time interval was an interpretation of the structure of the landscape with a spatial resolution of 20 m (minimum mapping unit is 20 × 20 metres) on the basis of an orthorectified aerial image from 2011. Forest elements occupy an area of 46.50 km2 (13.73%), urban areas 36.42 km2 (10.75%) and the spatial matrix is agricultural land with 255.73 km2 (75.52%). It is important to mention that only forests can be treated as NSN homogenous landscape elements, while urban and agricultural areas have a heterogeneous structure. At the second time interval we see the landscape structure based on the Urban Forest Management Plan, which is the result of the implementation of the concept of a green infrastructure.
The landscape structure represents a domain for the formation of spatial identifiers of forest landscape elements in the form of point features with a given resolution of 20 m (Fig. 3a). This resolution allows the formation of a representative base appropriate for detecting small “bits of nature”, which are one of the “top priority ecological indispensables” ([22]) with great significance for the connectivity of NSN elements in human developed areas ([2]).
Fig. 3 - Procedures for generating an interpolated grid. Illustration of the applied technique for defining the level of connectivity between NSN elements. (a) Point data grid with 20 m resolutions which represents the spatial coverage of NSN elements; (b) generated Thiessen polygons and their centroids with added numerical attributes; (c) interpolated data that represents levels of connectivity; and (d) their locations in the actual section of the investigated area.
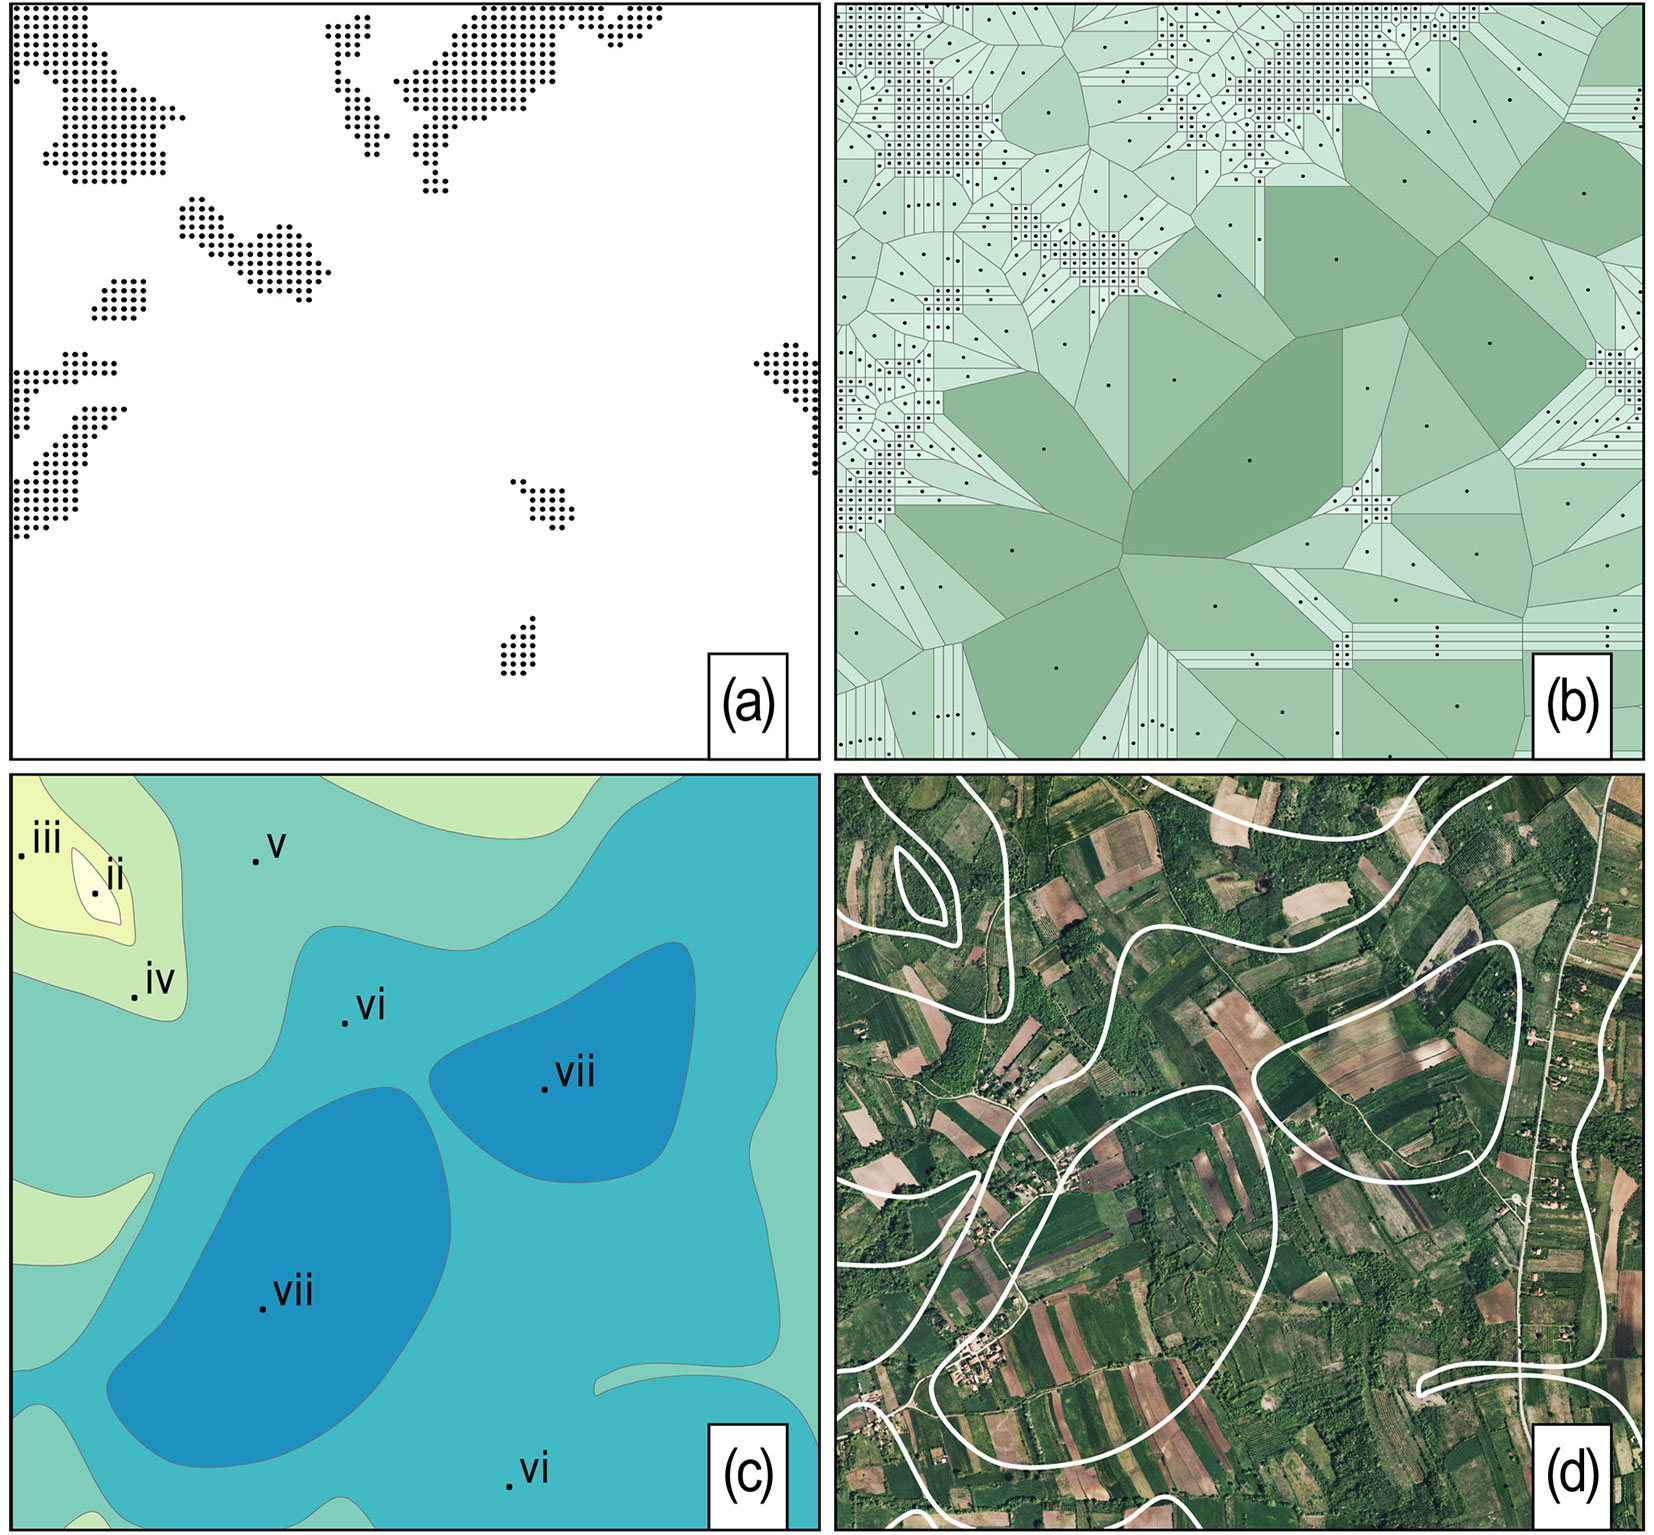
The construction of Thiessen polygons (Fig. 3b) is an appropriate method for determining the zones of spatial influence of NSN elements. This method divides the investigated area into zones that are equidistant from the NSN elements and at the same time the surfaces of the generated polygons indicate the lack of relevant patches ([23]). The areas of the polygons were treated as non-dimensional values and were added to their centroids, which are suitable for the creation of a continuous grid using interpolation techniques. An interpolated grid provides materialisation of the concept of gradients, which integrates the spatial and functional aspects of NSN elements ([13]). Given that there is no research that offers precise guidelines for the selection of an adequate model of geostatistical interpolation, an empirical Bayesian kriging was applied (Fig. 3c, Fig. 3d). This method began to emerge relatively recently in applied geostatistics and the prediction of various environmental issues. The main advantage of this model is that, with the use of multiple semivariograms, it can automatically generate a valid kriging model unlike other types of kriging that require manual adjustment ([44]).
Results and discussion
According to the defined methodological procedures, the landscape structure was analysed at two stages: (A) the condition of the structure from 2011, and (B) the condition of the structure developed in the Urban Forest Management Plan for the City of Belgrade - Mladenovac Municipality ([32]). The result was a continuous grid with data values categorised into different connectivity levels of NSN elements for the conditions A and B (Fig. 4). Continuous data values (grids) were classified using geometrical intervals which gives an appropriate balance between middle and extreme values and also gives comprehensive results which are represented in the form of numeric values and maps. The basic information from this kind of grid identifies the zones which lack NSN elements, and/or levels of connectivity. The values in the grid are numerical and represent the surface (in metres) on which the influence of NSN elements is present in terms of size and number.
Fig. 4 - Distribution of the levels of connectivity in landscape structure in 2011 (a) and landscape structure based on the Urban Forest Management Plan (b).
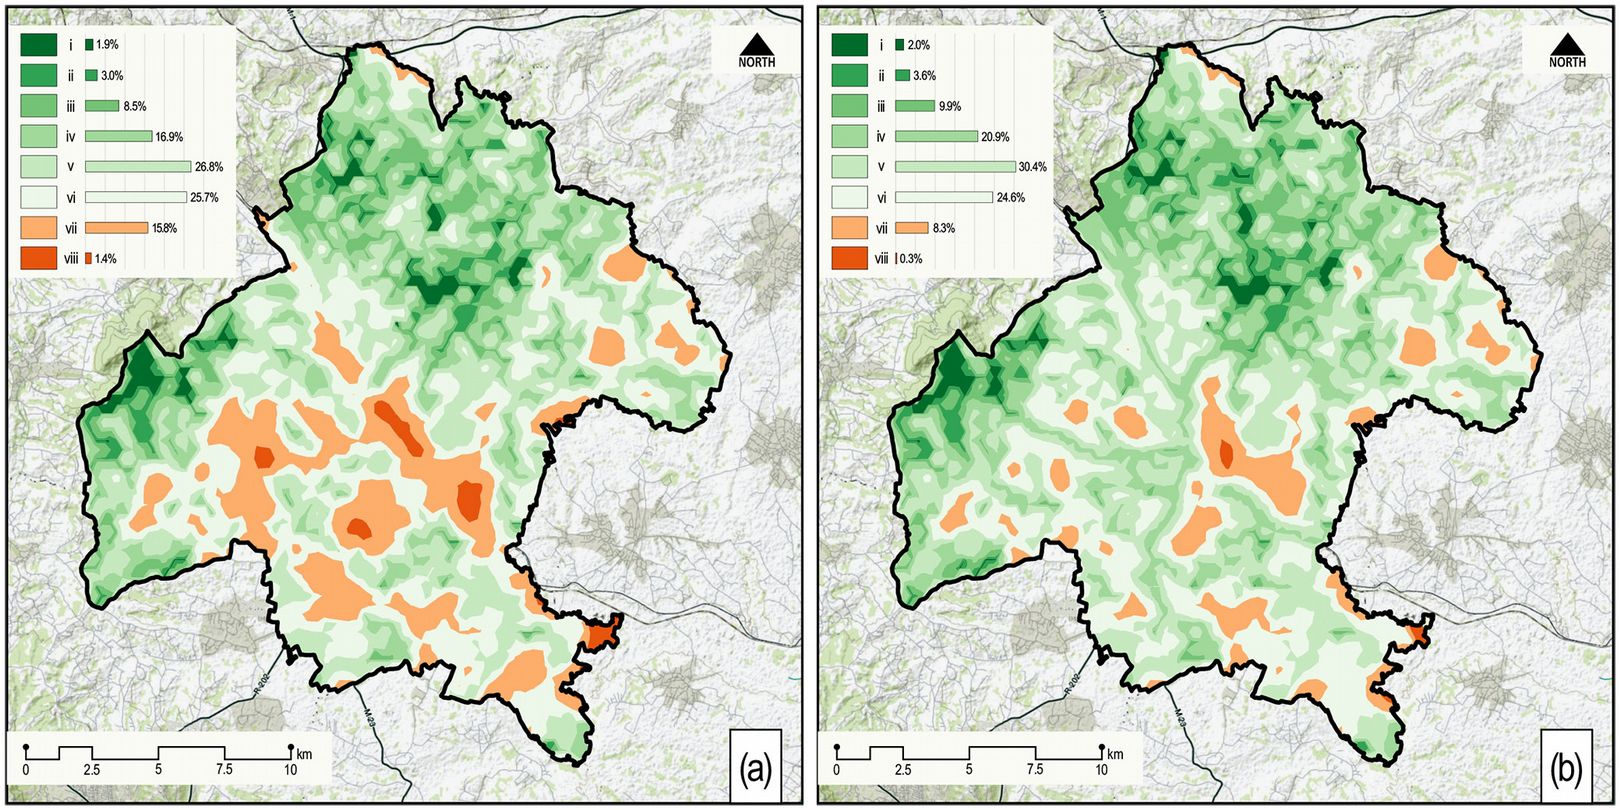
The results obtained illustrate the spatial distribution of different connectivity levels between NSN elements, in relation to two conditions of the landscape structure. A higher level of connectivity is represented by lower values in the grid, which point to a zone with a higher number of NSN elements in terms of surface and number.
Lower levels of connectivity refer to higher values in the grid and point to a lack of NSN elements in the landscape structure. The rate of change in surfaces of various levels of connectivity fits the asymmetric quadratic function, i.e., the change moves towards positive values in lower levels (i: +6.7%; ii: +18.9%; iii: +16.5), reaches a maximum of positive change at the iv (+23.4%) level and then declines with lower connectivity (v: -13.8%; vi: -4.1%; vii: -47.7%; viii: -81.1%).
It was a challenge to identify categories which reflect a multifunctional value in the achieved level of connectivity of NSN elements. The categories indicate the level of ecosystem services required for its achievement, which include both the biodiversity and outdoor recreation potential. A research approach oriented towards representing multifunctional values of a green infrastructure has determined the categorisation of level vi as a zone with established connectivity, although it appeared to show similar statistical reactions to the connectivity of levels vii and viii, i.e., a reduction in surface (by 4.1%) and a reduction of total surface of NSN elements (30.1%). However, both time intervals show a certain number of NSN elements (A: 81; B: 78) with an appropriate walking distance position (less than 1 km), which places this level of connectivity in the group of categories which possess a multifunctional level.
A total of three spatial categories were created referring to landscape structures with different levels of connectivity, and one with no connectivity of NSN elements (Fig. 5).
Fig. 5 - Categories and achievement of connectivity. The level of connectivity is represented in the landscape metric parameters (the number, surface and distance of NSN elements) and nominal and ordinal scale.
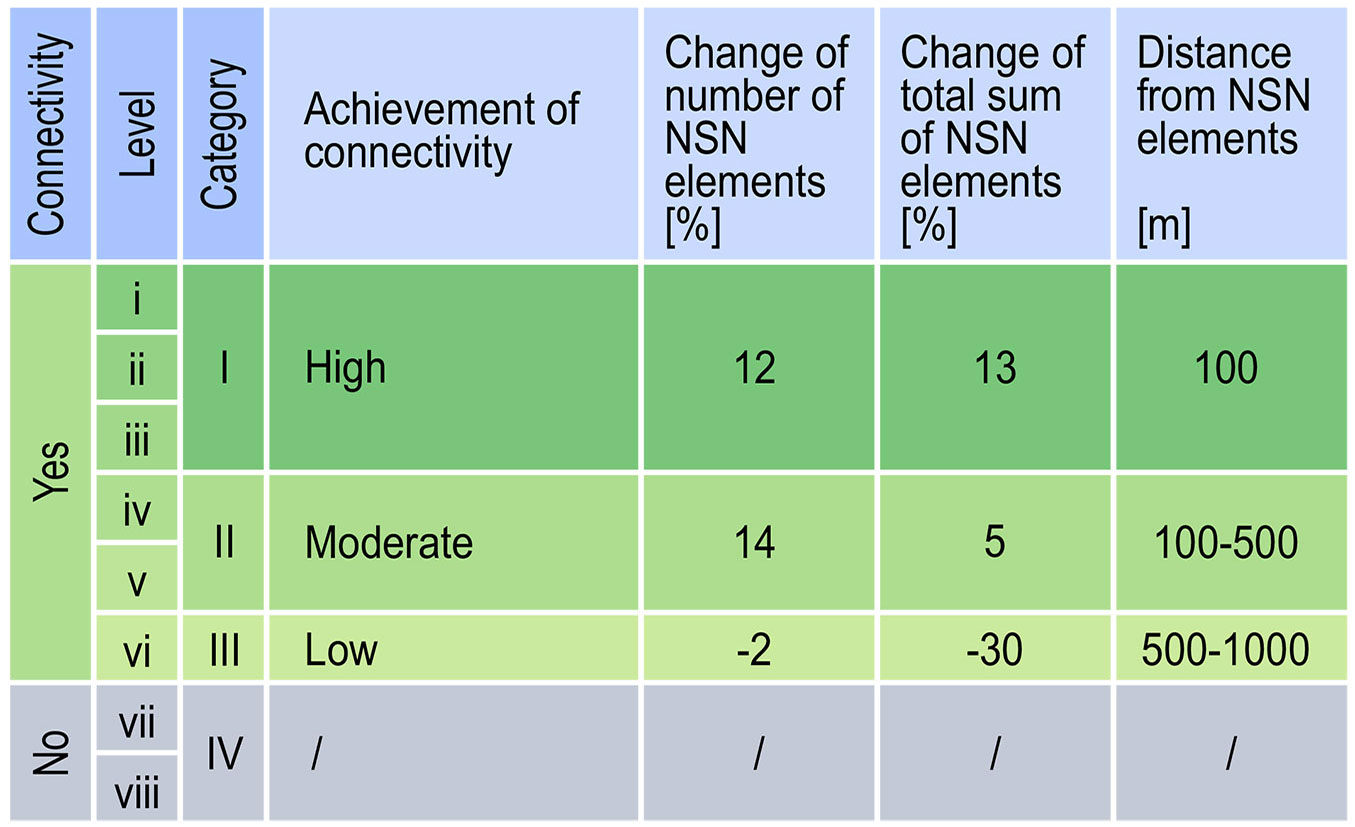
The categories with established connectivity of NSN elements cover 280.15 km2 of the surface at time interval A, while the categories with no established connectivity cover 58.49 km2. In the Urban Forest Management Plan (time interval B) the categories with established connectivity of NSN elements cover 309.67 km2 (an increase in surface area of 10.54%) while the categories with no established connectivity cover 28.97 km2 (a reduction in surface area of 50.47%). The spatial category of high connectivity (I category) represents a core area of the influence of the NSN elements. Within this category the landscape metric parameters that emphasise the multifunctionality value of a green infrastructure have increased - the total sum of NSN elements increased by 13% and the number of NSN elements was raised by 12%. The zones with moderate connectivity (II category) show a greater change in the number of NSN elements (14%) but a less significant change of the total sum of NSN elements (5%). These changes in categories of connectivity justify the classification of connectivity because a less extensive change in the sum of NSN elements, in the moderate as opposed to the high category, points to zones in which NSN elements are less distant from each other in space.
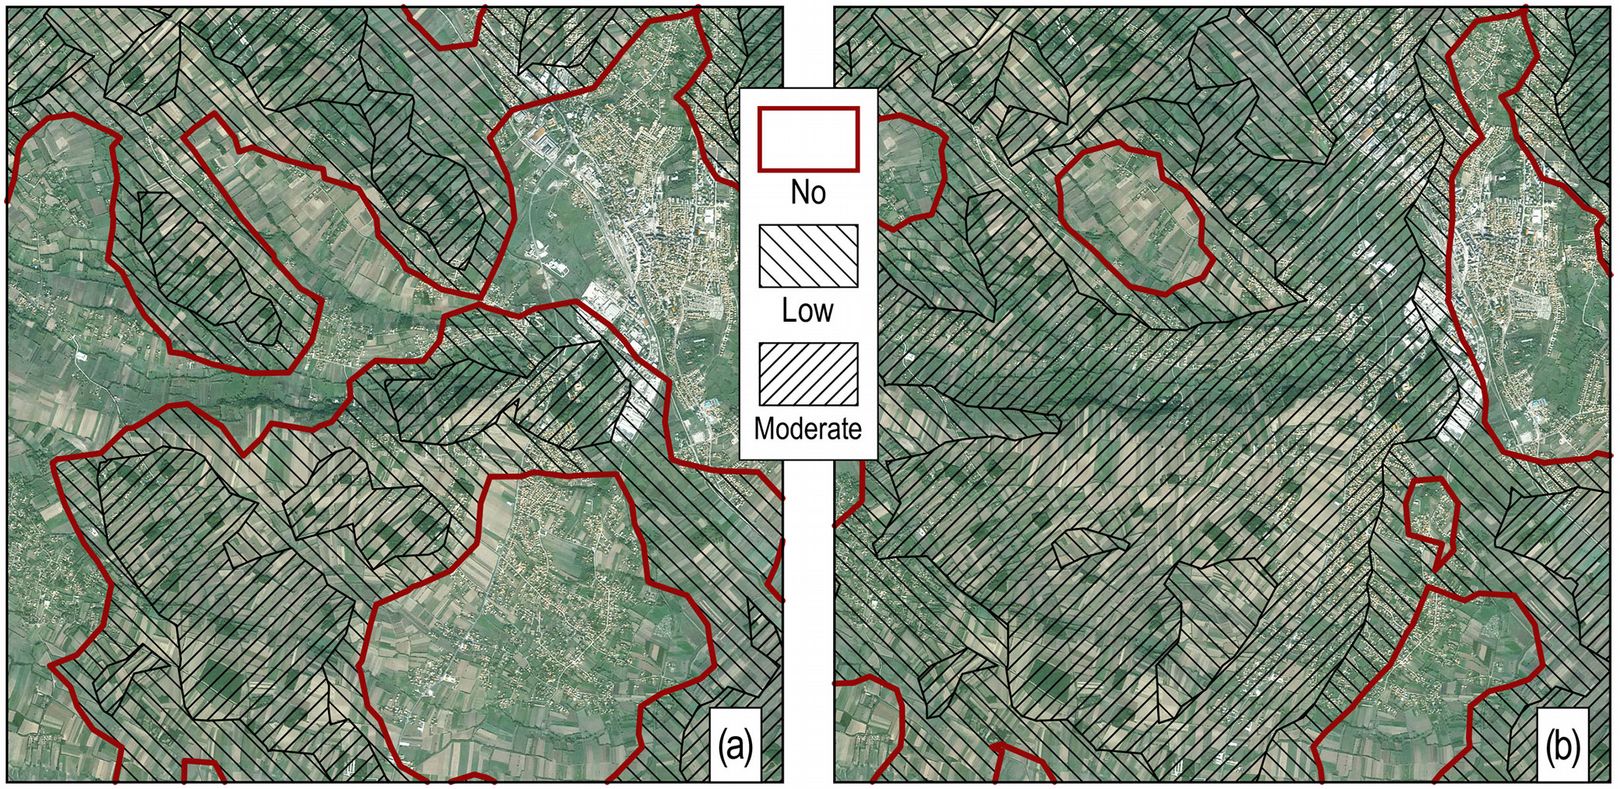
Scientific literature frequently mentions the lack of quantitative data bases which would support the effective application of ecosystem services in planning practice. Nonetheless, in their review Albert et al. ([5]) found that semi-quantitative comparative approaches based on ordinal scales have often proved to be sufficient. In the Urban Forest Management Plan the application of ecosystem services is represented on an ordinal, and/or nominal scale. According to the indicators of degree of connectivity, represented in the landscape metric parameters (the number, surface and distance of NSN elements), nominal and/or ordinal values are defined (low, moderate and high connectivity). The multifunctional values of the achieved ecosystem services such as supporting ecosystem services and cultural ecosystem services presented in this way, “derive priorities for improving GI elements as well as the links and gaps between them” ([17]). In the parts of the research area which showed a high degree of connectivity (category I), measures must be taken to preserve the structure of the NSN elements (Fig. 6). In the areas which showed moderate and low connectivity (categories II and III), planned measures should be applied to introduce new NSN elements and establish connections between existing elements. The areas in the structure of the landscape which showed the lowest values were those dominated by heterogeneous landscape elements (those sections of the landscape dominated by urban and agricultural heterogeneous landscape elements). Thus, the multifunctional values of ecosystem services achieved allow the definition of new goals and approaches for the realisation of GI concepts in the context of sector planning in urban and agricultural planning.
Fig. 6 - Zones of priorities for improving connectivity with GI. The zones with medium and low connectivity have increased in relation to the zones with no connectivity between NSN elements. In contrast to the state in (a), state (b) shows how the Urban Forest Management Plan has reduced the mutual distance and isolation of the better categories of connectivity. The zones with no connectivity are located in urban and agricultural lands use areas.
The GI concept in the Urban Forest Management Plan involves the application of a landscape approach to research, and connectivity is established as a new goal of afforestation. In this way the achieved results are not presented in the traditional manner alone, as the degree of afforestation, but rather through the level of connectivity achieved. With the afforestation of a new 229 ha of non-forested land, the level of afforestation is increased by 1.1%, reaching 13.6% of the entire area, which is above the average for the Belgrade metropolitan area (11.2%), but still well below the level of afforestation in the Republic of Serbia as a whole, which is 30.6%. At the same time, the areas with a greater degree of connectivity are increased by 8.72%, which represents a valuable result, not just from the point of view of the achieved services to biodiversity supporting ecosystem services but from the point of view of the stability of the landscape as a whole ([6], [2]).
Conclusions
A growing number of researchers view the planning of the spatial development of urban landscapes in a contemporary context as a challenge without precedent. The existing research methods are being reviewed, along with the goals of sustainable urban development. The majority of authors advocate interdisciplinary discourse when planning at the landscape scale, which presupposes a landscape ecological approach aimed at the creation of sustainable and resilient urban landscapes. This means that, among other things, it is essential to increase the level of biodiversity and connectivity through the establishment of an ecological network by linking existing natural and semi-natural elements, paying attention to the multi-functional values of the ecosystem.
Although there are problems regarding the implementation of the concept of green infrastructure and no adequate methods exist for measuring the achieved results, in conditions of climate change the green infrastructure concept turns out to be the most suitable for flexible planning in urban landscapes. The spatial dimension of the GI concept, which establishes a physical connection between NSN elements, defines the landscape pattern and helps shape a resilient urban landscape. At the same time, the functional dimension ensures the concept is viewed through various ecosystem services.
Connectivity is a multifunctional value of the green infrastructure concept, and it is achieved via spatial distribution and the connection of NSN elements in GI. It is measurable in terms of aspects of the various ecosystems. At the same time, the level of recognised connectivity represented as a multifunctional value which integrates cultural and supporting ecosystem services (recreation and biodiversity) and establishes a degree of stability in urban landscapes.
Urban forestry is playing a more and more important role in the collaborative planning of urban landscapes, most significantly in the implementation of the green infrastructure concept. In Serbia, a multi-scale spatial dimension and the multifunctional dimension of the green infrastructure have been applied at national and regional levels of spatial development planning. The realisation of the green infrastructure concept is presented through the example of the Urban Forest Management Plan for the City of Belgrade - Mladenovac Municipality. The results of using the spatial-ecological approach in creating the plan and establishing connectivity as a new aim in forest management planning show that the implementation of the green infrastructure concept, and the achieved multifunctional ecosystem values, can be presented on the basis of the parameters of landscape metrics. This approach requires further practical research, which would actualise the paradigm of planning at the landscape scale, in which the green infrastructure concept is used as the basis for understanding and co-operation of different participants in the process of planning the spatial development of urban landscapes.
References
Gscholar
Gscholar
CrossRef | Gscholar
Gscholar
Gscholar
CrossRef | Gscholar
Gscholar
Gscholar
Gscholar
Gscholar
Gscholar
Online | Gscholar
Gscholar
Gscholar
Authors’ Info
Authors’ Affiliation
Boris Radić
Suzana Gavrilović
University of Belgrade, Faculty of Forestry, Department of Landscape Architecture and Horticulture, Belgrade (Serbia)
Milan Medarević
University of Belgrade, Faculty of Forestry, Department of Forestry, Belgrade (Serbia)
University of Belgrade, Faculty of Forestry, Department of Ecological Engineering in Soil and Water Resources Protection, Belgrade (Serbia)
Corresponding author
Paper Info
Citation
Vasiljević N, Radić B, Gavrilović S, Šljukić B, Medarević M, Ristić R (2018). The concept of green infrastructure and urban landscape planning: a challenge for urban forestry planning in Belgrade, Serbia. iForest 11: 491-498. - doi: 10.3832/ifor2683-011
Academic Editor
Raffaele Lafortezza
Paper history
Received: Nov 13, 2017
Accepted: May 16, 2018
First online: Jul 18, 2018
Publication Date: Aug 31, 2018
Publication Time: 2.10 months
Copyright Information
© SISEF - The Italian Society of Silviculture and Forest Ecology 2018
Open Access
This article is distributed under the terms of the Creative Commons Attribution-Non Commercial 4.0 International (https://creativecommons.org/licenses/by-nc/4.0/), which permits unrestricted use, distribution, and reproduction in any medium, provided you give appropriate credit to the original author(s) and the source, provide a link to the Creative Commons license, and indicate if changes were made.

Web Metrics
Breakdown by View Type
Article Usage
Total Article Views: 55333
(from publication date up to now)
Breakdown by View Type
HTML Page Views: 43519
Abstract Page Views: 6062
PDF Downloads: 4652
Citation/Reference Downloads: 13
XML Downloads: 1087
Web Metrics
Days since publication: 2901
Overall contacts: 55333
Avg. contacts per week: 133.52
Article Citations
Article citations are based on data periodically collected from the Clarivate Web of Science web site
(last update: Mar 2025)
Total number of cites (since 2018): 24
Average cites per year: 3.00
Publication Metrics
by Dimensions ©
Articles citing this article
List of the papers citing this article based on CrossRef Cited-by.
Related Contents
iForest Similar Articles
Review Papers
Green Infrastructure as a tool to support spatial planning in European urban regions
vol. 6, pp. 102-108 (online: 05 March 2013)
Research Articles
Green oriented urban development for urban ecosystem services provision in a medium sized city in southern Italy
vol. 7, pp. 385-395 (online: 19 May 2014)
Research Articles
Evaluation of urban forest landscape health: a case study of the Nanguo Peach Garden, China
vol. 13, pp. 175-184 (online: 02 May 2020)
Research Articles
LIFE-CLIVUT, ecosystem benefits of urban green areas: a pilot case study in Perugia (Italy)
vol. 15, pp. 133-140 (online: 09 April 2022)
Research Articles
Communicating spatial planning decisions at the landscape and farm level with landscape visualization
vol. 7, pp. 434-442 (online: 19 May 2014)
Research Articles
How do urban dwellers react to potential landscape changes in recreation areas? A case study with particular focus on the introduction of dendromass in the Hamburg Metropolitan Region
vol. 7, pp. 423-433 (online: 19 May 2014)
Technical Reports
Assessment of allergenic potential in urban forests: a case study of the Royal Park of Portici in Southern Italy
vol. 13, pp. 376-381 (online: 25 August 2020)
Research Articles
The willingness of inhabitants in medium-sized city and the city’s surroundings settlements to pay for recreation in urban forests in Poland
vol. 14, pp. 483-489 (online: 27 October 2021)
Review Papers
Public participation: a need of forest planning
vol. 7, pp. 216-226 (online: 27 February 2014)
Technical Advances
Forest planning and public participation: a possible methodological approach
vol. 5, pp. 72-82 (online: 12 April 2012)
iForest Database Search
Search By Author
Search By Keyword
Google Scholar Search
Citing Articles
Search By Author
Search By Keywords
PubMed Search
Search By Author
Search By Keyword


