LIFE-CLIVUT, ecosystem benefits of urban green areas: a pilot case study in Perugia (Italy)
iForest - Biogeosciences and Forestry, Volume 15, Issue 2, Pages 133-140 (2022)
doi: https://doi.org/10.3832/ifor3908-015
Published: Apr 09, 2022 - Copyright © 2022 SISEF
Research Articles
Abstract
Trees have a great value in terms of ecosystem services in urban areas. LIFE CLIVUT is an “Information and Governance” European project developed in 4 Mediterranean Cities, with the goal of increasing the knowledge and awareness of citizens, especially young people, on the importance of the presence and good management of urban trees to mitigate the “Heat Island” effects. The data collected on the value of tree heritage and their future potential are used to design a green asset management strategy that will help urban planners adopt better practices for the mitigation of the effects of climate change in urban environments. This paper illustrates the results of tree census activity in four urban green areas of Perugia, Central Italy, that will be compared with those recorded in others cities involved in the project. Dendrometric parameters (diameter at breast height, tree height, first branch height, max and min crown width, crown shape and density) were recorded in situ using a dedicated software operating through a web app (“Clivut-Treedb”). The following ecosystem services were estimated: CO2 sequestration, particulate matter (PM) absorption, shadow effect, biodiversity indexes. Several tree species characterized by important wood structures during their adult phase, such as Pinus pinea, Quercus ilex, Q. pubescens, Ulmus carpinifolia, Populus alba and Aesculus hippocastanum showed the highest estimates of CO2 stored. Q. ilex was the most efficient species in particulate adsorption, showing similar estimates (about 60 g PM10 tree-1 year-1) in the 3 oldest green areas established in the 1980s, while the youngest plantations (dating back to 2005) absorbed about 10 g tree-1 of PM10 per year. In terms of the potential cooling effect of trees, preliminary estimates of the shaded areas highlighted the difference between the older green areas (about 50% of shading) compared to the younger ones (about 15% and 8%).
Keywords
Urban Green Asset, Open Access WebApp, Tree Ecosystem Value, LIFE CLIVUT
Introduction
Large urban areas have a significant impact on the causes of climate change as they are the main sources of greenhouse gas (GHG) emissions, producing up to 70% of global anthropogenic GHG emissions, largely due to fossil fuel consumption ([37]). At the same time, cities are significantly affected by the effects of climate change; they represent, therefore, not only one of the problems, but also the main field of application for mitigating the negative effects of climate change ([5], [10]).
Urban climate change-related risks are likely to increase and will impact infrastructure, ecosystems, housing, service delivery, as well as the livelihoods and health of urban communities. As a consequence, urban adaptation and mitigation provide significant opportunities, with cities having a key role in addressing climate change ([4]).
In accordance with the EU strategy on adaptation to climate change, cities need to increasingly act by setting city-level targets for emissions reduction and by planning and implementing urban investments and managerial strategies aimed to increase urban resilience to climate change ([10]). In this context a crucial role is played by the urban green infrastructures, which can perform many functions and produce important benefits for the environment, and therefore for the society ([8], [22], [17]). The different typologies of urban green areas have different functions and positive effects on the local climate, air quality, noise levels and stability of the soil. Moreover, one of the most significant positive effects is the psychological restoration provided to the inhabitants ([3]). Vegetation acts as a “natural air cooler” tempering the thermal excesses that characterize the urban heat island effect ([31]). The shadowing and the evapotranspiration effects concur to mitigate the temperatures during the summer. These effects could decrease the air temperature up to 6 degrees in the Mediterranean area. The consequence is a decrease in the energy demand for building cooling systems, which has an indirect positive impact on air quality, GHG emission and global warming ([32]).
Trees contribute to the reduction of air pollution by absorbing fine dust ([21], [23], [22], [14]). The awareness of the existence of these benefits and their ecosystem and socio-economic value represents a starting point for improving the green urban “capital” and the management practices to optimize their benefits.
LIFE CLIVUT (Climate Value of Urban Trees) is an “Information and Governance” European project (CLIVUT LIFE 18 GIC/IT/001217) aimed at creating a widespread consciousness of the value of urban green assets and implementing concrete actions to maximize their functions against the impact of climate change. To achieve so, it sets several actions addressed at the main actors of urban communities: public planners, citizens, especially young people, and entrepreneurs. The cities involved in the project are Perugia and Bologna in Italy, Cascais in Portugal and Thessaloniki in Greece. In different green areas of these cities, a tree census was carried out to integrate the current knowledge and develop an urban green asset management system. The tree species were mapped through a free web app designed ad-hoc, which can be used by all citizens (“LIFE CLIVUT TREEDB”, hereafter Clivut-Treedb - ⇒ http://lifeclivut.treedb.eu/index.php).
In this study we report the results obtained in 2020 in the city of Perugia (medium sized city in Central Italy). Project activities were carried out throughout the year in four green areas of the city with two main objectives: (i) to improve the knowledge of the tree species in terms of their morphological and phytosanitary situation; (ii) to test the online web app Clivut-Treedb, which provides an exclusive web architecture for collecting data about the arboreal heritage present in the cities involved in the project.
The full implementation of the web app Clivut-Treedb will allow to record and manage a geolocalized database of the urban and suburban tree heritage, including the phenological data of the main species present in a given city. Mathematical models based on the collected dendrometric data will be developed in order to assess the present development of trees and to compare it to the expected one. The online platform will develop indicators for the evaluation of tree ecosystem services per individual tree, per species, per green infrastructure, per administrative and geographic area, while predictive models for tree growth and ecosystem services will be implemented and tested.
Materials and methods
Study areas
We studied 4 green areas in Perugia (Central Italy) with an estimated green heritage of about 48.000 trees. All the green areas were entirely surveyed during the project activities. The considered areas were: (i) an equipped green area named “Chico Mendez”; (ii) an urban park named “Verbanella”; (iii) an historical park named “Frontone”; and (iv) a green area recently established, the “Barton Park” (Fig. 1).
Fig. 1 - Location of the studied urban green areas (outlined in blue) in Perugia, Central Italy.
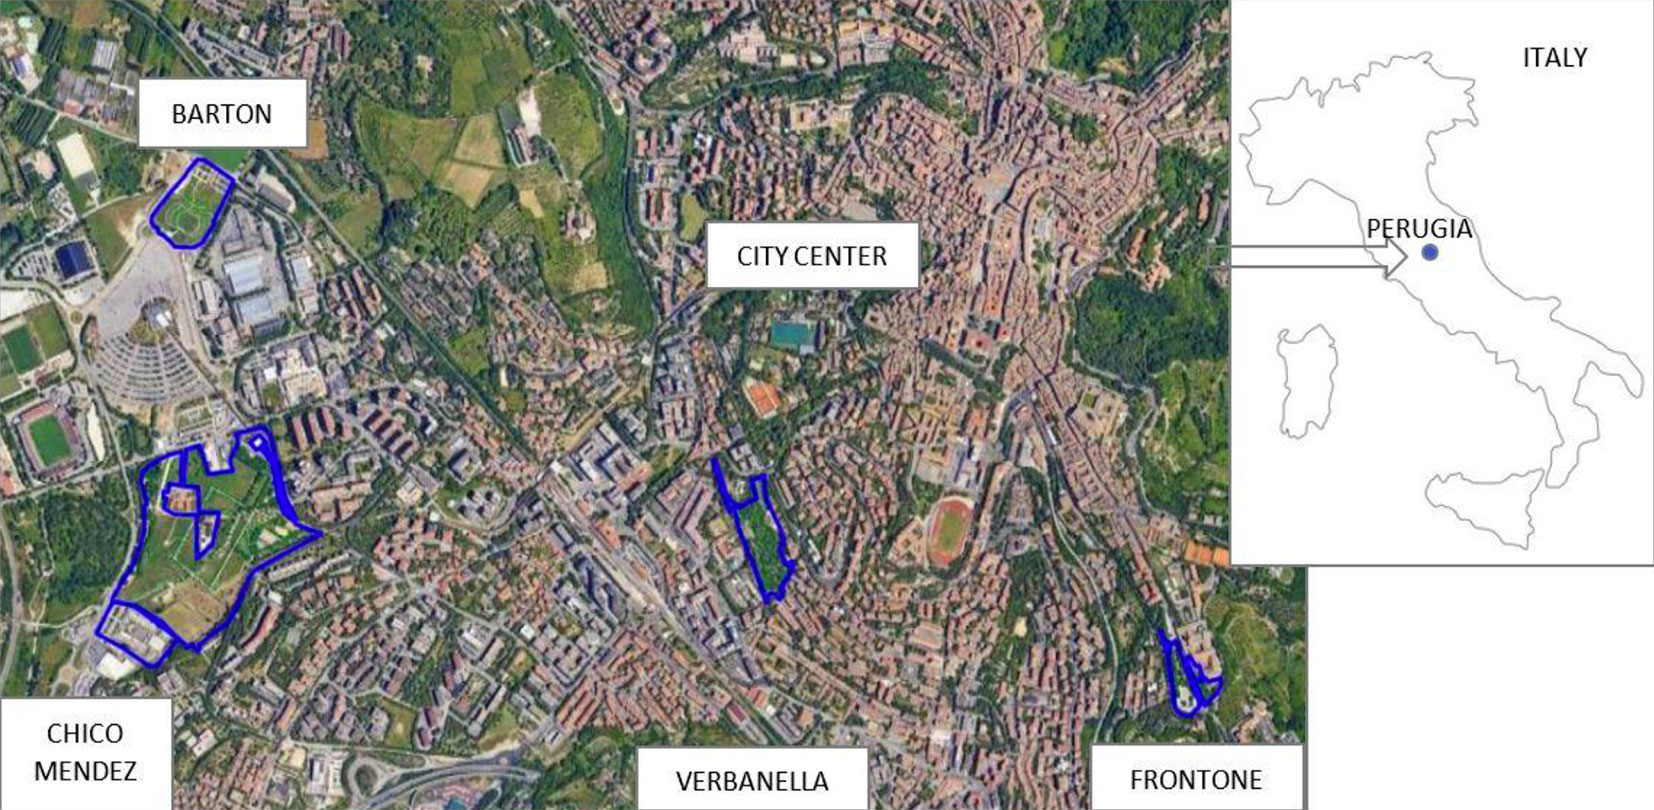
The Chico Mendez park was established during the 1980s in the flat area surrounding the city. It collects a huge city catchment area as it is adjacent to various services and commercial hubs of the city. Within the park there is an equipped path as well as long tree-lined avenues.
The Verbanella park was established during the 1970s near the historic city center over a hilly area which includes different altitudes. This is in one of the most densely populated districts of Perugia. The flora of the park is varied though mostly Mediterranean.
The Frontone is a historical park dating back to 1700, when it was established on a former meadow. Today, as well as in the past, there are mainly trees of Quercus ilex and Aesculus Hyppocastanum and shrubs of Viburnum tinus and Laurus nobilis. The park stands on an ancient Etruscan necropolis, which is reflected by its current peculiar shape that recalls a large amphitheater.
The Barton Park has been recently established for public use on a private site and has a modern design. It includes different tree species, among which Pinus pinea and Quercus pubescens were planted about 40-50 years ago, while all other tree species have been recently established.
The total area (TA) and the tree covered area (TCA) in each park are: Frontone (TA 0.96 ha, TCA 0.41 ha), Verbanella (TA 2.6 ha, TCA 1.62 ha), Chico Mendez (TA 9 ha, TCA 2.51 ha), Barton (TA 2.38 ha, TCA 0.22 ha).
Data collection
In each green area, several in-field surveys were carried out during spring and summer to record tree bio-morphometric data and environmental parameters, which were collected using the web app Clivut-Treedb. The following parameters were recorded: tree species, GPS position, DBH (diameter at 1.3m above the ground), tree height, height of the first branch, size and shape of the crown, tree phytosanitary conditions, and environmental parameters. The following equipment was used during census activities: GPS tablet, roll-up meter, camera, clinometer, laser meter, and field notebook. Horizontal and vertical distances were derived from slope distance, inclination and azimuth recorded by the laser rangefinder TruPulse® 200B (Laser Tech Inc., Centennial, CO, USA). The transparency of tree crown was categorized in 4 classes (minimum, small, large and maximum) based on the visual evaluation of the typical foliage distribution of the species.
From June to September 2020, the 4 city green areas (of which 3 are public and one private at public use) were investigated and an integrated urban tree inventory was built, including both qualitative and quantitative information.
The web app Clivut-Treedb is a user-friendly platform (Fig. 2) for collecting green asset data that non-expert citizens can use to identify tree species thanks to the inclusion of an open source platform for plant identification (PlantNet - ⇒ https://identify.plantnet.org/). From an IT point of view, the system resides on a central server, currently located at the Department of Engineering, University of Perugia, where an Apache web platform has been set up to allow access via the Internet to the applications and database. The central core consists of a spatial database (PostgreSQL and PostGIS extension) on which the spatial data relating to the census sites are managed and the environmental information (e.g., particulate) collected by the regional environmental agencies is made available. The application was developed using open source software both for the GIS component (GeoServer, OpenLayers and PostGIS) and for the managing component (developed in JavaScript and PHP), by which the various models for measuring and predicting the environmental behaviour of the census trees are processed ([26]).
Fig. 2 - The layout of Clivut-Treedb web app (⇒ http://lifeclivut.treedb.eu/login.php).

The application can be accessed through a common browser and a normal Internet connection, and requires no installation on the devices used, thus being independent from the technological platform used and the type of connection (landline or mobile network). A sign-in procedure is required to access and manage data related to areas of personal interest.
Different sets of dendrometric data were collected and georeferenced at each tree in the studied areas using the web app Clivut-Treedb. Mathematical models based on the international scientific literature were applied to calculate the following ecosystem services: CO2 sequestration, particulate (PM10) absorption, shadow effect, biodiversity increase.
Potential carbon storage
The I-Tree model ([18]) was used to calculate urban forest and individual total tree carbon storage using tree allometric biomass equations ([19], [20]). Differences in tree age, crown dimensions, growing rate and pruning can affect carbon storage and must be carefully considered.
Tree biomass was derived using volumetric equations (m3 tree-1) from diameter at breast height (DBH, cm) and crown height (h, m). Dry-weight (DW) biomass and values of carbon stored were calculated by applying DW biomass density factors (reported in the literature) and incorporating belowground biomass by multiplying the DW biomass by 1.28 ([34], [33]). DW biomass was converted into kilograms of carbon (C) by multiplying by the constant 0.50 ([11]), while stored carbon was converted into stored carbon dioxide (CO2, in Mg) by multiplying by the constant 3.67 (molecular weight of CO2). Allometric equations were selected to evaluate tree volume among different sources to better adapt the modeling of the trees to the different analyzed areas ([38], [15], [16], [9]).
PM absorption
As regards particulate matter (PM10), the potential tree absorption depends on several morphological and physical characteristics of the tree and the environment considered. Using the I-Tree software, the pollutant flux (F, g m-2 s-1) is calculated as the product of the deposition velocity (Vd) and the pollutant concentration (C, [20], [18] - eqn. 1):
The total amount of PM10 removed by each tree was obtained by integrating the mean monthly pollutant flux over the annual series ([13], [2]), with the estimated tree leaves presence and their morphological and dendrometric parameters (eqn. 2):
where PM10tot is the total PM10 removed (μg cm-2 year-1). The parameters utilized to estimate the PM absorption are described below.
The deposition velocity (Vd) was set differently according to the literature ([1], [7]). Indeed, the effects of morphological characteristics of different species and of wind speed on the deposition velocity (Vd) has been shown ([1], [7]). As a consequence, we grouped the species showing leaf characteristics similar to those reported in the above-mentioned studies, associating each species with the corresponding Vd values from the literature. We also set the wind speed using three different threshold from the literature (3, 8, and 10 ms-1).
C is the monthly PM10 concentration (μg m-3) in eqn. 1 and eqn. 2. The Regional Environmental Protection Agency (ARPA-Umbria) allowed us to acquire hourly-daily concentrations of pollutants in the atmosphere, starting some years before the beginning of the project. The PM absorption calculation was done considering the pollutant concentrations recorded during the year 2019 (beginning of the project).
Ti is the number of days per month with presence of leaves on trees. For deciduous broadleaved species this parameter takes a value of zero from November to March.
The Leaf Area Index (LAI) was obtained using the estimated leaf area derived from allometric equations and the measured crown projection of each tree. Urban tree growth equations allowed the prediction of tree height, crown height, crown diameter, and leaf area using DBH ([16]).
Fd in eqn. 2 is the percentage of foliage density used to estimate the actual leaves presence.
The results were also expressed as yearly grams of PM10 absorbed per tree (g tree-1) to facilitate the comparison among different species.
Tree crown shadow effect
To calculate the overall shaded area due to tree canopy cover, the following procedure was applied using the GIS platform. A circle was considered for each tree centered at its position on the ground, with a diameter equal to its crown size. However, the intertwining of circles on the map hampers the estimation of the coverage area by simply adding up each circle area, as the overlapping areas would be counted several times. Therefore, a spatial operator (command “union” in QGIS) was used to determine the intersection between circles, obtaining a complex polygonal geometric shape which is the result of the merging of intertwined circles, thus avoiding crown overlapping.
The multi-polygonal geometric shape in the form of a cloud, which reflects the overall area covered by tree canopies, was then used to assess the projected shade areas due to the trees present in each urban green area.
Biodiversity evaluation
The biodiversity of the considered urban green areas was estimated using the Shannon-Wiener index ([30] - eqn. 3):
where pi = ni/N, with ni being the total number of individuals per species in each park and N the total number of all species in that park. Moreover, the Shannon Evenness (J), which measures the equitability of species in a community, was computed as J = H/Hmax where H is the Shannon index, Hmax is the maximum value of H, calculated as Hmax = ln(S), where S is the number of species in each park.
Results
Urban parks characteristics
The total number of tree species present in all the studied urban green areas (parks) was 100, with 3 of these representing more than 10% of the total number of trees (Quercus ilex: 19.17%; Cupressus sempervirens: 10.42%; and Aesculus hippocastanum: 10.12%). The list of the species with share > 1% is reported in Tab. 1.
Tab. 1 - Tree species detected in the 4 urban parks. (N): total number: (P): percentage.
| Species | N | P (%) |
|---|---|---|
| Quercus ilex | 392 | 19.17 |
| Cupressus sempervirens | 213 | 10.42 |
| Aesculus hippocastanum | 207 | 10.12 |
| Populus nigra | 124 | 6.06 |
| Olea europea | 122 | 5.97 |
| Cupressus arizonica | 121 | 5.92 |
| Acer campestre | 72 | 3.52 |
| Ulmus carpinifolia | 57 | 2.79 |
| Robinia pseudoacacia | 48 | 2.35 |
| Cercis siliquastrum | 47 | 2.30 |
| Pinus pinea | 47 | 2.30 |
| Ligustrum ovalifolium | 44 | 2.15 |
| Carpinus betulus “Fastigiata” | 39 | 1.91 |
| Carpinus betulus | 35 | 1.71 |
| Morus platanifolia | 34 | 1.66 |
| Populus nigra “Italica” | 28 | 1.37 |
| Quercus pubescens | 27 | 1.32 |
| Pinus pinaster | 24 | 1.17 |
| Prunus avium | 24 | 1.17 |
| Cupressus sempervirens “Piramidalis” | 21 | 1.03 |
The presence of both evergreen (about 45% of total number of trees) and broadleaf species is likely due to the specific pedoclimatic conditions. Most of the species found are typical of the Mediterranean flora and representative of the surrounding landscape, though in some cases naturalized species were also found (e.g., Robinia pseudoacacia, Cupressus arizonica).
Twenty different plant families were represented in the study areas, the most abundant being the Fagaceae family (6 species, 21.66% of the total number of trees), and the Ginkgoaceae the less abundant (only 1 tree). Overall, the families with more species were: Rosaceae (11), Sapindaceae (10), Oleaceae (7) and Fagaceae (6).
From a chorologic point of view, the tree species found in the studied areas are typically Mediterranean, with “Steno-Medit” and “Euri-Medit” being the two largest classes with more than 800 trees included.
CO2 stored
Carbon storage was directly derived from tree volume. In Tab. 2 the total CO2 stored is reported as provided by the Clivut-Treedb web app. The 1192 plants recorded in the largest park (Chico Mendez) showed a fairly high average DBH value (22.04 cm) and an estimation of more than 500 Mg CO2 stored. The second park by size (Verbanella) showed the presence of 478 trees with a slightly higher DBH average value and 376.41 Mg of CO2 stored. The two smallest study areas (Frontone and Barton) were well diversified in terms of carbon sequestration, considering their very different situation. The total CO2 storage estimated for historic Frontone park was greater than 350 Mg, which is surprising as it has 30% less trees than the other study areas, though they often exceed 50 years of age. The youngest trees at the Barton park showed the lowest average DBH dimension (12.57 cm).
Tab. 2 - Total number of trees, average DBH and estimated CO2 stored in each urban green area.
| Park | No. Trees | Average DBH (cm) |
Total CO2 stored (Mg) |
|---|---|---|---|
| Chico Mendez | 1192 | 22.04 | 514.46 |
| Verbanella | 478 | 24.27 | 376.41 |
| Frontone | 157 | 50.01 | 350.94 |
| Barton | 230 | 12.57 | 53 |
Tab. 3 shows the tree species with the highest values of CO2 stored per tree and the corresponding stored CO2 per DBH. In 3 out of the 4 green areas studied, Pinus pinea had the highest estimate of carbon storage. In the Chico Mendez Park, Populus spp. and Salix spp. contributed efficiently to carbon storage, likely due to its particular environmental condition (wet area). However, differences among individuals of the same species growing in different areas were observed, due to their different morphological development in terms of DBH.
Tab. 3 - Highest values of estimated CO2 stored per tree and CO2 stored/DBH ratio per species in each urban area.
| Park | Species | CO2 tree-1 | CO2/DBH |
|---|---|---|---|
| Chico Mendez | Populus alba | 2.12 | 0.90 |
| Pinus pinea | 1.80 | 0.07 | |
| Salix viminalis | 1.79 | 0.38 | |
| Ulmus pumila | 1.37 | 0.13 | |
| Quercus pubescens | 1.16 | 0.65 | |
| Prunus cerasifera | 1.01 | 0.14 | |
| Juglans regia | 0.98 | 0.11 | |
| Quercus petraea | 0.97 | 0.11 | |
| Pinus halepensis | 0.96 | 0.11 | |
| Robinia pseudoacacia | 0.89 | 1.54 | |
| Populus nigra | 0.75 | 3.11 | |
| Salix alba | 0.67 | 0.19 | |
| Quercus ilex | 0.65 | 3.36 | |
| Barton | Pinus pinea | 3.53 | 0.35 |
| Quercus pubescens | 1.26 | 0.36 | |
| Robinia pseudoacacia | 0.75 | 0.03 | |
| Morus spp. | 0.25 | 0.18 | |
| Morus platanifolia | 0.22 | 0.74 | |
| Populus nigra “Italica” | 0.20 | 0.03 | |
| Olea europea | 0.16 | 0.01 | |
| Cercis siliquastrum | 0.16 | 0.13 | |
| Prunus cerasifera | 0.12 | 0.02 | |
| Laburnum anagyroides | 0.07 | 0.01 | |
| Salix babylonica | 0.07 | 0.01 | |
| Quercus ilex | 0.06 | 0.25 | |
| Carpinus betulus | 0.04 | 0.13 | |
| Verbanella | Pinus pinea | 2.16 | 1.47 |
| Ulmus carpinifolia | 1.63 | 2.12 | |
| Ulmus pumila | 1.32 | 0.14 | |
| Olea europea | 1.21 | 2.52 | |
| Robinia pseudoacacia | 1.07 | 0.94 | |
| Populus nigra “Italica” | 0.90 | 0.13 | |
| Quercus ilex | 0.89 | 1.73 | |
| Aesculus hippocastanum | 0.71 | 0.12 | |
| Cupressus sempervirens pyr. | 0.56 | 0.34 | |
| Acer rubrum | 0.54 | 0.10 | |
| Acer opalus | 0.41 | 0.11 | |
| Pinus pinaster | 0.40 | 0.18 | |
| Ligustrum ovalifolium | 0.35 | 0.07 | |
| Frontone | Aesculus hippocastanum | 3.23 | 0.82 |
| Quercus ilex | 2.13 | 7.32 |
The analysis of the relationship between the estimated CO2 stored and the DBH of trees (CO2/DBH ratio) revealed a more than proportional growth of total carbon storage as compared to the tree DBH recorded. For example, Quercus ilex trees growing in the Frontone park showed an average DBH of 41 cm and a CO2/DBH ratio of 7.32, while the same two parameters were, respectively, 30 cm and 1.73 at the Verbanella park, 30 cm and 3.36 at the Chico Mendez park, and 10.6 cm and 0.25 at the Barton park.
PM potential absorption
The estimates of the annual absorption of PM10 by all the trees monitored in the study areas are displayed in Tab. 4. We also calculated the “effective” PM10 absorption (EPM10) of single trees by including the foliage density in the estimation (EPM10 = g PM10 year-1 × % foliage density), thus reflecting the actual presence of leaves on tree species across the seasons, aimed at assessing the most effective species in PM10 absorption in each park.
Tab. 4 - Annual tree PM10 absorption (g tree-1) in the considered urban parks. (A): PM10 year-1 (g); (B): foliage density; (EPM10): effective PM10 = (A·B) PM10 year-1 (g); (tEPM10): effective PM10 per tree (g tree-1).
| Park | Species | A | B | EPM10 | tEPM10 |
|---|---|---|---|---|---|
| Chico Mendez | Total plants | 21492.5 | 72.08 | 16837.01 | 21.74 |
| Quercus ilex | 10342.0 | 80.50 | 8325.31 | 59.10 | |
| Aesculus hippocastanum | 3217.5 | 70.24 | 2259.97 | 11.87 | |
| Populus nigra | 2411.5 | 96.74 | 2332.89 | 20.44 | |
| Ulmus laevis | 1418.5 | 75.00 | 1063.88 | 81.84 | |
| Quercus pubescens | 1080.0 | 75.00 | 810.00 | 135.00 | |
| Cupressus sempervirens | 781.0 | 99.85 | 779.83 | 4.49 | |
| Cupressus arizonica | 760.5 | 56.01 | 425.96 | 5.59 | |
| Tilia platyphyllos | 526.5 | 75.00 | 394.88 | 78.98 | |
| Populus alba | 506.5 | 51.39 | 260.29 | 14.40 | |
| Robinia pseudoacacia | 448.5 | 41.03 | 184.02 | 4.95 | |
| Verbanella | Total plants | 14211.0 | 77.71 | 9999.16 | 29.30 |
| Ulmus carpinifolia | 4537.0 | 50.60 | 2295.72 | 54.44 | |
| Pinus pinea | 3636.5 | 75.00 | 2727.38 | 72.00 | |
| Quercus ilex | 3173.5 | 87.23 | 2768.24 | 58.66 | |
| Pinus pinaster | 1450.0 | 75.00 | 1087.50 | 45.50 | |
| Fraxinus ornus | 288.5 | 55.56 | 160.29 | 17.99 | |
| Aesculus hippocastanum | 284.5 | 75.00 | 213.38 | 35.48 | |
| Cupressus arizonica | 248.5 | 100.00 | 248.50 | 6.00 | |
| Olea europaea | 228.5 | 58.71 | 134.15 | 1.88 | |
| Cupressus sempervirens | 188.5 | 100.00 | 188.50 | 4.50 | |
| C. sempervirens “pyr.” | 175.5 | 100.00 | 175.50 | 8.50 | |
| Barton | Total plants | 3134.5 | 78.33 | 2313.81 | 14.26 |
| Pinus pinea | 1311.5 | 75.00 | 983.63 | 140.52 | |
| Quercus pubescens | 836.5 | 70.83 | 592.49 | 98.66 | |
| Quercus ilex | 607.0 | 70.11 | 425.57 | 9.23 | |
| Carpinus betulus | 134.5 | 75.71 | 101.83 | 2.98 | |
| Morus platanifolia | 99.5 | 100.00 | 99.50 | 3.00 | |
| Carpinus betulus | 90.0 | 75.00 | 67.50 | 3.00 | |
| Populus nigra “Italica” | 21.5 | 75.00 | 16.13 | 4.03 | |
| Morus spp. | 14.5 | 66.67 | 9.67 | 1.53 | |
| Robinia pseudoacacia | 11.5 | 100.00 | 11.50 | 11.50 | |
| Quercus cerris | 8.0 | 75.00 | 6.00 | 3.00 | |
| Frontone | Total plants | 19186.5 | 70.93 | 11747.72 | 79.41 |
| Quercus ilex | 18139.0 | 60.04 | 10890.66 | 79.54 | |
| Aesculus hippocastanum | 1047.5 | 81.82 | 857.06 | 77.73 |
A high level of particulate absorption was estimated in all the urban green areas, though in the different locations the same species had different efficacy. The highest yearly PM absorption values calculated during 2019 were estimated at the larger park (Chico Mendez) with a total of about 17 kg of effective PM10. The second larger annual absorption was estimated for the Frontone park (about 12 kg of PM10), whose trees showed the widest crown. The third larger absorption was calculated for the Verbanella park with about 10 kg, while the smallest amount was estimated for the youngest plantation (Barton park) with about 2.3 kg of absorbed PM10.
Quercus ilex had comparable estimations in the 3 parks where older trees are present (59.10, 58.66, and 79.54 g PM10 tree-1 year-1 for Chico Mendez, Verbanella, and Frontone parks, respectively), while in the youngest plantation (Barton) the estimate was only 9.23 g tree-1 year-1. This result reflects the presence of small evergreen oaks in the latter area; indeed, the crown volume increases more than the projected area during the tree growth, thus modifying the plant leaf area index (LAI).
In all the investigated sites, the 3 tree species responsible for the largest total absorbed PM10 were: in Chico Mendez, Quercus ilex, Aesculus hippocastanum and Populus nigra, which represented 67% of the total estimated absorption; in Verbanella, Ulmus carpinifolia, Pinus pinea, Quercus ilex representing 76%; at the Barton park, Pinus pinea, Quercus pubescens, Q. ilex represented 85%, while in the Frontone park, Quercus ilex was the unique tree species present, with 100% of the estimated annual absorption.
Tree crown shadow effect
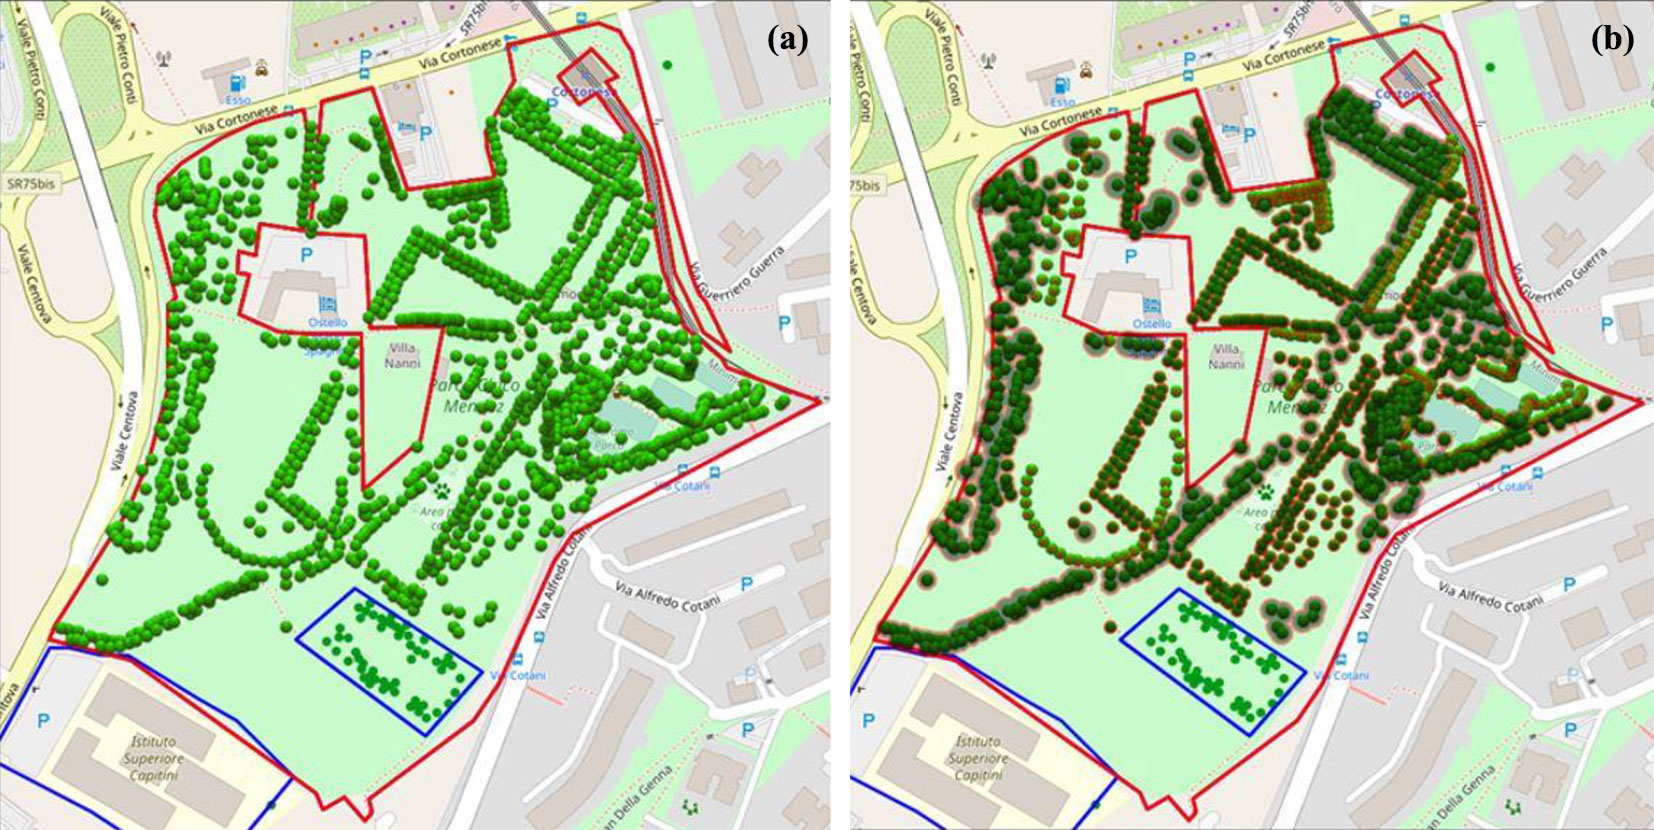
The projected shade area of tree crowns in each studied green area was calculated based on the multipolygonal geometric shapes obtained by merging the projected shade areas of all sampled trees (Fig. 3). The percentage of shaded area out of the total area of each park was considered a proxy of the thermal comfort in the sunny summer days. The projected shade areas (in m2) calculated for each park are displayed in Tab. 5. The results showed that Verbanella and Frontone are the shadiest green areas (about 52% and 46%, respectively), while Chico Mendez had only about 15% of shading (as of its large extension), and Barton had the lowest shading (7.55%), which reflects the recent establishment of trees.
Fig. 3 - Multi-polygonal geometric shape (b) obtained by merging the projected shaded area of all the sampled tree (a) in an urban green area (Chico Mendez park in Perugia, Central Italy).
Tab. 5 - Projected shade areas without overlapping per urban green area.
| Green areas | Site area (m2) | Site shadow area (m2) | % shaded vs. site area |
|---|---|---|---|
| Barton | 30553 | 2308 | 7.55 |
| Verbanella | 26092 | 13535 | 51.87 |
| Frontone | 9573 | 4415 | 46.12 |
| Chico Mendez | 158436 | 23410 | 14.78 |
Biodiversity
A good level of species richness and diversity was detected in the various urban areas, except for the historic park of Frontone where only 2 species were present (Tab. 6), as reflected by the low value obtained by the diversity indexes calculated. In general, 78 species were recorded in the four urban parks, totalling 2057 trees.
Tab. 6 - Number of species and plants are shown for each considered urban area. Moreover, Shannon index values are presented.
| Parameters | Chico M. | Verbanella | Barton | Frontone | Total |
|---|---|---|---|---|---|
| No. species | 48 | 30 | 34 | 2 | 78 |
| No. plants | 1190 | 478 | 235 | 157 | 2060 |
| H | 2.92 | 2.78 | 2.76 | 0.32 | 3.22 |
| Hmax | 3.87 | 3.40 | 3.53 | 0.69 | 4.36 |
| J (evenness) | 0.75 | 0.82 | 0.78 | 0.45 | 0.74 |
Discussion
The main goal the LIFE-CLIVUT project is to establish constructive collaborations with the municipality administrations for the development of a green asset strategy by devising best practices and recommendations for the management of urban green areas, with the final aim of mitigating the local effects of climate change. This collaboration will help public administrations improve the knowledge of their urban green assets and enhance the climatic and ecosystem functions of green areas.
An urban green asset management system was built with data recorded through plant survey (including those collected by citizen science initiatives) on the dendrometric characteristics of existing and future urban trees, about their environmental and climate performances, as well as with the best management practices to enhance their ecosystem services.
The web app Clivut-Treedb was developed ad-hoc to enable both urban planners and citizens to improve their awareness about urban climate effects. It is based on plant data libraries (dendrometric information) for the main Mediterranean tree species that can be found in the project areas. This web tool will be used for the implementation of green assets strategies and highlight their environmental benefit, climatic effect and socio-economic impact. Moreover, citizens and students will be involved in monitoring private urban green areas, and will receive climate-oriented and ecosystem-based guidelines to realise climate resilient areas. Finally, the use of the web app Clivut-Treedb will allow entrepreneurs to account for their emission and identify compensation measures bringing their activities toward the goal of zero emissions.
The results of the LIFE-CLIVUT pilot case study of plant census in four urban areas of Perugia, highlighted the importance of tree presence in urban environments and the ecosystem functions trees play in these contexts. Approximately 50% of the trees established in the urban parks of Perugia are medium-size trees. The large proportion of introduced species found in this study shows that no particular ecological properties nor their relations with the environmental conditions were taken into consideration before planting some decades ago (’70-’80). A rough selection of plants for the urban environment may also cause allergy problems to the citizens, because of the pollen of some species commonly introduced in the past, such as Cupressus, poplars, hazelnut and Fraxinus ([28], [35]). The choice of species based on ornamental rather than functional criteria may represent a great failure, and have become a key factor in urban forestry only in the last decades.
The trees present in the considered urban parks showed a fairly high potential in carbon sequestration as inferred from their dimensions at the time of census. In this study, several species characterized by abundant vascular tissue rich in lignin at the adult stage, such as Pinus pinea, Quercus ilex, Q. pubescens, Ulmus carpinifolia, Populus alba and Aesculus hippocastanum showed the highest estimates of CO2 stored. In these species, cell wall deposition and lignification mainly ensure carbon is stored in stem woody biomass ([6]). A future study will also consider the potential growth rate of trees through allometric equations to determine possible scenarios for the different study areas ([27]).
The PM absorption values of trees estimated in this study appeared similar to those reported in previous studies, in particular with those where the PM adsorption of trees are reported in g tree-1 or μg cm-2 ([24], [29]).
Paoletti et al. ([24]) calculated the PM values per tree in a study conducted in Florence (Italy), revealing a large difference between Carpinus betulus, with low PM10 values in the leaves, and Aesculus hippocastanum and Pinus pinea, which reached the highest particulate absorption values ([24]). Our results are in line with this evidence, in particular for Pinus pinea which had always the highest values among conifers in the study areas. In general, however, the two broadleaf Quercus tree species present in the study areas (Q. ilex and Q. pubescens) were the most effective in terms of PM absorption.
The estimation of the area potentially shaded by tree canopy is the first step towards a complex cooling index estimation which should also include the evapotranspiration. Wide tree canopy and high tree coverage result in a cooling effect compared to the surroundings ([25]). Yu & Hien ([36]) and Leuzinger et al. ([12]) reported that the air temperature in a park was strongly correlated to the density of plants. The trees in urban areas usually do not provide shade directly to buildings, but they may be close enough to affect the local microclimate by lowering the air temperature through evapotranspiration in summer and reducing wind speed (in particular, evergreen species) and heat loss from buildings in winter. This is true especially in a hilly urban environment such as that of Perugia, which is characterized by cold winds blowing in winter. In this context, data are currently missing about the climate regulatory effect of trees not only on the urban air but directly on buildings in order to forecast energy consumption reductions.
Regarding the results of biodiversity analysis, the Shannon evenness index reached values near 1 in three of the considered parks, indicating a fairly homogeneous distribution of species at the time of sampling. The poor values for both biodiversity indexes calculated in the case of Frontone park can be explained by its historical origin and the choice made of maintaining its original asset. However, an overall good degree of species richness was found in the urban parks of Perugia, despite that only two tree species were present in the historical green area of Frontone.
Conclusion
The tree census activities carried out within the frame of the LIFE-CLIVUT project, though influenced by the COVID-19 pandemic, allowed us to give a fairly broad picture of the benefits of urban green areas in the cities involved in the project. The results obtained in the urban parks of Perugia highlight the good potential of the extant tree species in terms of PM10 capture and CO2 storage, in line with previous studies reported in the literature. The level of tree biodiversity detected was fairly high for all urban parks, except of the historical Frontone park, and should be preserved or even increased to ensure the conservation of all trophic levels in the urban ecosystem.
The implementation of an information campaign targeted to citizen engagement in urban climate actions and aimed at raising their awareness about the climate green asset strategy is the main objective of the next project activities in the involved cities. Moreover, in the three coming years several hundreds of young people and students will be directly involved in urban green monitoring to recognize the effects of climate change in the city in accordance with a “Citizen Science” approach.
List of abbreviations
GHG, Greenhouse Gases; PM - PM10, Particulate matter; ha, hectare; TA, total area; TCA, tree covered area; DBH, diameter at breast height; h, tree height; DW, Dry-weight; Mg, Megagrams; F, Pollutant flux; Vd, deposition velocity; C, pollutant concentration; Ti, the number of days per month with tree leaves; LAI, Leaf Area Index; ni, the total number of individual per species; N, the total number of all species in stand; S, the number of species in the sample; H, Shannon index
Acknowledgements
We would like to thank the Perugia municipality administration for its contribution to the tree census activities. We thank Dr. Enzo Scudellari for the realization of the Clivut-Treedb web app and for his valuable contribution to the correction and management of the data of the project database.
References
CrossRef | Gscholar
CrossRef | Gscholar
CrossRef | Gscholar
Gscholar
Online | Gscholar
Online | Gscholar
Gscholar
Authors’ Info
Authors’ Affiliation
Marco Fornaciari 0000-0002-1289-7295
Aldo Ranfa 0000-0002-5585-7787
Chiara Proietti 0000-0002-3434-7876
Luigia Ruga 0000-0002-8513-1733
Giuditta Meloni 0000-0001-5047-2872
Martina Burnelli
Flaminia Ventura 0000-0002-8867-9825
Department of Civil and Environmental Engineering, University of Perugia, Borgo XX Giugno 74, I-06121 Perugia (Italy)
Corresponding author
Paper Info
Citation
Orlandi F, Fornaciari M, Ranfa A, Proietti C, Ruga L, Meloni G, Burnelli M, Ventura F (2022). LIFE-CLIVUT, ecosystem benefits of urban green areas: a pilot case study in Perugia (Italy). iForest 15: 133-140. - doi: 10.3832/ifor3908-015
Academic Editor
Raffaele Lafortezza
Paper history
Received: Jun 21, 2021
Accepted: Feb 05, 2022
First online: Apr 09, 2022
Publication Date: Apr 30, 2022
Publication Time: 2.10 months
Copyright Information
© SISEF - The Italian Society of Silviculture and Forest Ecology 2022
Open Access
This article is distributed under the terms of the Creative Commons Attribution-Non Commercial 4.0 International (https://creativecommons.org/licenses/by-nc/4.0/), which permits unrestricted use, distribution, and reproduction in any medium, provided you give appropriate credit to the original author(s) and the source, provide a link to the Creative Commons license, and indicate if changes were made.

Web Metrics
Breakdown by View Type
Article Usage
Total Article Views: 11472
(from publication date up to now)
Breakdown by View Type
HTML Page Views: 5171
Abstract Page Views: 3374
PDF Downloads: 2280
Citation/Reference Downloads: 5
XML Downloads: 642
Web Metrics
Days since publication: 1495
Overall contacts: 11472
Avg. contacts per week: 53.72
Article Citations
Article citations are based on data periodically collected from the Clarivate Web of Science web site
(last update: Mar 2025)
Total number of cites (since 2022): 6
Average cites per year: 1.50
Publication Metrics
by Dimensions ©
Articles citing this article
List of the papers citing this article based on CrossRef Cited-by.
Related Contents
iForest Similar Articles
Research Articles
The concept of green infrastructure and urban landscape planning: a challenge for urban forestry planning in Belgrade, Serbia
vol. 11, pp. 491-498 (online: 18 July 2018)
Review Papers
Green Infrastructure as a tool to support spatial planning in European urban regions
vol. 6, pp. 102-108 (online: 05 March 2013)
Research Articles
Green oriented urban development for urban ecosystem services provision in a medium sized city in southern Italy
vol. 7, pp. 385-395 (online: 19 May 2014)
Technical Reports
Assessment of allergenic potential in urban forests: a case study of the Royal Park of Portici in Southern Italy
vol. 13, pp. 376-381 (online: 25 August 2020)
Research Articles
Communicating spatial planning decisions at the landscape and farm level with landscape visualization
vol. 7, pp. 434-442 (online: 19 May 2014)
Research Articles
Evaluation of urban forest landscape health: a case study of the Nanguo Peach Garden, China
vol. 13, pp. 175-184 (online: 02 May 2020)
Review Papers
Public participation: a need of forest planning
vol. 7, pp. 216-226 (online: 27 February 2014)
Research Articles
How do urban dwellers react to potential landscape changes in recreation areas? A case study with particular focus on the introduction of dendromass in the Hamburg Metropolitan Region
vol. 7, pp. 423-433 (online: 19 May 2014)
Technical Advances
Forest planning and public participation: a possible methodological approach
vol. 5, pp. 72-82 (online: 12 April 2012)
Research Articles
Public participation GIS to support a bottom-up approach in forest landscape planning
vol. 6, pp. 347-352 (online: 29 August 2013)
iForest Database Search
Search By Author
Search By Keyword
Google Scholar Search
Citing Articles
Search By Author
Search By Keywords
PubMed Search
Search By Author
Search By Keyword


