Some refinements on species distribution models using tree-level National Forest Inventories for supporting forest management and marginal forest population detection
iForest - Biogeosciences and Forestry, Volume 11, Issue 2, Pages 291-299 (2018)
doi: https://doi.org/10.3832/ifor2441-011
Published: Apr 13, 2018 - Copyright © 2018 SISEF
Research Articles
Collection/Special Issue: COST Action FP1202
Strengthening conservation: a key issue for adaptation of marginal/peripheral populations of forest trees to climate change in Europe (MaP-FGR)
Guest Editors: Fulvio Ducci, Kevin Donnelly
Abstract
Spatial modelling is a fundamental tool to support forest management strategies. National Forest Inventories (NFIs) provide extensive and detailed data for spatial analysis. In this study, the most recent Italian NFI (INFC2005) was used to evaluate possible refinements on species distribution model (SDM) techniques and to derive the future scenarios for two target species (Fagus sylvatica L. and Abies alba Mill.) sharing a similar ecological environment and geographic range. A weighted SDM and a provenance distribution model (PDM) were tested, based on tree-level selection of NFI plots using species basal area as a filter. Two climate projections were analysed for 2050s according to the IPCC 5th Assessment Report (AR5). The results were evaluated as possible guidelines for management of the Italian region of the EUFGIS network, where many marginal forest populations (MaPs) are currently included as genetic conservation units (GCUs). The uncertainty of coordinates of inventory points did not affect the results of SDM. No statistical differences were found when comparing the niche realization for the two model species (ANOVA p>0.05) mainly due to spatial autocorrelation between the environmental predictors. Based on the classic SDM evaluation method (True Skill Statistic - TSS) little improvements in predictions were observed when weighting each presence/absence records, possibly due to the lack of adequate ancillary data but also to the evaluation method. A higher accuracy of predictions (TSS>0.85) was obtained when different “provenances” were modelled separately, due to the reduction in the “background noise”. We showed that for classical SDM, the prevalence of certain ecological features of some locations may drive algorithms to produce coarse averaged predictions. Provenance distribution modelling may represent a valuable step forward in spatial analysis, particularly for the detection of marginal peripheral populations. The exact spatial co-ordinates of plots and additional information on site quality (e.g., stand age, site index, etc.) in NFI data could greatly help in better weighting presence/absence data and properly test the new evaluation methods.
Keywords
INFC2005, European Beech, Silver Fir, Modelling Uncertainties, Provenance Modelling, Climate Change, Mediterranean Area
Introduction
The Mediterranean region is nowadays acknowledged as one of the main “biodiversity hotspots” for endemic plants and trees ([36], [33]) and recognized as a biogeographic zone whose biodiversity is significantly threatened ([31]). Knowledge of the existing genetic and adaptive potential of forest genetic resources (FGR) is needed to safeguard tree species of the Mediterranean region and help forest managers mitigating the impact of climate change on forest ecosystems ([50], [35]). Genetic diversity will play a key role in protecting forests under climate change, as information on species richness and genetic diversity is considered essential for the choice of robust silvicultural systems ([10]). The maintenance of a high genetic diversity of forests can contrast with other objectives such as timber production ([19]), however the trade-off between productivity and biodiversity conservation is a key requirement of forest policy.
Endangered gene pools may require transfer measures aimed at maintaining genetic diversity through assisted gene flow and assisted migration protocols based on robust data and models ([15]), as well as on the knowledge of adaptive traits and the spatial distribution of genetic diversity ([20], [38]). Recently, forest research has focused on the impact of climate change on forest resources and their spatial distribution ([16], [25]), and on changes in the provision of ecosystem goods and services ([7], [40]), in order to support forest management strategies under climate change. For example, the “European Atlas of Forest Tree Species” of the European Commission ([43]) is a key resource aimed to support forest management with a comprehensive coverage at a European scale.
Species distribution modelling (SDM) is a promising technique commonly applied to predict the impact of climate change on species’ biodiversity and populations ([46]) and to support forest management and silvicultural practices ([41]). The goal of such technique (often referred to as “ecological niche modelling”) is to characterize the ecological requirements of a target (plant or animal) species using statistical models. Various algorithms are used (e.g., Generalized Linear Models, Generalized Additive Models, Neural Networks, Regression Trees, etc.), assuming the current spatial distribution of a species to be a proxy of its ecological niche. Environmental predictors such as temperature, precipitation and several bioclimatic indices are generally derived from wide datasets by means of statistical tests (e.g., co-linearity), or using an expert knowledge on the target species ([32], [49]). New opportunities may be offered from using National Forest Inventory (NFI) ancillary data, such as timber volume and species abundance. Many freely available or restricted spatial European datasets and empirical data of forest species have been used in SDM studies, such as the EUFORGEN (⇒ http://www.euforgen.org/species/) or EFI distribution maps ([6]), but local databases such as forest types are generally thought to provide a higher level of accuracy. All NFIs are characterized by: (i) high spatial precision (metres); (ii) detection of tree species and their relative abundance; (iii) availability of quantitative data (such as basal area, site index, age, average height, etc.); (iv) national scale and total coverage of the territory; and (v) standardized methods and outputs. Consequently, a NFI provides an important country-level data source, due to high-quality, statistically designed geo-referenced data ([11]). In many countries, a NFI survey is regularly performed (e.g., every 5 years) and often repeated on the same sampling points ([14]) with the aim of collecting temporal series and assessing local growth trends. In addition to using robust and highly-performing algorithms and validated datasets, the assessment of uncertainty is an important step in such modelling techniques ([37]). This includes uncertainties in climate data (and future projections) as well as positional errors in presence/absence data. Such step is especially needed when small populations are studied, such as Marginal and Peripheral forest populations (MaP), where a reduced part of the whole distribution of a forest species must be carefully represented by using its realised niche ([25]).
In this paper, an effort to improve the SDM approach using national forest inventory data is proposed, with the aim of supporting active adaptive management strategies for maintaining endangered forest gene pools and genetic diversity under projected climate change. The study focuses on the ecological niche of two target species (Fagus sylvatica L. and Abies alba Mill.) derived from the spatial distribution of inventory points. Five different approaches were evaluated to forecast possible effects of climate change on a selected group of populations included into the EUFGIS database (⇒ http://www.eufgis.org/). Two different climate change projections (RCP4.5 and RCP8.5 of AR5, IPCC - ⇒ http://www.ipcc.ch/report/ar5/syr/) were used to explore the expected shifts in the fundamental niche space of the study species.
Materials and methods
Presence/absence datasets: the Italian National Forest Inventory
The last Italian NFI (INFC2005) began in 2003 and raw data has been recently released ([5]). The sampling procedure was developed following three main phases in a “stratified sampling approach” and 7.272 geo-referenced inventory points were available in the WGS84 reference system, grouped into 23 forest categories. From the 263 inventoried species, we selected European beech (Fagus sylvatica L.) and silver fir (Abies alba Mill.), whose Italian ranges are both characterised by the presence of widely disjoint meta-populations. Due to their valuable economic and ecological importance, both species are well studied at the European scale in terms of distribution of genetic diversity ([42], [38]), adaptive traits ([18], [20]), and impacts of climate change on their spatial distribution ([44], [48]). In addition, many marginal forest populations (MaPs) of both species do exist in Italy as possible target of FGR management.
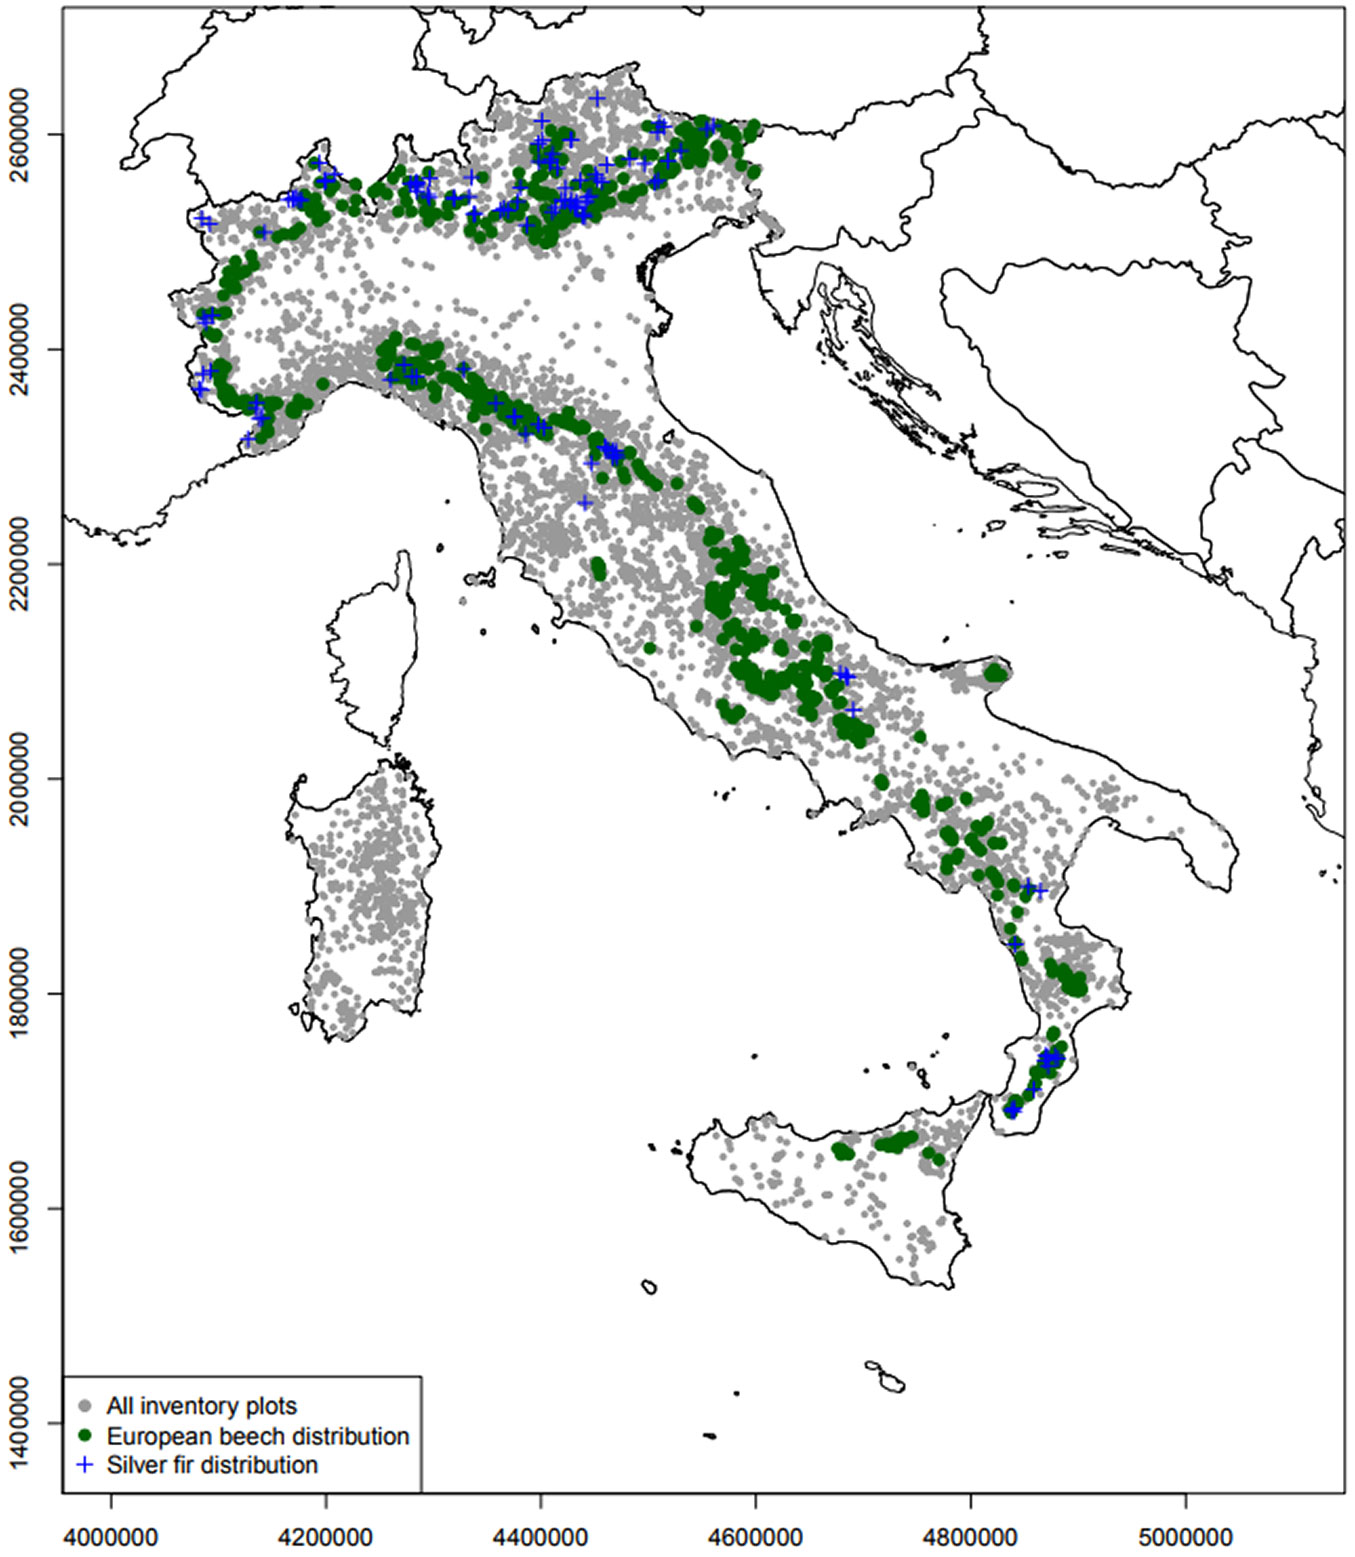
In Italy beech forests cover 1.035.103 ha corresponding to 9.89% of the total forest cover. Almost 89% of these are pure beech stands and just 11% is a mixture between beech and other conifers (mainly Pinus nigra or Abies alba). Concerning silver fir, 68.460 ha are dominated by this species (0.65% of the Italian forests) with 75.5% as pure or beech-fir mixed forest. Both species are mainly distributed along the Apennines chain (Fig. 1), but also in parts of the Alps. While the beech range is almost continuous along the whole Italian peninsula, silver fir is scattered and concentrated in Calabria, Abruzzo, Tuscany, Piedmont and North-eastern Alps. Both species are absent in Sardinia while some beech populations are located in Sicily. In addition to their shared ecological features, beech and silver fir were selected as examples of managed forest tree species representing: (i) a dominant species which forms pure stands (Fagus sylvatica) with an almost stable fundamental niche; (ii) a shade-tolerant species (Abies alba) often planted outside its native range and able to grow under a close canopy cover in mixed forests with an expanded niche.
Fig. 1 - The Italian National Forest Inventory (INFC 2005) points (grey dots), the spatial distribution of European beech (green dots) and silver fir (blue crosses).
Spatial co-ordinates in the Italian NFI dataset are subject to privacy restriction, and presence/absence data are provided with the co-ordinates of the south-western corner of a 1-km grid. To deal with this, a preparatory analysis was performed to test possible biases in niche estimation.
Spatial climate data pre-processing and coordinate uncertainty test
The choice of environmental predictors in spatial modelling needs care, as the exclusion of real drivers may lead to unreliable results, whereas the use of a wide spectrum of highly correlated (co-linear) variables can affect the importance of predictors and lengthen the computational time. The WorldClim database ([13]) has often been used for climatic data and indices in SDM applications ([30], [49]). These data are provided as a global raster with a maximum resolution of 30 arc-seconds (approximately 1 km at the equator). However, the use of WorldClim in local studies has been often criticised due to its global coverage ([4]). Therefore, we used the ClimateEU software, an online tool freely available at the website of the University of Alberta (Alberta, Canada). ClimateEU provides 36 climatic variables suitable for predicting local climate conditions in dendrochronological studies and simulations in Europe and Italy ([16], [24]). Fifty monthly, seasonal, and annual variables are available using this software, including many economically or biologically relevant variables such as growing and chilling degree days, heating and cooling degree days, Hargreave’s moisture deficit and reference evaporation. Future projections are based on 15 Global Circulation Models referenced in the IPCC Fifth Assessment Report for two emission scenarios (RCP4.5 and RCP8.5) and three standard time-slices (2020s, 2050s, 2080s). The use of multiple custom queries in the ClimateEU software allowed us to create 36 raster maps of the main climatic variables and indices over the Italian territory with spatial resolution of 250 m. For this study, the current average normal climate period 1981-2010 was used as reference. Two emission scenarios were also computed (RCP4.5 and RCP8.5) for the 2050s time-slice, using the IPSL-CM5A-MR model from the European Union implemented into ClimateEU. The full list of climatic variables calculated by ClimateEU is reported in Tab. S1, Tab. S2 and Tab. S3 (Supplementary material). In addition, a soil map of Italy ([8]) was included in the dataset.
Principal Component Analysis (PCA) was carried out on a total of 37 factors. To avoid the problem of different scales among different variables (temperatures, precipitation, potential evapo-transpiration indices, soil categories etc.), the dataset was centered and scaled. Calculated components up to 99% of the cumulative explained variance were used as predictors.
Once climatic surfaces were prepared, a set of “artificial niches” were simulated to test for possible biases due to co-ordinates uncertainty. Given that the co-ordinates of the NFI dataset were those of the southern-western corner of 1-km grid, all NFI points were firstly virtually modified, moving each point in the centre of each NFI location cell (+500 m to both X and Y co-ordinates). This layer was then spatially overlaid onto four climatic raster layers and the values of the climatic variables at each modified NFI point were extracted. The original 250-m rasters were then upscaled to 500 m, 750 m and 1 km, and a simulation was performed. A random sequence of spatial co-ordinates was generated across all the 1-km cells covered by each species in the NFI dataset. The total number of randomly-generated co-ordinates was equivalent to the real NFI points for each species (1316 for beech, 348 for silver fir). Such random extraction was repeated 10.000 times, and the results averaged across extractions. Using this approach, a set of “artificial” ecological niches was created and compared with the basic niche corresponding to the current position of the NFI plot (south-western edge) by non-parametric ANOVA ([21]), in order to test whether the variance among artificial ecological niches was higher than the variance within them.
SDM algorithms and modelling procedure
It is well known that different modelling techniques which use similar inputs could lead to divergent predictions of climate or species distributions, mainly in cases of local studies or reduced datasets ([2]). SDMs have been often criticised as suitable for modelling the probability of detection, whilst providing poorly predictions of species performance ([16]). In this study, the availability in the Italian NFI dataset of tree-level data (e.g., diameter at breast height and total height of each tree in each plot) allowed us to test for five different modelling approaches (in terms of presence/absence extraction) characterized by an expectedly increasing degree of complexity:
- The ecological niche of the target species was derived and modelled using all the records belonging to the most suitable NFI forest category (hereafter defined as forest category approach - FCA) included into the INFC2005 database (e.g., silver fir forests to model Abies alba, beech forests to model Fagus sylvatica).
- A tree-level selection of inventory points was performed using a basal area approach (BAA), thereby including all the NFI points where the species contributed to basal area by more than 1%, irrespective of the NFI forest category the corresponding point is included.
- A novel provenance distribution model approach (PDM) was devised. First, NFI points detected for each species using BAA were grouped based on environmental characteristics using hierarchical clustering prior to modelling. Then an adequate number of clusters (groups) was selected and modelled separately.
- A weighted BAA and PDM were computed (wBAA and wPDM), weighting each presence point differently according to the proportion of basal area of the target species in each.
Differences among methods were then evaluated by non-parametric ANOVA and post-hoc tests ([12], [21]) applied to True Skill Statistic (TSS) values. The aim was not to assess the best modelling procedure for each species but to test for differences among methods in modelling the distribution of two species which share a similar ecological environment.
The five approaches of presence/absence selection and the number of NFI points used in each approach are presented in Tab. 1. Due to the different numeric consistency (i.e., absence points were always almost six times more abundant than the presence points), the prevalence parameter was always set to 0.5 to balance the predictions ([1]). A set of nine different algorithms from the literature were tested and averaged to build a consensus map using the software package “biomod2” ([47]) in R ver. 3.3.3 ([39]). The set was comprised of: Generalized Linear Model (GLM), Generalized Boosted-regression Model (GBM), Generalized Additive Model (GAM), Classification Trees Analysis (CTA), Artificial Neural Networks (ANN), Flexible Discriminant Analysis (FDA), Multivariate Adaptive Regression Splines (MARS), Random Forest (RF) and the classical version of MAXimun ENTropy (MAXENT).
Tab. 1 - Modelled species and inventory (NFI) points considered for the tested methodology. (FCA): Forest Category Approach; (BAA): Basal Area Approach; (wBAA): weighted Basal Area Approach; (PDM): Provenance Distribution Modelling; (wPDM): weighted Provenance Distribution Modelling; (GCUs): number of genetic Conservation Units available from the EUFGIS database.
| Modelled species | Method | Presence points in NFI |
Proportion of NFI points |
Absence points in NFI |
GCUs |
|---|---|---|---|---|---|
| European beech | FCA | 796 | 10.95% | 6.476 | 47 |
| BAA & wBAA | 1316 | 18.10% | 5.956 | ||
| PDM & wPDM | 1316 (6 groups) |
Variable | Variable | ||
| Silver fir | FCA | 131 | 1.80% | 7.141 | 48 |
| BAA & wBAA | 348 | 4.79% | 6.924 | ||
| PDM & wPDM | 348 (6 groups) |
Variable | Variable |
To evaluate the quality of predictions delivered by each model, the dataset was randomly split into a training subset (75% of observations) and a testing subset (25% of observations). The splitting procedure was repeated 50 times and the average value and the standard deviation of the TSS index were calculated for each model ([1]).
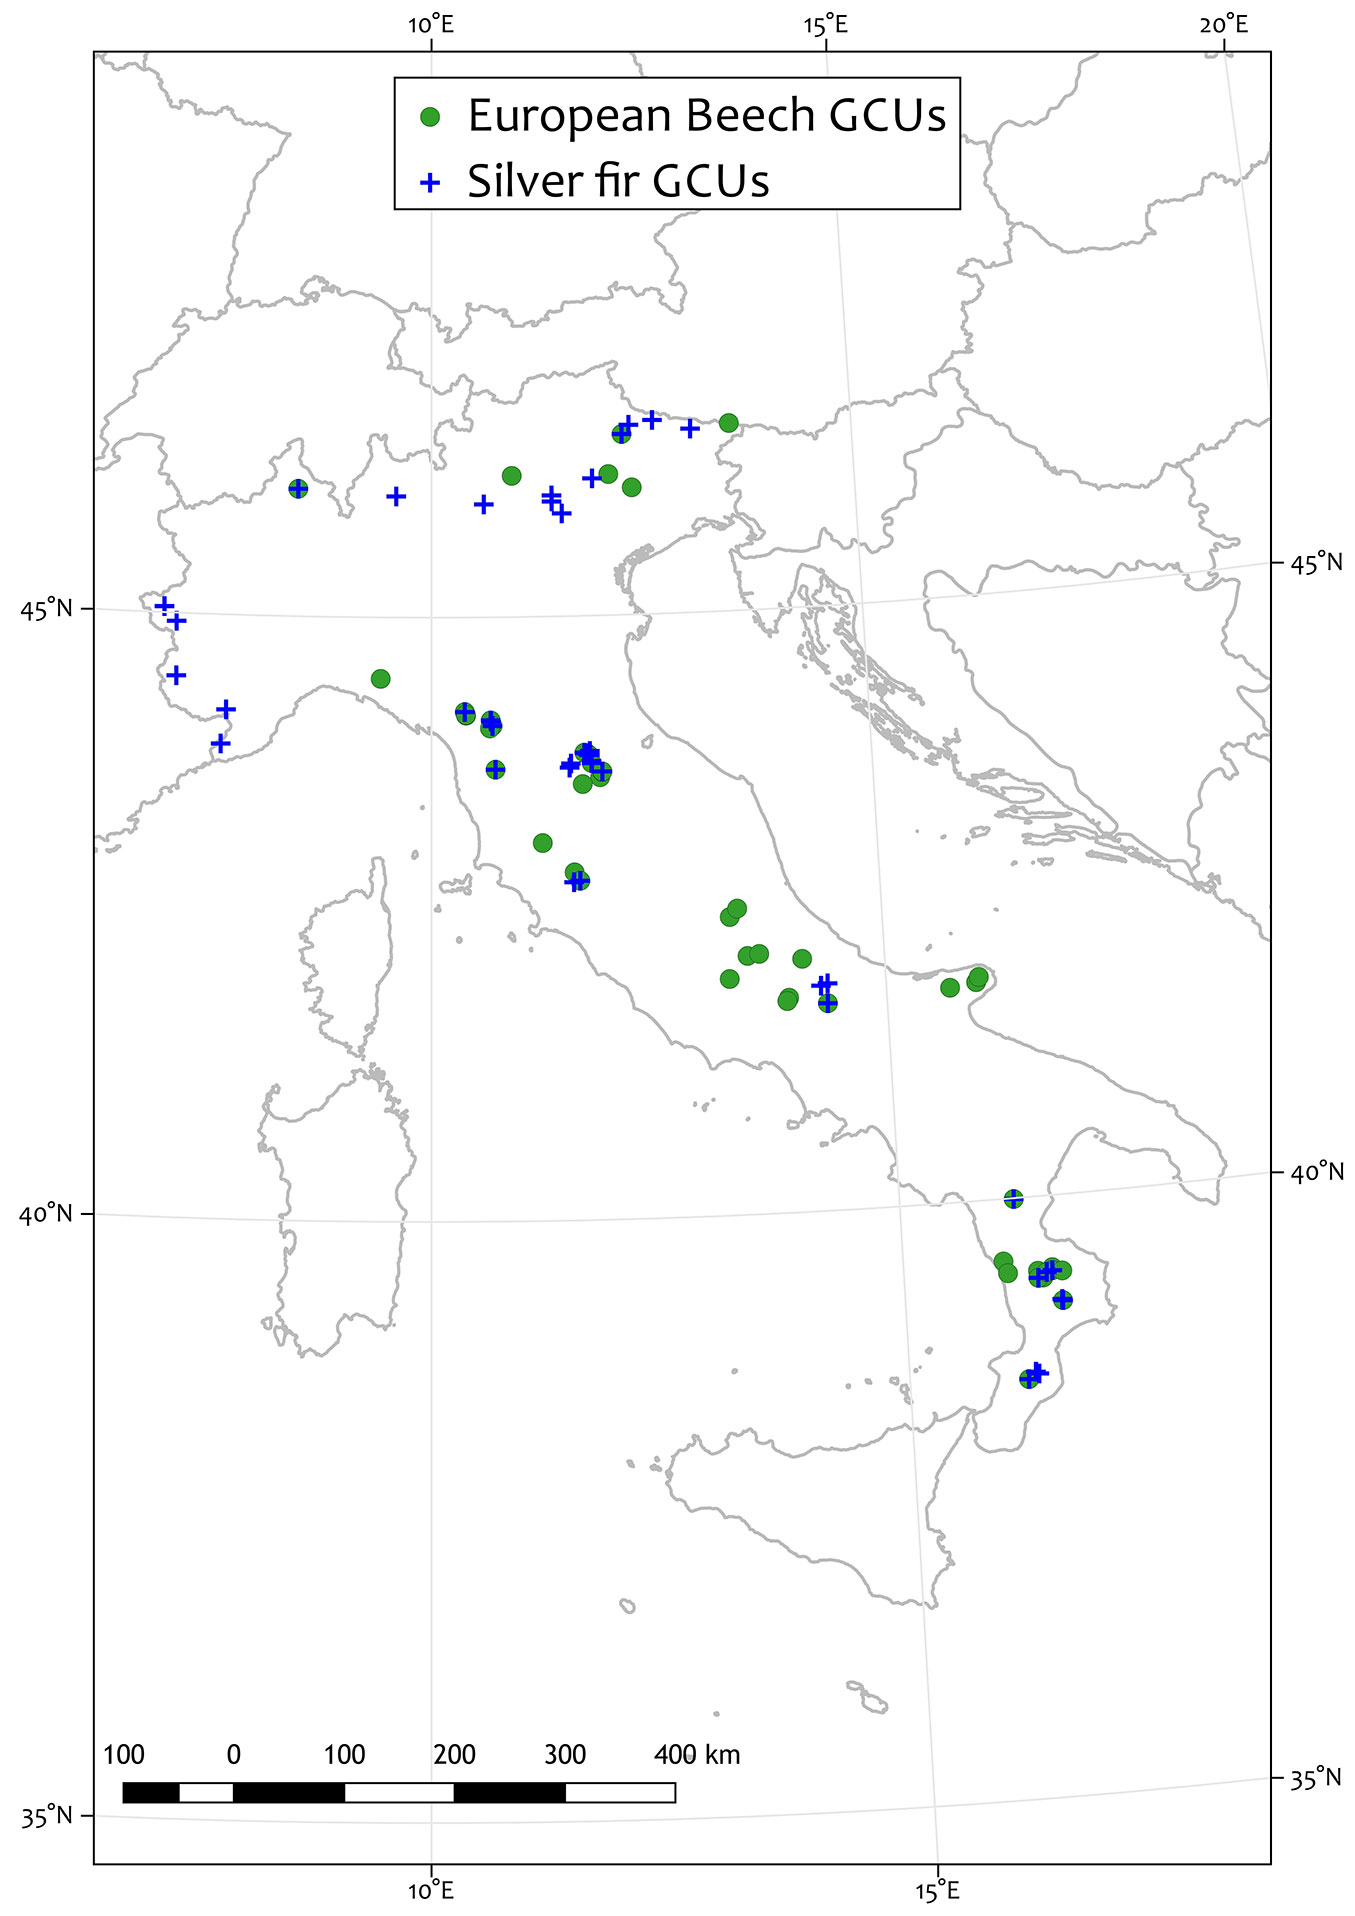
We used the best set of modelling procedure (ensemble) to map European beech and silver fir in Italy. A consensus model was calculated using the full-model predictions (i.e., using 100% of the available NFI points) and no TSS threshold was introduced to filter model before averaging. This analysis produced three distribution maps for each target species, one for the current baseline climate and conditions, and two maps showing the predicted distribution for future climate projections for the period centred on the 2050s for RCP4.5 and RCP8.5, respectively (Fig. 2). Finally, the consensus maps were included in a GIS and indications for the management of the Italian Genetic Conservation Units (GCUs) were derived for the two studied species included into the EUFGIS database (⇒ http://www.eufgis.org/).
Fig. 2 - Spatial distribution of the Italian Genetic Conservation Units (GCUs) for the two studied species (European beech and silver fir).
Results
The results of PCA on climate variables showed that the 99% of the environmental variability could be summarized into seven uncorrelated PCA axes components (Tab. 2). The first component (PC1) accounted for most of the variance (77.82%) with a well balanced contribution of 37 environmental predictors. As expected, no single environmental variable prevailed on the others. On PC1, the average (absolute) eigenvector was 0.16o with a standard deviation of 0.039, demonstrating a high degree of co-linearity between the environmental predictors. The range (in absolute values) was between 0.017 (winter precipitations) and 0.185 (average temperature of the autumn) with a median value of 0.177. The remaining proportion of variance was distributed between six other components, with more than 95% included in the first four principal components. As a consequence, we used seven predictors in the biomod2 calculation (see below).
Tab. 2 - Summary statistics of the PCA eigenvectors for the 37 predictive variables considered.
| Variable | PC1 | PC2 | PC3 | PC4 | PC5 | PC6 | PC7 |
|---|---|---|---|---|---|---|---|
| MIN Eigenvector | 0.016 | 0.001 | 0.003 | 0.001 | 0.001 | 0.002 | 0.002 |
| MEDIAN Eigenvector | 0.177 | 0.118 | 0.087 | 0.061 | 0.085 | 0.067 | 0.093 |
| MEAN Eigenvector | 0.160 | 0.134 | 0.112 | 0.113 | 0.119 | 0.109 | 0.122 |
| Eigenvectors SD | 0.039 | 0.097 | 0.122 | 0.121 | 0.115 | 0.125 | 0.112 |
| MAX Eigenvector | 0.185 | 0.356 | 0.560 | 0.545 | 0.478 | 0.703 | 0.519 |
| Explained standard deviation | 5.365 | 1.822 | 1.602 | 0.947 | 0.611 | 0.548 | 0.467 |
| Proportion of variance | 0.778 | 0.090 | 0.069 | 0.024 | 0.011 | 0.008 | 0.006 |
| Cumulative proportion of variance (%) | 77.82 | 86.79 | 93.73 | 96.16 | 97.17 | 97.98 | 99.3 |
Concerning niche simulations, no statistical differences were observed between the ecological niche used for modelling (i.e., using the original co-ordinates provided by INFC) and any of the “artificial niches” we simulated (Tab. 3) with p-values >0.05.
Tab. 3 - Statistical differences between covered niches.
| Group A | Group B | ANOVA p-value |
|---|---|---|
| Raster 250 m | Average 500 m | >>0.05 |
| Raster 250 m | Average 750 m | >>0.05 |
| Raster 250 m | Average 1 km | >>0.05 |
| Raster 250 m | Random 250 km | Average >>0.05 ± 0.003 |
| Raster 250 m | Average 500 m | >>0.05 |
| Raster 250 m | Average 750 m | >>0.05 |
| Raster 250 m | Average 1 km | >>0.05 |
| Raster 250 m | Random 250 km | Average >>0.05 ± 0.001 |
Regarding the different modelling approaches, the FCA showed low predictive performances, with a mean TSS always lower than 0.7 for all algorithms (a threshold generally accepted as satisfactory for environmental models - [45]), with an average TSS value of 0.642 ± 0.058 (Tab. 4) and a coefficient of variation always lower than 9.06%. The Generalized Boosted-regression Model (GBM) was the best performing algorithm (TSS = 0.679), being statistically different from the other algorithm applied.
Tab. 4 - Average TSS values for each extraction method and statistical groups according to non-parametric ANOVA. (*): Average value of the 6 ecological provenances for each species.
| Method | Average TSS | Standard Deviation |
Groups |
|---|---|---|---|
| PDM | 0.830* | 0.184 | a |
| wPDM | 0.643 | 0.244 | b |
| FCA | 0.642 | 0.058 | b |
| BAA | 0.636 | 0.046 | b |
| wBAA | 0.557 | 0.123 | c |
No significant improvements were observed in the prediction of species distribution using the BAA approach. However, a lower variability was detected among runs and algorithms (the global coefficient of variation was 7.15%), indicating a more stable prediction among runs. Using BAA, RF was the best performing model (TSS = 0.661), being statistically different from the others. The weighted version of this approach (wBAA) did not show any improvement in the predictions. On the contrary, TSS values calculated for wBAA were much lower and statistically different from the others (average TSS = 0.557), indicating that wBAA was the worst model.
The best model performances were obtained using the PDM approach. This method was based on the result of a hierarchical clustering where six groups were selected for both species as fair trade-off between environmental variability and spatial fragmentation. Hierarchical clustering allowed for the whole ecological niche to be split into several clearly-defined sections with a strong “ecological signal”. Using this procedure, models’ calculations were fitted on a smaller and more homogeneous part of the realized ecological niche. The predictions obtained by this approach were significantly improved, with an average TSS of 0.830 and maximum values of about 0.9 using GLM, GBM, RF and MARS algorithms. However, very low and unexpected values were found using MAXENT, with TSS close to 0.3. Similarly, the TSS for wPDM also decreased as compared with PDM, though the observed average values were not statistically different from using either the FCA and BAA approaches.
The results of the comparisons (ANOVA) among all models and algorithm combinations are reported in Tab. S4 (Supplementary material).
An ensemble model was built for each provenance of each species (Fig. 3) and future scenarios using the software biomod2. A consensus map was implemented in GIS showing the probability of detection of European beech and European silver fir for each Italian GCU of the EUFGIS database, i.e., the probability of detection of each ecological provenance in each GCU. Given the structure of PDM, six different suitability values were available in each GCUs for both species. To deal with this, the best performing provenance in each GCUs was extracted in each analysed time slice. The results of this analysis are summarised in Fig. 4 which shows the boxplots of the probability of detection (i.e., survival) for each species in each climate projection. Based on model predictions, a reduction of suitable habitats is expected under future climate projections in all GCUs, as well as a range shrinking for both beech and silver fir.
Fig. 3 - Box-plots of probability of detection in the Genetic Conservation Units (GCUs) with basal area approach (BAA) for the two studied species.
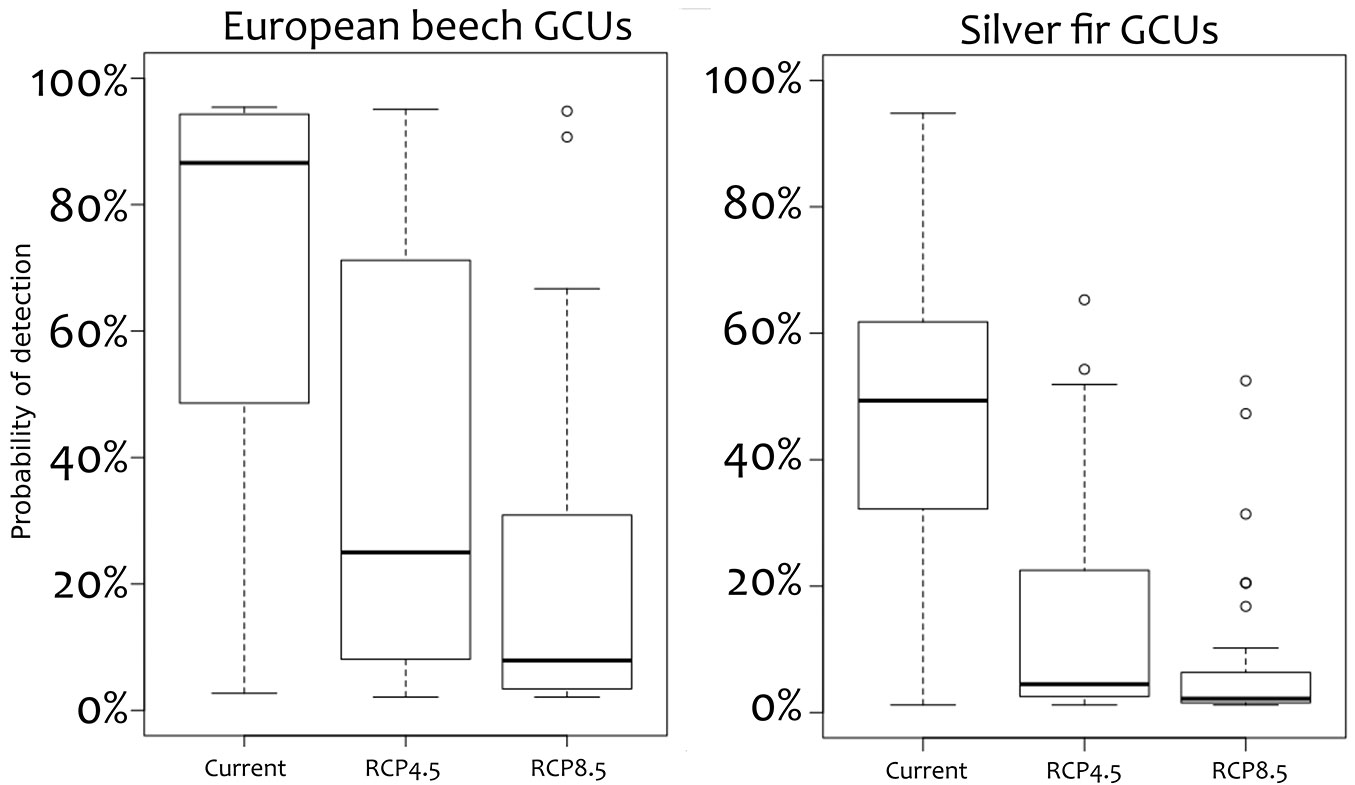
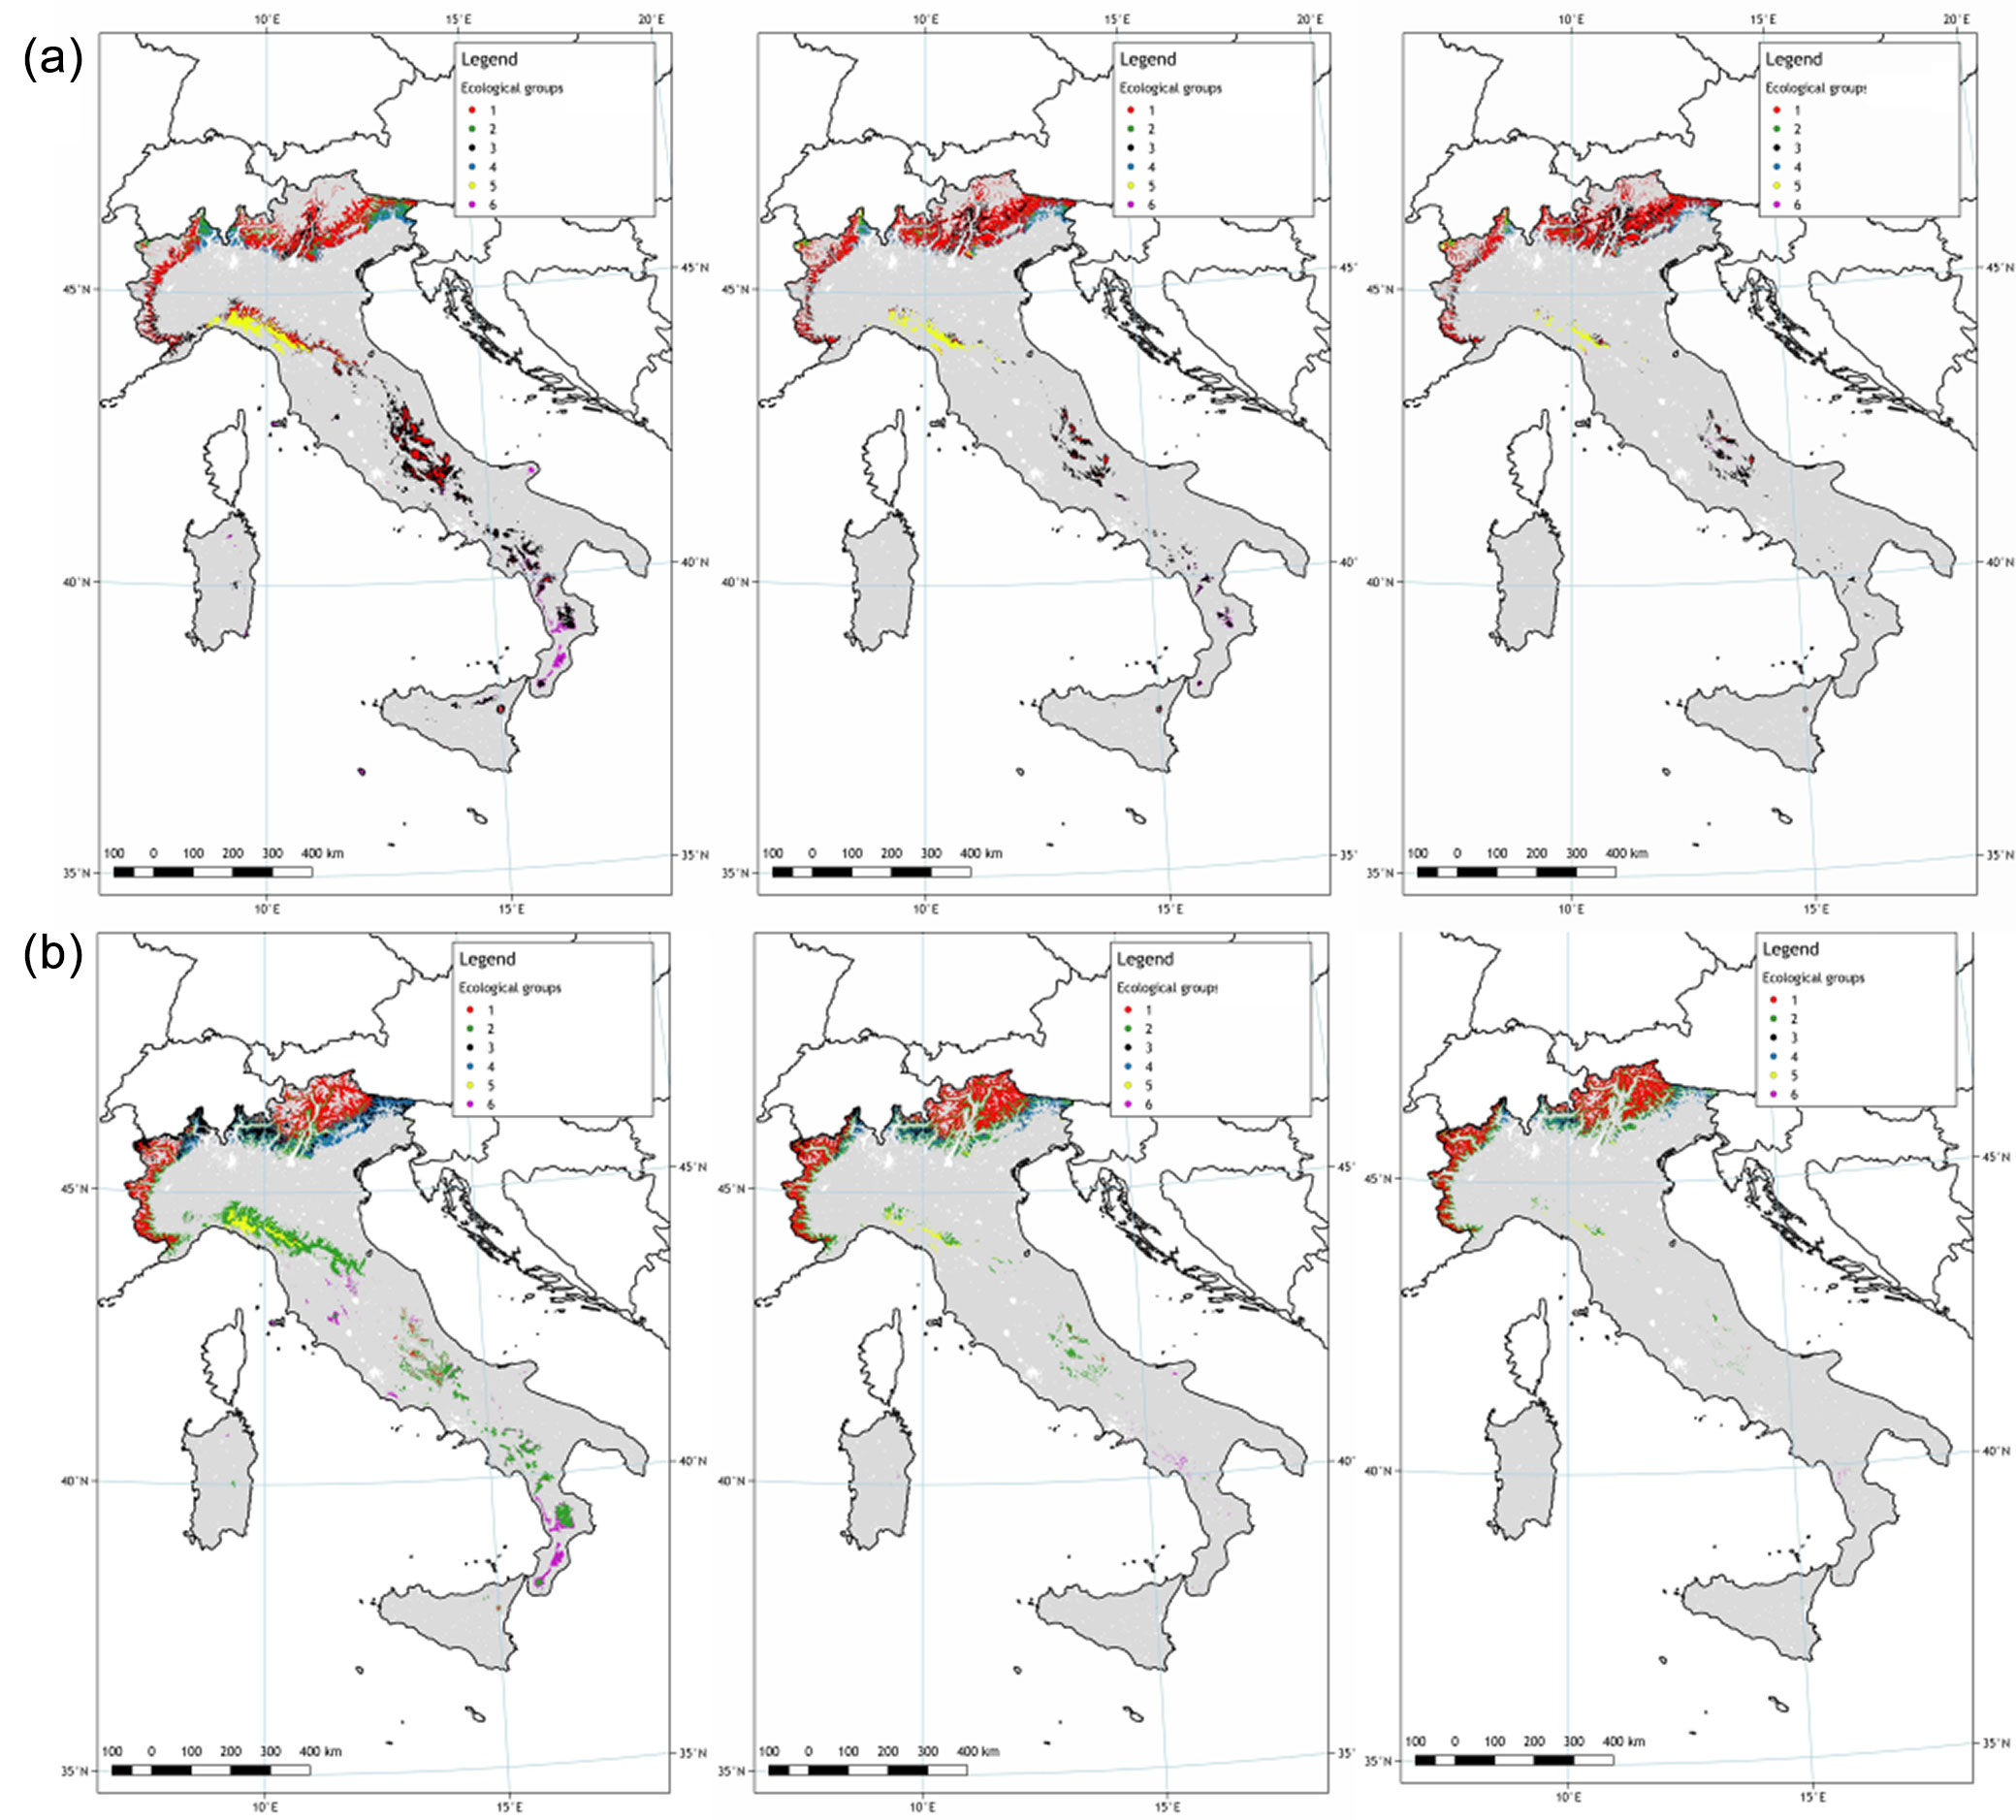
Fig. 4 - Provenance distribution model (PDM) for (a) European beech and (b) silver fir for 2050 climate projections driven by the two selected green-house gas emissions scenarios RCP4.5 and RCP8.5.
Discussion
Despite a possible bias in niche estimation stemming from positional uncertainties of the NFI dataset, the use of ancillary tree-level data derived from the Italian NFI and the use of more sophisticated models did not significantly improve SDM performances in this study. Both the applied weighting procedures (wBAA and wPDM) showed a reduction in performance compared to unweighted methods (BAA and PDM). Although model complexity and performances have often been demonstrated to be uncorrelated in ecological analysis ([28], [26]), such differences between weighted and unweighted models may be explained by pure modelling aspects and evaluation methods. Indeed, the True Skill Statistic (TSS) was developed to improve Cohen’s kappa dependence on prevalence ([1]) and is the most widely used measure for SDM performances and for models generating presence/absence predictions in general ([3]). However, results demonstrated this index might be unreliable when a weighted SDM is performed. The TSS is typically used for binomial response variables (1/0), involving the calculation of sensitivity and specificity. In this study, weighted models were applied to calculate a smoothed value, corresponding to the performance of the species in any environmental (i.e., geographic) location. All presence points are evaluated from biomod2 input (i.e., presence=1, absence=0), and values equal to 1 are likely to be obtained for the ecological optimum in predicting species performance. This could likely explain the lower TSS values obtained using wBAA and wPDM, as compared with classical unweighted models.
With BAA modelling no differences in SDM performance were detected when compared to the more general FCA method. The use of a hierarchical clustering before the biomod2 analysis in the PDM approach highly improved the SDM results, leading to a more precise niche estimation. When many points are used for modelling (as in the case for presence/absence datasets), a strong “background noise” is included in the calculation, and a “coarse” ecological niche is obtained, thereby losing some species-specific ecological features, such as those held in marginal and peripheral forest populations, which are characterized by a limited number of NFI points ([9]). This aspect was obvious in our study where a TSS value of 0.83 was calculated using the PDM approach, which was much higher than that obtained using FCA and BAA (0.642 and 0.636, respectively). The average value for PDM was highly influenced by results of MAXENT, whose TSS value was surprisingly low (≈0.3). A TSS value of approximately 0.9 was calculated for PDM when averaging all the algorithms except MAXENT, whose prediction was probably affected by the use of a low-memory version of the algorithm. MAXENT is widely used and well-referenced in the literature ([29]), but the evaluation of its performance was out of the scope of this study.
The PDM approach presented here has rarely been implemented in the literature. Researchers often use the whole distribution range of forest species ([43]), and a similar approach was recently developed by Isaac-Renton et al. ([16]) with Douglas-fir, where a SDM was used to clip a RandomForest classification of the European environment, based on the ecological features of Douglas-fir in the Pacific North West. New insights can be achieved using provenance distribution models, which could be integrated with the classical use of forecasting range shifts, such as replacing local provenances with better adapted material from lower latitudes or lower elevations ([34], [25]). Indeed, using the provenance distribution model indirect hypotheses can be made on the genetic diversity distribution of a species, assuming a connection between ecological and genetic diversity as a result of long term-evolutionary processes and local adaptation ([9], [22], [10]). However, forest genetic diversity is not directly included into NFIs data, and it needs spatially explicit information to infer genetic variation parameters.
NFI data and the provenance distribution modelling method in a European context
At a wider scale, merging all the European NFIs could lead to the construction of an important dataset of species distribution. NFIs are often difficult to harmonized due to differences in national inventory definitions, sampling designs, plot size and density, measured variables, and measurement protocols ([27]). The use of NFI data at a European scale would have great impact on SDM results due to the possibility of excluding broad envelopes or statistical maps and correctly detecting the true absence of species. With such data, the reliability of SDM and PDM for the whole Europe would be improved. Indeed, while many studies in species distribution modelling have focused on the importance of presence points ([23]), the reliability and availability of true absence points is rarely discussed. Presence points are fundamental to derive ecological niches and are treated as the most relevant issue in SDM approaches. However, a much higher degree of uncertainty lies in the absence of a given species at a particular location, whether is due to ecological or human-related reasons. Such information is fundamental to set an “exclusion threshold” of each species for better modelling its distribution. Many tools have been tested to describe and simulate absence data (e.g., pseudo-absences or background points), for example: random spatial selection, regular grids, ecological distance (also known as Surface Range Envelope method) and spatial distance from presence records ([3]). The use of NFI datasets could reduce the problem of the lack of quality of absence data.
PDM in the framework of marginal forest populations and climate change
Robust models and tools are essentials to drive forest practice, forest management and the use and transfer of forest reproductive materials ([50]). Even when gene pools are artificially moved or transferred (e.g., assisted gene flow or migration) the use of well-adapted seed and forest reproductive material is a fundamental issue under the projected climate change ([17]). In this context, the conservation of MaPs and endemic species should be seen as a priority ([10]). Novel SDM techniques and approaches in combination with monitoring efforts of European networks (e.g., EUFGIS or ICP-Forests) will help forest managers to develop mitigation and adaptation strategies. Novel methods to preserve and connect endangered and fragmented rear-edge meta-populations across the Mediterranean basin have to be developed.
The rear-edge of many Mediterranean forest species represented by fragmented habitats in southern Europe is a strategic area of research to detect marginal populations and their precise niche using SDM techniques. An effective approach should integrate range-wide analysis with data on adaptive traits and phenotypic plasticity of provenances from comparative field trials. In fact, combining the information on genetic variation and adaptive potential of species in NFI datasets would provide a very useful tool to detect marginality, possibly useful MaPs, and help their management. For instance, all forest populations lying close to the boundary of suitable/unsuitable niche space in suitability maps (e.g., 5%-10%-20% of probability of detection) may be studied as candidates for ecological marginality.
The Italian peninsula is widely recognized as a forest biodiversity hotspot ([36], [33]) based on studies of the environment and climate conditions developed for PDM at a regional scale. The genetic resources of mesophilic species will be increasingly endangered under climate change, and the probability of their retreat or disappearance is high. Moreover, because of their adaptive potential and/or phenotypic plasticity, southern populations may be transferred to more northerly latitudes for conservation purposes and/or to improve the resilience of northern and central-European forests under climate change. In this context, a typical example is the European silver fir from Serra S. Bruno (Calabria, Italy - [18]).
New interesting scenarios may be explored using the PDM approaches, which could help establish effective recommendations and guidelines to face climate change. On the one hand, local models (i.e., ecological groups) may be more appropriate to predict small endangered populations recognized as ecologically marginal. On the other hand, MaP conservation protocols may be studied, including gene pool improvement using material from different ecological zones that is predicted to grow and adapt well in the selected MaP. The possible introduction into endangered populations of new genotypes from different ecological regions already adapted to forest ecosystems in projected climates, will require additional information which is not provided in NFIs, but that can be inferred through the projected spatial distribution of genetic diversity ([22]).
Conclusions
The PDM approach used in this study may represent a valuable step forward for spatial analysis, thanks to the possibility of modelling each group separately. Although statistically-designed and characterized by a wide range of ancillary data, the information from NFIs can improve the high-resolution species distribution models and the provenance suitability models, going beyond the simple concept of “ecological suitability”. All the unweighted methods presented in this study show a high probability of detection of genotypes within marginal forest populations. Exact spatial co-ordinates of plots and additional information on site quality such as stand age and or site index are required to weight presence/absence properly, and to test new evaluation methods. In our opinion, novel evaluation criteria should be developed to complement the classical true skill statistic (TSS), the area under the receiver operating characteristic curve (AUC, ROC or AUROC) or Cohen’s Kappa. For instance, wBAA and wPDM approaches could be validated using site index and average volume increment for each inventory plot. Fertility and average growth can not be currently derived from the Italian National Forest Inventory (INFC2005) because age is currently missing and only current volume increment is available.
Acknowledgements
This work has been supported by the COST Action FP1202 MaP-FGR (⇒ http://map-fgr.entecra.it/) and TREES4FUTURE FP7 project (⇒ http://www.trees4future.eu/). We are grateful to all the reviewers for their useful suggestions which improved the early version of this manuscript.
References
Gscholar
CrossRef | Gscholar
CrossRef | Gscholar
CrossRef | Gscholar
CrossRef | Gscholar
CrossRef | Gscholar
CrossRef | Gscholar
Authors’ Info
Authors’ Affiliation
Fulvio Ducci
CREA - Research Centre for Forestry and Wood, v.le S. Margherita 80, I-52100 Arezzo (Italy)
Corresponding author
Paper Info
Citation
Marchi M, Ducci F (2018). Some refinements on species distribution models using tree-level National Forest Inventories for supporting forest management and marginal forest population detection. iForest 11: 291-299. - doi: 10.3832/ifor2441-011
Academic Editor
Piermaria Corona
Paper history
Received: Mar 23, 2017
Accepted: Feb 06, 2018
First online: Apr 13, 2018
Publication Date: Apr 30, 2018
Publication Time: 2.20 months
Copyright Information
© SISEF - The Italian Society of Silviculture and Forest Ecology 2018
Open Access
This article is distributed under the terms of the Creative Commons Attribution-Non Commercial 4.0 International (https://creativecommons.org/licenses/by-nc/4.0/), which permits unrestricted use, distribution, and reproduction in any medium, provided you give appropriate credit to the original author(s) and the source, provide a link to the Creative Commons license, and indicate if changes were made.

Web Metrics
Breakdown by View Type
Article Usage
Total Article Views: 52635
(from publication date up to now)
Breakdown by View Type
HTML Page Views: 42281
Abstract Page Views: 4316
PDF Downloads: 4693
Citation/Reference Downloads: 50
XML Downloads: 1295
Web Metrics
Days since publication: 3004
Overall contacts: 52635
Avg. contacts per week: 122.65
Article Citations
Article citations are based on data periodically collected from the Clarivate Web of Science web site
(last update: Mar 2025)
Total number of cites (since 2018): 26
Average cites per year: 3.25
Publication Metrics
by Dimensions ©
Articles citing this article
List of the papers citing this article based on CrossRef Cited-by.
Related Contents
iForest Similar Articles
Editorials
Workshop COST E52 “Evaluation of beech genetic resources for sustainable forestry”
vol. 2, pp. 104 (online: 10 June 2009)
Technical Reports
Conservation and use of elm genetic resources in France: results and perspectives
vol. 13, pp. 41-47 (online: 03 February 2020)
Research Articles
Juvenile growth response of European beech (Fagus sylvatica L.) to sudden change of climatic environment in SE European trials
vol. 2, pp. 213-220 (online: 22 December 2009)
Research Articles
Patterns of genetic diversity in European beech (Fagus sylvatica L.) at the eastern margins of its distribution range
vol. 10, pp. 916-922 (online: 10 December 2017)
Research Articles
Delineation of seed collection zones based on environmental and genetic characteristics for Quercus suber L. in Sardinia, Italy
vol. 11, pp. 651-659 (online: 04 October 2018)
Research Articles
Local ecological niche modelling to provide suitability maps for 27 forest tree species in edge conditions
vol. 13, pp. 230-237 (online: 19 June 2020)
Research Articles
Networking sampling of Araucaria araucana (Mol.) K. Koch in Chile and the bordering zone of Argentina: implications for the genetic resources and the sustainable management
vol. 2, pp. 207-212 (online: 22 December 2009)
Research Articles
Age trends in genetic parameters for growth and quality traits in Abies alba
vol. 9, pp. 954-959 (online: 07 July 2016)
Research Articles
The maternal environment of European beech (Fagus sylvatica L.) affects intrapopulation variability in seed traits and germination
vol. 19, pp. 114-121 (online: 10 April 2026)
Research Articles
Modelling the carbon budget of intensive forest monitoring sites in Germany using the simulation model BIOME-BGC
vol. 2, pp. 7-10 (online: 21 January 2009)
iForest Database Search
Search By Author
Search By Keyword
Google Scholar Search
Citing Articles
Search By Author
Search By Keywords
PubMed Search
Search By Author
Search By Keyword


