Effects of nitrogen loading under low and high phosphorus conditions on above- and below-ground growth of hybrid larch F1 seedlings
iForest - Biogeosciences and Forestry, Volume 11, Issue 1, Pages 32-40 (2018)
doi: https://doi.org/10.3832/ifor2395-010
Published: Jan 09, 2018 - Copyright © 2018 SISEF
Research Articles
Abstract
Under present environmental conditions, hybrid larch F1 (Larix gmelinii var. japonica × Larix kaempferi) is a promising afforestation species as it has a high growth rate and tolerance against grazing damage, disease and cold. However, the input of nitrogen (N) to forests due to the increase of anthropogenic N is causing imbalances of N compared to other nutrients, especially phosphorus (P), thus affecting the root growth of healthy seedlings. However, knowledge on how different N and P conditions affect F1 root growth is still limited. In this study, various N (3 levels) and P (no addition and addition) conditions were imposed to investigate the effect of N loading on larch F1 seedlings under different P conditions. Needle N: P ratio, aboveground growth, belowground growth as well as fine root production were measured. The results showed that needle N: P ratio was higher under low P loading, and aboveground growth of seedlings increased with N loading at both low and high P conditions. Relative fine root production was decreased by N loading. On the other hand, fine root to total dry proportion was increased by N loading at no P addition, suggesting that limited P availability could increase fine root production. Total root proportion to total dry mass was decreased by N loading at both P conditions. We concluded that N loading has different effects on above- and below-ground growth of larch F1 and its effects may also differ according to P conditions, indicating that both N and P conditions should be carefully considered when planting hybrid larch F1.
Keywords
Nitrogen Deposition, Phosphorus, Fine Root Production, N: P Ratio, Hybrid Larch F1
Introduction
The genus Larix is largely distributed over cool temperate regions in the northern hemisphere ([14], [1]). Among the Larix species, Japanese larch (Larix kaempferi) is especially known for its high growth rate ([27]) and is an important afforestation species across the northern hemisphere, especially in the east Eurasian regions ([39]). However, problems such as low tolerance to vole feeding and shoot blight disease have raised concerns ([20], [19]). To address these concerns, hybrid larch F1 was developed by intercrossing Dahurian larch (Larix gmelinii var. japonica) and Japanese larch. As a result, F1 not only shows high tolerance to vole feeding and shoot blight disease but also has a higher initial growth rate and high capacity for carbon absorption under present environmental conditions such as CO2 concentration, temperature, rainfall etc. ([29], [18], [39]). As the Larix species is broadly distributed across east Eurasian regions ([1]), F1 is one of the promising new afforestation species for CO2-fixation, storage and timber production. Therefore, it is important to investigate the F1’s growth under changing environmental conditions, such as the increase of nitrogen (N) deposition which alters soil nutrient conditions.
Anthropogenic N has been drastically increasing at global level since the industrial and agricultural revolution, and various studies have focused on its effects on forest ecosystems ([3], [11], [12], [28]). Since the growth of boreal forest ecosystems are reported to be limited by soil N ([46]), N input may increase plant growth to some extent. However, N saturation and negative effects have also been reported ([2], [24]). Plant growth can also be limited by other elements such as phosphorus (P). P limitation has been observed in immature volcanic ash soil (Vitric Andisols), which show strong P retention ([42]). Therefore, increase of N deposition under Vitric Andisols may cause imbalances in soil N and P, and simultaneously induce P limitation ([47]) which may potentially have negative effects on plant growth. The literature review by Peñuelas et al. ([34]) reported that N deposition (or N loading) has indirect effects on plants by causing alteration to the N: P ratio. Several other studies have observed that N: P ratio of foliage correlates negatively with net photosynthetic rate ([37]), plant growth ([8]) and biomass production ([15]).
As N loading may be one approach to address N deposition effects, Qu et al. ([35]) reported detrimental effects of N loading on root growth and biomass of larch F1 seedlings by conventional and exponential fertilization methods. Indeed, high N loading decreased root length and surface, which resulted in decreased shoot development. Moreover, they noted that when enough N is available for seedlings, aboveground growth was prioritized over belowground growth. Mao et al. ([26]) investigated the effect of N loading on 2-year-old F1 seedlings at low soil P conditions to evaluate P limitation induced by N increase. However, in contrast to their hypothesis, N loading had the same increasing effect on growth at both low and high P conditions in forest brown soil (Dystric Cambisols). Mao ([25]) found that both N and P loading increased the surface area of fine roots in Vitric Andisols (low nutrient condition soil). As fine roots play the role of absorbing nutrients and water, fine root growth is vital for seedling survival and drought tolerance. Furthermore, fine roots are also strongly influenced by nutrient availability ([5]), and can be easily altered by changes in N and P conditions.
Previous studies on the effect of N loading on hybrid larch F1 have focused on a single growing season ([19], [50], [25], [26], [36]). However, the effect of nutrient conditions may change according to loading duration, and the effect on belowground growth may also change. Therefore, there is a need to better understand how a longer loading duration affects the belowground growth of hybrid larch F1.
Our objective was to investigate the effects of varying N and P conditions on above- and below-ground growth of hybrid larch F1. We hypothesized that N loading under low P conditions will increase N: P ratio, causing P limitation. Therefore, N loading will only have positive effects on growth under high P loading conditions. Also, root growth will decrease by N loading, and this will be more significant with P loading, since aboveground growth will be prioritized instead of investments made for nutrient acquisition.
Materials and methods
Plant material and soil conditions
Thirty-six hybrid larch F1 (Larix gmelinii var. japonica × Larix kaempferi) seedlings produced at the Hokkaido Forestry Research Institute (Bibai, Japan) were used. In 2012, the 2-year-old seedlings were taken out of a stock room and planted in 30 L pots filled with Akadama soil and Kanuma pumice soil at a volume ratio of 1: 1. This soil mix was chosen to simulate Vitric Andosols, which are widely distributed across the Hokkaido Island. Both Akadama and Kanuana pumice soils are derived from volcanic soil and are high in aeration, water and fertilization retention, and water availability. These soils lack nutrients and absorb phosphoric acid, which make it difficult for plants to absorb P. Akadama soil is slightly acidic (pH = 5.2), whereas Kanuma pumice soil is acidic (pH = 4.8).
In spring 2015, seedlings were replanted into 44 L pots with the same soil mix to prevent their roots from becoming potbound (pot effect). Seedlings were grown at the experimental nursery of Hokkaido University (43° 07′ N, 141° 38′ E, elevation 15 m a.s.l.) under natural (open air) conditions. Annual average precipitation was 1274.5 mm and 1360.0 mm in 2015 and 2016, respectively, while annual average temperature was 10.0 °C and 9.3 °C, respectively, as measured at the Sapporo Regional Headquarters (JMA: 43° 03.6′ N, 141° 38′ E, elevation 19.7 m a.s.l.). When there was no rainfall for a week, seedlings were irrigated until the pots were fully watered. The snow free period is from mid-November to late April. The accumulated snow depth is approximately 1.2 m during mid-January to early March.
Loading treatments
To investigate the effects of N deposition at low and high P conditions, 3 levels of N and 2 levels of P were imposed ([25], [26]). The loading treatment began in 2012 and continued until 2016 (4 years). The 3 N levels were: 0, 50 and 100 kg N ha-1 yr-1 and were labeled as N0, N50, N100, respectively. N50 treatment simulates the typical estimation of N deposition at Asian regions ([32], [10]) and the N100 treatment reflected an excessive N loading. Regarding P loading, the high treatment was set at 50 kg P ha-1 yr-1 (hereafter: P50) with reference to common agricultural practices, while 0 kg P ha-1 yr-1 was set as low P treatment (hereafter: P0). Six different treatments were obtained by combining the three N with the two P levels, which were labeled as follows: N100P50, N50P50, N0P50, N100P0, N50P0, and N0P0 (control). There were 6 seedlings in each treatment for a total of 36 seedlings. Kanuma soil and Akadama soils have almost no nutrients, thus Hyponex® fertilizer (N: P: K = 6:10:5, Mg: 0.05%, Mn: 0.001%, B: 0.005% - HYPONex Japan, Japan) was added in 2015 as top dressing in mid-May and at the end of June with 1000× dilution by deionized water. By Hyponex addition, 12.5 kg N ha-1 yr-1 and 21.1 kg P ha-1 yr-1 was added. The amount added by Hyponex was subtracted from the N and P loading in 2015. However, since Hyponex was given to all seedlings, treatments N0 received 12.5 kg N ha-1 yr-1 and treatments P0 received 21.1 kg P ha-1 yr-1 in 2015.
Ammonium nitrate (NH4NO3) was used as nitrogen source to simulate N deposition from acid rain and aerosols in Japan ([17]), while monopotassium phosphate (KH2PO4) was used as P source. Both were dissolved and given with 500 mL of deionized water. In Hokkaido, a considerable amount of N is released from snowmelt, therefore N was applied 3 times at a ratio of 2:1:1 (100 kg N ha-1 yr-1: 50, 25, 25 kg N ha-1 yr-1, 50 kg N ha-1 yr-1: 25, 12.5, 12.5 kg N ha-1 yr-1) in mid-June, mid-July and mid-August. As for P, it was applied 3 times at a ratio of 1:1:1 (16.7, 16.7, and 16.7 kgP ha-1 yr-1) at the same time as N. In 2016, N and P were applied in 4 times at a ratio of 2:1:1:1 for N (100 kg N ha-1 yr-1: 40, 20, 20, 20 kg N ha-1 yr-1, 50 kg N ha-1 yr-1: 20, 10, 10, 10 kg N ha-1 yr-1) and a ratio of 1:1:1:1 for P (12.5, 12.5, 12.5, 12.5 kg P ha-1 yr-1). This was to shorten the time between N and P applications and to prevent N and P from being washed away with rain as much as possible. Large plates were also placed under the pots to prevent leaching.
Sampling and analysis
Aboveground
To examine needle N and P concentration, a small proportion of needles located at the top part (i.e., elongation shoot and its branches) of all 36 seedlings were randomly collected before and after N and P loading treatments (2015: May 25 and September 3; 2016: June 12 and August 15). The sampled needles were dried at 70 °C for 72 hours.
Leaf litter was also collected on December 15, 2015 and November 12, 2016 by covering each whole seedling with a litter trap made with 1 mm mesh net, as described in Miyaura & Hozumi ([30]). Traps were placed in mid-October of each year, right after the needles began to change color. The litter collected in 2015 was also used as total needle biomass. Collected leaves were dried at 70 °C for 72 hours, and then weighed.
Needle N concentration was measured with a NC analyzer (Elemntar®, VarioEL III, Germany), and the inductively coupled plasma-mass emission spectrometer ICP-AES® (IRIS/IRIS Advantage ICAP, Thermo Fisher Scientific Inc., MA, USA) was used to measure needle P concentration. Needle N: P ratio was calculated by dividing needle N concentration by needle P concentration (eqn. 1):
where Nn and Np are the nitrogen and phosphorus concentration in needles, respectively.
Height (cm) and stem basal diameter (mm) of seedlings were measured 6 times from spring 2015 to autumn 2016 (April 8, 2015; June 2, 2015; September 30, 2015; November 20, 2015; May 13, 2016; August 31, 2015). Stem basal diameter was recorded as the average of two perpendicular measurements. The growth rate (GR, %) of height and stem basal diameter was calculated for each measurement interval (from time t-1 to t) as follows (eqn. 2):
where Mt and Mt-1 are the values measured at time t and t-1, respectively.
The aboveground biomass was measured in September 2016 by harvesting the 4 tallest seedlings in each treatment. The selection of the four more robust seedlings from each treatment was done to avoid any bias related to possible mechanical injuries suffered by seedlings due to the heavy snowfall occurring in the experimental area (see above).
The aboveground biomass was separated into stem, branch and needle components. Each component was dried at 70 °C for 72 hours, and then weighed. The other 12 seedlings were not harvested until mid-November after collecting leaf fall.
Belowground
Fine roots were measured in 2015 by soil core samples ([25]). Two soil cores from each pot were taken, and the fine roots inside the soil core were measured. Soil cores were approximately 30 cm deep and 3 cm in diameter (Daiki Co. Ltd, Tokyo, Japan), taken in symmetrical directions, approximately 10 cm away from the stem. The fine root sampling was done 5 times in 2015 (June 26, July 30, September 3, October 3 and November 14). Each soil sample was approximately 1 % of the total pot volume. Circular plastic tubes were placed at the sampling locations in the pots, so that samplings could be carried out at the same place every time. The holes made after the sampling were refilled with similar conditioned soil. Using this procedure, the fine root biomass obtained from the soil cores reflected the fine root production between the sampling dates except the first sampling (June 26, 2016). The soil cores were preserved at 4 °C. The obtained fine roots were carefully washed with water and a brush. They were scanned with a scanner (CanoScan LiDE 200®, Canon, Japan), dried at 70 °C for 72 hours, and then weighed. The root analyzation software WinRHIZO TRON® 2012a (Regent Instruments Canada Inc., Canada) was used to measure root length (cm). Specific root length (SRL) was calculated for the total sampling core according to Ostonen et al. ([33]).
Roots were harvested after the aboveground harvest in September 2016 (4 seedlings per treatment). Roots were divided into coarse (> 5 mm) and fine roots (< 5 mm), dried at 70 °C for 72 hours, and then weighed.
We calculated the relative fine root production (FRP, g g-1) from the total fine root production and the estimated total root biomass of 2015, as follows (eqn. 3):
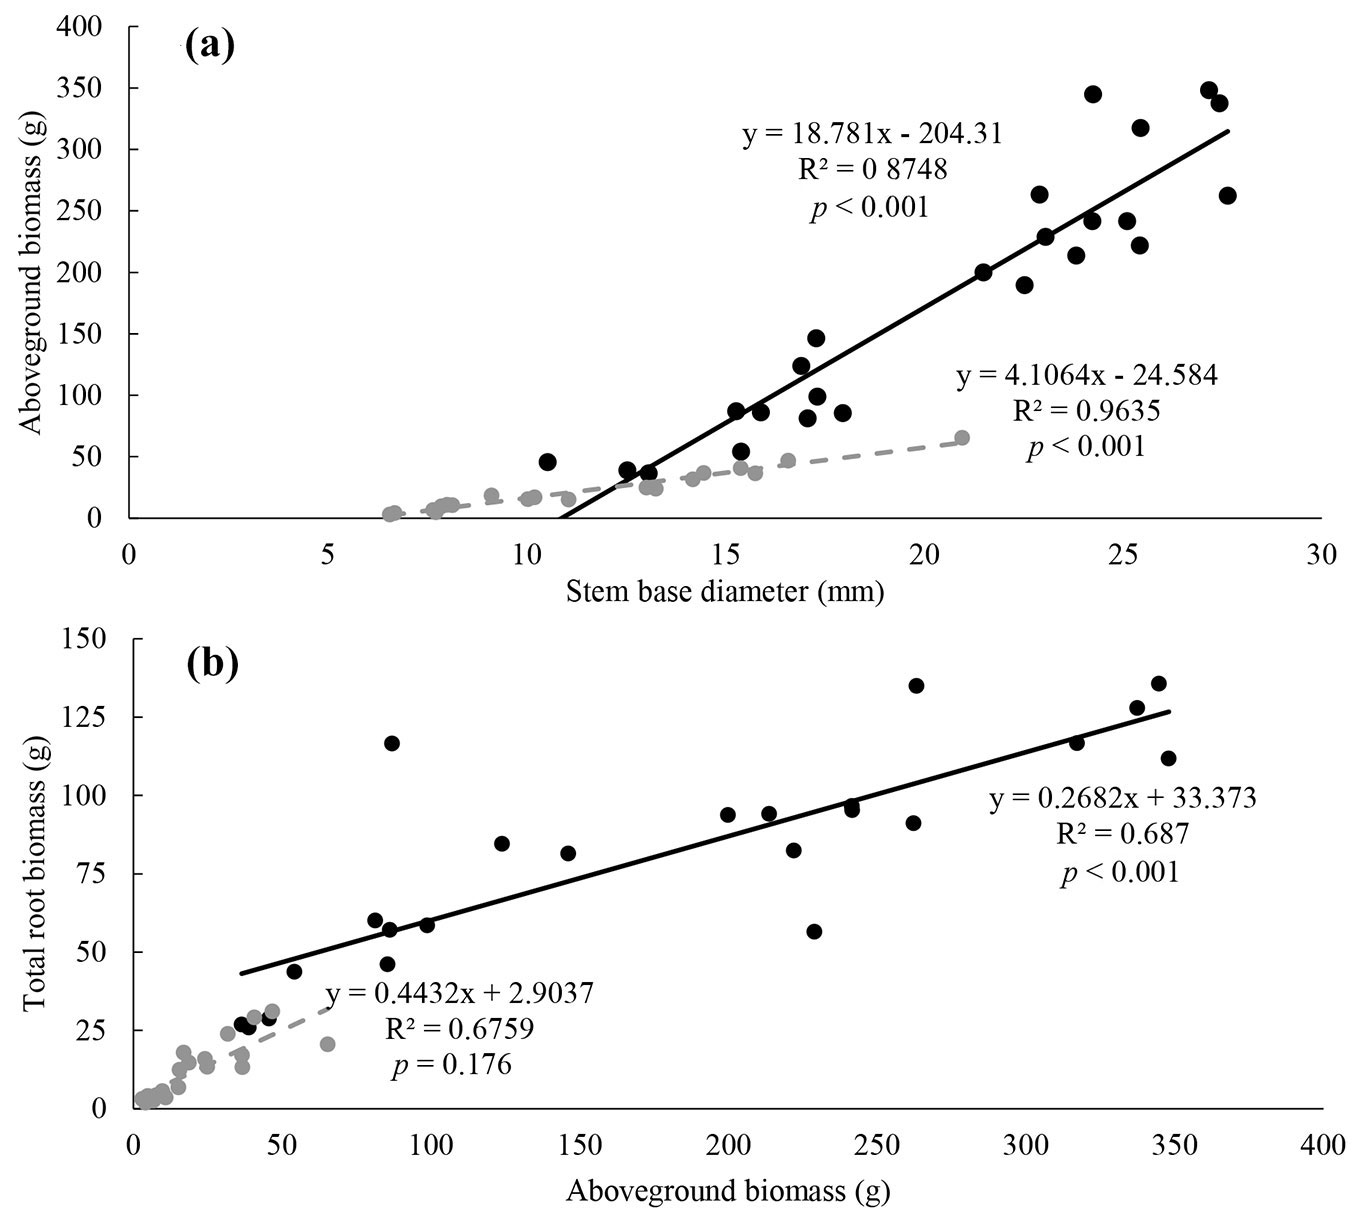
where T(frp) is total fine root production of 2015 (initial sampling excluded), and E(trb) is the estimated total root biomass of 2015. E(trb) was calculated from the relationships between stem basal diameter, aboveground biomass and belowground biomass (Fig. 1a, Fig. 1b) obtained from harvest measurement data of 2015 and 2016. Data of 2015 was obtained in spring 2015 from 19 additional seedlings (n = 2-4 for each treatment) which were subjected to the same N and P treatment, but were not included in the main experiment. The data of 2016 were obtained from the sampling material harvested in September (4 tallest seedlings in each treatment). To estimate total root biomass of N0P0 (control), harvest data from 2015 was used. This was because the height for N0P0 was significantly small and did not fit the regression line made with the data used in 2016. For the rest of the treatments, harvest data from 2016 were used.
Fig. 1 - Regression relationship between: (a) stem basal diameter and aboveground biomass; and (b) aboveground biomass and total root biomass. The Regression equation, R2 and p value from regression analysis are reported close to each line. The black lines represent the data from 2016 (harvest, n = 4 for each treatment), and the gray lines represent data from 2015 (n = 19, 2-4 seedlings for each treatment).
Statistics
A fully randomized scheme with 3 levels of N (0, 50, 100 kgN ha-¹) and 2 levels of P was adopted in this study. Two-way ANOVA (n=36, except litter: n=12) was used to evaluate the effect of N, P, and their interaction on aboveground growth, fine root production and nutrient condition. Biomass was evaluated using data from the 24 robust seedlings harvested in autumn 2016. All measurements were done once, except the measurement of stem basal diameter which was the average of 2 measurements. Regarding the litter, since there were only 12 seedlings in total (2 seedlings per treatment), we measured 2 samples per seedling for measurement robustness. All analysis was done using R ver. 3.3.2, except the regression analysis, which was carried out using the software package Microsoft EXCEL 2013®.
Results
Aboveground
Needle N, P concentration and needle N: P ratio were measured to evaluate nutrient conditions of larch seedlings (Tab. 1). Both in 2015 and 2016, N loading increased the N concentration in needles for both P50 and P0 treatments. In 2016, needle N concentration was higher at P0 treatment. In both 2015 and 2016, needle P concentration was higher in seedlings subjected to P50 treatment than under the P0 treatment. In 2015, significant effects of N and P loading on needle N: P ratio were detected (p = 0.10), with values generally lower for seedlings grown under the P50 treatment. In 2016, only P had a significant effect and the needle N: P ratio was significantly higher for the P0 seedlings. Litter N concentration was significantly lower than needle N concentration of growing season needles. However, in N100P0, the litter N concentration was significantly higher compared to other treatments in both years (2015 and 2016).
Tab. 1 - Mean value (±SE) of each treatment on needle N concentration, needle P concentration, needle N: P ratio and litter N concentration (n= 6 for each treatment, litter N concentration; n= 2, 2 measurements per seedling) of 2015 and 2015. N0, N50 and N100 represent the different N loading treatments (N0: 0 kg N ha-1 yr-1, N50: 50 kg N ha-1 yr-1, N100: 100 kg N ha-1 yr-1). P0 indicates treatments without P loading (0 kg P ha-1 yr-1), while P50 represents treatments with P loading (50 kg P ha-1 yr-1). p values (F values in brackets) of two-way ANOVA are also shown. (***): p < 0.001; (**): p < 0.01; (*): p < 0.05; (ns): not significant.
| Treatment | 2015 | 2016 | ||||||
|---|---|---|---|---|---|---|---|---|
| Needle N | Needle P | Litter N | Needle N: P | Needle N | Needle P | Litter N | Needle N: P | |
| N0P0 | 9.78 ± 0.53 | 0.67 ± 0.02 | 5.30 ± 0.16 | 14.73 ± 0.78 | 11.49 ± 0.24 | 0.36 ± 0.09 | 6.38 ± 0.99 | 43.32 ± 13.32 |
| N0P50 | 7.54 ± 0.31 | 1.21 ± 0.14 | 4.48 ± 0.19 | 8.70 ± 0.89 | 9.46 ± 0.40 | 1.43 ± 0.37 | 2.38 ± 1.60 | 7.44 ± 4.50 |
| N50P0 | 14.98 ± 0.60 | 1.05 ± 0.05 | 7.58 ± 0.53 | 15.65 ± 1.18 | 15.57 ± 0.93 | 0.30 ± 0.04 | 5.39 ± 0.22 | 60.12 ± 10.74 |
| N50P50 | 16.24 ± 0.57 | 1.13 ± 0.03 | 5.60 ± 0.18 | 14.62 ± 0.65 | 13.64 ± 0.33 | 2.02 ± 0.64 | 3.44 ± 2.43 | 9.89 ± 3.31 |
| N100P0 | 21.83 ± 0.40 | 0.94 ± 0.03 | 13.58 ± 0.44 | 24.48 ± 1.24 | 20.46 ± 0.79 | 0.48 ± 0.07 | 22.98 ± 0.13 | 41.50 ± 5.54 |
| N100P50 | 20.93 ± 0.39 | 1.47 ± 0.14 | 5.90 ± 0.19 | 18.28 ± 1.46 | 16.75 ± 0.22 | 1.46 ± 0.56 | 4.49 ± 0.98 | 14.36 ± 5.11 |
| N | *** (58.77) | ns (0.92) | *** (20.33) | * (6.25) | *** (18.47) | ns (0.20) | *** (138.03) | ns (0.91) |
| P | ns (0.43) | * (5.87) | *** (30.74) | * (5.43) | * (4.94) | *** (26.24) | *** (231.31) | *** (34.70) |
| N × P | ns (1.13) | ns (0.10) | *** (11.33) | ns (0.91) | ns (0.30) | ns (0.54) | *** (109.30) | ns (0.82) |
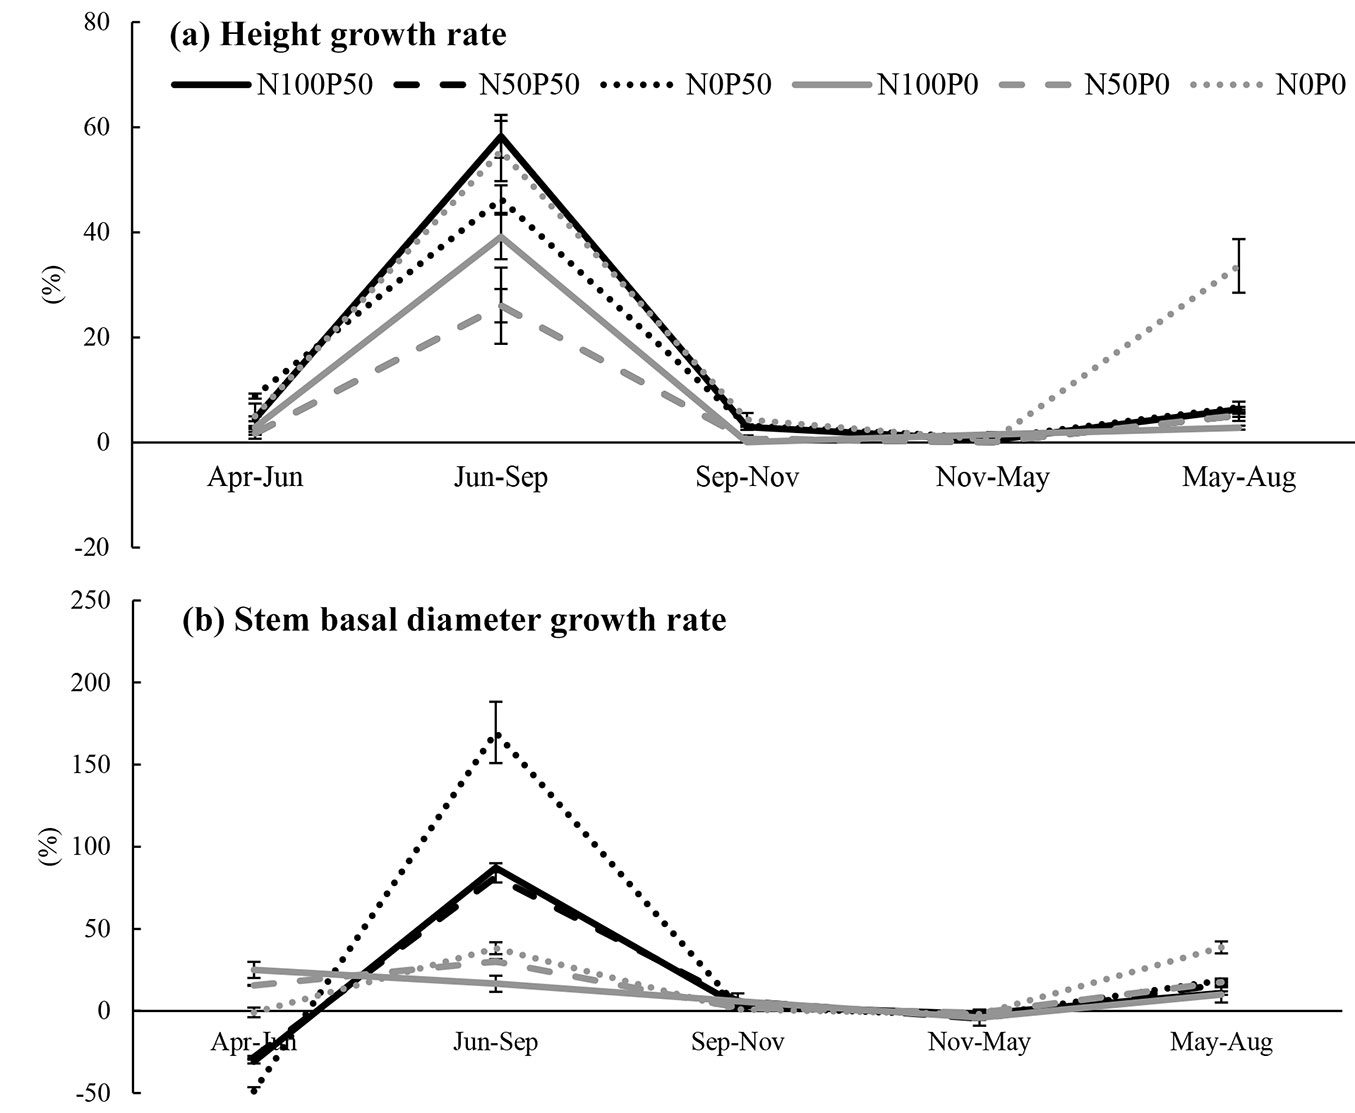
N and P had similar effects on aboveground growth of seedlings (Fig. 2a, Fig. 2b, Tab. 2). Final height was increased by both N and P loading. Total height growth rate of 2015 was affected by both N and P loading, and N and P showed a significant interaction effect. Total growth rate of 2016 was overall smaller than that of 2015, and was significantly affected by N addition. Final stem basal diameter (SBD) was increased by both N and P. Concerning SBD growth rate of 2015, N had an increasing effect. In 2016, N loading had a significant decreasing effect on all seedlings, except those of the N0P0 treatment.
Fig. 2 - Height growth rate (a) and stem basal diameter growth rate (b) for 2 growing seasons from spring 2015 to autumn 2016 for each N and P treatment (n= 6 for each treatment). N0 (dotted lines), N50 (dashed lines) and N100 (solid line) represent the different N loading treatments (N0: 0 kg N ha-1 yr-1, N50: 50 kg N ha-1 yr-1, N100: 100 kg N ha-1 yr-1). P0 (gray) indicates treatments without P loading (0 kg P ha-1 yr-1), while P50 (black) represents treatments with P loading (50 kg P ha-1 yr-1). Measurement intervals are reportde on the horizontal axis. Bars represent the standard error.
Tab. 2 - Mean value (±SE) of each treatment on final height (H) (cm), final stem basal diameter (SBD) (mm), total height growth (cm), height growth rate of 2015 (%), height growth rate of 2016 (%), total SBD growth (mm), SBD growth rate of 2015 (%) and SBD growth rate of 2016 (%). (N0, N50, N100): different N loading treatments at 0, 50 and 100 kgN ha-1 yr-1, respectively. P0 indicates treatments without P loading (0 kg P ha-1 yr-1), while P50 represent treatments with P loading (50 kg P ha-1 yr-1). p values (F values in brackets) of two-way ANOVA are also shown. (***): p < 0.001; (**): p < 0.01; (*): p < 0.05; (ns): not significant.
| Treatment | Final (cm) |
Final SBD (cm) | Total H growth (cm) |
2015 H growth rate (%) |
2016 H growth rate (%) |
Total SBD growth (mm) |
2015 SBD growth rate (%) |
2016 SBD growth rate (%) |
|---|---|---|---|---|---|---|---|---|
| N0P0 | 55.37 ± 4.18 | 12.63 ± 0.71 | 29.98 ± 1.71 | 66.87 ± 1.43 | 33.66 ± 1.71 | 5.69 ± 0.29 | 36.76 ± 4.03 | 38.70 ± 3.64 |
| N0P50 | 71.33 ± 2.23 | 25.55 ± 0.84 | 17.57 ± 0.91 | 22.34 ± 1.17 | 10.12 ± 0.62 | 4.92 ± 0.24 | 29.14 ± 2.52 | 18.47 ± 1.28 |
| N50P0 | 98.18 ± 9.24 | 20.11 ± 0.63 | 40.92 ± 3.77 | 63.27 ± 3.47 | 6.74 ± 0.53 | 8.68 ± 0.26 | 52.61 ± 1.43 | 17.41 ± 1.30 |
| N50P50 | 133.02 ± 6.44 | 23.44 ± 1.23 | 32.98 ± 2.63 | 29.20 ± 2.60 | 5.16 ± 1.29 | 7.93 ± 0.50 | 38.11 ± 2.08 | 16.11 ± 1.69 |
| N100P0 | 140.00 ± 7.26 | 24.24 ± 0.77 | 44.35 ± 2.81 | 43.05 ± 2.63 | 2.82 ± 0.55 | 8.30 ± 0.33 | 44.81 ± 1.72 | 10.06 ± 1.07 |
| N100P50 | 148.32 ± 7.64 | 15.78 ± 0.59 | 65.60 ± 3.25 | 67.87 ± 2.95 | 6.30 ± 0.65 | 7.86 ± 0.32 | 33.12 ± 1.37 | 10.86 ± 1.04 |
| N | *** (64.78) | *** (88.35) | *** (11.32) | ** (6.39) | ** (6.57) | *** (8.01) | ns (2.28) | ** (7.81) |
| P | ** (10.70) | *** (15.59) | ns (0.00) | 0.1 (3.22) | ns (0.99) | ns (0.93) | * (5.64) | 0.1(3.03) |
| N × P | ns (1.92) | ns (0.79) | *(3.86) | * (3.33) | ns (1.49) | ns (0.02) | ns (0.18) | 0.1(3.09) |
Total biomass, stem biomass, branch biomass and needle biomass of seedlings showed a significant increase after N and P loading (Tab. 3). Also, a significant interaction between P and N addition was detected on leaf and stem biomass.
Tab. 3 - Mean value (±SE) of each treatment on stem, branch, needle, above, total, fine root, coarse, total root biomass (g) from harvest in 2016 (n= 4 for each treatment). (N0, N50, N100): different N loading treatments at 0, 50 and 100 kg N ha-1 yr-1, respectively. P0 indicates treatments without P loading (0 kg P ha-1 yr-1), while P50 represents treatments with P loading (50 kg P ha-1 yr-1). p values (F values in brackets) of two-way ANOVA are also shown. (***): p < 0.001; (**): p < 0.01; (*): p < 0.05; (ns): not significant.
| Treatment | Total biomass |
Stem biomass |
Branch biomass |
Needle biomass |
Fine root biomass | Coarse root biomass | Total root biomass |
|---|---|---|---|---|---|---|---|
| N0P0 | 75.23 ± 4.00 | 12.93 ± 0.76 | 14.23 ± 0.38 | 16.58 ± 2.34 | 7.40 ± 0.45 | 24.10 ± 1.66 | 31.50 ± 42.10 |
| N0P50 | 178.71 ± 11.05 | 39.68 ± 4.90 | 28.90 ± 1.65 | 31.58 ± 2.71 | 21.30 ± 1.82 | 57.25 ± 5.55 | 78.56 ± 7.08 |
| N50P0 | 166.27 ± 9.87 | 39.20 ± 3.24 | 39.33 ± 4.76 | 45.80 ± 7.41 | 20.96 ± 2.28 | 42.70 ± 2.74 | 63.60 ± 4.98 |
| N50P50 | 324.58 ± 12.80 | 93.40 ± 2.31 | 69.20 ± 4.80 | 69.30 ± 4.87 | 22.98 ± 2.04 | 69.70 ± 6.35 | 92.68 ± 8.33 |
| N100P0 | 330.68 ± 6.44 | 92.28 ± 2.63 | 78.23 ± 4.73 | 65.78 ± 1.80 | 26.10 ± 1.40 | 68.30 ± 1.69 | 94.40 ± 0.52 |
| N100P50 | 460.38 ± 4.82 | 111.73 ± 1.17 | 119.85 ± 3.82 | 105.25 ± 5.41 | 30.40 ± 2.08 | 93.15 ± 3.80 | 123.55 ± 2.68 |
| N | *** (118.79) | *** (88.28) | *** (53.11) | *** (91.64) | ** (8.10) | *** (12.01) | *** (14.48) |
| P | *** (78.19) | ** (51.71) | *** (21.73) | *** (49.01) | 0.1 (6.20) | *** (16.98) | *** (17.89) |
| N × P | ns (1.14) | * (5.17) | ns (1.60) | * (3.74) | ns (1.91) | ns (0.14) | ns (0.57) |
N and P had different effects on proportion of stem, branch and needle biomass to total dry biomass (Tab. 4). Stem proportion was increased by N loading. An interaction effect was also observed. The proportion of branch and needle biomass over the total seedling biomass was increased only by N loading.
Tab. 4 - Mean value (±SE) of each treatment on coarse root, fine root, total root, stem, branch, needle, and above total biomass proportion (%). (N0, N50, N100): different N loading treatments at 0, 50 and 100 kg N ha-1 yr-1, respectively. P0 indicates treatments without P loading (0 kg P ha-1 yr-1) and P50 represents treatments with P loading (50 kg P ha-1 yr-1). p values (F values in brackets) of two-way ANOVA are also shown. (***): p < 0.001; (**): p < 0.01; (*): p < 0.05; (ns): not significant.
| Treatment | Stem (%) |
Branch (%) |
Needle (%) |
Fine root (%) |
Coarse root (%) |
Total root (%) |
|---|---|---|---|---|---|---|
| N0P0 | 17.29 ± 0.76 | 19.22 ± 0.55 | 21.88 ± 1.57 | 9.81 ± 0.14 | 31.80 ± 0.56 | 41.61 ± 0.67 |
| N0P50 | 21.73 ± 1.57 | 16.57 ± 0.92 | 18.00 ± 1.03 | 11.74 ± 0.41 | 31.96 ± 2.13 | 43.70 ± 2.39 |
| N50P0 | 20.23 ± 0.84 | 18.24 ± 0.36 | 23.73 ± 0.89 | 12.20 ± 0.79 | 25.60 ± 0.30 | 37.80 ± 0.95 |
| N50P50 | 29.30 ± 1.30 | 21.28 ± 1.18 | 21.44 ± 0.92 | 6.94 ± 0.36 | 21.03 ± 1.21 | 27.97 ± 1.53 |
| N100P0 | 27.91 ± 0.60 | 23.47 ± 1.03 | 19.93 ± 0.47 | 7.97 ± 0.52 | 20.72 ± 0.54 | 28.69 ± 0.63 |
| N100P50 | 24.29 ± 0.28 | 26.06 ± 0.84 | 22.83 ± 0.83 | 6.59 ± 0.43 | 20.23 ± 0.79 | 26.82 ± 0.42 |
| N | ** (6.54) | ** (8.08) | 0.1 (2.97) | ** (9.35) | *** (13.77) | *** (17.40) |
| P | 0.1 (3.36) | ns (0.38) | ns (1.45) | 0.1 (3.25) | ns (0.61) | ns (1.77) |
| N × P | * (5.03) | ns (1.58) | * (5.99) | ** (9.48) | ns (0.58) | 0.1 (2.52) |
Belowground
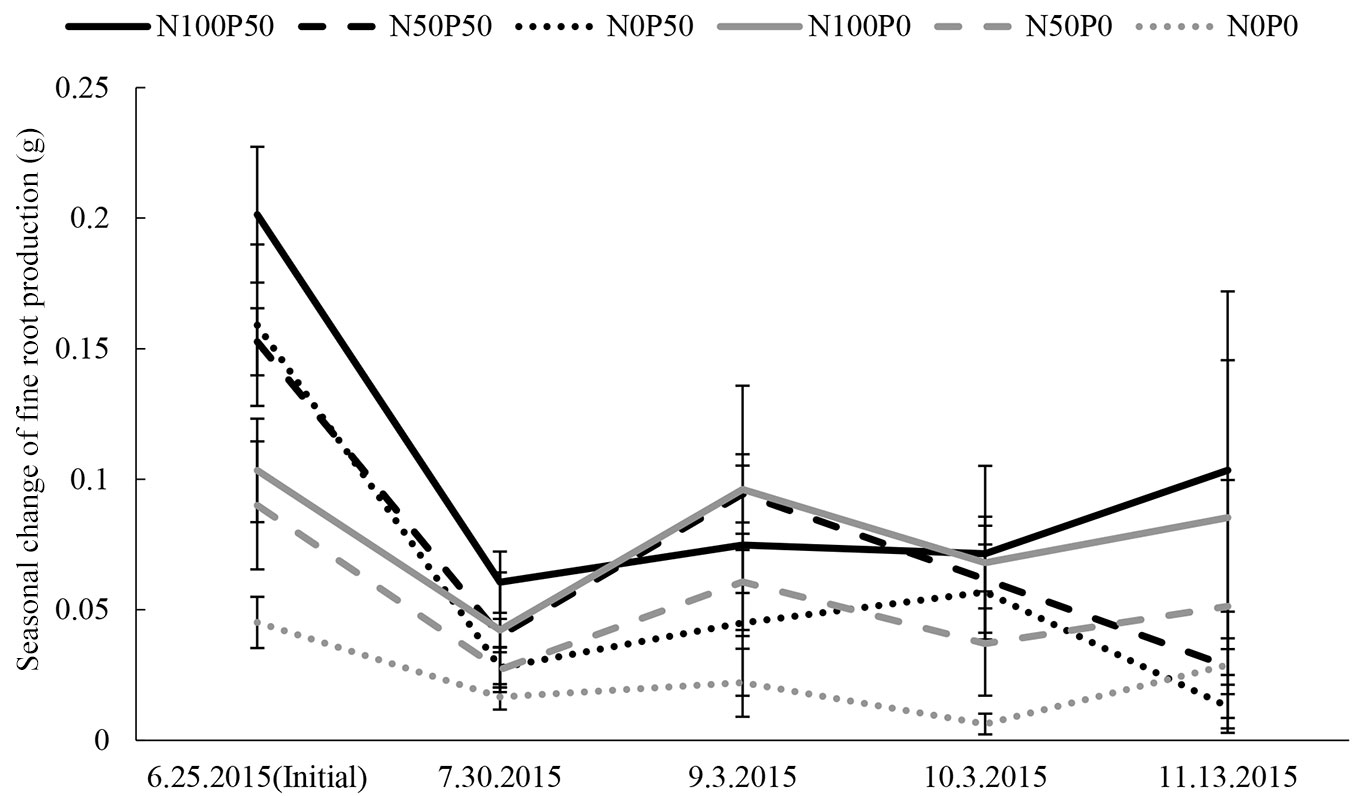
Treatments with N and P loading showed larger fine root biomass values from core samples compared to treatments with no N or P (Fig. 3). This is because seedling size differed according to the different N and P conditions, and so the initial sampling results from core sampling also differed. Similar results were observed throughout the season. There was a severe decrease of fine root in between the first and the second core sampling, likely due to the fact that all fine roots at sampling points in the pots were removed with the first sampling. However, at the next sampling dates fine root production showed a slight trend with two peaks, one in later summer and another in late autumn (Fig. 3), though large differences existed among different treatments.
Fig. 3 - Seasonal change of fine root production, including the initial value (sampled on 6.25.2015). N0 (dotted lines), N50 (dashed lines) and N100 (solid line) represent the different N loading treatments (N0: 0 kg N ha-1 yr-1, N50: 50 kg N ha-1 yr-1, N100: 100 kg N ha-1 yr-1). P0 (gray) represents treatments without P loading (0 kg P ha-1 yr-1) and P50 (black) represents treatments with P loading (50 kg P ha-1 yr-1). Measurement dates are reported on the horizontal axis. Bars are standard error.
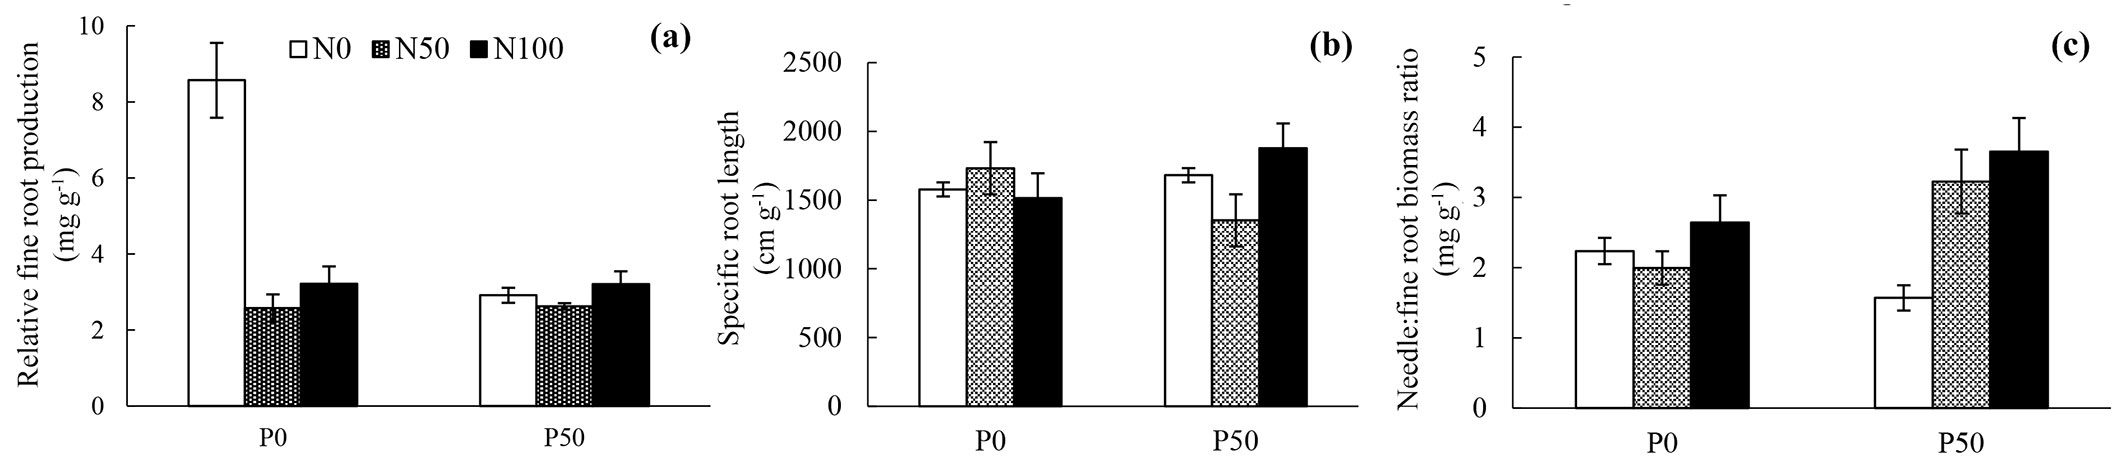
As shown in Fig. 4a and Tab. 5, N loading decreased relative fine root production and this was especially observed at P0. SRL was not affected by neither N nor P loading (Fig. 4b, Tab. 5). Seedlings subjected to N loading showed an increased needle: fine root biomass ratio in the P50 treatments; however, N loading did not show any significant effect on the above ratio at P0 treatments.
Fig. 4 - (a) Mean value of relative fine root production (mg g-1); (b) mean value of specific root length (cm g-1); (c) needle: total root biomass ratio (g g-1). n=6 for each treatment in (a) and (b), while in (c) n=4 for each treatment. White bars represent N0 treatments (0 kg N ha-1 yr-1), meshed bars are N50 treatments (50 kg N ha-1 yr-1), and black bars N100 treatments (100 kgN ha-1 yr-1). Whiskers represent the standard error.
Tab. 5 - The statistical results of relative fine root production, specific root length and needle: fine root biomass ratio. p values (F values) of two-way ANOVA are shown. (***): p < 0.001; (**): p < 0.01; (*): p < 0.05; (ns): not significant.
| Factors | Relative fine root production | Specific root length |
Needle: fine root biomass ratio |
|---|---|---|---|
| N | * (3.80) | ns (0.27) | **(6.52) |
| P | 0.1 (3.60) | ns (0.03) | ns (2.83) |
| N × P | * (3.65) | ns (1.66) | *(4.32) |
Both fine and coarse root biomass of seedlings were increased by both N and P loading (Tab. 3). Furthermore, there were no significant effects of N and P loading on fine: coarse root biomass ratio. However, fine root proportion was decreased by N loading (Tab. 4). On the other hand, it was slightly increased by P loading and an interaction effect was observed. Coarse root proportion was only significantly decreased by N loading, and total root proportion was significantly decreased by N and an interaction effect was observed.
As roots absorb nutrients from soil and needles absorb light for photosynthesis, their growth balance plays an important role in overall plant growth. Therefore, the needle biomass: fine root biomass ratio (Fig. 4c, Tab. 5) was calculated. As a result, needle biomass: fine root biomass was only increased in seedlings subjected to N loading under high P conditions. However, N loading did not show any significant effect at P0 treatments.
Discussion
Aboveground
In both 2015 and 2016, N loading significantly increased needle N concentration. High needle N concentration commonly occurs with N loading ([38]), and this was also observed in our study. Needle P concentration was significantly higher at P50 treatments, showing that P addition increased needle P concentration. However, the needle P concentration of 2016 was smaller compared to 2015. The reason for this may be that Hyponex was added in 2015 as top dressing but not in 2016. Therefore, seedlings may have been experiencing higher P conditions and absorbed more P in 2015 compared to 2016, especially at P0 treatments.
In 2015, both N and P loading had significant effects on N: P ratio. Here, N loading increased needle N: P ratio and treatments at P0 had higher needle N: P ratio values. For most plants, N: P ratios < 10 and > 20 often correspond to N and P limited biomass production. Moreover, 10 < N: P < 20 often implies co-limitation ([15]). Indeed, N100P50, N50P50, N50P0, and N0P0 showed co-limitation in 2015, N0P50 showed N limitation and N100P0 showed P limitation. In 2016, N0P50 and N50P0 showed N limitation, and N100P50 showed co-limitation. Hence, all treatments under low P condition showed P limitation. In 2016, only P had significant effects on needle N: P ratio, and N: P ratio values were significantly higher at the P0 treatment. However, since plant growth was not suppressed, 10 < N: P < 20 may not only indicate a co-limitation but also include favorable growth conditions for F1 seedlings. Therefore, it may be difficult to determine co-limitation from N: P ratio and further investigations may be necessary.
Since F1 is a deciduous conifer, nutrients such as N are retranslocated before leaf shedding ([6], [51]). Retranslocation of N was also observed in our experiment, as litter N concentration was significantly lower than needle N concentration of needles sampled during the growing season. However, high litter N concentration was observed at only N100P0 in both 2015 and 2016. Previous reports indicated that excessive N loading leads to high litter N concentration ([2], [44], [50], [7]). The characteristic of N100P0 is that it is P limited and has a high needle N: P ratio. Therefore, these two factors are most likely causing high litter N concentration. It could be hypothesized that when F1 seedlings lack P or have a high needle N: P ratio, the retranslocation of N from needle to other organs is suppressed, which leads to high litter N concentration. This could indirectly increase N input via litter, accelerating the soil N even more and change the chemistry and decomposition of the humus ([45]). An interesting point is that although litter N was high in 2015, needle N concentration was also high for the next season (2016), indicating that N100P0 could absorb N again in the next growing season. It can also be hypothesized that seedlings of N100P0 may not have retranslocated N to reduce the amount of N storage as to decrease needle N: P ratio.
N and P loading had positive effects on aboveground biomass. Therefore, P may have not been the critical limiting factor for aboveground growth; rather, N was the limiting factor. Li et al. ([21]) compared the effect of N and P loading on two larch species (Larix kaempferi and L. olgensis). They found that N and P loading increased the productivity of both species; however, P loading suppressed L. kaempferi productivity but increased L. olgensis. Therefore, for L. kaempferi N loading did not induce P deficiency; rather, P loading induced N limitation, which could indicate that in the latter species the demand for N is much higher than that for P. Since F1 is a hybrid of L. kaempferi similar characteristics of N and P demand may have been inherited ([41], [49]).
A significant interaction effect of N and P loading on leaf and stem biomass was observed in this study, where P loading had a significantly higher increasing effect on seedlings subjected to N50 and N100 treatments. Based on the above evidence, it can be hypothesized that when nutrient availability is high, seedling investments in stem growth (height) and photosynthesis (needle) are prioritized.
Although seedlings were replanted in larger pots to prevent root growth inhibition (pot effect), possibilities of growth restriction can also be considered at the following treatments: N100P50, N50P50, N100P0 and N50P0, since negative effects of N loading on height and stem basal diameter growth rates were observed in 2016 (Fig. 2a, Fig. 2b). Nutrient limitations may have also simultaneously occurred where the nutrient content in 2016 was not enough to support seedling growth after transplantation in 2015. Furthermore, as loading treatment was applied for as much as four years, continuous loading may have altered plants nutrient demand in N and P ([4]). Needle P concentration was also lower in 2016 and so N loading may have caused P deficiency, and consequently, shortage of P may have decreased aboveground growth in 2016 compared to 2015.
Our results showed that N loading tends to increase the aboveground proportion of the total seedling biomass, especially at P50. It can be assumed that when N availability is high, seedlings have enough nutrients to support aboveground plant activities such as photosynthesis and so investments to the aboveground is prioritized instead of belowground. If this is so, N loading may induce imbalances between above- and below-ground growth.
Belowground
Regarding the seasonal changes of fine root production obtained from soil core samplings, a slight trend of two growing peaks was observed. This result was also observed by Satoh ([40]), although the latter growing peak was relatively later in the autumn. This was especially seen in high N loading treatments. Therefore, the favorable nutrient condition of N and P may have prolonged the growing season of fine roots.
N loading decreased relative fine root production of seedlings under the P0 treatments. Our starting hypothesis was that at P50 fine root production would decrease more than in the P0 treatments. In our experiment, treatments other than N0P0 had relatively low relative fine root production values. Therefore, P may have not been the limiting factor for fine root production and N was the determining factor in 2015. Fine root production may have been enhanced by seedlings grown at N0P0 (low nutrient conditions) to absorb more nutrients. Both N and P loading did not affect SRL in our experiment. On the other hand, N loading increased total root biomass, including both coarse roots and fine roots at both P conditions. This biomass increasing effect of N loading is consistent with other research results ([31], [43]). It can be hypothesized that seedlings were not experiencing P deficiency and root growth was promoted to support aboveground growth.
We found that seedlings with high needle N: P ratio allocated less biomass to roots compared to seedlings with low needle N: P ratio (Tab. 4). This trend has also been reported by previous research ([15]). Similarly, total root proportion was significantly higher at N0P0 than at N100P0 treatment, and N0P50 was higher than N100P50. High root proportion under low P conditions has also been reported in previous studies and has shown that P deficiency enhances fine root growth for efficient P absorption ([22], [23], [13]). In our study, seedlings subjected to the P0 treatments may have been experienced a P deficiency. Under high P conditions, fine root proportion was decreased by N loading. On the other hand, under low P conditions, the fine root proportion increased at N50, though decreased at N100. Therefore, under high N and P conditions fine root proportion was decreased. At low P conditions, N loading may only have increasing effects up to a certain extent, while an excess of N loading may have decreased fine root proportion in F1 seedlings.
Needle: fine root biomass ratio was significantly higher under N loading at P50 treatments, indicating that more investments were made to the aboveground growth. This result was in agreement with previous studies where sufficient availability of water and nutrients result in smaller amounts of fine roots and a smaller percentage of assimilates is transported to roots ([9]). This phenomenon could also decrease the seedling’s tolerance to other stress, such as drought, since roots have the vital role of absorbing not only nutrients but also water ([16]). At P0 treatments, N did not increase needle: fine root biomass ratio, so it can be speculated that investments were made to fine roots as well as needle production.
The core sampling method may not be fully suitable to accurately evaluate fine roots, as the amount of soil sampled was relatively small compared to the total root biomass (1 % of the total pot volume). To accurately evaluate fine root growth using soil core samples, more samplings are needed and more soil volume should be explored, though this could damage the root system and cause a decline in overall seedling growth. Using the in-growth method in parallel to core samples, may have increased the accuracy of fine root evaluation without harming the seedling. Evaluation of fine roots is strongly altered by the methodology ([31]), therefore more improvements of fine root measurement methodologies and techniques, such as a non-destructive Mini-rhizotron (MR-fine root observation tubes) method ([48]) could increase the accuracy of estimations.
Conclusion
N loading had different effects on above- and below- ground growth of hybrid larch F1 seedlings. Although, aboveground growth was increased by N loading under both low and high P conditions, belowground growth was suppressed. This could affect seedlings’ tolerance or susceptibility to other stress, such as drought, since roots have the vital role of water absorption. Root growth of F1 could be altered by increasing N deposition under low P soil conditions. Furthermore, high N loading at low P conditions altered litter quality. This could indirectly accelerate the input of N to soils. To efficiently use larch F1 as an afforestation species, considerations should be taken on the location of plantation site, related to imbalances in N and P conditions, especially high N loading at P deficient soils.
Acknowledgements
We thank Dr. Ivano Brunner of WSL of Switzerland for helpful discussion and comments on the manuscript. We are grateful to Dr. Cong Shi, Mr. Testuto Sugai and Dr. Eugenios Agathokleous of Hokkaido University for constructive discussion. Gratitude in also given to Dr. Toshiyuki Hirata and Dr. Yoshitaka Uchida of Hokkaido University for the use of the NC Analyzer. We thank Dr. Toshihiro Watanabe of Hokkaido University for the use the ICP Analyzer and Dr. Tatsuro Nakaji of Hokkaido University for use of WinRHIZO TRON software. This research was in part by Grant-in-aid of basic research, type B (to TK: No.26292075) of Japan Society of Promotion of Science.
References
Gscholar
CrossRef | Gscholar
Gscholar
Gscholar
Gscholar
CrossRef | Gscholar
Gscholar
Gscholar
CrossRef | Gscholar
Gscholar
Gscholar
CrossRef | Gscholar
Online | Gscholar
Authors’ Info
Authors’ Affiliation
Graduate School of Agriculture, Hokkaido University, Sapporo 060-8589 (Japan)
Agricultural University of Hebei, Baoding 071-000 (China)
Forestry Research Institute, Hokkaido Research Organization, Bibai 079-0198 (Japan)
Research faculty of Agriculture, Hokkaido University, Sapporo 060-8589 (Japan)
Corresponding author
Paper Info
Citation
Fujita S, Wang X, Kita K, Koike T (2018). Effects of nitrogen loading under low and high phosphorus conditions on above- and below-ground growth of hybrid larch F1 seedlings. iForest 11: 32-40. - doi: 10.3832/ifor2395-010
Academic Editor
Giustino Tonon
Paper history
Received: Feb 07, 2017
Accepted: Nov 18, 2017
First online: Jan 09, 2018
Publication Date: Feb 28, 2018
Publication Time: 1.73 months
Copyright Information
© SISEF - The Italian Society of Silviculture and Forest Ecology 2018
Open Access
This article is distributed under the terms of the Creative Commons Attribution-Non Commercial 4.0 International (https://creativecommons.org/licenses/by-nc/4.0/), which permits unrestricted use, distribution, and reproduction in any medium, provided you give appropriate credit to the original author(s) and the source, provide a link to the Creative Commons license, and indicate if changes were made.

Web Metrics
Breakdown by View Type
Article Usage
Total Article Views: 50374
(from publication date up to now)
Breakdown by View Type
HTML Page Views: 41979
Abstract Page Views: 3601
PDF Downloads: 3665
Citation/Reference Downloads: 26
XML Downloads: 1103
Web Metrics
Days since publication: 3094
Overall contacts: 50374
Avg. contacts per week: 113.97
Article Citations
Article citations are based on data periodically collected from the Clarivate Web of Science web site
(last update: Mar 2025)
Total number of cites (since 2018): 5
Average cites per year: 0.63
Publication Metrics
by Dimensions ©
Articles citing this article
List of the papers citing this article based on CrossRef Cited-by.
Related Contents
iForest Similar Articles
Research Articles
Fine root morphological traits and production in coniferous- and deciduous-tree forests with drained and naturally wet nutrient-rich organic soils in hemiboreal Latvia
vol. 16, pp. 165-173 (online: 08 June 2023)
Research Articles
Effects of understory removal on root production, turnover and total belowground carbon allocation in Moso bamboo forests
vol. 9, pp. 187-194 (online: 20 November 2015)
Research Articles
Fine root production and distribution in the tropical rainforests of south-western Cameroon: effects of soil type and selective logging
vol. 3, pp. 130-136 (online: 27 September 2010)
Research Articles
Carbohydrate metabolism during new root growth in transplanted Larix olgensis seedlings: post-transplant response to nursery-applied inorganic fertilizer and organic amendment
vol. 10, pp. 15-22 (online: 22 September 2016)
Research Articles
Relationship between volatile organic compounds released and growth of Cunninghamia lanceolata roots under low-phosphorus conditions
vol. 11, pp. 713-720 (online: 06 November 2018)
Research Articles
Modeling the fine root biomass dispersion using a special influence function
vol. 1, pp. 141-144 (online: 25 November 2008)
Research Articles
Nitrogen deposition and its impact on forest ecosystems in the Czech Republic - change in soil chemistry and ground vegetation
vol. 10, pp. 48-54 (online: 29 June 2016)
Research Articles
Gas exchange characteristics of the hybrid Azadirachta indica × Melia azedarach
vol. 8, pp. 431-437 (online: 17 December 2014)
Research Articles
Response of soil bacterial communities to nitrogen and phosphorus additions in an age-sequence of subtropical forests
vol. 14, pp. 71-79 (online: 11 February 2021)
Research Articles
Influence of pH, nitrogen and sulphur deposition on species composition of lowland and montane coniferous communities in the Tatrzanski and Slowinski National Parks, Poland
vol. 12, pp. 141-148 (online: 27 February 2019)
iForest Database Search
Search By Author
Search By Keyword
Google Scholar Search
Citing Articles
Search By Author
Search By Keywords
PubMed Search
Search By Author
Search By Keyword


