
Effects of understory removal on root production, turnover and total belowground carbon allocation in Moso bamboo forests
iForest - Biogeosciences and Forestry, Volume 9, Issue 2, Pages 187-194 (2015)
doi: https://doi.org/10.3832/ifor1674-008
Published: Nov 20, 2015 - Copyright © 2015 SISEF
Research Articles
Abstract
Although the role of roots has been highlighted in carbon and nutrient cycles in forest ecosystems, root production, turnover and total belowground carbon allocation (TBCA) under different management regimes in Moso bamboo forests have not been determined to date. In this study, sequential soil cores were collected at two soil depths (0-20 cm and 20-40 cm) to assess the effects of understory removal on root production, turnover, and TBCA in Moso bamboo forests in subtropical China. A total of 1080 sequential soil cores were collected from April 2011 to March 2012. Understory removal significantly reduced fine root biomass and production for both soil layers (p < 0.05). Total fine root biomass was 781.9, 419.2, and 638.7 g m-2 for an unmanaged stand (stand I), pesticide-treated stand (stand II), and hand-weeded stand (stand III), and fine root production was 467.5, 235.1, and 321.6 g m-2 a-1, respectively. Understory removal did not significantly affect fine root turnover (0.5-0.6 a-1). Fine root turnover showed a strong relationship with fine root production, but not with fine root biomass, indicating that fine root production was the main driver of fine root turnover. TBCA calculated from the component cumulative approach was in order of stand I (481.9 g C m-2 a-1) > stand II (457.7 g C m-2 a-1) > stand III (404.9 g C m-2 a-1), though the differences were not statistically significant (p > 0.05). However, TBCA calculated from the mass balance approach showed a reverse trend compared to the component cumulative approach. The TBCA of stand III was significantly higher than that of stand I and stand II (p < 0.05), demonstrating that the belowground process is complex and standardizing the method of estimation of TBCA is extremely important in global carbon cycle modeling.
Keywords
Fine Root, Coarse Root, Production, TBCA, Moso Bamboo Forest
Introduction
Root systems are a major part of forest biomass and its increments ([19]), and are expected to contribute significantly to the total ecosystem carbon pool and its dynamics ([23]). Roots are generally divided into two categories: fine roots (diameter < 2 mm) and coarse roots (diameter > 2 mm - [18], [45], [51]). Although coarse roots contribute more to total stand biomass, their biomass is relatively static and do not reveal the dynamic changes in belowground processes and their responses to disturbances ([45]). In contrast, fine roots are a major contributor to the carbon and nutrient cycles due to their short life span and rapid turnover, although they represent a small part of the total stand biomass in forests ([18], [51]). Fine root production contributes to 33-70% of annual net primary production ([22], [45]). However, compared to aboveground production, little is known about the contribution of roots to soil carbon ([12]). This is partly due to methodological difficulties, the labor-intensity of the research, and internal and external factors that greatly affect root biomass and production ([28], [45]). Fine root biomass, production, and turnover are sensitive to environmental changes, such as temperature, precipitation, soil properties, and stand age, as well as management practices ([12], b, [18], [33]). Consequently, these changes could directly impact ecosystem carbon sequestration under a changing climate ([2]). Hence, a better understanding of fine root production and turnover could improve our capability to model future changes in the carbon cycle and predict the response of terrestrial ecosystems to future climate change ([51]). Intensive studies on fine root production and turnover have been conducted, although the progress is slow due to practical methodological problems ([12], [13], [18], [33]). These studies cover different forest types, stand ages, stand densities and basal areas relating to environmental factors, mainly air temperature, precipitation, geographic location, elevations and soil properties ([12], [13], [18], [49]). However, knowledge of the controls and mechanisms of fine root production, turnover and dynamics remain limited ([3], [49]).
Compared to fine root production and turnover, total belowground carbon allocation (TBCA) is a more direct indicator of the magnitude of belowground carbon allocation and the contribution of root production to TBCA. TBCA represents as much as 21-61% of total gross primary production ([7]). TBCA can even exceed aboveground net primary production and litter production, and provide the primary source of detritus carbon to mineral soil ([24], [38]). Despite the significance of TBCA in the carbon budget of terrestrial ecosystems has been highlighted, controls and mechanisms of TBCA are poorly understood ([16]). For example, direct measurement of TBCA are still difficult due to complex belowground processes and the partitioning of soil respiration components ([21]). Hence, compared to the direct measurement of TBCA, indirect measurements such as the mass balance approach ([36]) are more commonly used ([6], [10]). Studies on TBCA have been performed in Chinese fir plantations ([6], [8]), a Castanopsis kawakamii forest ([6]), a Metrosideros polymorpha-dominated forest ([37]), a Eucalyptus saligna forest ([16]) and a Pseudotsuga menziesii forest ([30]). To our knowledge, to date, TBCA has not been determined in a Moso bamboo (Phyllostachys heterocycla [Carr.] Mitford cv. Pubescens) forest managed by understory removal, although there has been one report on fine root production and turnover in Moso bamboo ([11]).
Bamboo forests are an important forest type in Southern China, and Moso bamboo is the most important bamboo species, accounting for 70% of the total area of bamboo forests in China ([39]). In the last few decades, driven by the good price and sustainable forest development policies, the Moso bamboo forest area has expanded rapidly ([46]), increasing from 1.5 million ha in 1957 to 5.38 million ha in 2008 ([15], [39]). This area accounts for over 90% of Moso bamboo forests in the world ([59]). The growth rate of Moso bamboo is very high; a newly emerged culm can grow up to 119 cm within 24 hours, and to 24 m high within 40-50 days ([15]). Moso bamboo forests also play an important role in the regional, national, and even global carbon cycle because the carbon stock in bamboo forest comprises 11% of the total carbon stock of China’s forest ecosystems ([9]). To improve stand production and maximize economic benefits, intensive management, such as regular understory removal, tillage, and fertilization, are becoming popular ([26]). These practices have been reported to reduce soil microbial diversity ([48]), increase soil carbon mineralization ([57]), and change the soil chemical composition ([25]). However, there is a lack of information on the effects of understory removal on root production and turnover.
The objectives of this study were to: (1) investigate the effects of understory removal on the allocation pattern of root biomass, production, root turnover, and TBCA; (2) determine the relationships between root production and root biomass and TBCA; and (3) determine whether different methodological approaches affect TBCA estimation.
Materials and methods
Study area
The study area is located in Dingmushan Forest Farm (29° 27′ N, 113° 57′ E) in Chibi city, Hubei Province, China. The area has a typical subtropical monsoon climate with an average precipitation of 1251-1608 mm per year with great seasonality: 52% of the precipitation occurs during the flood season (May to August). The highest annual precipitation was 2678 mm in 1954 and the lowest was 910 mm in 1968. The mean annual temperature is 16.9°C, with the highest temperature in July and the lowest in January. There are 247-261 frost-free days in this area.
The forest farm is owned by the local government. In the 1960s, pure Moso bamboo forests were planted. In the 1990s, due to a salary reform of the government, the local residents of the farm rented the Moso bamboo forests for their daily income. In order to improve their economic benefits, management practices have been conducted since the 1990s by removing the understory every year and by reclamation every three years according to local residents’ descriptions. The main understory species are Liriodendron chinense Hemsl., Rhus chinensis Mill., Loropetalum chinense (R. Br.) Oliv., Smilax glabra Roxb., Castanea seguinii Dode., Castanopsis tibetana Hance, and Castanopsis tessellata Hick. et A. Camus. More details on stand characteristics are given in Tab. 1.
Tab. 1 - Summary of the characteristics of studied stands. I, II and III represent control, pesticide-treated and hand-weeded stand, respectively.
| Variables | I | II | III |
|---|---|---|---|
| Average elevation (m) | 161 | 112 | 168 |
| Slope (deg) | 16 | 12 | 17 |
| Average height (m) | 11.1 | 13.1 | 12.3 |
| Average Diameter (cm) | 8.2 | 8.3 | 8.8 |
| Soil bulk density (g cm-3) | 1.28 | 1.3 | 1.14 |
| Total porosity (%) | 45.21 | 46.99 | 45.72 |
| Soil carbon content (g kg-1) | 26.41 | 25.86 | 23.72 |
| Total N (g kg-1) | 1.33 | 2.03 | 1.12 |
| Total K (g kg-1) | 9.68 | 15 | 12.7 |
| Total P (g kg-1) | 0.32 | 0.37 | 0.31 |
| Understory (g m-2) | 68.8 | 25.9 | 80.8 |
| Aboveground biomass (g m-2) | 2857.7 | 4006.1 | 3421.4 |
| Litter (g m-2) | 401.8 | 384.9 | 246.1 |
Study design
Two Moso bamboo stands managed by the application of pesticides (stand II) and hand-weeded (stand III) and one stand without any management (stand I) were selected. The application of pesticides, a mixed solution of Roundup and Jialijia at a concentration of 5%, was conducted on sunny days every July since 2000 to remove shrubs and herbs. The understory shrubs and herbs died days after pesticide application. Weeding was conducted twice a year in May and September since 2000 by hand without any heavy machinery. In March 2011, three 20 × 20 m plots were established in each of the selected stands. There was a 10 m buffer zone between the two adjacent plots.
Stand inventory
In each inventory plot, diameter at breast height (DBH, 1.3 m) and age of all bamboos were measured to the nearest 0.1 cm with a diameter tape. The age was recorded based on visual examination of the culm color, eyelash on cycle of culm sheath, powder under cycle of culm sheath, and the base of the culm sheath ([54]). The age was expressed in “du”, which reflects the growth characteristics in “on-year” and “off-year” in Moso bamboo forests. In an “on-year”, more than 90% of new shoots are produced, followed by a few new shoots in an “off-year”, because Moso bamboo produces new shoots at two-year intervals ([59]). One “du” is 1-2 years, and consequently, 2, 3, and 4 “du” correspond to 3-4, 5-6, and 7-8 years, respectively ([14]). The aboveground biomass (AGB) of individual bamboo (including culms, branches, and leaves) was estimated using eqn. 1 ([58]):
where AGB is the aboveground biomass; A is the age (“du” - [14], [58]); and DBH is the diameter at breast height (1.3 m) in cm.
Therefore, the aboveground net primary production (ANPP) of bamboo was the sum of the production of the newly established bamboos, 2, 3, and 4 “du” bamboos, and the understory. For simplicity, 0.5 was used as the carbon concentration to convert biomass to carbon ([55]).
The understory was harvested in three 1 × 1 m subplots in each plot. Monthly litter input was collected by three 1 × 1 m collectors set in a similar equilateral triangle shape in each plot. All samples were dried to a constant weight at 65°C. The annual biomass of the understory was equal to the annually formed biomass because the understory was newly formed every year.
Root sampling and net primary production
The roots were collected by sequential soil cores (8 cm in diameter) in the middle of each month from April 2011 to March 2012. Five soil cores were randomly selected in each plot and divided into two layers: 0-20 cm and 20-40 cm, because most of the bamboo roots were distributed above 40 cm ([41]). A total of 1080 soil sequential cores were collected. The roots were manually washed to remove soil in flowing water. Roots with a diameter smaller than 2 mm were defined as fine roots in accordance with widely used criteria ([45], [1], [27]), whereas roots with a diameter larger than 2 mm were defined as coarse roots. In the laboratory, root samples were dried to a constant weight at 65 °C and weighed to the nearest 0.01 g. The carbon concentration of roots was determined using the K2Cr2O7-H2SO4 wet oxidation method ([53]). The fine root NPP was estimate by a maximum-minimum approach ([4], [29] - eqn. 2, eqn. 3):
where NPPfr is the fine root net primary production (g m-2); Bmax and Bmin are the maximum and minimum fine root biomass, respectively (g m-2); RT is the fine root turnover rate (a-1); and Bmean is the mean fine root biomass (g m-2).
Because 95% of the biomass increment results from 1 “du” bamboos in Moso bamboo forests ([42]), and there is no diameter and height increment in 2, 3, and 4 “du” bamboos ([14]), the coarse root production of 2, 3, and 4 “du” bamboo was ignored. Therefore, the production of coarse roots was estimated by considering the ratio of the above- and below-ground biomass and the difference between new established belowground NPP and fine root NPP. When calculating the TBCA, the production and biomass were converted to carbon considering the corresponding carbon content.
TBCA
The component cumulative approach ([6]) and the mass balance approach ([36]) were used to estimate the TBCA. The component cumulative approach can be expressed as follows (eqn. 4):
where Rr is the annual root respiration (g C m-2 a-1), taken from the results published by Tang ([40]); NPPcr is the coarse root production (g C m-2 a-1); and other variables are as explained above.
The mass balance approach was first proposed by Raich & Nadelhoffer ([36]) based on the assumption that changes in total organic carbon stock and annual input from aboveground and belowground are equal to the annual respiration of soil decomposers in nearly steady-state ecosystems. That is, the carbon change of the mineral soil, roots, and litter is assumed to be zero, so TBCA can be expressed as ([36] - eqn. 5):
where Rs is the total soil respiration, taken from the published results of Tang ([40]), and LF is the litter carbon (g C m-2 year-1).
Statistical analysis
Statistical analysis was conducted in R 3.1.2 ([35]). Two-way factorial ANOVA analysis was applied to examine the effects of management and soil depth on fine root biomass and production, and a Tukey’s HSD test was used to determine the significance of multiple comparisons (α = 0.05). The relationships between root production and biomass and TBCA were analyzed by linear regression.
Results
Root biomass, production, and turnover
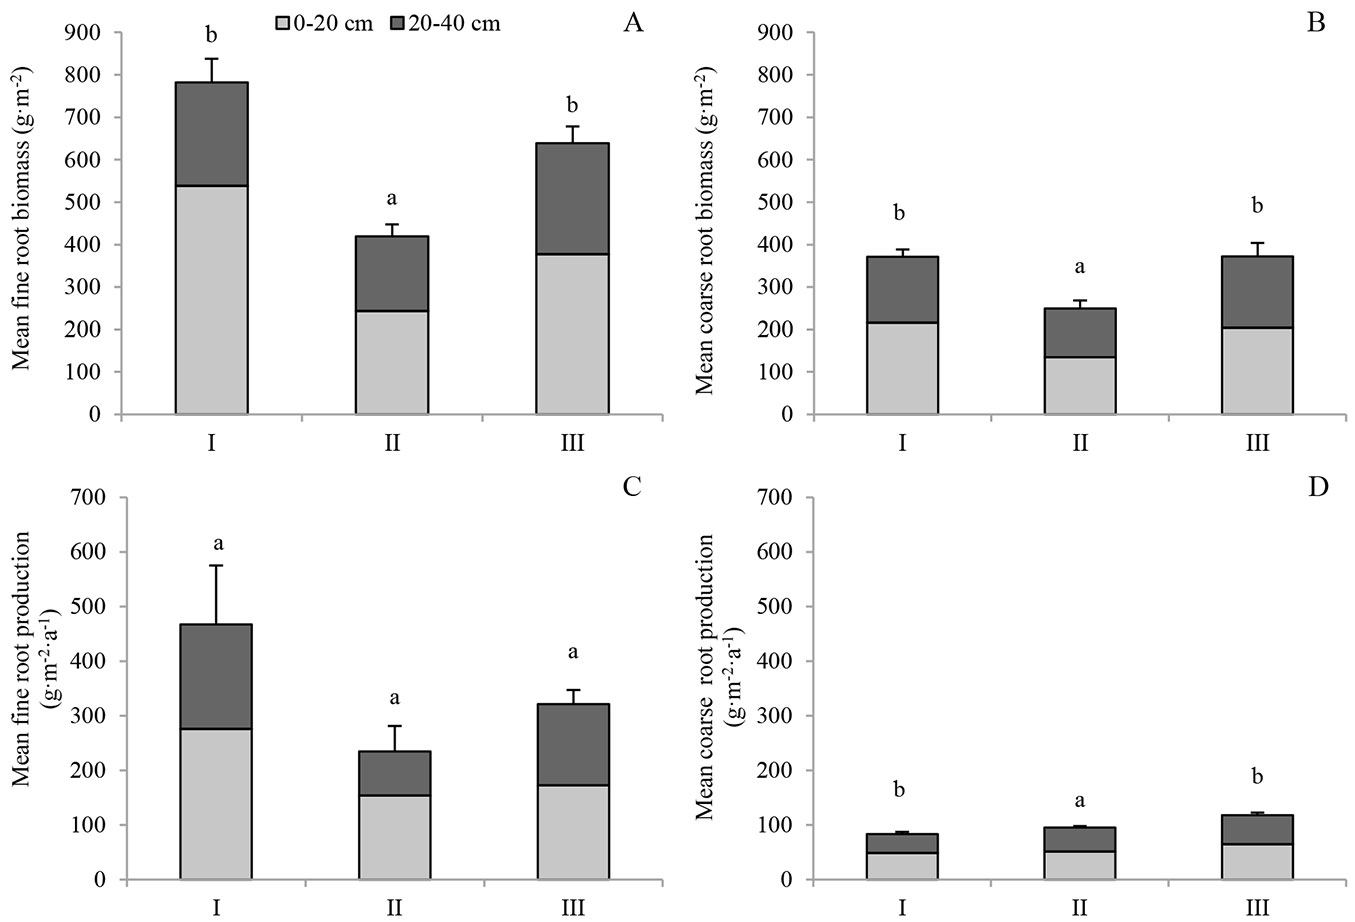
Root biomass and production varied greatly among stand managements and soil depths (Fig. 1A, Fig. 1B, Tab. 2). Both fine and coarse root biomass were higher in the upper layer (0-20 cm) and decreased with increasing soil depth. In 0-20 cm, the annual mean fine root biomass of stand I was 538.5 g m-2, which was significantly higher (p < 0.05) than that of stand II (243.5 g m-2) and stand III (377.2 g m-2). The difference in fine root biomass between stand II and stand III was statistically significant (p < 0.05). In 20-40 cm, the fine root biomass of stand III was the highest (268.7 g m-2), followed by that of stand I (243.5 g m-2) and stand II (175.6 g m-2). In both 0-20 cm and 20-40 cm layers, mean coarse root biomass followed the same order: stand I > stand III > stand II. Total fine root biomass over 0-40 cm was 781.9, 419.2 and 638.7 g m-2 for stand I, stand II, and stand III, respectively, compared to 371.3, 249.3, and 372.1 g m-2, respectively for total coarse root biomass. Both fine and coarse root biomass of stand II were significantly lower than that of stand I and stand III. However, the interaction of understory removal and soil depth had no significant effect on coarse root biomass (Tab. 2).
Fig. 1 - Root biomass and production at 0-20 cm and 20-40 cm depths. Different letters above the error bars indicate the significant difference among stands (p<0.05) for total stand root biomass or production over 0-40 cm. The results of the comparison among different managements in the same layer are shown in Tab. 2. I, II and III represent the control, pesticide-treated and hand-weeded stand, respectively.
Tab. 2 - Results of the two-way factorial ANOVA testing the effects of management and depth on fine or coarse root biomass and production.
| Factor | Fine root | Coarse root | ||||||
|---|---|---|---|---|---|---|---|---|
| Biomass | Production | Biomass | Production | |||||
| F | p | F | p | F | p | F | p | |
| Management | 33.7 | <0.001 | 5.02 | 0.026 | 9.91 | 0.003 | 8.73 | 0.005 |
| Depth | 77.42 | <0.001 | 3.99 | 0.069 | 9.24 | 0.010 | 10.61 | 0.007 |
| Management × Depth | 14.41 | 0.001 | 0.38 | 0.689 | 0.81 | 0.468 | 0.25 | 0.783 |
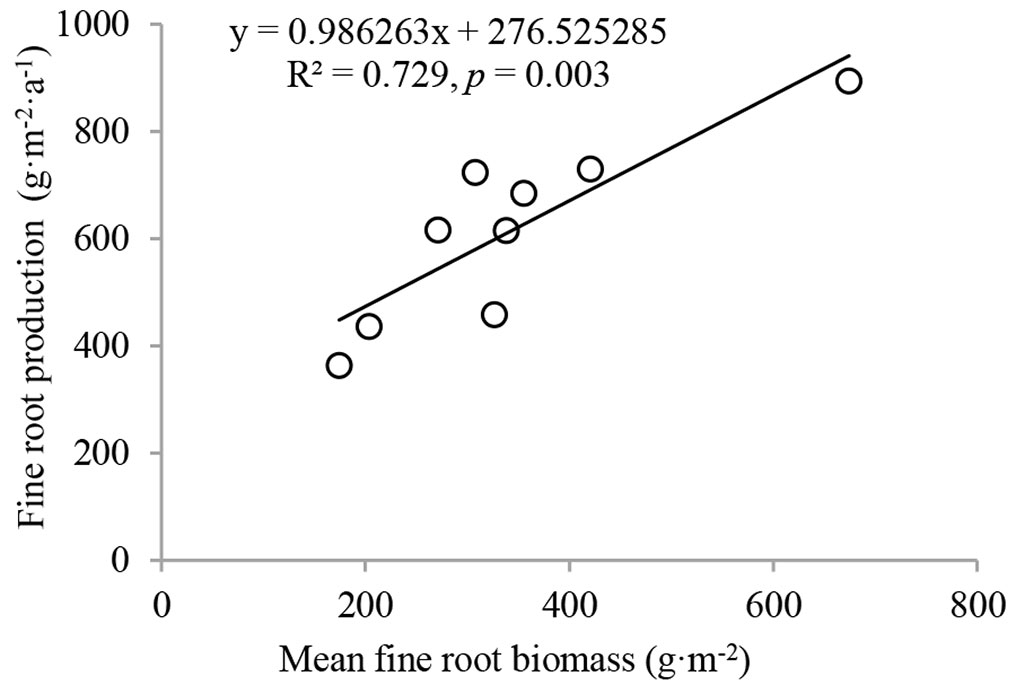
Similarly, fine root production decreased with increasing soil depth (Fig. 1C). The fine root production of stand I was 276.0 g m-2 a-1 in 0-20 cm. It was significantly higher (p < 0.05) than that of stand II (152.3 g m-2 a-1) and stand III (172.5 g m-2 a-1). A similar pattern of change was found for fine root production in 20-40 cm. Fine root production differed with stand management or soil depth at a significant (p < 0.05) or marginally significantly (0.05 < p < 0.1) level (Tab. 2). Compared to fine root production, coarse root production was much lower, ranging from 34.9 g m-2 a-1 in 20-40 cm in stand I to 64.7 g m-2 a-1 in 0-20 cm in stand III. Understory removal and soil depth had significant effects on coarse root production, but their interactions did not have significant effects on coarse root production. The total fine root production over 0-40 cm was 467.5, 235.1, and 321.6 g m-2 a-1 for stand I, stand II, and stand III, respectively, compared to 83.6, 95.1, and 117.8 g m-2 a-1 for coarse root production. Coarse root production in stand I was significantly lower than that of stand III over 0-40 cm (p < 0.05). A strong relationship was observed between fine root production and fine root biomass (Fig. 2).
Fig. 2 - The relationship between mean fine root biomass and fine root production.
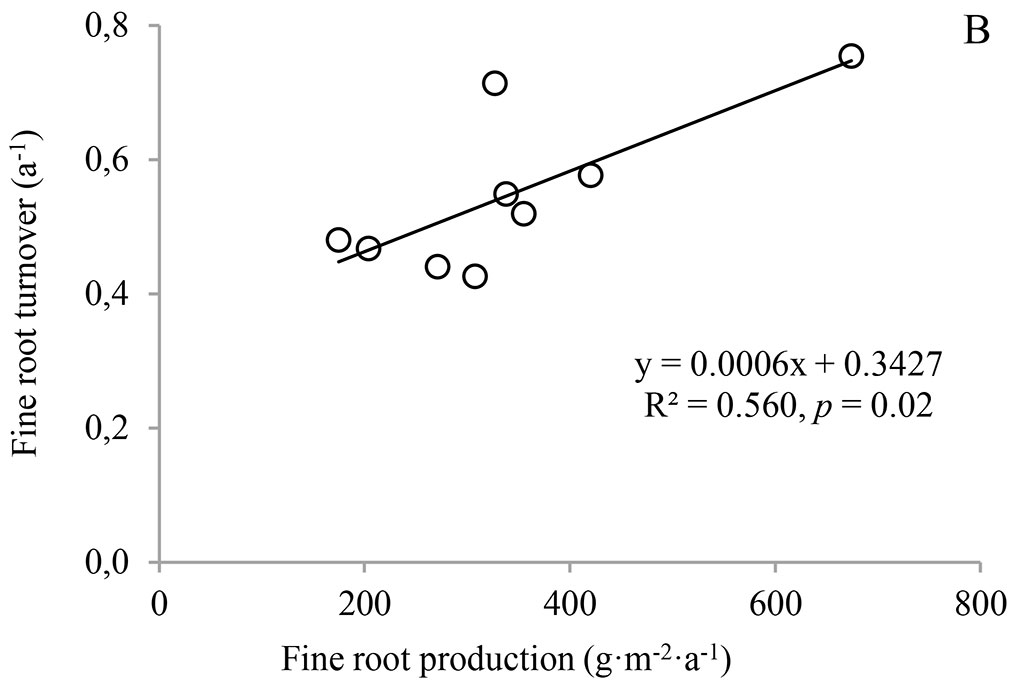
Calculated fine root turnover (FRT) had a range of 0.5-0.6 a-1 for the three stands (Fig. 3), and the understory removal had no significant effect on FRT (p = 0.74). It was surprising that there was no significant relationship between FRT and fine root biomass, combining the significant positive correlation between FRT and fine root production (p = 0.020 - Fig. 4), indicating that fine root production was the main determinant of FRT, rather than mean fine root biomass in Moso bamboo forests.
Fig. 3 - Effects of understory removal on fine root turnover. The same letter above the error bar indicates no significant difference among the stands (p<0.05). I, II and III represent control, pesticide-treated and hand-weeded stand, respectively.
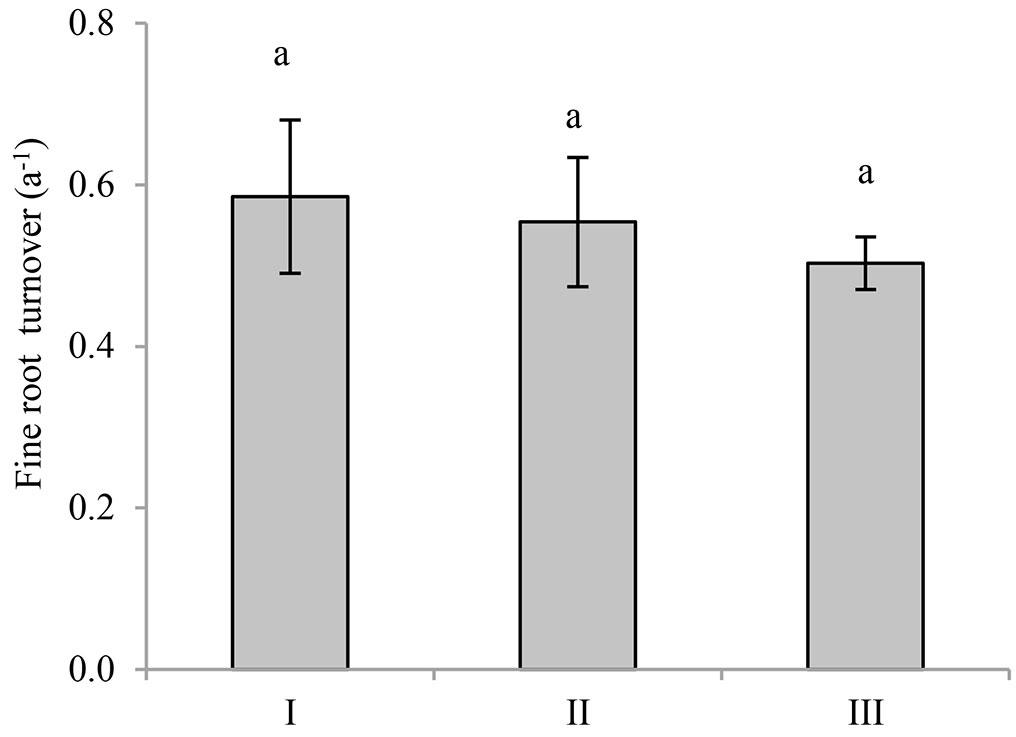
Fig. 4 - The relationship between fine root production and fine root turnover.
Total belowground carbon allocation
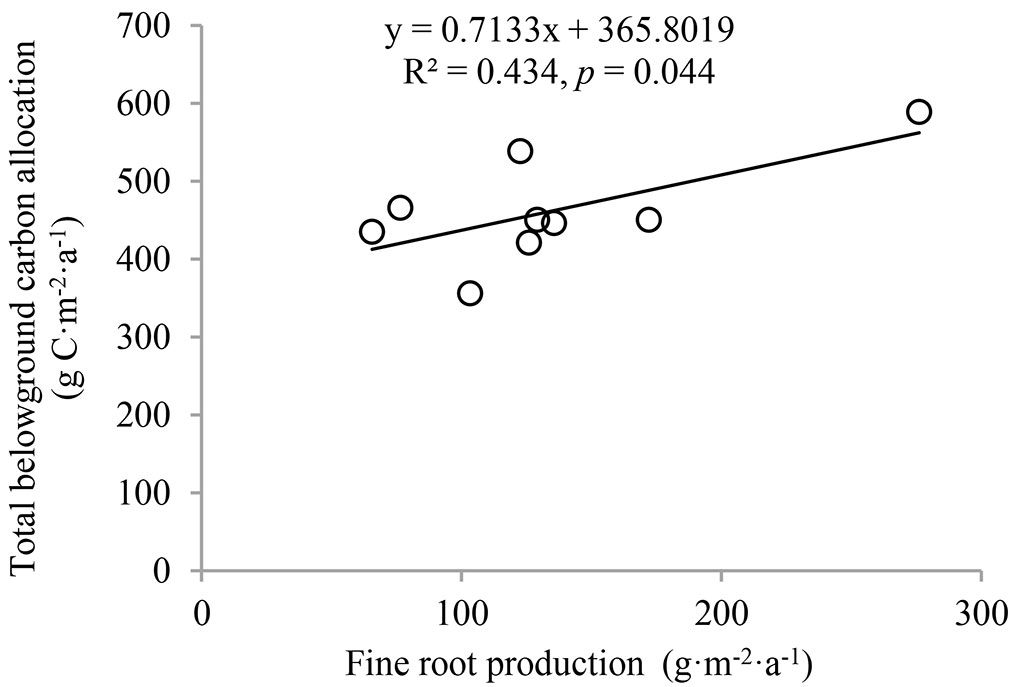
TBCA calculated from the component cumulative approach was 486.9 g C m-2 a-1 for stand I, 480.0 g C m-2 a-1 for stand II and 417.7 g C m-2 a-1 for stand III (Fig. 5). There was no significant difference in TBCA among the three stands. However, TBCA calculated from the mass balance approach showed a reverse pattern; it was highest in stand III, with a value of 679.2 g C m-2 a-1. This value was significantly higher (p < 0.05) than that of stand I (489.4 g C m-2 a-1) and stand II (534.9 g C m-2 a-1). Surprisingly, only the linear relationship between TBCA and fine root production was significant (R2 = 0.539, p = 0.021 - Fig. 6), and there was no relationship between TBCA and coarse root biomass and production (R2 = 0.002-0.021, p = 0.708-0.861).
Fig. 5 - Effects of understory removal on total belowground carbon allocation. Different letters indicates significant difference among the stands (p<0.05). I, II and III represent control, pesticide-treated and hand-weeded stand, respectively.
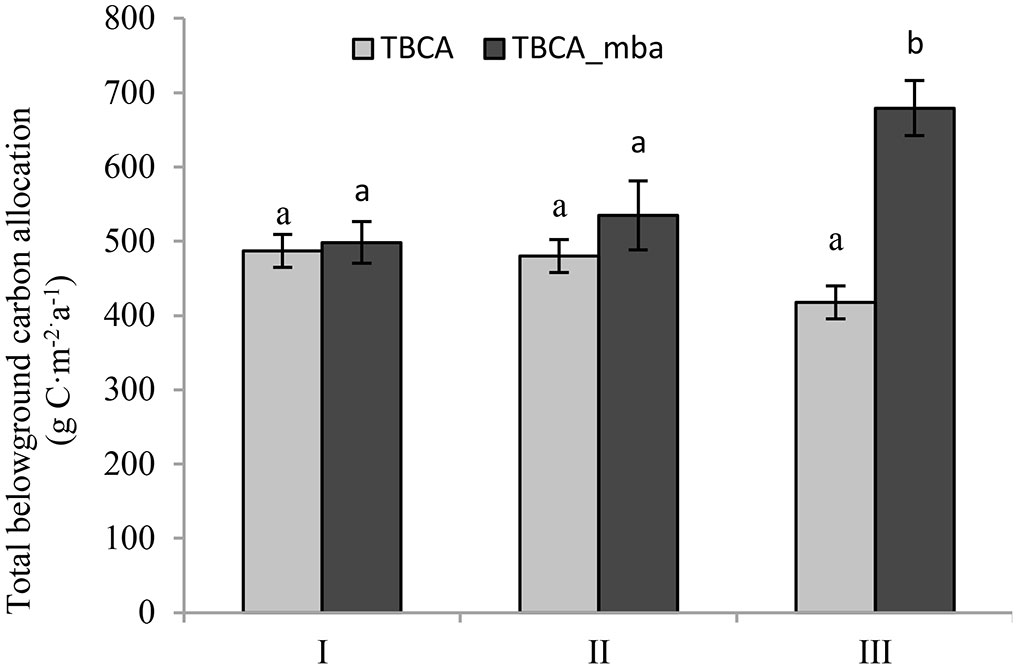
Fig. 6 - The relationships between total belowground carbon allocation and fine root biomass and production.
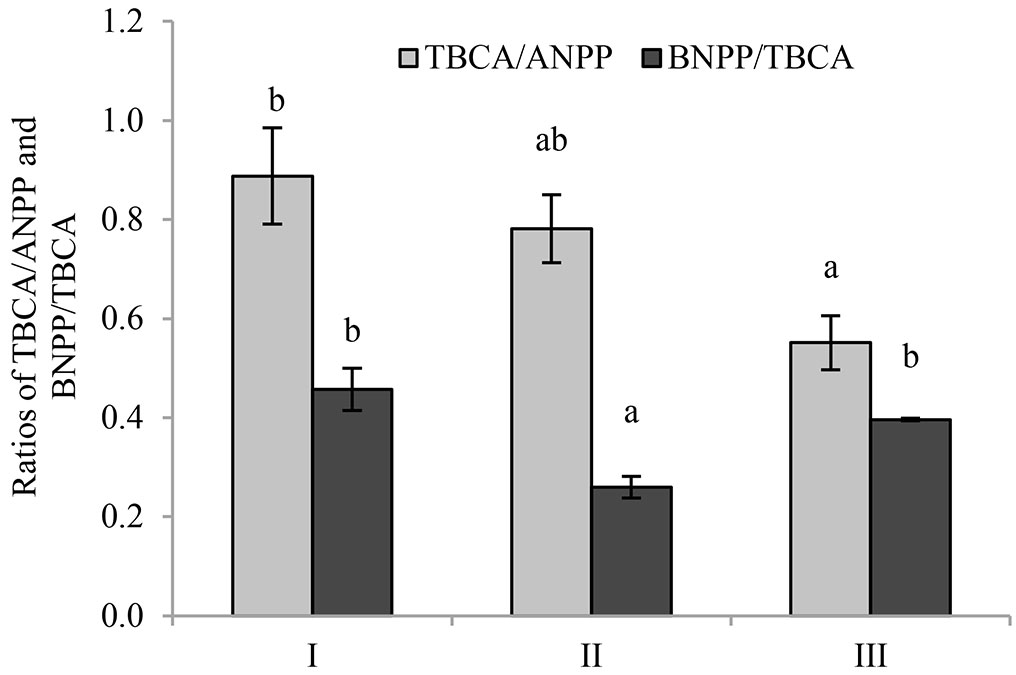
The ratio of TBCA/ANPP of stand I was 0.89 (Fig. 7), which was significantly higher than that of stand III (0.55), but not significantly different from that of stand II (0.78). Moreover, the ratio of belowground net primary production (BNPP) and TBCA in stand II (0.26) was significantly lower than that of stand I (0.46) and stand III (0.40).
Fig. 7 - Effects of understory removal on TBCA/ANPP and BNPP/TBCA. Different letters indicates significant difference among the stands (p < 0.05). I, II and III represent control, pesticide-treated and hand-weeded stand, respectively.
Discussion
Fine root biomass, production, and fine root turnover
Understory removal is an important management practice to reduce resource competition between understory vegetation and the target timber output in Moso bamboo forests. This management tended to allocate more biomass to aboveground. Therefore, the AGB of bamboos in stand II and stand III were higher than that of stand I (Tab. 1). Although the increase in AGB in the managed Moso bamboo forest could potentially increase the root bio-mass for production, the fine roots of the understory could contribute a remarkable amount to total root biomass and production, and the understory biomass in stand I was significantly higher than that in stand II (Tab. 1). Therefore, the fine root production of stand I was significant higher than that of stand II. As evidenced in poplar forests, the root production of the understory may equal or exceed the fine root biomass or production of the overstory ([2]). However, in our study, we did not separate the fine roots of bamboo and herbs because they are extremely difficult to distinguish, as Moso bamboo is taxonomically a kind of herb. Therefore, we considered the root biomass of Moso bamboo and the understory as a whole, rather than separately. It is no doubt that the understory contributed a significant part to total fine root biomass and production ([2]). No significant differences in root biomass and production were observed between stand I and stand III (Fig. 1). Because traditional hand-weeded just removed the aboveground portion of understory vegetation, which could regenerate, no differences were found in the root biomass and production compared to stand I. These results also highlight the importance of including the effects of stand management on fine root production in global carbon cycle modeling.
Fine root biomass ranged from 4.2 to 7.8 t ha-1, accounting for 6.8 to 13.9% of total stand biomass. These ratios were higher than that of other forest types (1.6% for mature pines and 2.1% for 70-year oaks with corresponding stand biomass of 169 and 177 t·ha-1, respectively - [52], [2]). Because the fine root biomass was relatively high in Moso bamboo forests, while the total stand biomass was relatively low (29-40 t ha-1), the stand biomass remained in a dynamic balance with stand development due to its special biological characteristics ([56]). However, our results were similar to a previous study in a Moso bamboo forest (7.7 t ha-1 - [11]), as well in a Pleioblastus amarus bamboo forest (5.3-8.2 t ha-1 - [43]). These results suggest that Moso bamboo has its own biological strategy to meet its required nutrient uptake from the soil in order to maintain high stand productivity despite the large scale timber harvesting.
The strong relationship between fine root biomass and production indicates that fine root biomass was the most important factor for explaining the variation in fine root production. This result is consistent with a meta-analysis using an up-to-date global database covering fine root biomass and production that found that fine root biomass could explain 53% of the variation in fine root production ([13]).
Mean fine root turnover ranged from 0.5-0.6 a-1, which was similar to that in an Asian white birch forest (0.51 a-1, fine roots < 2 mm - [47]) and close to that in a mixed Populus tremuloides forest (0.62 a-1 - [50]). However, the value was lower than that in fast-growing poplar plantations (2.3 and 2.5 a-1 - [2]), a Chinese cork oak forest (1.21 a-1 - [27]), and a Fokienia hodginsii forest (1.47 a-1).
The large differences in measured fine root turnover may be due to species differences, since the fine root turnover of broad-leaf forests was found to be higher than that of needle-leaf forests ([49]). Alternately, they may be due to different definitions of fine root diameter. Definitions of the maximum diameters of fine roots vary from 0.5 mm to 10 mm ([44], [31], [45]), although it is most commonly 1-5 mm ([45], [5], [12]). Previous studies have shown that fine roots with a smaller diameter have higher turnover than larger roots because they have stronger metabolic activity and a shorter life span ([34], [47]). For example, the turnover of <1 mm roots was higher than that of 1-2 mm roots (0.63 vs. 0.39 a-1) in an Asian white cork oak forest ([47]). Another possible reason for different measurements of fine root turnover may be the application of different methods. Based on a meta-analysis, Gill & Jackson ([18]) calculated the fine root turnover as the ratio of annual root production and maximum root biomass, which could potentially lead to lower root turnover. As a result, the turnover was as low as 0.1 a-1 for total roots and 0.56 a-1 for fine roots. These two values are lower than the more recently reported measurements, defined as the ratio of mean root production and mean annual biomass, rather than maximum biomass, of 1.21 a-1 for temperate forests and 1.44 a-1 for tropical forests in the review of Finér et al. ([13]). Similarly, Berhongaray et al. ([2]) found that fine root turnover ranged from 1.5 to 2.5 a-1 after comparing different approaches in poplar forests. Our results were also lower than the reported value in a Moso bamboo forest in Hunan Province, China ([11]). We partly attribute such deviation to methodological differences, as Fan et al. ([11]) used the improved max-min method that considered both live mass and necromass. Summing the live mass and necromass leads to higher root production estimates than using just the live root biomass ([2]), so the failure to separate live and necromass in our study could result in lower fine root turnover compared to Fan et al. ([11]). Therefore, the standardization of the maximum fine root diameter and the measurement method would improve comparisons of fine root turnover.
Total belowground carbon allocation
Although many management practices are commonly conducted to improve the timber output in Moso bamboo forests ([25]), there is a lack of knowledge about the effects of these practices on TBCA. This study is the first attempt to estimate TBCA in the Moso bamboo forest relating to understory removal. TBCA (calculated from the component cumulative approach) ranged from 417.7 to 486.9 g C m-2 a-1, and there was no significant difference among the three stands, indicating that understory removal had no effects on belowground carbon allocation. Although higher fine root and coarse root production was found in stand I and stand III, this was compensated for by the significantly higher root respiration in stand II (p < 0.05 - [40]).
Consistent with other reported results in forest ecosystems ([36], [10]), TBCA was higher than the carbon pool in the litter in the three stands. This highlights the importance of TBCA in global carbon modeling. The ratio of BNPP to TBCA is a key process in modeling ecosystem and belowground carbon cycles; however, the assumed ratio of 0.5 has been widely used due to the lack of BNPP and TBCA data ([30], [17]). The BNPP/TBCA of stand I (unmanaged stand) was 0.46, which generally agreed with the constant value in modeling ecosystem and belowground carbon cycle. However, BNPP/TBCA was 0.26 for stand II and 0.40 for stand III, which were much lower than the constant value of 0.5. These results highlight the importance of including forest management in modelling the belowground carbon cycle.
The strong correlation between the fine root production and TBCA, combined with little or no correlation between fine root biomass, coarse root biomass, and production, suggests that fine root production is a better indicator of changes in TBCA, as it reflects the process of fine root dynamics that is regenerated during a certain time period through the process of new root growth replacing the loss from root death. This result is highly consistent with previous reports ([23], [18], [51]).
The values of TBCA were comparable to those of a Chinese fir plantation in subtropical China (404 g C m-2 a-1 - [6]) and a Metrosideros polymorpha dominated forest (417 g C m-2 a-1 - [37]). The values were also in the range of reported TBCA values of main forest types (146-2510 g C m-2 a-1), but lower than the average TBCA (921.7 g C m-2 a-1). The TBCA was also lower than that of a Castanopsis kawakamii forest (842.6 g C m-2 a-1 - [6]), a Eucalyptus saligna forest (1880 g C m-2 a-1 - [16]), and a Pseudotsuga menziesii forest (710-733 g C m-2 a-1 - [30]). The divergence may be due to the difference in forest types. A meta-analysis found that the average TBCA was in the order of boreal forests < temperate forests < tropical forests ([36], [7]). To maintain aboveground production, more carbon is allocated belowground in tropical forests ([36]). Alternately, the difference may be due to the stage of stand development. For example, the TBCA of an old Chinese fir plantation (88-year) was significantly lower than the TBCA in mature (41-year) and middle-aged (21-year) Chinese fir plantations ([8]). Similarly, the TBCA in a fast-growing Eucalyptus plantation linearly decreased with stand age ([16]). However, how TBCA changes with increasing years of management is still unclear, because in our study we only estimated the TBCA in an “on-year” Moso bamboo forest, and the two management practices both began in 2000. The Moso bamboo forest is a special forest type with mixed ages due to the establishment of new bamboos every year, making it difficult to determine the stand age.
The TBCA calculated from the mass balance approach ranged from 498.4 to 679.2 g C m-2 a-1, which was 23% higher than that from component cumulative approach on average (Fig. 5). The result might violate the assumptions that the stands were stable and there were no carbon changes in the mineral soil, litter, or roots ([36]). However, there were no direct data in our study to qualify the carbon changes in the mineral soil, litter, and roots, so we could not estimate the effects of these changes on the TBCA. Similar to our findings, Chen et al. ([6]) found that the TBCA measured by the component cumulative approach was 26% and 28% lower than that of the mass balance approach in a Chinese fir plantation and a Castanopsis kawakamii forest, respectively. The authors attributed this to the increase in carbon changes in fine roots and coarse roots ([6]). The trenching method was used to partitioning the root respiration, which could have underestimated root respiration when the roots in the trenched subplot did not die completely, especially in the first few months ([21]). As a result, this could potentially underestimate the TBCA.
Besides the mass balance approach, Raich & Nadelhoffer ([36]) also proposed a universal model relating TBCA to litter biomass as expressed by: TBCA = 1.92·LF + 330 (R2 = 0.52; n = 30; p < 0.001), where LF is the litter carbon (g C m-2 a-1). If the relationship was applied to our data, TBCA would be two-fold higher than our calculated results. This indicates that the global pattern is not applicable in the Moso bamboo forest in our study area. This has already been confirmed by previous studies ([20], [32], [10]) that the relationship is not necessarily applicable to small-scale estimation. Therefore, these results indicate that method selection is extremely important for the precise estimation of TBCA, since the belowground process is extremely complex, but TBCA plays a critical role in the global carbon cycle.
Conclusions
This study evaluated the effects of understory removal on fine root production, turnover, and TBCA in the infrequently studied Moso bamboo forests. This could contribute to our understanding of the belowground carbon process in these forests and global carbon cycling. Understory removal had no significant effects on fine root turnover and TBCA, but it significantly reduced the fine root biomass and production. The strong relationship between fine root production and turnover and TBCA indicated that fine root production was the main contributor to belowground carbon dynamics. Different methods could generate different estimates of fine root production and TBCA, indicating that refining and improving the methods to estimate the accuracy of root turnover and TBCA will be important for understanding the controls on fine root turnover and belowground carbon allocation. However, our study was only conducted in “on-year” Moso bamboo forests, and further studies are required to determine the effects of stand management on fine root turnover and TBCA change in “off-year”.
Acknowledgments
This study was supported by the “948 project” of the State Forest Administration (2013-4-70), the special research fund of the International Center for Bamboo and Rattan (1632013010), the Special Funds for Forestry Public Industry Research (201104 008). The authors would like to thank Qingbiao Xu for carrying fieldwork and lab work, and Jin Yu, Chuxin Shen for support of fieldwork. We would like to express our thanks to the anonymous reviewers whose suggestions contributed to improve the manuscript.
References
CrossRef | Gscholar
Gscholar
Gscholar
Gscholar
CrossRef | Gscholar
Gscholar
Gscholar
Gscholar
CrossRef | Gscholar
Gscholar
Gscholar
Gscholar
Gscholar
Gscholar
Gscholar
Gscholar
Gscholar
Authors’ Info
Authors’ Affiliation
Shaohui Fan
Lianghua Qi
Fengying Guan
Guanglu Liu
Key Laboratory of Bamboo and Rattan Science, International Centre for Bamboo andRattan, Wangjing, Chaoyang District, Beijing 100102 (China)
Experimental Center ofForestry in North China, Chinese Academy of Forestry, No. 1 Shuizaxilu, Mentougou, Beijing102300 (China)
Corresponding author
Paper Info
Citation
Tang X, Fan S, Qi L, Guan F, Liu G, Du M (2015). Effects of understory removal on root production, turnover and total belowground carbon allocation in Moso bamboo forests. iForest 9: 187-194. - doi: 10.3832/ifor1674-008
Academic Editor
Arthur Gessler
Paper history
Received: Apr 13, 2015
Accepted: Aug 17, 2015
First online: Nov 20, 2015
Publication Date: Apr 26, 2016
Publication Time: 3.17 months
Copyright Information
© SISEF - The Italian Society of Silviculture and Forest Ecology 2015
Open Access
This article is distributed under the terms of the Creative Commons Attribution-Non Commercial 4.0 International (https://creativecommons.org/licenses/by-nc/4.0/), which permits unrestricted use, distribution, and reproduction in any medium, provided you give appropriate credit to the original author(s) and the source, provide a link to the Creative Commons license, and indicate if changes were made.

Web Metrics
Breakdown by View Type
Article Usage
Total Article Views: 52765
(from publication date up to now)
Breakdown by View Type
HTML Page Views: 42950
Abstract Page Views: 3858
PDF Downloads: 4644
Citation/Reference Downloads: 30
XML Downloads: 1283
Web Metrics
Days since publication: 3897
Overall contacts: 52765
Avg. contacts per week: 94.78
Article Citations
Article citations are based on data periodically collected from the Clarivate Web of Science web site
(last update: Mar 2025)
Total number of cites (since 2016): 9
Average cites per year: 0.90
Publication Metrics
by Dimensions ©
Articles citing this article
List of the papers citing this article based on CrossRef Cited-by.
Related Contents
iForest Similar Articles
Research Articles
Fine root morphological traits and production in coniferous- and deciduous-tree forests with drained and naturally wet nutrient-rich organic soils in hemiboreal Latvia
vol. 16, pp. 165-173 (online: 08 June 2023)
Research Articles
Soil respiration and carbon balance in a Moso bamboo (Phyllostachys heterocycla (Carr.) Mitford cv. Pubescens) forest in subtropical China
vol. 8, pp. 606-614 (online: 02 February 2015)
Research Articles
Fine root production and distribution in the tropical rainforests of south-western Cameroon: effects of soil type and selective logging
vol. 3, pp. 130-136 (online: 27 September 2010)
Research Articles
Modeling the fine root biomass dispersion using a special influence function
vol. 1, pp. 141-144 (online: 25 November 2008)
Research Articles
Short-term recovery of fine root carbon stock is inhibited by skid trails in a humid tropical forest
vol. 18, pp. 344-349 (online: 30 November 2025)
Research Articles
Mid-rotation fertilization and liming of Pinus taeda: growth, litter, fine root mass, and elemental composition
vol. 14, pp. 195-202 (online: 24 April 2021)
Research Articles
Effects of nitrogen loading under low and high phosphorus conditions on above- and below-ground growth of hybrid larch F1 seedlings
vol. 11, pp. 32-40 (online: 09 January 2018)
Research Articles
Thinning effects on soil and microbial respiration in a coppice-originated Carpinus betulus L. stand in Turkey
vol. 9, pp. 783-790 (online: 29 May 2016)
Research Articles
Carbohydrate metabolism during new root growth in transplanted Larix olgensis seedlings: post-transplant response to nursery-applied inorganic fertilizer and organic amendment
vol. 10, pp. 15-22 (online: 22 September 2016)
Research Articles
Effects on soil characteristics by different management regimes with root sucker generated hybrid aspen (Populus tremula L. × P. tremuloides Michx.) on abandoned agricultural land
vol. 11, pp. 619-627 (online: 04 October 2018)
iForest Database Search
Search By Author
Search By Keyword
Google Scholar Search
Citing Articles
Search By Author
Search By Keywords
PubMed Search
Search By Author
Search By Keyword


