
Response of juvenile progeny of seven forest tree species and their populations to simulated climate change-related stressors, heat, elevated humidity and drought
iForest - Biogeosciences and Forestry, Volume 11, Issue 3, Pages 374-388 (2018)
doi: https://doi.org/10.3832/ifor2340-011
Published: May 15, 2018 - Copyright © 2018 SISEF
Research Articles
Abstract
The study aimed to evaluate response and phenotypic plasticity of juvenile progeny of seven forest tree species Pinus sylvestris, Picea abies, Quercus robur, Fraxinus excelsior, Alnus glutinosa, Betula pendula and Populus tremula and their populations to climate change-related stressors, simulated in a phytotron - heat and elevated humidity and heat and drought - in comparison to performance in ambient (control) conditions. Treatment effect on sapling morphometric, physiological and biochemical traits was significant except for health condition, transpiration and photosynthetic rates and water use efficiency (WUE). Species effect and species-by-treatment interaction were strongly significant in most traits studied, indicating a great inter-specific variability of responses to the applied treatments. Compared to control, stem diameter increment was lower for most species following both hot-wet and hot-dry treatments, while treatment impact on height increment was less pronounced and sometimes even positive. Drought caused significant defoliation in P. tremula, A. glutinosa and B. pendula, while under hot-wet treatment the defoliation in most species was lower than in control. Following hot dry treatment, WUE in P. abies, P. sylvestris and B. pendula was lower than following both hot-wet treatment and control, while in P. tremula, A. glutinosa and Q. robur WUE was higher. This suggests that the latter species are able to maintain a balance between photosynthesis and transpiration. Photosynthetic rate was highest in P. tremula, B. pendula and A. glutinosa, however it was much more negatively affected by water deficit in these three species than in other tested species. In most cases, drought had a negative effect on production of pigments in deciduous tree species, which, together with increased amounts of malondialdehyde and hydrogen peroxide, indicated a presence of an oxidative stress. Significant population effect and population-by-treatment interactions found for most traits showed different plasticity and response of tree populations to the treatments. Although, only 19% of the populations showed significant ecovalencies. Some of the observed reactions may not be considered as adaptive acclimation as decreasing growth of some species and populations indicates deteriorating performance which may lead to changes in their competitiveness, thus compromising regeneration, persistence of natural successions and sustainability of forest ecosystems.
Keywords
Climate Change, Stress, Growth, Physiology, Transpiration, Photosynthesis, Water Use Efficiency, Biochemical Parameters, Phenotypic Plasticity
Introduction
Over the few last millennia forest tree species were subjected to conspicuous climatic and environmental changes and were forced to react to these changes by migration and genetic adaptation to new growing conditions ([36]). Current environmental changes are significantly faster compared to those that took place during post-glacial climatic shifts. Therefore, there are widespread concerns that trees, as long-lived organisms, may not be able to cope with rapid climate changes. Increasing frequency and amplitude of abiotic and biotic disturbances driven by recent rapid climate change may compromise the sustainability of forest ecosystems, forest regeneration, biodiversity and persistence of natural ecological successions in European boreal and northern temperate forests. Global climate changes are leading to increase in temperature as well as alterations in rainfall patterns ([10], [78]).
With prolonged periods of drought and temperature extremes becoming more frequent ([40]), the environmental stress on trees will increase. For example, in Lithuania, there were several local and country-wide periods of prolonged drought and heat waves/temperature extremes (>+30oC) during the last two decades (1995-2015). These climatic extremes occurred about three times more often than during the preceding two decades (1975-1995): during 1995-2015 there were 102 days with day temperatures exceeding +30oC, during 1975-1995 there were only 35 such days ([2]). Changes in physical climate will subsequently induce changes in plant morphology, physiology and chemistry that may increase plant susceptibility to diseases ([11]). The risk of drought increases in some regions because of reduced soil moisture caused by enhanced evapotranspiration under a rising temperature ([59]). Such changes have the potential to directly affect the physiological processes of plants such as photosynthesis and transpiration ([64]). Water deficit is regarded to be a major factor limiting plant growth ([35], [74]). Drought is one of the most important abiotic stress factors that influence the natural distribution of woody plants and limit ecosystem production ([101]). Recent studies demonstrated that drought affects a wide range of plant responses, from changes in plant metabolism to the alteration in leaf and wood anatomy ([87], [85]). High temperature and drought stresses alter the physiological, biochemical and molecular responses of plants ([94], [82]). These stresses increase tree mortality world-wide revealing climate change risk for forests ([1]).
Photosynthetic rate is considered to be a sensitive physiological parameter of plant metabolism and development which can be measured and used to reflect plant response to changes in environmental conditions and to evaluate the resistance of tree populations to drought and high temperatures ([54], [56]). Induced inhibition of photosynthesis and oxidative stress well reveal the effect of lack of water in the cell, reducing plant dry biomass accumulation and productivity ([32], [94], [106]). It has been demonstrated that the inhibition of photosynthesis and magnitude of oxidative stress strength largely depends on stomatal conductivity ([4], [58]). Initial response to the reduced amount of water in soil is stomatal closure, which decreases evaporation, gas exchange intensity and intercellular CO2 concentration, thus reducing photosynthetic productivity ([4], [82]). Severe drought during one growing season may induce physiological responses that are carried over into the following years ([37]).
Generation of reactive oxygen species (ROS) is one of the earliest responses of plant cells to heat and drought stresses. Moreover, free radicals damage plant cellular macromolecules, biomembranes and increase lipid peroxidation ([4], [12]). On the other hand, they also play a signaling role, and changes in production of ROS can act as a signal that changes the transcription of genes, thereby favoring the adaptation of plants to stresses ([38]). Among ROS species, the hydrogen peroxide (H2O2) is an important compound involved in plant response to different environmental stressors ([9], [38]). Moreover, H2O2 protects photosynthetic membranes during light stress ([46]). Lipid peroxidation is well-established mechanism of controlling cellular injures in both plants and animals, and is used as an indicator of oxidative stress in cells and tissues ([17]). Malondialdehyde (MDA) is usually used to evaluate status of redox and osmotic adjustment, which is important in the adaptation of plants to environmental stresses. A lower MDA gives indication of a higher anti-oxidative ability (high oxidative stress tolerance), which reflects a higher drought resistance ([3]).
Plant pigments are of key importance for photosynthetic processes and for preventing photo-oxidation and photo-inhibition ([29]). The decrease of chlorophyll content is a typical symptom of oxidative stress ([4], [61]). Photosynthetic pigments are important to plants mainly for harvesting light and for the production of reducing molecules such as ATP and NADPH. Plants respond to changing environmental conditions by changes in composition of pigments in the chloroplasts ([61]). For proper functioning of the photosynthetic mechanism, the chlorophyll a/b ratio may decrease in leaves because chlorophyll a has a tendency to degrade faster in stressful conditions than chlorophyll b ([61]). Carotenoids are also present in plant cellular membranes and protect the membranes from light-dependent oxidative damage ([61], [103]). Comparison of drought-tolerant and sensitive cultivars of herbaceous species suggested that tolerance positively correlates with concentration of carotenoids in plant tissues ([18], [103]).
Such a high pressure by climate change-related stressors may not only affect plant physiology, but also through an intensified natural selection may result in changes in plants’ genetic properties, reduction of genetic diversity and, subsequently, decline in adaptability potential of plant populations ([44]). The wide distribution of temperate and boreal forest tree species throughout Europe exposed them to a variety of environmental conditions. Such a capacity for the dynamic colonisation has been attributed to a large species’ adaptability ([23]). Previous studies have shown a large variation in forest trees’ responses to changing environmental conditions or impact by various climate change-related stressors ([19], [80], [95], [43], [14], [7], [68], [69], [8], [51], [25], [70], [71], [72], [66]). Ecophysiological studies highlighted differential mechanisms of response to water stress depending on site conditions at the origins ([48], [49], [51]). A higher capacity of photosynthesis and transpiration in seedlings originating from arid sites than in those from mesic sites was reported ([50]). Studies on genetic variation in these traits in material from the whole distribution area of a certain tree species indicated a presence of among- and within-population genetic variation in drought tolerance ([68], [51]). It has been found that different populations and genotypes show different plasticity and patterns of response to stressors. This builds a basis for a natural selection to act upon and loss of less adaptive genotypes may change a genotypic structure and reduce genetic diversity of populations. These may have a negative effect on evolution and survival of separate populations or even of the entire species. Under climate change temperate deciduous forests are predicted to shift northwards, where they are likely to replace mixed forests ([5]). Lithuania is located in the transition between the continental and boreal biogeographical regions of Europe - continental and boreal ([21]) - thus northwards shifting of climatic envelope may have more pronounced impact on those forest ecosystems than in centres of biogeographical regions.
Despite extensive research efforts there is still a certain lack of knowledge on how different tree species and populations may respond to rapidly changing environmental conditions and extreme climate change-related stressors, what are the mechanisms of species’ adaptation, which species have developed best strategies to cope with the stress-induced damages, and how adaptive response and phenotypic plasticity can contribute to adaptation to stressful environmental conditions. The aim of the present study was to evaluate response and plasticity of juvenile progeny of seven forest tree species, Scots pine, Norway spruce, pedunculate oak, common ash, black alder, silver birch and common aspen, and their different populations to climate change-related stressors - heat in combination with drought or elevated humidity - simulated in a controlled environment. A complex of morphometric (tree height and diameter), health condition (survival, sanitary condition and defoliation), physiological (rate of photosynthesis as net CO2 assimilation, transpiration, stomatal conductance and intercellular CO2 concentration, rate of photosynthetic gas exchange) and biochemical parameters (amount of photosynthetic pigments, stress-indicating biochemical compounds like hydrogen peroxide and malondialdehyde) were used as indicators of response variability among species and populations.
Materials and methods
Tree species studied
Saplings of seven forest tree species (Scots pine, Pinus sylvestris L.; Norway spruce, Picea abies [L.] Karst.; pedunculate oak, Quercus robur L.; European ash, Fraxinus excelsior L.; black alder, Alnus glutinosa [L.] Gaertn.; silver birch, Betula pendula Roth.; and common aspen, Populus tremula L.) were used in the present study. Each species was represented by open-pollinated progenies from three populations representing three different ecoclimatic sub-regions of Lithuania and two biogeographical regions of Europe - continental and boreal ([21] - Tab. 1).
Tab. 1 - Data on origin of populations of seven forest tree species used in the experiment. (a): ⇒ http://www.geoportal.lt/ (2016); (b): Chromov ([13]); (c): EEA ([21]).
| Tree species |
Population | Long Lat |
Altitude (m a.s.l.) |
Climatic sub-region (a) |
Climate continentality index (b) |
Temperature sum >10 oC (days) (a) |
Annual precipi-tation (mm) (a) |
Biogeographic region (c) |
|---|---|---|---|---|---|---|---|---|
| Pinus sylvestris | Jonava | 55°01′ N 24°28′ E |
40 | 6 | 30 | 2200 | 620 | Contin. |
| Varena | 54°04′ N 24°30′ E |
125 | 9 | 31 | 2170 | 650 | Contin. | |
| Anykščiai | 55°38′ N 25°06′ E |
120 | 8 | 30 | 2150 | 700 | Boreal | |
| Picea abies | Rietavas | 55°32′ N 22°24′ E |
140 | 5 | 26 | 2000 | 850 | Boreal |
| Kaunas | 54°59′ N 23°55" E |
74 | 7 | 30 | 2220 | 640 | Contin. | |
| Anykščiai | 55°32′ N 24°59′ E |
125 | 8 | 30 | 2150 | 700 | Boreal | |
| Quercus robur | Tytuvenai | 55°39′ N 23°01′ E |
122 | 5 | 27 | 2100 | 700 | Boreal |
| Jonava | 55°05′ N 24°15′ E |
90 | 6 | 30 | 2200 | 620 | Contin. | |
| Anykščiai | 55°33′ N 24°55′ E |
103 | 8 | 30 | 2150 | 700 | Boreal | |
| Fraxinus excelsior | Bartoszyce | 54°13′ N 20°46′ E |
72 | 9 | 31 | 2400 | 700 | Contin. |
| Lelkovo | 54°15′ N 20°11′ E |
111 | 9 | 31 | 2400 | 700 | Contin. | |
| Kozlovo | 53°31′ N 20°22′ E |
339 | 9 | 31 | 2300 | 700 | Contin. | |
| Betula pendula | Raseiniai | 55°20′ N 22°57′ E |
110 | 7 | 28 | 2070 | 700 | Contin. |
| Ukmerge | 55°22′ N 24°32′ E |
126 | 6 | 30 | 2200 | 630 | Boreal | |
| Anykščiai | 55°40′ N 25°10′ E |
113 | 8 | 30 | 2150 | 700 | Boreal | |
| Alnus glutinosa | Tytuvenai | 55°34′ N 23°18′ E |
131 | 5 | 27 | 2100 | 700 | Boreal |
| Jonava | 55°00′ N 24°15′ E |
61 | 6 | 30 | 2200 | 620 | Contin. | |
| Valkininkai | 54°24′ N 24°34′ E |
159 | 9 | 31 | 2150 | 670 | Boreal | |
| Populus tremula | Tytuvenai | 55°37′ N 23°21′ E |
110 | 5 | 27 | 2100 | 700 | Boreal |
| Dubrava | 54°51′ N 24°04′ E |
80 | 7 | 30 | 2210 | 650 | Contin. | |
| Anykščiai | 55°34′ N 24°50′ E |
115 | 8 | 30 | 2150 | 700 | Boreal |
Treatment experiments
Prior to the treatment experiments, the saplings of all tree species except common aspen were grown in an open-air nursery, and in autumn 2015 they were transplanted into plastic squared pots (15×15×17 cm) filled with 3.5 l of peat substratum (Klasmann KTS-1, pH 5.5-6.0, with N 140 mg l-1, P2O5 160 mg l-1, K2O 18 mg l-1, Mg 85 mg l-1). Each treatment was performed using a randomized complete block design with 27 single-tree plots of each population. Two such blocks were established. In total, over 5000 saplings of all the tested tree species were used in this experiment.
The experiments were carried out in two closed walk-in chambers of greenhouse type with semi-controlled environment in a phytotron of the Institute of Forestry, Lithuanian Research Centre for Agriculture and Forestry (Central Lithuania, 55° 52′ N 24° 07′ E). The area of each chamber covered 60 m2 and the interior volume was 240 m3. Two treatments were set to mimic forecasted stressors of climate change (namely, heat and drought, and heat and elevated humidity), and the third was control (ambient conditions). Specifically, the treatments were:
(1) Hot-wet (HW) treatment. Air temperature ranged between 25 and 40 °C during day and between 15 and 20 °C during night, and air humidity during day ranged between 60 and 80%. Plants were watered as necessary throughout the experiment. The total duration of the hot-wet treatment was two months (July and August).
(2) Hot-dry (HD) treatment. In mid-July 2016, artificial drought conditions have been created by reducing watering of tree saplings for three weeks and keeping substrate moisture at 20-30% of the total water holding capacity. To estimate soil water content, evapotranspiration and plant water status, in each treatment, 15 pots with substrate and saplings of each tree species (5 per population) were weighted every second day, allowing the estimation of water loss in the pots at a given moment. The water loss was calculated by comparing weight of these pots with that of the same pots with fully saturated substrate (weighted prior to treatment). When soil moisture for certain tree species dropped below 20% of the total water capacity, a limited irrigation (flooding) from below was applied. During the period of artificial drought, air humidity in the climatic chamber during day ranged between 40 and 60%. After this treatment the plants were watered to restore full water holding capacity of peat substrate.
(3) Control (ambient conditions, Amb). Saplings were grown outside the phytotron in an open air. During the experiment, outside air temperature ranged between 20 and 28 °C during day and between 12 and 17 °C during night, and air humidity ranged between 60 and 80%. Plants were watered when necessary throughout the experiment to keep substrate moisture in pots between 70 and 90% of full water holding capacity. The total duration of the control treatment was four months (May-August). In the year the present study was performed (2016), no natural droughts or heat waves have occurred at the experimental site, thus control treatment corresponded to ambient climatic conditions almost unaffected by climate change.
Temperature regimes were equal both in HW and HD treatments. In growth chambers, light intensity (PAR 400-700 nm) at the top of the sapling crowns in clear days ranged between 1220-1370 μmol m-2 s-1 while in open air between 1670-2090 μmol m-2 s-1.
Assessment of sapling morphometric and physiological parameters
Total height (above the ground) and stem diameter at the root collar were measured for each sapling before and by the end of vegetation season of 2016. Height and diameter increments were calculated for each sapling based on their corresponding heights and diameters. Sapling health condition was scored in autumn 2016 using a categorical scale ranging from 5 (excellent condition, no visible damages) to 1 (very bad condition, dying). Survival was assessed in autumn 2016 as the ratio between a number of survived trees and the total number of alive trees at the beginning of vegetation season. Sapling defoliation (leaf/needle loss) was estimated as a fraction of shed leaves/needles at the end of each treatment of the initial amount of leaves/needles on a certain sapling (recorded at the beginning of the experiment).
Rates of photosynthesis as net CO2 assimilation (A, μmol m-2 s-1), transpiration (E, mmol m-2 s-1), stomatal conductance (gs, mol m-2 s-1) and intercellular CO2 concentration (Ci, μmol mol-1) were recorded using a LCpro-SD® portable photosynthesis system (ADC BioScientific Ltd, UK). Light conditions inside a leaf chamber were set using the LCpro-SD light unit, which emitted photosynthetically active radiation (PAR) at 1000 μmol m-2 s-1. The air supply unit provided a flow of ambient air to the leaf chamber at a constant rate of 200 μmol s-1. Air humidity was set at 20 mBar of partial water pressure; temperature and CO2 concentration were at ambient levels. Readings were taken under steady-state conditions (after 1 min). In each treatment, photosynthetic gas exchange was assessed for nine randomly selected trees of each of the seven species from each population (Tab. 1). For the gas exchange measurements we selected: (i) for deciduous trees, a fully expanded and exposed fifth leave from the top of the leader shoot of each sapling, and (ii) for conifers, all needles on the first (from tree top) lateral annual shoot of each sapling. The measurements were carried out at the end of experiment (beginning of August) from 10:00 to 14:30 a.m.
Instantaneous water use efficiency (WUE, μmol mmol-1) was computed as the ratio between net photosynthesis and transpiration (A/E), and intrinsic water use efficiency (WUEi, μmol mol-1) was computed as the ratio between net photosynthesis and stomatal conductance (A/gs - [26]).
To estimate sapling response to different stressors, the amounts of produced malondialdehyde (MDA), hydrogen peroxide (H2O2), and photosynthetic pigments (chlorophylls a and b and carotenoids) were assessed. For analysis of MDA and H2O2, fresh leaf material (0.5 g) was homogenized using 5% (w/v) trichloracetic acid (TCA). Lipid peroxidation was estimated as the amount of MDA produced by 2-thiobarbituric acid (TBA - [45]). The homogenates were centrifuged at 12.130 g for 17 min, and 2.0 ml of supernatant was added to 3.0 ml of 20% (w/v) TCA containing 0.50% (w/v) TBA. The homogenates were incubated at 95 °C for 30 min and subsequently cooled on ice. After cooling, the homogenates were centrifuged at 12.130 g for 17 min, and MDA content was determined by subtracting absorbance value recorded at 600 nm from the absorbance value recorded at 532 nm and using an absorbance coefficient of 155 mM-1 cm-1. H2O2 content in leaves was determined according to Velikova et al. ([90]). A 0.5 ml of supernatant was added to 0.5 ml of potassium phosphate buffer (10 mM, pH 7.0) mixed with 1.0 ml of potassium iodide (1 M). The reaction solution was incubated for 30 min at 25 °C in the dark. The absorbance of the supernatant was measured at 390 nm wavelength. The amount of H2O2 was calculated using a standard curve based on known concentrations.
The photosynthetic pigments were extracted from 0.05 g of fresh leaf/needle material in 3 ml of N,N’-dimethylformamide (DMF). The light absorption was measured at 480, 664, 647 nm wavelengths. Chlorophyll a/b ratios and amounts of chlorophylls a and b and carotenoids were calculated according to Wellburn ([97]).
All spectrophotometrical measurements were made using the spectrophotometer SPECORD® 210 Plus (Analytik Jena AG, Germany). All data are expressed on a leaf fresh weight basis.
Statistical analysis
The variance analysis of data was performed using the MIXED procedure in SAS (SAS® Analytics Pro 12.1, 9.3, [76]) which is based on Mixed model equations (MME) and restricted maximum likelihood (REML) method. The significance of fixed effects was tested using an F-test. The following linear models were used for joint analyses (eqn. 1) of all treatments together and for separate analyses (eqn. 2) of individual treatments:
where Yijklm is an observation on lth tree from ith population in kth tree species in mth block in jth treatment, Yiklm is an observation on lth tree from ith population in kth species in mth block, µ is the overall mean, Tj is the effect of jth treatment, Bm is the effect due to the mth block, Sk is the effect due to the kth tree species, Pi(k) is the effect of ith population in kth species, Pi(k)∙Tj is the effect of interaction between ith population in kth species and jth treatment, Sk∙Tj is the effect of interaction between kth species and jth treatment, εijklm and εiklm are the random residuals. The models assume that all effects are fixed.
Assumptions of normal distribution of residuals and variance homogeneity for each trait were tested by using the Shapiro- Wilk tests ([75]) with the GLM and UNIVARIATE procedures in SAS. Least-square means estimates were obtained for species and populations at each treatment and statistical significance (at P < 0.05) of differences between least-squares means was tested using a t-test. Pearson’s correlation between growth, tree condition and physiological parameters were calculated for each tree species, SAS CORR procedure was used.
To evaluate the stability of individual populations across treatments (including control) and the contribution of each of the populations to the population × treatment interaction variances, the Wricke ecovalence values ([99]) were calculated using variances and least-square means obtained within each treatment with SAS MIXED procedure and expressed as a percent of the total population × treatment interaction variance. The Shukla stability variances were computed and the statistical significance of the ecovalences was tested using the F-test developed by Shukla ([79]). In calculating ecovalences, to better fulfill the assumptions behind the linear model and thus to reduce scale effects of different treatments in joint analysis, the data were transformed to equal population variance. Phenotypic plasticity of each population was estimated as difference between maximum and minimum least-squares means obtained across treatments.
In order to evaluate multidimensional differences among populations and among species based on the complex of tree growth, health condition, physiological and biochemical traits, a Rotated Principal Factor Analysis was performed on all data across all treatments using the FACTOR procedure in SAS software (SAS® Analytics Pro 12.1, 9.3, [76]). SAS procedure SCORE was used to score population means based on output from FACTOR procedure. Its outputs were used to plot populations’ means in coordinates of main factors applying the SAS procedure PLOT.
Results
Treatment effect
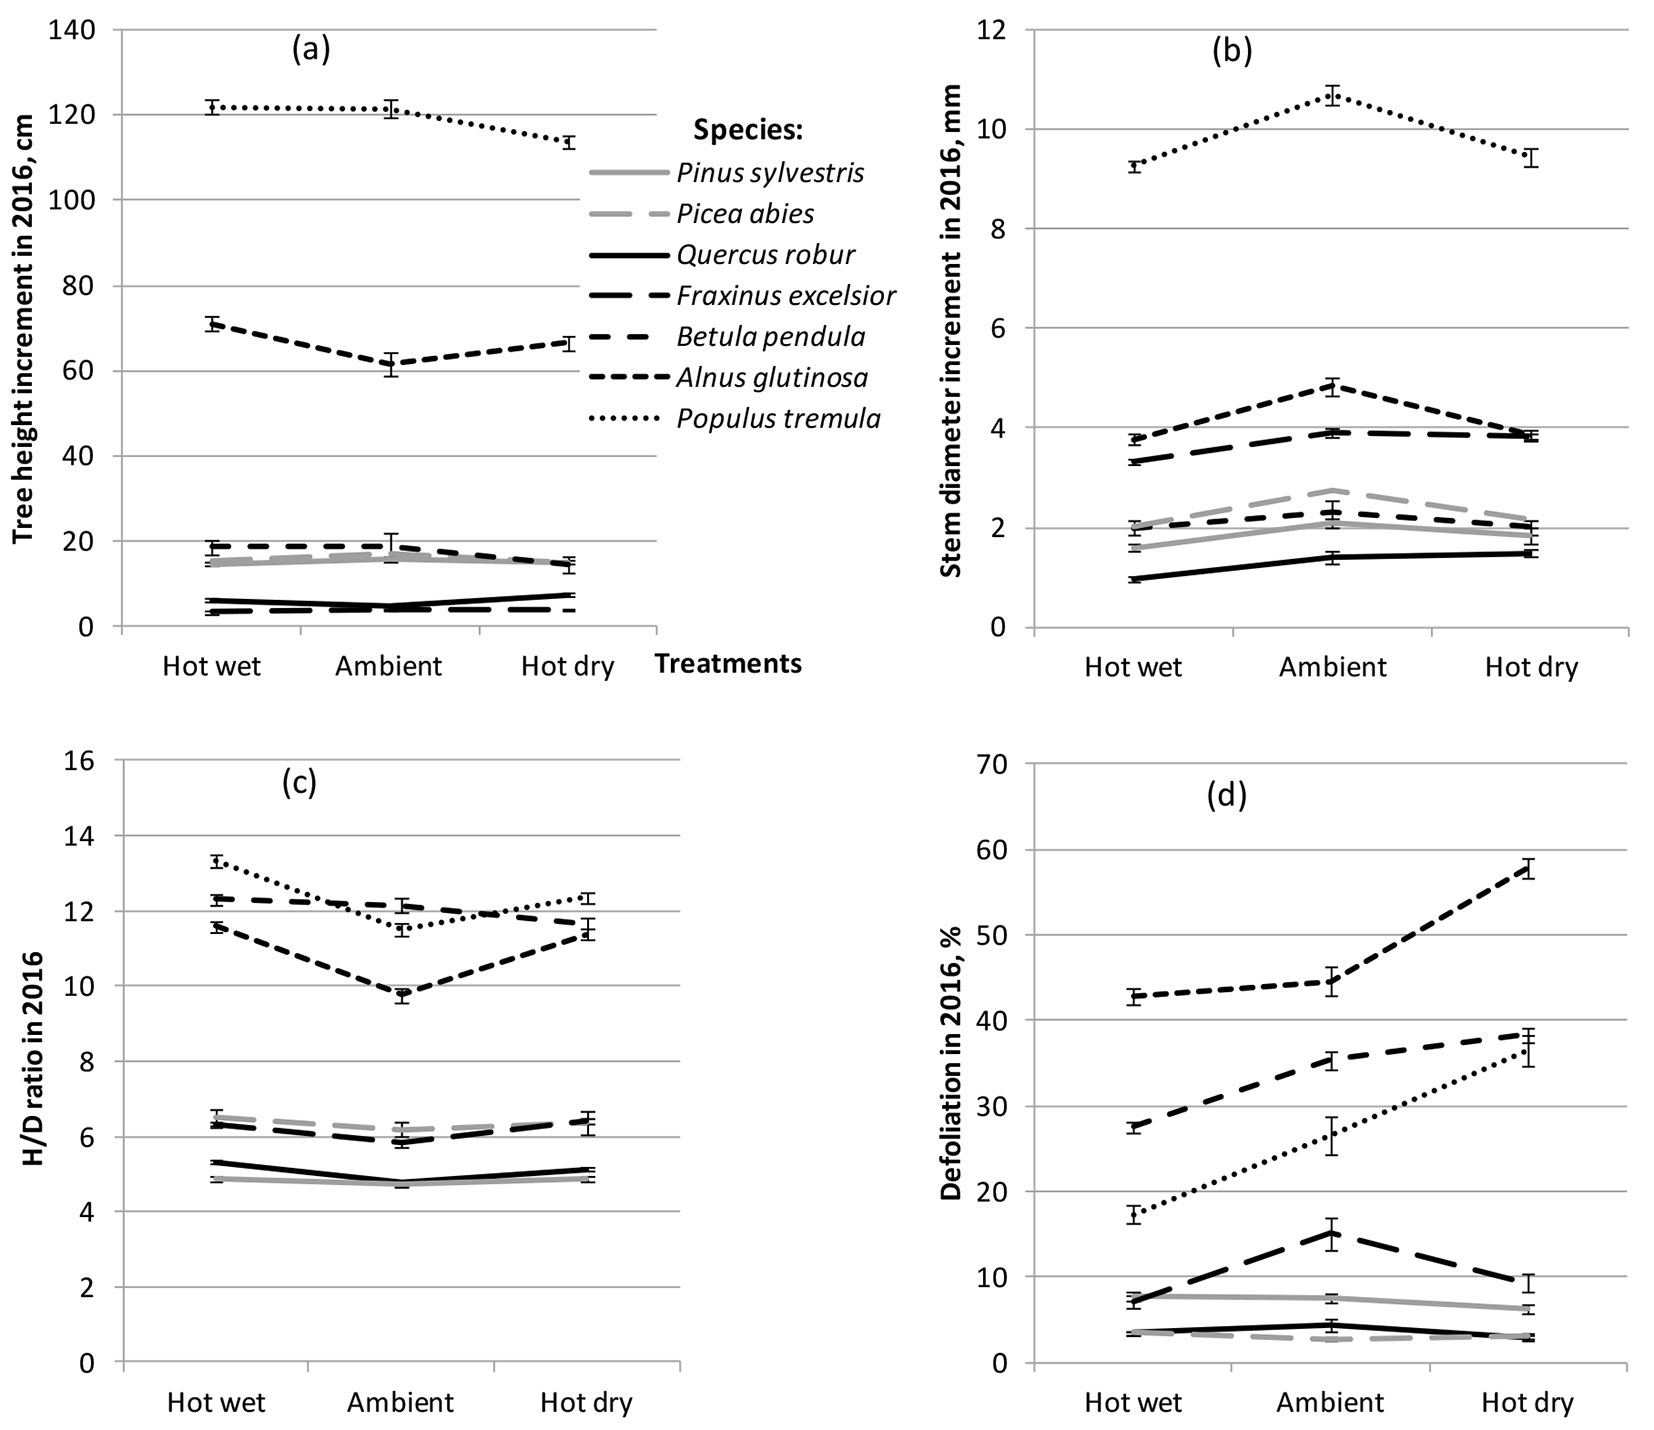
The results of multifactor analysis of variance using a statistical model (1) showed that the impact of treatment on sapling morphometric, physiological and biochemical traits was highly significant (P < 0.001) or significant (P < 0.01), except tree health condition, transpiration, photosynthetic rates and WUE (Tab. 2). Compared to control, stem diameter increment was lower in most tested tree species following both hot-wet and hot-dry treatments, while differences in height growth were less pronounced (Fig. 1). For most species this resulted in an increase of height to diameter ratio under both hot-wet and hot-dry conditions compared to control (Fig. 1c). In general, an increase in tree defoliation was observed in hot-dry conditions, and among the most severely defoliated were three pioneer tree species P. tremula, A. glutinosa and B. pendula (Fig. 1d). Meanwhile, defoliation rates were lower under the hot-wet treatment for most of the tested tree species.
Tab. 2 - Results from joint mixed linear model (eqn. 1) analysis of variance of different morphometric, health condition, physiological and biochemical traits in twenty one tested populations of seven forest tree species following hot-wet and hot-dry treatments and in ambient conditions (control): F-criteria and probabilities (P) of the fixed effects. For the definition of traits, see Materials and Methods. (ne): Not estimated.
| Trait | Treatment | Block | Species | Populations | Species × treatment | Population × treatment | ||||||
|---|---|---|---|---|---|---|---|---|---|---|---|---|
| F | P | F | P | F | P | F | P | F | P | F | P | |
| Height increment (ZH) | 8.8 | <0.001 | 0.3 | 0.559 | 3471.1 | <0.001 | 71.6 | <0.001 | 5.0 | <0.001 | 2.1 | 0.001 |
| Diameter increment (ZD) | 37.8 | <0.001 | 0.9 | 0.333 | 1891.4 | <0.001 | 11.5 | <0.001 | 3.9 | <0.001 | 2.1 | 0.001 |
| H/D ratio | 49.9 | <0.001 | 0.1 | 0.766 | 2249.2 | <0.001 | 18.4 | <0.001 | 11.2 | <0.001 | 1.8 | 0.005 |
| Defoliation | 108.6 | <0.001 | 43.5 | <0.001 | 1018.1 | <0.001 | 22.4 | <0.001 | 29.9 | <0.001 | 3.0 | <0.001 |
| Tree condition | 0.6 | 0.540 | 2.7 | 0.099 | 47.2 | <0.001 | 14.1 | <0.001 | 1.7 | 0.065 | 1.1 | 0.327 |
| Survival | 7.0 | 0.001 | 0.1 | 0.708 | 18.1 | <0.001 | 7.1 | <0.001 | 2.3 | 0.007 | 0.5 | 0.994 |
| Transpiration rate | 3.8 | 0.051 | ne | ne | 161.4 | <0.001 | 1.7 | 0.050 | 42.6 | <0.001 | 3.5 | <0.001 |
| Stomatal conductance | 15.3 | <0.001 | ne | ne | 103.0 | <0.001 | 1.7 | 0.058 | 14.0 | <0.001 | 3.4 | <0.001 |
| Photosynthetic rate | 1.4 | 0.232 | ne | ne | 92.0 | <0.001 | 4.6 | <0.001 | 10.7 | <0.001 | 3.8 | <0.001 |
| WUE | 0.6 | 0.440 | ne | ne | 8.5 | <0.001 | 2.0 | 0.014 | 8.7 | <0.001 | 2.1 | 0.001 |
| WUEi | 6.5 | 0.011 | ne | ne | 4.0 | 0.001 | 2.4 | 0.003 | 3.3 | <0.001 | 2.4 | <0.001 |
| Chlorophyll a | 3469.4 | <0.001 | ne | ne | 20794.3 | <0.001 | 846.9 | <0.001 | 445.8 | <0.001 | 292.7 | <0.001 |
| Chlorophyll b | 2528.9 | <0.001 | ne | ne | 6001.3 | <0.001 | 330.8 | <0.001 | 140.1 | <0.001 | 89.5 | <0.001 |
| Chlorophyll a/b ratio | 2251.8 | <0.001 | ne | ne | 441.2 | <0.001 | 109.0 | <0.001 | 41.3 | <0.001 | 29.4 | <0.001 |
| Carotenoids | 550.7 | <0.001 | ne | ne | 11439.4 | <0.001 | 459.4 | <0.001 | 132.7 | <0.001 | 141.4 | <0.001 |
| MDA | 1170.5 | <0.001 | ne | ne | 12166.8 | <0.001 | 279.3 | <0.001 | 693.7 | <0.001 | 228.5 | <0.001 |
| H2O2 | 7761.9 | <0.001 | ne | ne | 32792.7 | <0.001 | 1813.5 | <0.001 | 955.4 | <0.001 | 704.7 | <0.001 |
Fig. 1 - Performance of seven forest tree species following hot-wet, hot-dry and control (Ambient) treatments. (a) Tree height increment; (b) stem diameter increment; (c) tree height to stem diameter ratio (H/D); (d) tree defoliation.
Absence of significant treatment effect in variation of transpiration rate, photosynthetic rate and WUE (Tab. 2) may be explained by highly differing reaction of different tree species and populations to the treatments applied (Fig. 2a, Fig. 2b, Fig. 2c) which is indicated by highly significant species and species-by-treatment interaction effects (Tab. 2). For most tested species transpiration and photosynthetic rates were higher following hot-wet treatment than under the hot-dry treatment (Fig. 2a, Fig. 2b). Highly different reactions of the tested species were observed in the hot-wet treatment, while under the hot-dry treatment all species showed lower transpiration and photosynthetic rates as compared to control (Fig. 2a, Fig. 2b). For WUE, the reactions varied a lot among treatments and tree species (Fig. 2c). Compared to control, a clear reduction in chlorophyll a/b ratio was observed following both hot-wet and hot-dry treatments (Fig. 2d). Amounts of chlorophylls a and b as well as amount of carotenoids in leaves and needles in most tree species (except P. abies) under hot-wet conditions were greater than under ambient and hot-dry conditions (Fig. 2e-Fig. 2g).
Fig. 2 - Physiological and biochemical parameters of seven tree species following hot-wet, hot-dry and control (Ambient) treatments. (a) Transpiration rate; (b) photosynthetic rate; (c) instantaneous water use efficiency; (d) chlorophyll a/b ratio; (e) amount of chlorophyll a; (f) amount of chlorophyll b, (g) amount of carotenoids; (h) amount of MDA; and (i) amount of H2O2.
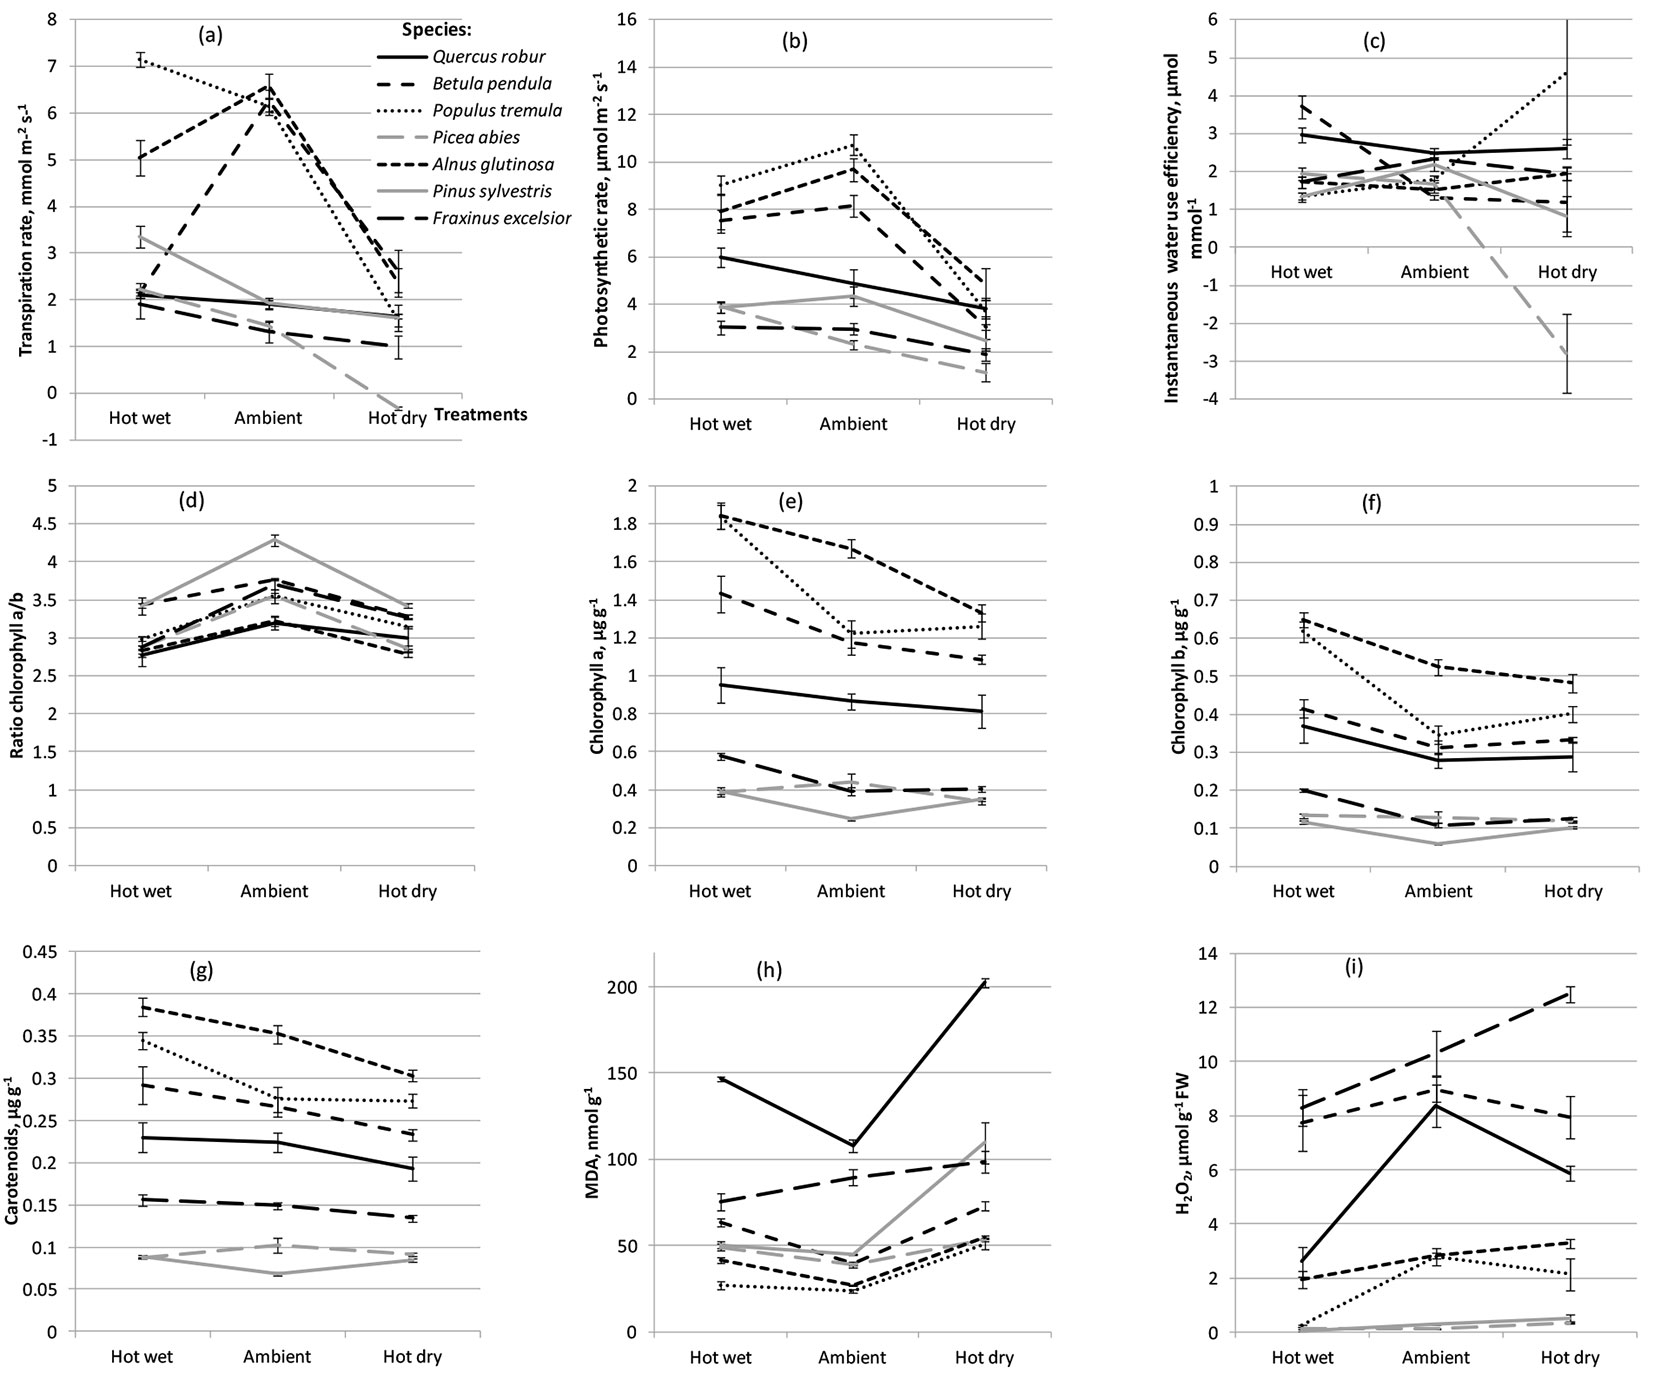
Compared to control, the amount of MDA was greater under both hot-wet and hot-dry treatments in all tree species except F. excelsior; for F. excelsior MDA production was higher under hot-dry but lower under hot-wet conditions (Fig. 2h). Amount of H2O2 was lower following hot-wet treatment (compared to control), while under hot-dry treatment it largely varied among different species. For example, Q. robur showed a clear reduction in production of H2O2 following both heat treatments, while both conifer species showed almost no reaction (Fig. 2i).
Species effect
ANOVA showed that species effect was highly significant (P < 0.001) for all the studied traits (Tab. 2). The largest height and diameter increments in all treatments were observed in fast growing deciduous tree species P. tremula and A. glutinosa (Fig. 1a, Fig. 1b). Height increment in these tree species varied from 113.6 ± 1.4 (mean ± standard deviation) to 122.0 ± 1.7 cm and from 66.5 ± 1.7 to 71.1 ± 1.8 cm, respectively. In noble hardwoods Q. robur and F. excelsior, height increment was much smaller and ranged between 4.6 ± 0.4 and 7.5 ± 0.5 cm in Q. robur and between 3.3 ± 0.3 and 3.9 ± 0.4 cm in F. excelsior (Fig. 1a). Largest height to diameter ratio was observed for both these species and also for B. pendula (Fig. 1c). Nevertheless, A. glutinosa, B. pendula and P. tremula showed the highest degree of defoliation among all treatments (Fig. 1d). Rather intense defoliation of these species was observed even at ambient (control) conditions, which most likely was a result of the limited light availability because of close plant spacing.
Transpiration and photosynthetic rates were also the highest in P. tremula, B. pendula and A. glutinosa, although for all three species these parameters were much more affected by water deficit than for other investigated tree species (Fig. 2a, Fig. 2b).
The smallest, though significant, differences among the tested tree species were observed in chlorophyll a/b ratio (Fig. 2d). Compared to control, very large differences among species were found in the amount of chlorophyll a, while for chlorophyll b the differences were smaller (Fig. 2e, Fig. 2f). As regards species ranking, very similar pattern in the content of all pigments (chlorophylls a and b and carotenoids) were observed. For example, in A. glutinosa and P. tremula amounts of pigment were always the highest, while in P. sylvestris always the lowest, regardless the treatment. The highest amount of MDA was found in both noble hardwoods, Q. robur and F. excelsior, thus indicating the highest levels of lipid peroxidation as a response to oxidative stress, while the smallest MDA amount was in A. glutinosa and P. tremula (Fig. 2h). The highest amount of H2O2 was found in F. excelsior and B. pendula followed by Q. robur, while the lowest amount was observed in both conifer species P. sylvestris and P. abies, regardless the treatment (Fig. 2i).
Species-by-treatment interaction
The species-by-treatment interaction was found to be significant (P < 0.05) for all studied traits except tree condition (Tab. 2). This interaction is manifested by differing patterns of reaction and species rank changes across treatments (Fig. 1, Fig. 2). The most variable species’ performances across treatments were observed for transpiration rate, concentration of chlorophyll a, and amount of MDA and H2O2 (Tab. 2, Fig. 2a, Fig. 2e, Fig. 2h, Fig. 2i). Under the hot-dry treatment, most species showed slightly reduced height and stem diameter increments (compared to control); however, some species such as Q. robur for both height and stem diameter increment and A. glutinosa for height increment, showed opposite reactions (Fig. 1a, Fig. 1b). All tested tree species except Q. robur showed somehow lower stem diameter increment in both stressful environments as compared to ambient conditions (Fig. 1b). P. tremula and B. pendula displayed the lowest level of drought tolerance, i.e., for these species a noticeable reduction in height growth following hot-dry treatment was observed (Fig. 1a). Compared to control, height/diameter ratio was clearly higher in P. tremula and A. glutinosa under both heat treatments, while in other tree species the treatment effect was rather small (Fig. 1c). Q. robur, however, showed the highest diameter increment following hot-dry treatment (Fig. 1b). In the present study, most severe negative effect of drought was manifested by the dramatic loss of foliage in fast growing tree species P. tremula, A. glutinosa and B. pendula (Fig. 1d). Meanwhile, for F. excelsior, Q. robur and conifers the defoliation rate was at the same level or even lower compared to control (Fig. 1d).
Transpiration, stomatal conductance and photosynthetic rates in fast growing deciduous species P. tremula, B. pendula and A. glutinosa were much more affected by water deficit than in other investigated tree species (Fig. 2a, Fig. 2b). These three species showed the highest transpiration rate in ambient conditions and, compared to control, have substantially reduced this rate under hot-dry treatment, while following hot-wet treatment the reduction in transpiration was observed only for A. glutinosa and B. pendula. In addition to P. tremula, noble hardwoods Q. robur and F. excelsior as well as coniferous species P. sylvestris and P. abies showed the highest transpiration rates in hot-wet treatment compared to both ambient and hot-dry conditions (Fig. 2a). All investigated tree species except Q. robur has decreased CO2 stomatal conductance following hot-dry treatment, while following hot-wet treatment it increased in all tree species except A. glutinosa and P. tremula (data not shown). All species showed a decrease in photosynthetic rate under the hot-dry treatment, with sharpest reduction in P. tremula, A. glutinosa and B. pendula (Fig. 2b). All species except Q. robur and P. abies showed lower (compared to control) photosynthetic rate in hot-wet treatment (Fig. 2b). As regards WUE, differences among the tested tree species were not large in ambient conditions, although after the hot-dry treatment large differences in response among species were observed: P. tremula, A. glutinosa and Q. robur showed an increase, while P. abies, P. sylvestris and B. pendula showed a clear decrease compared to both control and hot-wet treatments (Fig. 2c). For most species (except P. abies), higher pigment concentrations were observed following hot-wet treatment compared to both ambient and hot dry conditions (Fig. 2e-Fig. 2g).
Amounts of MDA and H2O2 showed significant fluctuations across treatments for different tree species (Fig. 2h, Fig. 2i). Compared to control, the amount of MDA under hot-dry conditions was higher for all tested tree species, and under hot-wet conditions the reactions of most tested tree species were similar: only F. excelsior showed lower MDA amount compared to ambient conditions (Fig. 2h). For Q. robur, the amount of MDA was significantly higher and the amount of H2O2 was significantly lower (compared to control) following both heat treatments. For P. sylvestris, a clear (statistically significant) increase in MDA amount (compared to control) was observed following hot-dry treatment, while under hot-wet treatment the increase was negligible. Four tree species (A. glutinosa, F. excelsior, P. sylvestris and P. abies) under hot dry conditions showed higher H2O2 levels than under both ambient and hot wet conditions (Fig. 2i). Q. robur, B. pendula and B. tremula showed the highest amount of H2O2 in ambient conditions compared to both hot-wet and hot-dry treatments (Fig. 2i).
Population effect
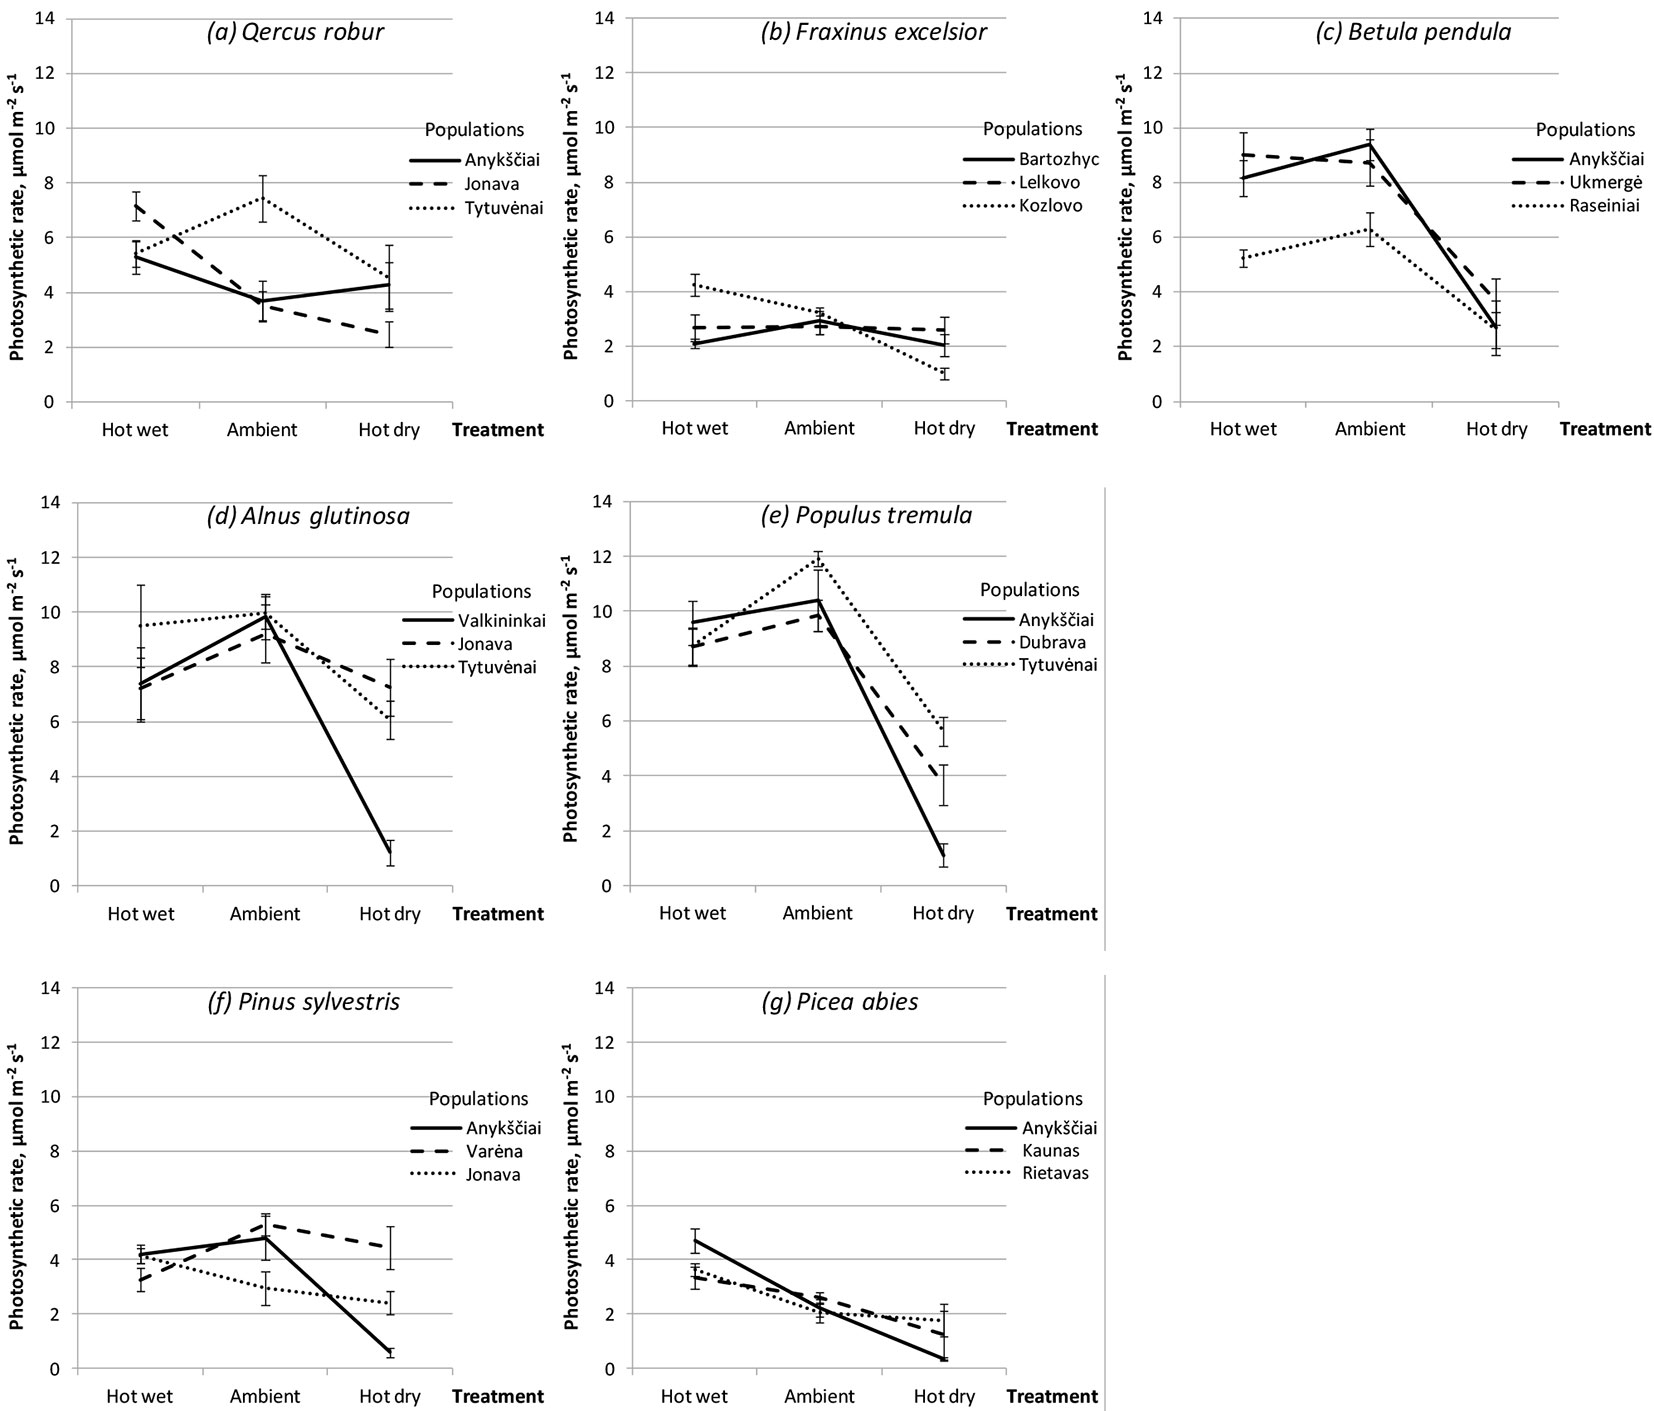
ANOVA showed that population effect (within tree species) was highly significant (P < 0.001) for most traits except for stomatal conductance, transpiration rate, WUE and WUEi, where significance of the population effect was lower (Tab. 2). Within tree species, significant inter-population differences were observed following each of the three treatments: in height increment for B. pendula and A. glutinosa (Fig. 3), in defoliation rate for B. pendula and P. tremula (Fig. 4), while for photosynthetic rate the magnitude of these differences varied a lot among populations depending on treatment (Fig. 5). Very high inter-population genetic variation (CVp) in height increment following all treatments was found for B. pendula and F. excelsior, reaching up to 166.2 and 59.5%, respectively (Tab. 3). High variation was also found for these two species also in diameter increment, reaching up to 51.2 and 39.2%, respectively. Inter-population variation in defoliation rate ranged from low to medium for most tree species, although following hot dry treatment the variation was rather substantial for F. excelsior, P. sylvestris and P. abies, reaching up to 63.9, 46.2 and 41.6%, respectively (Tab. 3).
Fig. 3 - Mean tree height increment of populations of seven forest tree species following hot-wet (grey bars), hot-dry (white bars) and control (Ambient - black bars) treatments. Error bars represent the standard error.
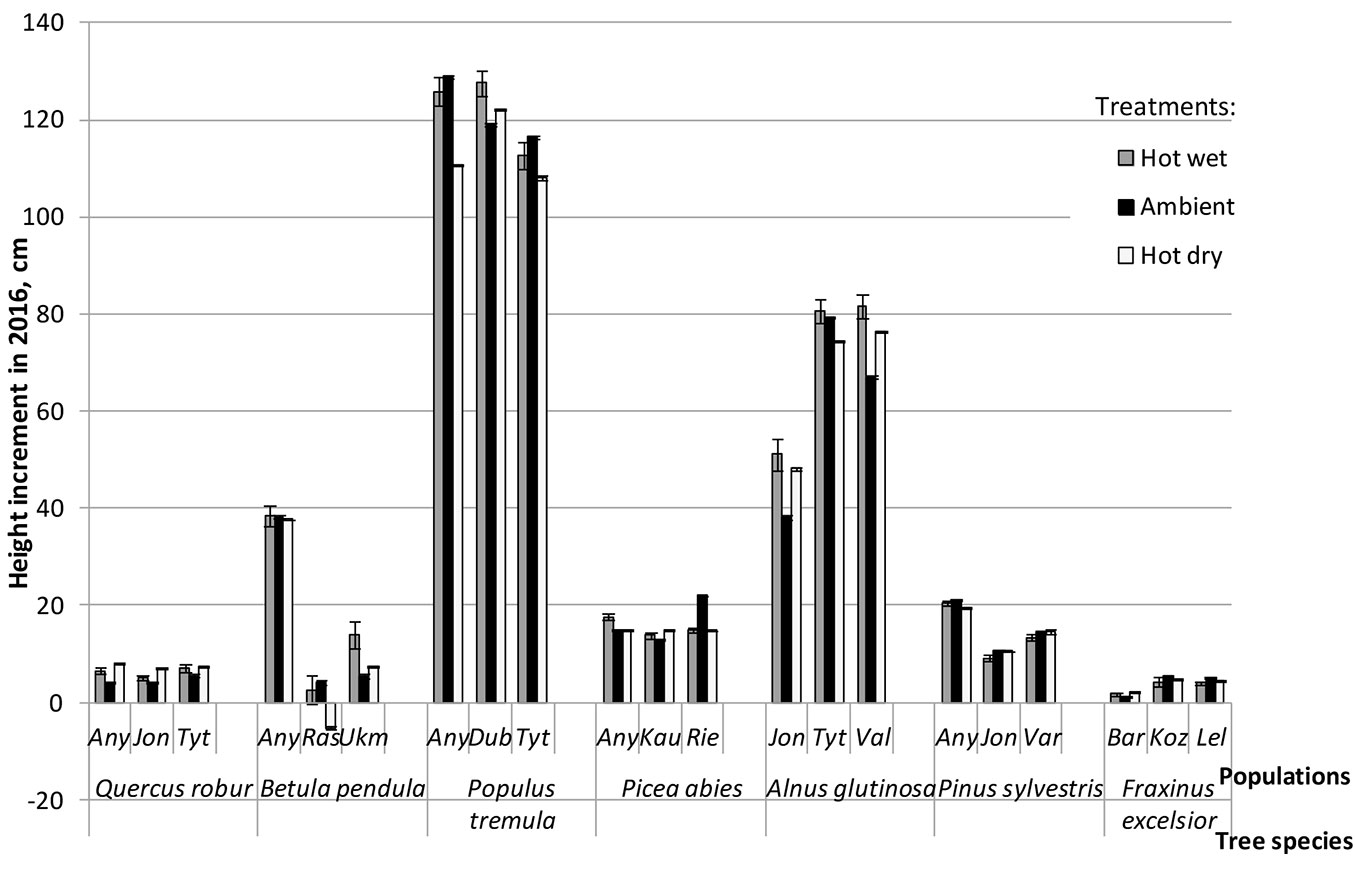
Fig. 4 - Mean defoliation of populations of seven forest tree species following hot-wet (grey bars), hot-dry (white bars) and control (Ambient - black bars) treatments. Error bars represent the standard error.

Fig. 5 - Performance of different populations of seven forest tree species following hot-wet, hot-dry and control (Ambient) treatments.
Tab. 3 - Inter-population genetic variation (CVp, %) of morphometric, health condition, physiological and biochemical traits of seven tree species following hot-wet (HW) and hot-dry (HD) treatments and in ambient conditions (control, Amb). For the definition of traits, see Materials and Methods.
| Species | Treatment | Height increment |
Diameter increment |
Defoliation | Tree condition |
Survival | Height/diameter ratio |
Transpiration rate |
Stomal conductance rate |
Photosynthetic rate |
WUE | Chlorophyll a/b ratio |
Amount | ||||
|---|---|---|---|---|---|---|---|---|---|---|---|---|---|---|---|---|---|
| Chlorophyll a | Chlorophyll b | Carotenoids | MDA | H2O2 | |||||||||||||
| Pinus sylvestris | HW | 39.9 | 10.9 | 30.0 | 7.0 | 7.3 | 8.1 | 12.4 | 19.4 | 13.4 | 7.0 | 15.0 | 19.1 | 20.2 | 10.6 | 18.6 | 149.2 |
| Amb | 34.0 | 11.1 | 20.5 | 3.0 | 3.5 | 3.0 | 16.6 | 12.9 | 28.6 | 14.2 | 6.9 | 13.9 | 18.7 | 16.3 | 5.1 | 35.9 | |
| HD | 30.3 | 27.3 | 46.2 | 6.3 | 6.6 | 6.3 | 51.4 | 58.7 | 77.1 | 174.2 | 3.2 | 11.5 | 14.2 | 8.8 | 50.2 | 119.9 | |
| Picea abies | HW | 12.8 | 22.6 | 16.8 | 0.5 | 0.9 | 4.3 | 13.5 | 39.0 | 18.2 | 19.6 | 5.4 | 22.9 | 17.3 | 3.2 | 19.6 | 133.4 |
| Amb | 28.4 | 8.0 | 7.3 | 0.6 | 0.0 | 5.3 | 20.5 | 37.0 | 12.5 | 20.0 | 11.6 | 44.7 | 54.3 | 39.4 | 20.6 | 20.5 | |
| HD | 0.4 | 23.8 | 41.6 | 1.3 | 1.4 | 4.1 | 37.0 | 96.2 | 63.8 | 81.4 | 7.4 | 18.9 | 13.2 | 9.7 | 10.1 | 28.1 | |
| Quercus robur | HW | 16.8 | 23.0 | 9.5 | 2.7 | 1.2 | 18.3 | 20.3 | 16.6 | 17.4 | 20.9 | 21.8 | 45.2 | 54.1 | 33.7 | 4.6 | 93.4 |
| Amb | 15.9 | 36.4 | 28.7 | 1.3 | 0.0 | 18.3 | 26.2 | 44.2 | 45.5 | 15.3 | 11.6 | 21.9 | 33.4 | 21.7 | 15.5 | 42.7 | |
| HD | 5.7 | 14.0 | 15.3 | 0.4 | 1.1 | 15.5 | 4.9 | 3.3 | 30.0 | 34.6 | 22.5 | 48.7 | 59.4 | 33.0 | 6.1 | 21.3 | |
| Fraxinus excelsior | HW | 42.6 | 15.7 | 11.2 | 8.4 | 2.4 | 3.7 | 32.5 | 37.8 | 36.8 | 13.0 | 5.0 | 13.4 | 9.5 | 20.5 | 28.2 | 36.9 |
| Amb | 59.5 | 39.2 | 10.4 | 2.5 | 0.0 | 9.9 | 9.9 | 6.9 | 8.6 | 16.3 | 8.1 | 22.5 | 26.4 | 11.7 | 23.7 | 37.0 | |
| HD | 37.8 | 34.8 | 63.9 | 5.7 | 0.7 | 1.6 | 18.4 | 35.8 | 43.0 | 13.8 | 3.6 | 17.6 | 21.0 | 13.8 | 29.2 | 11.0 | |
| Betula pendula | HW | 99.8 | 41.6 | 22.0 | 8.5 | 4.7 | 10.0 | 9.9 | 10.6 | 26.4 | 34.5 | 4.4 | 30.7 | 26.6 | 34.2 | 15.8 | 60.3 |
| Amb | 121.2 | 29.2 | 22.6 | 5.5 | 4.8 | 4.2 | 16.8 | 19.0 | 20.0 | 13.8 | 1.4 | 24.8 | 25.8 | 19.1 | 10.7 | 23.8 | |
| HD | 166.2 | 51.2 | 29.6 | 10.7 | 6.5 | 7.5 | 17.4 | 19.4 | 19.2 | 154.5 | 2.9 | 9.6 | 9.0 | 14.4 | 16.3 | 45.5 | |
| Alnus glutinosa | HW | 24.4 | 12.6 | 5.8 | 2.2 | 0.0 | 3.6 | 14.7 | 8.7 | 15.8 | 8.4 | 5.0 | 17.6 | 13.2 | 13.1 | 19.0 | 77.1 |
| Amb | 34.3 | 6.7 | 11.1 | 5.5 | 1.2 | 1.6 | 10.5 | 19.3 | 4.1 | 8.4 | 1.8 | 12.8 | 14.6 | 12.9 | 3.8 | 17.3 | |
| HD | 23.7 | 13.7 | 7.8 | 4.7 | 2.3 | 3.6 | 53.6 | 74.3 | 65.7 | 31.2 | 6.1 | 16.2 | 22.6 | 10.3 | 2.5 | 24.9 | |
| Populus tremula | HW | 6.7 | 4.7 | 18.4 | 0.6 | 0.0 | 1.6 | 12.5 | 9.3 | 5.6 | 19.0 | 4.8 | 15.8 | 20.0 | 13.0 | 34.9 | 92.0 |
| Amb | 5.4 | 7.9 | 30.4 | 1.1 | 0.0 | 3.1 | 12.3 | 4.9 | 9.9 | 18.9 | 4.5 | 27.2 | 32.3 | 24.4 | 17.7 | 50.8 | |
| HD | 6.5 | 2.1 | 21.4 | 0.8 | 0.0 | 4.1 | 60.7 | 99.0 | 65.0 | 83.6 | 1.2 | 23.8 | 23.2 | 13.5 | 29.2 | 124.3 | |
Inter-population genetic variation in transpiration, stomatal conduction and photosynthetic rates varied a lot depending on treatment (Tab. 3). Clearly the highest inter-population variation in these traits was observed for P. sylvestris, P. abies, A. glutinosa and P. tremula under the hot-dry treatment, for F. excelsior in the hot-wet treatment (in transpiration and stomatal conduction rates only), and for Q. robur at ambient conditions (Tab. 3). In the most stressful hot-dry treatment, inter-population genetic variation in WUE was significantly larger compared to both hot-wet treatment and control for all tree species except F. excelsior (Tab. 3). Extremely large inter-population variation in WUE was found for P. sylvestris, B. pendula, P. tremula and P. abies. The highest inter-population variation in amount of chlorophylls a and b and their ratio was observed for Q. robur and A. glutinosa following hot-dry treatment, for P. sylvestris and B. pendula - following hot-wet treatment, and for P. abies, F. excelsior and P. tremula at ambient conditions. Similar variation patterns among the tested tree species were observed in the concentration of carotenoids (Tab. 3).
As regards the amount of MDA, the highest inter-population variation was observed for P. sylvestris, F. excelsior and B. pendula under the hot-dry treatment, for A. glutinosa and P. tremula following hot-wet treatment, and for P. abies and Q. robur in ambient conditions (Tab. 3). Very high variation in the amount of H2O2 was found for P. sylvestris and P. tremula following the hot-dry treatment, meanwhile in the hot-wet treatment the variation was very high for P. sylvestris, P. abies, Q. robur and P. tremula. In ambient conditions (control), the variation in the amount of H2O2 was the lowest across treatments for most of the tested species (Tab. 3).
Population-by-treatment interaction
Significant (P < 0.05) population-by-treatment interaction (hereafter referred to as Gp × E interaction) was found for most morphometric, health condition, physiological and biochemical traits except tree condition and survival rates (Tab. 2).
In general, the contribution of individual populations to the Gp × E interaction in height growth was not high, and only four out of 21 studied populations showed high plasticity and have contributed significantly to the interaction with ecovalences ranging between 11.1 and 21.4% (Tab. 4). This interaction was due to both reduction and increase of height increment in most sensitive/reactive populations of B. pendula, P. tremula and A. glutinosa across treatments (Fig. 3, Tab. 4). These species also showed the largest variation in defoliation rates among the three investigated populations across all treatments compared to other tested species (Fig. 4). Largest rank changes among populations in defoliation following different treatments were observed for P. tremula and A. glutinosa (Fig. 4). Defoliation rate in three populations of B. pendula was very different, the Anykščiai population had highest defoliation rate in all treatments, however no rank changes were observed following different treatments (Fig. 4).
Tab. 4 - Phenotypic plasticity and ecovalence in height increment over treatments of different populations of seven tree species following hot-wet (HW), hot-dry (HD) and control (Amb) treatments. For the definition of variables, see Materials and Methods.
| Species | Population | Mean deviation estimate |
Estimates of deviation from treatment means |
Phenotypic plasticity |
Wricke ecovalence |
Shukla variance |
F | P | ||
|---|---|---|---|---|---|---|---|---|---|---|
| HW | Amb | HD | ||||||||
| Pinus sylvestris | Anykščiai | -14 | -14.6 | -13.1 | -14.2 | 1.4 | 0.2 | -0.1 | -0.01 | . |
| Jonava | -24.2 | -25.5 | -23.5 | -23.6 | 2 | 0.5 | 0.8 | 0.08 | 0.921 | |
| Varena | -20.2 | -21.4 | -19.7 | -19.4 | 2.1 | 0.5 | 0.7 | 0.08 | 0.928 | |
| Picea abies | Anykščiai | -18.6 | -17.3 | -19.5 | -19 | 2.3 | 0.6 | 0.9 | 0.14 | 0.868 |
| Kaunas | -20.4 | -21 | -21.3 | -19 | 2.3 | 0.6 | 1.1 | 0.14 | 0.872 | |
| Rietavas | -17.1 | -19.8 | -12.4 | -19.1 | 7.4 | 6.7 | 17.7 | 2.73 | 0.065 | |
| Quercus robur | Anykščiai | -28.1 | -28.1 | -30.1 | -26.2 | 3.8 | 1.5 | 3.4 | 0.39 | 0.677 |
| Jonava | -28.9 | -29.5 | -30.1 | -27.1 | 3 | 1 | 2.1 | 0.24 | 0.783 | |
| Tytuvenai | -27.7 | -27.6 | -28.8 | -26.8 | 2 | 0.4 | 0.5 | 0.06 | 0.944 | |
| Fraxinus excelsior | Bartoszyc | -32.7 | -32.8 | -33 | -32.2 | 0.8 | 0.1 | -0.5 | -0.05 | . |
| Kozlowo | -29.6 | -30.3 | -28.9 | -29.5 | 1.4 | 0.2 | -0.1 | -0.01 | . | |
| Lelkowo | -29.8 | -30.5 | -29.2 | -29.8 | 1.3 | 0.2 | -0.2 | -0.02 | . | |
| Betula pendula | Anykščiai | 3.8 | 3 | 3.8 | 4.7 | 1.7 | 0.3 | 0.1 | 0.02 | 0.981 |
| Raseiniai | -34 | -31.8 | -30.1 | -39.9 | 9.8 | 11.1 | 29.8 | 3.37 | 0.034 | |
| Ukmerge | -25.5 | -20.9 | -28.9 | -26.8 | 8 | 6.9 | 18.3 | 2.33 | 0.098 | |
| Alnus glutinosa | Jonava | 11.5 | 15.2 | 3.7 | 15.5 | 11.9 | 18.3 | 49.6 | 5.68 | 0.003 |
| Tytuvenai | 43.7 | 43.9 | 44.5 | 42.8 | 1.6 | 0.3 | 0.1 | 0.01 | 0.986 | |
| Valkininkai | 40.7 | 44.9 | 32.3 | 44.9 | 12.7 | 21.4 | 58.1 | 6.77 | 0.001 | |
| Populus tremula | Anykščiai | 87.4 | 87.7 | 93.8 | 80.6 | 13.3 | 17.7 | 48 | 5.6 | 0.004 |
| Dubrava | 88.6 | 89.4 | 84 | 92.5 | 8.5 | 7.4 | 19.8 | 2.32 | 0.099 | |
| Tytuvenai | 78.1 | 74.9 | 81.4 | 77.9 | 6.5 | 4.3 | 11 | 1.29 | 0.277 | |
The most significant Gp × E interaction was found for concentrations of chlorophylls a and b and carotenoids, and for the amounts of MDA and H2O2 (Tab. 2). All populations of all investigated tree species showed different response to treatments in photosynthetic rate (Fig. 5). For example, in ambient conditions Q. robur from the Tytuvenai population showed a photosynthetic rate higher by 51% as compared to that recorded for the other two populations (Fig. 5a). Compared to control, the photosynthetic rate of oak from Tytuvenai population was by 40% lower in the hot-wet and by 30% lower in the hot-dry treatments. Saplings from Anykščiai and Jonava populations showed the highest photosynthetic rates following hot-wet treatment Under the hot-dry treatment, the photosynthetic rate of Jonava population has decreased by 30%, while in Anykščiai population it increased by 16% and reached the same rate as the Tytuvenai population (Fig. 5a).
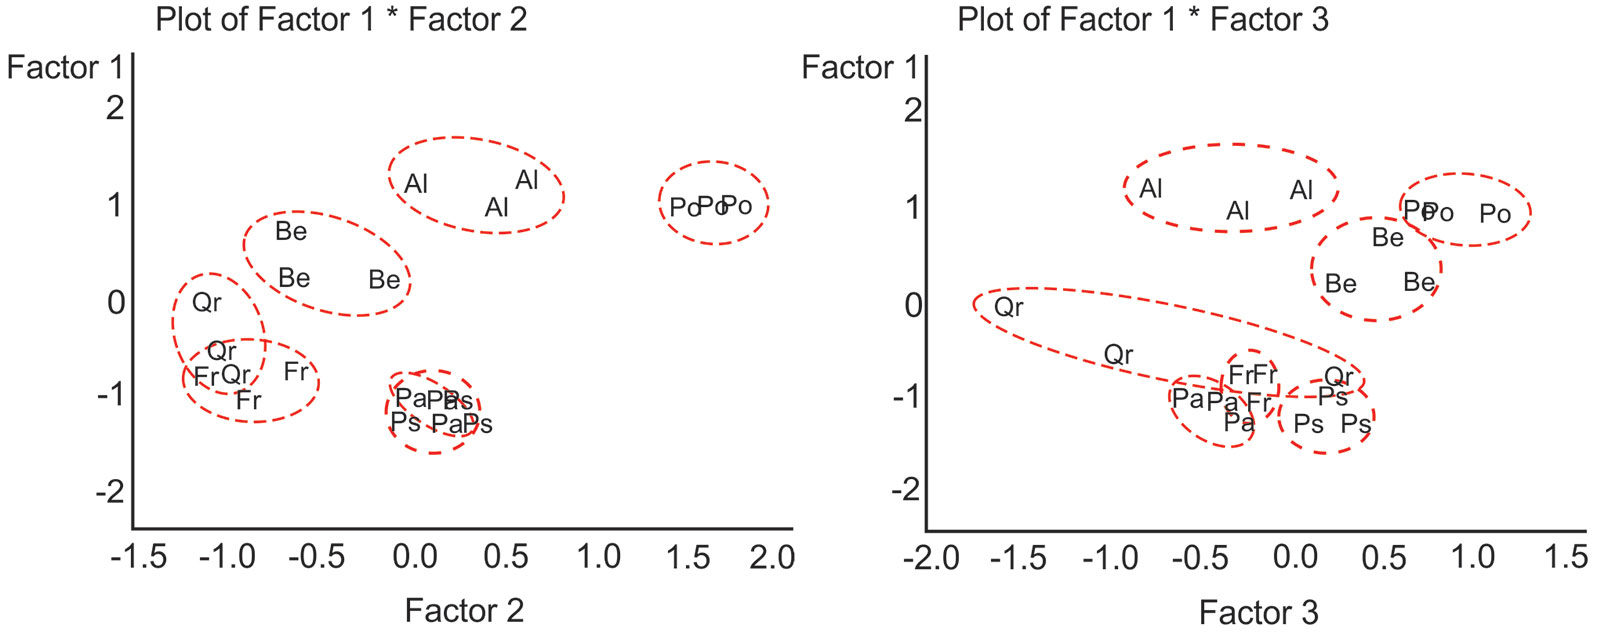
Principal Factor Analysis of the multiple characteristics of species and populations across treatments has revealed three main factors (Tab. 5). The factor structure indicates that Factor 1 with the highest positive semipartial coefficients of correlation accounted for the variation in concentration of carotenoids, chlorophylls a and b, H/D ratio, defoliation, transpiration and photosynthetic rates (Tab. 5). Factor 2 showed a strong positive correlation with tree height and diameter increments, while negatively correlated with the amounts of MDA and H2O2. Factor 3 strongly positively correlated with chlorophyll a/b ratio, photosynthetic rate and amount of H2O2. Fig. 6 shows that populations of three deciduous tree species P. tremula, A. glutinosa and B. pendula were clearly separated from each other and from the rest of the species studied. These three species had the highest values of Factor 1. Populations of P. tremula had the highest values of all three factors. Populations of P. abies and P. sylvestris had the lowest values of Factor 1 and overlapped in coordinates of Factors 1 and 2 with a small separation in Factor 3. Populations of Q. robur and F. excelsior had the lowest values of Factors 1 and 2 and partially overlapped (Fig. 6).
Tab. 5 - Results of Principal Factor Analysis of a complex of morphometric, health condition, physiological and biochemical traits in seven investigated tree species and their populations: factor structure - semipartial correlations. (a): For trait definitions see Materials and Methods. The strongest correlations are indicated (b).
| Trait (a) | Semipartial Correlations | ||
|---|---|---|---|
| Factor1 | Factor2 | Factor3 | |
| Height increment | 0.308 | 0.538 b | 0.050 |
| Diameter increment | 0.191 | 0.521 b | 0.123 |
| Height/diameter ratio | 0.602 b | 0.150 | 0.091 |
| Defoliation | 0.588 b | -0.023 | -0.084 |
| Health condition | -0.118 | 0.180 | -0.023 |
| Transpiration rate | 0.483 b | 0.074 | 0.290 |
| Photosynthetic rate | 0.482 b | 0.015 | 0.427 b |
| Carotenoids | 0.916 b | -0.167 | -0.062 |
| MDA | -0.121 | -0.469 b | -0.009 |
| H2O2 | 0.158 | -0.618 b | 0.346 b |
| Chlorophyll b | 0.879 b | -0.049 | -0.109 |
| Chlorophyll a | 0.845 b | -0.001 | -0.260 |
| Chlorophyll a/b ratio | -0.211 | -0.124 | 0.648 b |
Fig. 6 - Results of Principal Factor Analysis: distribution of species and populations in coordinates of three principal factors generated from a complex of tree morphometric, health condition, physiological and biochemical traits. Letters indicate populations of different tree species: (Qr): Quercus robur; (Be): Betula pendula; (Po): Populus tremula; (Al): Alnus glutinosa; (Pa): Picea abies; (Ps): Pinus sylvestris; (Fr): Fraxinus excelsior.
Discussion
In this study significant inter-species effects and species-by-treatment interaction for almost all tree morphometric, health condition, physiological and biochemical traits show that tree responses to the applied treatments are species-specific. The investigated tree species showed different sensitivity to stressful conditions, exhibiting different physiological reactions and growth performance which can be considered as specific acclimation strategies to cope with stress. This suggests that effects of different treatments should not be generalized and have to be analyzed for each species separately. At the same time, tree reaction to treatments is expressed differently in different tree traits as they do not have the same acclimative/adaptive value. Tree height increment is regarded to be the most important trait in competition for light at juvenile age. The present study showed that elevated temperatures neither at wet nor at simulated drought conditions had significant positive effect on sapling height increment, except A. glutinosa, and Q. robur (Fig. 1a). Stress-induced differences (as compared to control) were more pronounced in stem diameter increment (mostly having a negative effect, in particular for A. glutinosa and P. tremula) than in height increment. This suggests that increment losses in stem diameter due to drought are compensated via internal relocation of biomass to height growth to sustain the competitive ability of trees affected by stress. The unequal treatment effect observed in this study is in agreement with earlier findings by Matyssek et al. ([57]), who showed that the reduction of increment under stress condition is more pronounced for diameter than for height. The increase of height to diameter ratio under both hot-wet and hot-dry conditions compared to control might also be related to stress-induced acceleration of growth as reaction to lower light intensity in phytotron than in ambient conditions.
Limited water availability during vegetation season can cause premature tree leaf shedding and lead to growth reduction. Tree species that had the highest transpiration rate in ambient conditions (A. glutinosa, B. pendula and P. tremula) demonstrated a specific combined strategy to cope with drought: in the hot-dry treatment they have closed stomata to reduce stomatal conductance and transpiration, which has negatively affected photosynthesis rate, and also have shed a portion of leaves. Interestingly, B. pendula and A. glutinosa, compared to control showed lower transpiration rate also in the hot-wet treatment, while P. tremula showed the opposite reaction (Fig. 2a). It should be noted that in control treatment, F. excelsior showed the highest defoliation among all treatments most likely because of damages by an ash dieback pathogen Hymenoscyphus fraxineus (T. Kowalski) Baral, Queloz & Hosoya, whose infection rate was higher outdoors than in the phytotron.
Larger WUE values observed in P. tremula, Q. robur and A. glutinosa under the hot-dry treatment (as compared to control) gives an indication that these species are more efficient responders to heat and drought stress as they are able to maintain a balance between photosynthesis and transpiration. Our observations are consistent with the results of previous studies on reactions of various plant species tested under hot and dry growth conditions ([31], [33], [98], [58]). It has been demonstrated that drought causes a significant increase, while high temperature causes a significant decrease, in the intrinsic water use efficiency (WUEi, A/gs) for several forest tree species, e.g., Populus spp. ([105], [102], [60]), Quercus ilex L. ([31]) and B. pendula ([41]). The increase in WUEi is mainly due to a decrease in the stomatal conductance caused by drought ([104]), while the decrease in WUE results from an increase in the transpiration rate due to high temperature ([41]). Significantly lower WUE values (compared to control) found during the present study for P. abies, P. sylvestris and B. pendula in the hot-dry treatment are in agreement with the results obtained in studies on poplars, almonds and Mediterranean shrubs, where a clear decrease of instantaneous WUE under water deficit has been demonstrated ([42], [55], [53]). Interestingly, in the present study a poplar species P. tremula showed the opposite reaction: higher WUE values were found following hot-dry treatment. It has been demonstrated that even closely related poplar species react to drought differently ([65], [84], [88]). Pattern of WUE changes might be related to environments of species’ or populations’ origin. For example, studies on Castanea sativa Mill. populations from contrasting xeric and mesic habitats showed that drought-adapted Mediterranean ecotype exhibited lower WUE values than the eastern wet-adapted one ([49], [51]).
Our study confirmed the results obtained by Griffin et al. ([32]) who showed that elevated temperature (up to 40 °C) increased the carbon fixation in two ecotypes of redbud (Cercis canadensis L.), and that watered plants had significantly greater carbon fixation rates than plants grown under water deficit stress. In our study, photosynthetic rate and pigment concentrations were in most cases much greater in hot-wet than in hot-dry treatment, indicating that water deficit inhibits photosynthetic processes and reduces positive effect of the temperature increase. Similarly, reduction of net photosynthesis rate caused by drought was found in numerous studies ([52], [73], [102], [56]). Stomata closure and photoinhibitory damage are considered as the major factors responsible for the depression of assimilation rate ([62]). Xu et al. ([100]) demonstrated that drought treatment of Populus cathayana Rehd. juveniles (cuttings) had significant negative effect on their growth and net photosynthesis rate, and increased WUEi and malondialdehyde (MDA) content. In contrast, elevated temperatures and good water supply significantly accelerated P. cathayana growth and net photosynthesis rate, but decreased WUEi, and MDA content.
Stomatal limitations largely account for a reduction of CO2 assimilation under mild to moderate drought stress, whereas non-stomatal limitations may become dominant under severe drought ([86], [28], [27], [56]). Although in field studies trees of genus Quercus often display high photosynthetic capacity and stomatal conductance, the stomatal control of gas exchange in response to water availability is more common than in other co-occurring tree species ([6], [63]). In our study, Q. robur has increased CO2 stomatal conductance following hot-dry treatment (while in all other tree species it decreased) and this may helped to avoid such severe loss of photosynthetic rate observed in other tree species. It has been shown that stomatal control of gas exchange may act as an important physiological mechanism influencing distribution of Quercus rubra L., Q. pirinus L. and Acer rubrum L. ([89]). In a study by Ni & Pallardy ([63]), more xeric species showed higher photosynthetic rate and increased leaf water vapor conductance under both well-watered and water-deficient conditions. However, a trend towards increased WUE in more xeric species has not been observed either in the above-mentioned ([63]) nor in our study for P. sylvestris.
Results of the present study suggest that the production of most important plant pigments is enhanced under hot and wet conditions, while arid conditions have a more negative impact on pigment production. This, however, does not hold true for all tested species. For example, for P. sylvestris both treatments had positive effect (compared to control) on production of all the analysed pigments, while for P. abies the effect was always negative or neutral. Decline in carotenoid concentration following drought stress and high CO2 concentrations was observed by Schwanz & Polle ([77]) in Q. robur and Pinus pinaster Ait. Higher H2O2 levels (compared to control) recorded following drought stress in A. glutinosa, F. excelsior, P. sylvestris and P. abies suggest that these four tree species at young age are sensitive to water deficit. The greater increase of MDA concentration following the hot-dry treatment also indicates that oxidative damage is taking place in membranes of all tested tree species. Maintenance of membrane stability is critical for plant survival under environmental stress ([94]). In the present study, combined stressful conditions, drought and heat, caused significantly stronger oxidative stress in tree leaves compared to that recorded in the hot-wet treatment. These results are consistent with the findings of similar studies on responses of olive trees ([81], [4]) and cowpea ([83]). H2O2 plays dual role in plants; as a signaling molecule it is involved in the regulation of various environmental stresses at optimal level between 0.1 and 5 µmol g-1 FW, while high concentrations are capable to induce cellular damage ([91], [12]). In the present study, F. excelsior, B. pendula and Q. robur had much higher H2O2 levels than optimal, thus indicating tree response to stress and causing cell oxidative damage, which is partially responsible for plant growth inhibition.
It is argued that certain external stressors may reduce plant tolerance to secondary stressors, i.e., when internal reserves of an organism are being depleted for coping with the primary stressors it gets more vulnerable ([67], [20]). On the other hand, if plant adaptive mechanisms are built to cope with different kinds of stress, such a plant, being adapted to one stressor, may be more tolerant to another one ([15], [47], [71]). The observed significant treatment effects indicate generally high phenotypic plasticity of all tree species tested in the present study. Our results suggest that in a short term trees (at least at juvenile age) are able to respond to stressors, although plastic response and possibilities for acclimation and adaptation of different tree species may vary considerably. Large phenotypic plasticity in adaptive traits may be useful under changing conditions in a short-time perspective, but may be detrimental in a long term since it may not allow natural selection to act in full power ([24]).
The highly-significant population effect found in our study for most traits - except stomatal conductance, transpiration rate, WUE and WUEi - shows that populations of certain species differ in their adaptive response. The absence or presence of a weak population effect in these four traits may be explained by differing reaction of different populations to treatments, which is indicated by a highly significant population-by-treatment interaction effect. Very high inter-population genetic variation in height and diameter increments found for B. pendula and F. excelsior shows that populations of these species are the most different among all populations tested, which can be due to existing adaptations to specific site conditions in the place of their origin. Jensen & Hansen ([39]) also found a significant population effect in tree height, stem diameter, shoot and root biomass in their study of 22 Q. robur populations from Central and Northern Europe in a greenhouse irrigation experiment.
Survival of plant populations and even of separate species will depend on abilities to acclimate and to adapt to relatively rapidly changing environmental conditions both physiologically and genetically. Genetic adaptability is determined by genetic variation of adaptive traits within and among populations, by ecogenetic plasticity, genotype by environment interaction, inter- and intra-population structure, population size and other factors ([23], [24]). Tree species differ from each other by a complex of biological and ecological traits such as successional stage in the ecosystem, character of self- and cross-pollination and seed dispersal, tree social status, distribution patterns in the natural range, size and structure of populations, particularities of post-glacial migration, etc. ([34]). All these traits affect genetic variation also at intra-population levels, which in turn determines the possibility of natural selection and adaptation. Large distribution ranges of most deciduous tree species and high diversity of environmental conditions within these ranges precondition the climatic and edaphic differentiation of populations in the course of species’ evolution. Wide distribution range in connection with occurrence of small isolated populations of a certain species determines large intra-specific genetic variation ([96]). Widely distributed social tree species are characterized by high inter-population variability, whereas their intra-population variability is smaller. Species-specific combinations of bioecological traits affect species’ genetic inter-population diversity in different directions. Logically, such tree species as P. sylvestris, P. abies, B. pendula and P. tremula should be characterized by high inter-population variability, while Q. robur and F. excelsior by lower variability. No such trend, however, was observed in the present study, the inter-population variability varied a lot among species depending on treatments and traits studied (Tab. 3).
Results of Principal Factor Analysis (PFA) on the complex of studied traits allowed to discriminate and/or to group tree species and populations according to their ecological reaction across treatments. Clear separation of three deciduous species P. tremula, A. glutinosa and B. pendula from each other and from the rest of the tested species in plots of principal factors of PFA indicates largely different ecological behavior of those three species. In Europe, A. glutinosa is considered an asocial tree species with scattered distribution. In Lithuania, this species has a wide distribution and demonstrates a social character by forming forest stands. Our study confirms these ecological features of A. glutinosa; indeed, in the factor diagram populations of this species are located closer to P. tremula than to Q. robur and F. excelsior. Populations of P. abies and P. sylvestris may be considered as exhibiting a generally similar reaction to treatments, as suggested by their partial overlap in PFA plots (Factor 1 × Factor 2 - Fig. 6). Populations of Q. robur and F. excelsior formed a distinct group (Fig. 6), thus confirming their similar ecological behavior.
Significant population-by-treatment interaction found in the present study for most morphometric, health condition (except tree condition and survival), physiological and biochemical traits shows different response and plasticity of tree populations to the applied treatments and indicates a presence of specific site-related or climate-related adaptations. The absence of interaction between tree conditions and survival may be explained by a delay in the occurrence of visible tree damages and/or mortality, when treatment impact on morphometric, photosynthesis rate and other physiological and biochemical traits was already evident and scorable. Responses of the tested populations varied depending on different combinations of temperature and water regimes. Skre ([80]) investigated the response of progenies from geographically distant populations of B. pendula and B. pubescens under different temperature (and photoperiod) treatments in climatic chambers. Some of the investigated populations showed good growth at extreme temperatures, while other populations at moderate temperatures; differences among populations in net assimilation rate were found to be smaller at lower temperatures ([80]), which is in agreement with our findings. In a study of 22 Q. robur populations from Central and Northern Europe in a greenhouse irrigation experiment, population × watering interaction effect was significant and more pronounced than population effect for stem diameter, similarly pronounced for tree height and number of lamma shoots, and less pronounced for shoot biomass and shoot/root ratio, while no interaction was found for root biomass and growth cessation ([39]). In Turkey, two physiological types of Castanea sativa Mill. populations, drought-adapted and wet-adapted, were identified ([50], [93]). WUE has been found to be a reliable indicator of complex adaptive mechanisms that differentiate wet- and drought-adapted populations ([49], [50], [51]). At juvenile stage, a slower increment of above-ground biomass was found for drought-adapted Mediterranean C. sativa genotypes compared to eastern wet-adapted genotypes, while at maturity growth patterns have changed in the opposite way ([92], [48]).
In our previous study ([72]), a significant genotype by environment (G × E) interaction for tree survival was found in F. excelsior juveniles tested under simulated summer drought and spring frost conditions, indicating that condition of different genotypes unequally depends on environmental conditions. Ecophysiological studies highlighted different mechanisms of response to water stress depending on site conditions at the origin location ([48], [49], [51]). Lauteri et al. ([50]) reported a higher capacity of photosynthesis and transpiration in C. sativa seedlings from populations from arid sites than in those from mesic sites. Studies of genetic variation in these traits in material from the whole distribution range of C. sativa indicated inter- and intra-population genetic variation in drought tolerance ([68], [51]). High phenotypic plasticity, which is an outcome of poor performance of certain genotypes, can aid natural selection by eliminating the least adaptive genotypes or populations thus enhancing general population/species adaptedness. This somehow contradicts a conclusion by Ghalambor et al. ([30]), who claimed that only plasticity that enhances fitness can facilitate adaptive evolution of a species. Genetically depleted populations are less likely to cope with environmental stress under changing environmental conditions and may be more prone to inbreeding depression, with loss of productive performance ([22]).
Deciduous forest-forming tree species have immigrated to the current territory of Lithuania after the last glacial period (6-9 thous. years ago) from refugee populations in Balkans, Apennines and other areas of southern Europe ([16]). The offspring from these southern populations had too short time to adapt to rapidly changing environmental conditions in north-temperate regions because of long tree ontogenesis and prolonged period of generational change. Adaptation of forest trees has also been encumbered by frequent shifts and fluctuations of climatic and local environmental conditions during tree ontogenesis and through the ages, by high phenogenetic plasticity of trees and other factors. It can be speculated that ancient Lithuanian populations of deciduous forest-forming tree species have conserved part of their former environment-specific adaptation to southern drought-prone refugia, as well as the plasticity and specific reactions to environmental fluctuations; however, their current adaptive significance is unclear. If growth, morphological and physiological reactions of species and populations observed in the present study are not acclimative/adaptive, the negative consequences of this may get expressed in the next future via reduced growth, declining health conditions and decreasing survival rate. Therefore, further studies on how the induced physiological responses will be carried over into the following years and how they will affect growth and development of the treated trees are needed.
Conclusions
Our results showed a great response variability (as expressed by different morphometric, health condition, physiological and biochemical traits) among tested tree species and their populations exposed to climate change-related stressors at juvenile age. Under the hot-dry treatment, most deciduous species showed smaller height and diameter increment, lower transpiration and photosynthetic rates and higher defoliation rates compared to ambient conditions, meanwhile different reactions of different tree species, both negative and positive (compared to control), were observed under the hot-wet treatment. However, for conifers and Q. robur, the effect of treatment on these traits was negligible. Photosynthetic and transpiration rates were the highest in the fast-growing species P. tremula, B. pendula and A. glutinosa, however these rates were much more negatively affected by water deficit than in other tree species. These three species demonstrated a specific combined acclimation strategy to cope with drought stress, including stomata closure to reduce stomal conductance and transpiration rate, and (partial) leaf shedding.
Lower photosynthetic rate observed under hot-wet treatment in all tested species (except Q. robur and P. abies) indicates that heat waves can negatively affect the physiology of certain tree species, even at good availability of water. Moreover, the large amount of MDA observed for most species under the hot-dry treatment suggest a stronger oxidative stress compared to hot-wet and ambient conditions. Production of chlorophylls a and b and carotenoids is likely positively affected by elevated temperatures and water availability, while hot-dry conditions are likely to cause some negative effect on pigment production, though quite a few exceptions were observed.
Significant population effect and population-by-treatment interaction for most traits indicate different plasticity and response of each population to stressful conditions. However, only a small fraction of populations showed high plasticity/ecovalence and significantly contributed to the population-by-treatment interaction. Specific reactions of such populations may be related to a presence of specific site- or climate-related pre-adaptations.
Some of the observed responses of species and populations to hot-dry treatment resulted in lower performances and a decrease in tree growth, and theferore cannot be considered as adaptive acclimation. Different physiological responses of populations/species at juvenile stages could unbalance the competition among species, particularly following heat waves and drought. This may compromise forest regeneration, cause atypical species successions and reduce the sustainability of future forest ecosystems. Specific short- term reactions/acclimation performances observed in this study represent a solid incentive for further investigations on the adaptive potential of forest trees.
Acknowledgements
The study was carried out under the National Research Program project SIT-4/2015 ’MISKOEKOKAITA’ that was funded by the Research Council of Lithuania. We are grateful to staff of the phytotron for technical assistance in running the experiments and performing measurements. We are grateful to anonymous reviewers for their constructive comments and advices.
References
CrossRef | Gscholar
Gscholar
CrossRef | Gscholar
Gscholar
Gscholar
Gscholar
Gscholar
Gscholar
Gscholar
Gscholar
Gscholar
Gscholar
Gscholar
Gscholar
Gscholar
Gscholar
CrossRef | Gscholar
Gscholar
Gscholar
Gscholar
Gscholar
Gscholar
Gscholar
Gscholar
Gscholar
Gscholar
Gscholar
Gscholar
Gscholar
Gscholar
Authors’ Info
Authors’ Affiliation
Vytautas Suchockas
Gintare Bajerkevičiene
Rita Verbylaite
Institute of Forestry, Lithuanian Research Centre for Agriculture and Forestry, Liepu str. 1, LT-53101 Girionys, Kaunas reg. (Lithuania)
Vytautas Suchockas
Aleksandras Stulginskis University, Studentu str. 13, LT-53361 Akademija - Kaunas (Lithuania)
Vaidotas Lygis
Institute of Botany of Nature Research Centre, Akademijos str. 2, LT-08412 Vilnius (Lithuania)
Lithuanian University of Educational Sciences, Studentu str. 39, LT-08106, Vilnius (Lithuania)
Kaunas Forestry and Environmental Engineering University of Applied Sciences, Liepu str. 1, LT-53101 Girionys, Kaunas reg. (Lithuania)
Corresponding author
Paper Info
Citation
Pliura A, Jankauskiene J, Lygis V, Suchockas V, Bajerkevičiene G, Verbylaite R (2018). Response of juvenile progeny of seven forest tree species and their populations to simulated climate change-related stressors, heat, elevated humidity and drought. iForest 11: 374-388. - doi: 10.3832/ifor2340-011
Academic Editor
Marco Borghetti
Paper history
Received: Dec 30, 2016
Accepted: Apr 09, 2018
First online: May 15, 2018
Publication Date: Jun 30, 2018
Publication Time: 1.20 months
Copyright Information
© SISEF - The Italian Society of Silviculture and Forest Ecology 2018
Open Access
This article is distributed under the terms of the Creative Commons Attribution-Non Commercial 4.0 International (https://creativecommons.org/licenses/by-nc/4.0/), which permits unrestricted use, distribution, and reproduction in any medium, provided you give appropriate credit to the original author(s) and the source, provide a link to the Creative Commons license, and indicate if changes were made.

Web Metrics
Breakdown by View Type
Article Usage
Total Article Views: 53392
(from publication date up to now)
Breakdown by View Type
HTML Page Views: 43327
Abstract Page Views: 4223
PDF Downloads: 4653
Citation/Reference Downloads: 19
XML Downloads: 1170
Web Metrics
Days since publication: 2994
Overall contacts: 53392
Avg. contacts per week: 124.83
Article Citations
Article citations are based on data periodically collected from the Clarivate Web of Science web site
(last update: Mar 2025)
Total number of cites (since 2018): 11
Average cites per year: 1.38
Publication Metrics
by Dimensions ©
Articles citing this article
List of the papers citing this article based on CrossRef Cited-by.
Related Contents
iForest Similar Articles
Research Articles
Tracing the acclimation of European beech (Fagus sylvatica L.) populations to climatic stress by analyzing the antioxidant system
vol. 14, pp. 95-103 (online: 01 March 2021)
Research Articles
Effect of drought stress on some growth, morphological, physiological, and biochemical parameters of two different populations of Quercus brantii
vol. 11, pp. 212-220 (online: 01 March 2018)
Research Articles
Nutrient uptake, allocation and biochemical changes in two Chinese fir cuttings under heterogeneous phosphorus supply
vol. 11, pp. 411-417 (online: 05 June 2018)
Research Articles
Photosynthesis of three evergreen broad-leaved tree species, Castanopsis sieboldii, Quercus glauca, and Q. myrsinaefolia, under elevated ozone
vol. 11, pp. 360-366 (online: 04 May 2018)
Research Articles
Developing stand transpiration model relating canopy conductance to stand sapwood area in a Korean pine plantation
vol. 14, pp. 186-194 (online: 14 April 2021)
Research Articles
Leaf transpiration of drought tolerant plant can be captured by hyperspectral reflectance using PLSR analysis
vol. 9, pp. 30-37 (online: 05 October 2015)
Research Articles
Gas exchange, biomass allocation and water-use efficiency in response to elevated CO2 and drought in andiroba (Carapa surinamensis, Meliaceae)
vol. 12, pp. 61-68 (online: 24 January 2019)
Research Articles
Oak sprouts grow better than seedlings under drought stress
vol. 9, pp. 529-535 (online: 17 March 2016)
Research Articles
Evergreen species response to Mediterranean climate stress factors
vol. 9, pp. 946-953 (online: 07 July 2016)
Research Articles
Model-based assessment of ecological adaptations of three forest tree species growing in Italy and impact on carbon and water balance at national scale under current and future climate scenarios
vol. 5, pp. 235-246 (online: 24 October 2012)
iForest Database Search
Google Scholar Search
Citing Articles
Search By Author
Search By Keywords
PubMed Search
Search By Author
Search By Keyword


