
Gas exchange, biomass allocation and water-use efficiency in response to elevated CO2 and drought in andiroba (Carapa surinamensis, Meliaceae)
iForest - Biogeosciences and Forestry, Volume 12, Issue 1, Pages 61-68 (2019)
doi: https://doi.org/10.3832/ifor2813-011
Published: Jan 24, 2019 - Copyright © 2019 SISEF
Research Articles
Abstract
Prolonged droughts are predicted for some parts of the Amazon; however, it is still unclear how Amazonian trees will respond to water stress under the ongoing increase in CO2 concentration. The aim of this study was to assess the effect of elevated CO2 (eCO2) and drought on photosynthetic rates, water-use efficiency, and biomass allocation in andiroba (Carapa surinamensis). The plants were grown in pots at ambient (400 ppm CO2) and eCO2 (700 ppm) at two water regimes, soil at 50% field capacity, FC (drought) and soil at 100% FC for 163 days. We measured light saturated photosynthesis on a mass basis (Asat-mass), stomatal conductance to CO2 on a mass basis (gsCO2-mass), whole-plant water-use efficiency (WUEP), biomass accumulation, specific leaf area (SLA) and total leaf area. At eCO2, Asat-mass increased 28% in well-watered plants and 93% under drought, whereas gsCO2-mass declined 39% in well-watered plants at eCO2, with no effect of drought on gsCO2-mass at eCO2. The total biomass gain improved 73% at eCO2 and over CO2 levels it was reduced (54%) by drought. WUEP improved (188%) at eCO2 in well-watered plants and 262% under drought. SLA declined 23% at eCO2, but the effect of drought on SLA was null. On the contrary, total leaf area was greatly reduced (67%) by drought, but it was not affected by eCO2. The large increase in total biomass and the substantial improvement in WUEP under eCO2, and the sharp decline in leaf area under water stress widen our knowledge on the physiology of this important species for the forest management of large areas in the Amazon region.
Keywords
Carboxylation Efficiency, Nonstructural Carbohydrates, Specific Leaf Area, Shoot-root Ratio, Tree Growth
Introduction
The tropical rainforest of the Amazon basin covers about 5.1 × 10⁶ km2 (out of 6.915 × 10⁶ km2 of the total basin area, which extends across several countries) and stores about 86 Pg of carbon in above and below ground biomass ([38], [21]), i.e., 21.8% of total carbon (393.4 Pg) stored in above and below ground biomass of land vegetation ([35]). The Amazon rainforest is also important for recycling through transpiration about 50% of total precipitation of the Amazon region ([39]) and for its outstanding biodiversity. It has been anticipated that atmospheric CO2 concentration can reach 800 ppm by the end of the 21st century ([4]) and that changes in rainfall distributions can lead to an increase in frequency and severity of droughts, particularly in Eastern Amazon ([15]). Although a mild dry season has little effect on growth rates of Amazonian trees in the central Amazon ([14], [9]), it has been observed a decline in the amount of carbon stored in above ground biomass per unit land area and an increase in tree mortality under severe drought ([21]).
The most common response observed in free-air CO2-enrichment is an increase in photosynthetic rates ([2], [43]) and in several vascular plants there is also an improvement in net primary productivity ([34]), but the effect of long-term exposure to elevated CO2 concentration (eCO2) on tropical trees still remains to be elucidated. Stomatal conductance (gs) often declines at eCO2 ([2]), which contributes to improve water-use efficiency (WUE) and biomass gain of plants under CO2-enrichment ([29], [30]). Plant WUE (WUEP), the ratio between total biomass gain and total evaporation of water from the plant ([27]) is a parameter often used to assess plant response to water stress. At the leaf level WUE describes the ratio between net photosynthetic rate (A) and leaf transpiration (E), and both photosynthesis and transpiration are often closely related to stomatal conductance ([32], [27]). Besides gs, other factors such as biomass allocation to plant organs, whole-plant respiration and variation in boundary layer conductance affect WUEP, and hence it is not uncommon to find discrepancy between WUEP and A/E trends ([27]).
In the Brazilian Legal Amazon (5,016,136 km2 - [21]) large areas has been deforested over the past decades and hence there are extensive areas available for rehabilitation. It has been estimated that about 120,000 km2 could be restored or reforested by 2030 ([6]). Several species, including andiroba (Carapa, a genus that includes 11 species in the Neotropics - [24]) have been tested to evaluate their performance in reforestation projects or forestry systems ([7], [41]). Andiroba is a promising species because it produces wood of good quality and a multipurpose oil (carapa oil) can be extracted from their seeds ([24]). This is particularly important in (agro)forestry systems, as non-timber forest products can generate additional income while the tree is not large enough for timber harvesting ([26]). In the Neotropics, the Carapa tree (andiroba in Brazil) occurs in lowland forests from Central America and the Caribbean to South America ([24]). At sapling stage it can grow about 1-2 cm yr-1 in diameter and 1-1.5 m yr-1 in height ([16], [8]). Canopy trees of this species can reach up to 2.0 m in diameter and 60 m in height ([20]). Carapa is more tolerant to Hypsipyla grandella than mahogany - Swietenia macrophylla ([41]), thus it can be used in plantations to replace the highly prized mahogany, which highlights the importance of andiroba in forest management project. The aim of this study was to assess the effect of eCO2 and drought on photosynthesis, water-use efficiency, and biomass gain in saplings of Carapa surinamensis. In this experiment we hypothesized that subjecting the plants to eCO2 increases biomass gain and photosynthetic rates, and decreases stomatal conductance, which leads to an increase in water-use efficiency.
Materials and methods
Experimental setup and plant material
The experiment was conducted at the National Institute for Research in the Amazon - INPA (03° 05′ 29″ S, 59° 59′ 35″ W), Manaus, Brazil under greenhouse and growth chamber conditions. Seeds of andiroba (Carapa surinamensis Miq, Meliaceae) were germinated in vermiculite and 15 days after emergence, the seedlings were transplanted to large pots (20 cm diameter and 26 cm deep, about 8 L capacity) containing 7 kg of substrate, a mixture of soil forest of the first 20 cm, amended with mulched material and 5 g kg-1 (soil) of 10-10-10 (NPK) fertilizer. We used large pots to avoid root restriction during the experimental period. Once the plants had reached 60 cm in height (about six months after emergence) the saplings were randomly sorted into four treatments: two CO2 levels, ambient CO2 (400 ppm) and eCO2 (700 ppm) and two water regimes, soil kept at 50% field capacity - FC (hereafter referred to as the drought condition) and 100% FC. The experiment was run for 163 days, from July 14 to December 23, 2015.
Before initiating the experiment and for 30 days, we measured the light intensity (photosynthetically active radiation - PAR) inside the greenhouse, which turned out to be a mean of about 200 µmol m-2 s-1 over a 12-h period. Furthermore, because of the latitudinal location (-3.091°), incoming irradiance remains rather constant over the year. Then we set up the growth chamber to emulate the mean light intensity in the greenhouse over a 12-h photoperiod.
Plants subjected to the ambient CO2 treatment were kept under greenhouse conditions, whereas those subjected to eCO2 were kept in a growth chamber (TPC-19®, Biochambers Inc., Winnipeg, Canada; working area of 1.72 m2 and 1.52 m height). In the growth chamber CO2 was kept constant (700 ppm); we used a 12-h photoperiod with PAR of 200 μmol m-2 s-1, the light was turned off at night; day/night temperature and relative humidity were 27/25 °C and 80-90%, respectively. We also monitored the light and temperature conditions inside the greenhouse with specific sensors (Li-190 SA®, Li-Cor, Lincoln, USA and Humitter 50Y®, Vaisala, Oyj, Finland) connected to a datalogger (Li-1400®, Li-Cor, Lincoln, USA), which was set to record data at 15-min intervals. On randomly selected days we monitored the CO2 concentration in the greenhouse with an infrared gas analyzer (LI-6400®, Lincoln, USA) with empty chamber.
The water volume the soil could hold was recorded and used to calculate soil water content (SWC) at 50% and 100% FC. At these water contents, soil moisture percentages, measured with a probe (MPM160B®, ICT International, Armidale, Australia), were 21% (v/v, soil at 50% FC) and 31% (v/v, soil at 100% FC). For further information we also measured the predawn leaf water potential of the plants with a Sholander pressure chamber (1505D®, PMS Instrument Company, Albany, USA). Once a week and during the experimental period the plants in the greenhouse and growth chamber were randomly moved to avoid position effects. At the end of the experimental period we measured gas exchange (data were collected just once), and determined dry matter (DM) of stems (WS), roots (WR) and leaves (WL), total plant DM (WT), shoot/ root ratio (SRR), leaf area (AL), specific leaf area (SLA, leaf area to leaf mass ratio), consumptive use of water (CUW - total amount of water consumed by a plant), whole-plant water-use efficiency (WUEp), and leaf total nonstructural carbohydrates (TNC).
Gas exchange parameters
At the end of the experimental period, gas exchange parameters were measured with a portable gas exchange system (LI-6400XT®, Li-Cor, Lincoln, USA). The measurements were carried out between 08:00 and 14:00 in two fully expanded leaves per plant, after a stabilization period of about 10 min at ambient and eCO2 and the light intensity used for measurements. We measured stomatal conductance to CO2 (gsCO2), light saturated photosynthesis (Asat), Ci/Ca (intercellular CO2 to ambient CO2 ratio), carboxylation efficiency (CE, the initial slope of the A/Ci regression line - [17]), leaf respiration in the light (RL), and dark respiration (RD). Asat and gsCO2 were measured at 1000 μmol m-2 s-1, ambient temperature (27 °C), relative humidity of 70 ± 5%, and CO2 concentration of 400 ppm (ambient CO2 treatment) and 700 ppm (eCO2 treatment). We also determined light and CO2-saturated photosynthesis (Amax) at a [CO2] of 2000 ppm (Ca), as previously described ([31]). To obtain Asat-mass, Amax-mass, CEmass and gsCO2-mass, photosynthetic rates, CE and gsCO2 per unit area were converted to a mass basis by multiplying them by SLA. For CE, we used the conventional unit (i.e., µbar CO2 instead of µmol CO2); thus CEmass was expressed in mmol g-1 s-1 bar-1. RL was determined at low light intensity (10-75 μmol m-2 s-1) as the intercept of the A/PAR regression line, whereas RD was determined as the absolute value of A in the dark (PAR = 0) and at the same ambient conditions as those used for measuring Asat-mass; both RL and RD were expressed on a mass basis (i.e., RL-mass and RD-mass).
Biomass allocation
At the end of the experimental period (163 days = t163), we determined the dry matter of leaves, stems and roots by oven-drying the plant material at 72 °C to constant mass. We also determined the specific leaf area (SLA). Leaf area (AL) was measured with an area meter (LI-3000®, Li-Cor, Lincoln, USA). At the beginning (t0) and at the end of the experiment (t163), we measured plant height, H (from ground level to the apical bud). We also measured plant diameter (D) at 6.0 cm from the ground with digital calipers.
The biomass gain (ΔB) of plant organs (ΔWL, ΔWS and ΔWR) and leaf area gain (ΔAL) during the experimental period was calculated as the difference between the biomass of plant organs recorded at the end of the experimental period (i.e., at t = 163 by harvesting the plants) and that estimated at the beginning of the experiment (initial biomass at t0). To estimate the biomass at t0, additional plants (n = 30 plants) were produced and harvested to generate allometric equations and estimate: (i) the total biomass, WT (g) = 10.157·exp 0.1692D (r2 = 0.95), where D (in mm) denotes the plant diameter at 6.0 cm from the base of the plant; (ii) the stem biomass, WS (g) = 2.4298·exp 0.1909D (r2= 0.94); and (iii) root biomass, WR (g) = 1.3277·exp 0.1988D (r2 = 0.88). Leaf biomass (WL) was calculated as the aggregate biomass of individual leaflets: WLL (g) = -0.2052 + 0.04LL (r2 = 0.85), where LL (in cm) stands for leaflet length, n = 100 leaflets from 30 plants. Leaf area (AL) at the beginning of the experiment was calculated as the aggregate area of individual leaflets: ALL (cm2) = -47.117 + 8.5452LL (r2= 0.89). These equations allowed us to estimate AL and the biomass gain (ΔB) of plant organs throughout the experimental period (163 days).
The consumptive use of water (CUW)
The CUW during the experimental period was obtained by daily recording the amount of water consumed by the plant. During the whole experimental period (163 days) each potted plant was weighed (at 07:00-08:00, accuracy of 1 g) and the amount of water consumed recorded and restored to keep the soil at its target water content (50% FC or 100% FC). For rewatering, we did not take into account the mass change due to daily plant growth because in comparison with the amount of water lost by total evaporation from the plant, the biomass gain was very low (< 1%). To avoid evaporation from the soil surface the pot was covered with a plastic bag sealed to the base of the plant. Thus, all water lost from each pot was assumed to come only from plant evaporation.
Whole-plant water-use efficiency (WUEP)
WUEP was calculated as the ratio of the whole-plant biomass gain (ΔWT) to CUW. That is, WUEP = ΔWT / CUW, where ΔWT denotes the difference between WT at t163 and WT at t0 (i.e., ΔWT = WTt163 - WTt0). The relative growth rates (RGR) was calculated as follows: RGR (g g-1 day-1) = [ln WTt163 - ln WTt0]/(t163 - t0), where WTt163 and WTt0 denote the plant biomass (in grams) at the indicated times, and (t163 - t0) denotes the time interval (t163 - t0 = 163 days).
Total nonstructural carbohydrates (TNC)
Leaf total nonstructural carbohydrate content was measured at the end of the experimental period. Nonstructural carbohydrates were extracted in boiling ethanol (80% v/v), and purified with chloroform. Starch in the ethanol-soluble residue was hydrolyzed in 0.5 M NaOH and the precipitate removed by centrifugation (15 min at 1000×g). Glucose content in the sample was measured spectrophotometrically at 490 nm after reaction with phenol-sulfuric acid, and the sugar content determined using a glucose standard.
Statistical analysis
We used a split-plot experimental design, with CO2 levels (400 and 700 ppm) as whole plots and water regimes (soil at 50 and 100% FC) as subplots, with five replications (plants). Data were subjected to analysis of variance (ANOVA) and the post-hoc Fisher’s LSD test (p = 0.05) was used for mean separation. Biomass, CUW, CEmass and TNC data were log10 or log(10+1)-transformed before conducting the ANOVA. Statistical analyzes were performed using the software package STATISTICA® ver. 7.0 (StatSoft Inc., Tulsa, OK, USA).
Results
In the greenhouse relative humidity was 70-80% and mean temperature 27.5 °C (ranging from 26 °C at night to 29 °C at midday); mean PAR ranged from 185 to 215 µmol m-2 s-1 (over a 12-h period) and mean ambient CO2 concentration was 410 ± 17 ppm (day/night of 400/420 ppm). Over the experimental period, mean predawn leaf water potentials were -0.20 MPa in well-watered plants and -0.34 MPa in those subjected water stress.
Gas exchange
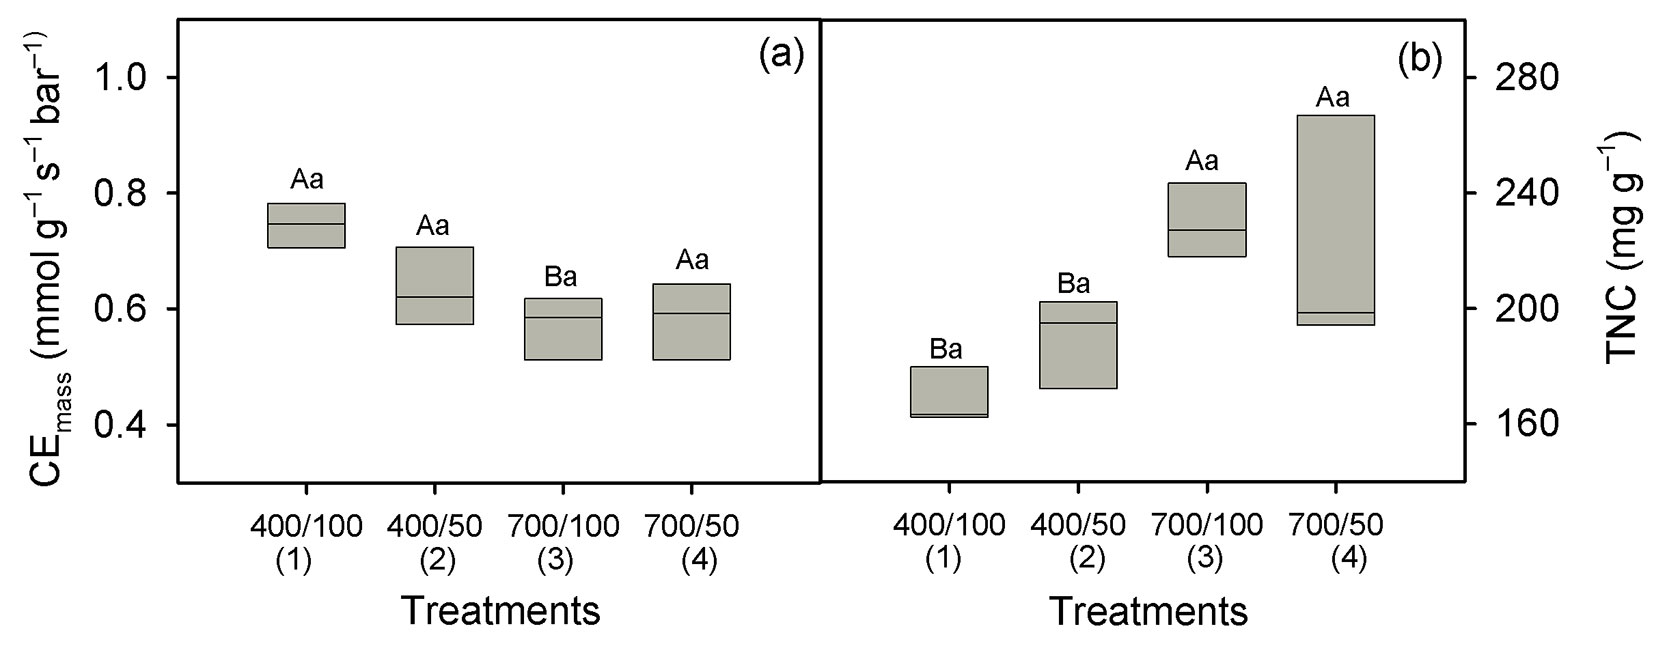
Taking well-watered plants grown at ambient CO2 as a baseline, Asat-mass increased 28% (124 to 159 nmol g-1 s-1) under eCO2 in well-watered plants, and 93% (86-166 nmol g-1 s-1) in plants submitted to water stress (Fig. 1a). Across water regimes, Amax-mass was 22% lower at eCO2 (259 against 202 nmol g-1 s-1, p = 0.002 - Fig. 1b, Tab. 1), and over CO2 levels, Amax-mass declined 11% under drought (244 against 217 nmol g-1 s-1, p = 0.039 - Fig. 1b, Tab. 1). Values of gsCO2-mass declined 43% under drought at ambient CO2 (1.01 to 0.58 mmol g-1 s-1), and 39% in well-watered plants at eCO2 (1.01 to 0.62 mmol g-1 s-1, p = 0.001 - Fig. 1c). However, there was no effect of drought on gsCO2-mass at eCO2 (p = 0.22- Fig. 1c). There was no difference in Ci/Ca values between water regimes at eCO2 (mean of 0.59, p = 0.57 - Fig. 1d). At ambient CO2, however, Ci/Ca slightly decreased (11%) under drought (p = 0.006 - Fig. 1c), but this decline was not strong enough to affect Ci, which only varied in response to the CO2 treatment. Mean Ci values were 399 ppm at eCO2 and 240 ppm at ambient CO2 (Tab. 2). In both CO2 environments, we found no effect of water stress on CEmass (p = 0.20 - Tab. 1), but over water regimes it was lower at eCO2 (p = 0.003 - Fig. 2a). RL-mass was not affected by drought or eCO2 (p > 0.05 - Tab. 1), but on average RD-mass was lower at eCO2 (Tab. 2).
Fig. 1 - Light saturated photosynthesis on a mass basis (Asat-mass, panel A), light and CO2-saturated photosynthesis on a mass basis (Amax-mass, panel B); stomatal conductance to CO2 on a mass basis (gsCO2-mass, panel C) and intercellular to ambient CO2 ratio (Ci/Ca, panel D) in Carapa surinamensis grown at 400 and 700 ppm of CO2 and two water regimes, soil at 50% FC and 100% FC. Significant differences between boxes are indicated with different small letters within a CO2 level and different capital letters within a water regime (Fisher LSD test at p ≤ 0.05). The boundaries of the box indicate the 25th and 75th percentile, and the solid line within the box denotes the median. The mean value for each box is available in the appendix table (Tab. 1A). The p values of the comparisons 1 × 4 and 2 × 3 (meaning of numerals is shown in the x-axis of the panel) are given when the interaction (CO2 level × water regime) is significant (p ≤ 0.05, Tab. 1).
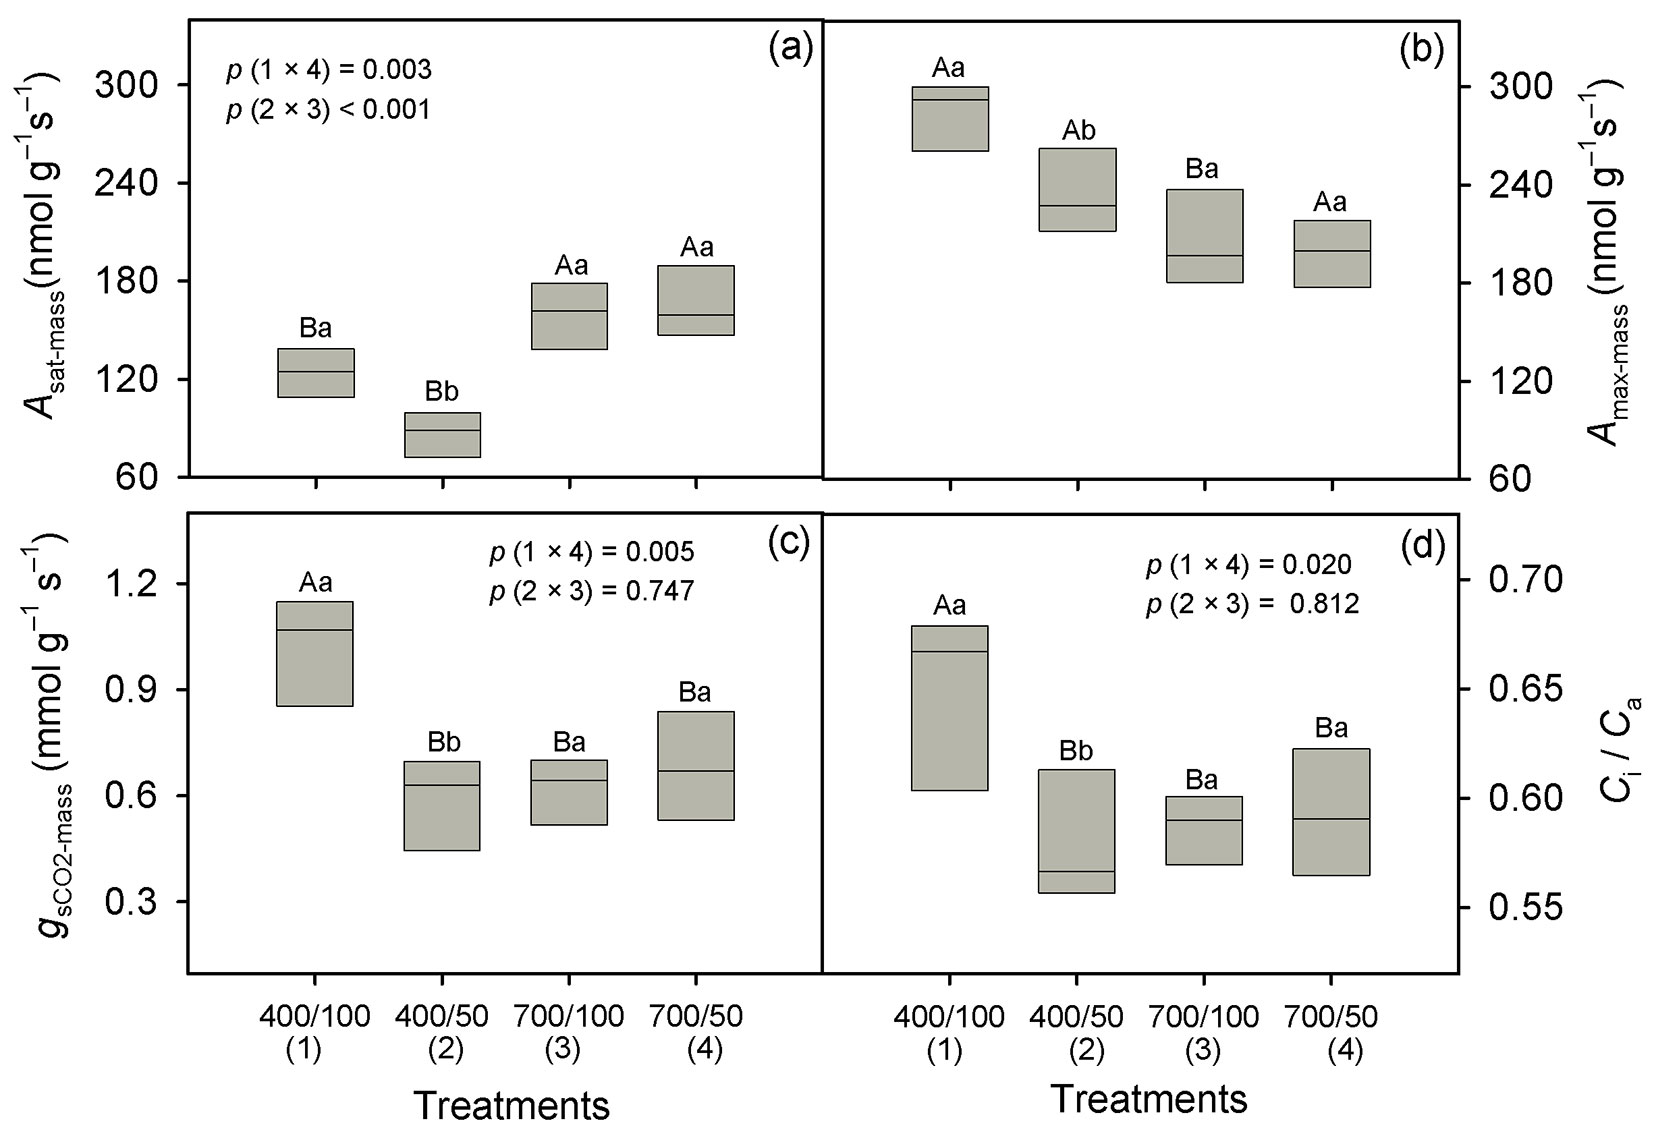
Tab. 1 - Values of F (with p values in parenthesis) are given for the effect of CO2 concentrations (CO2) and water regimes (water) on evaluated parameters. Abbreviations are indicated in the abbreviation’s section.
| Parameters | CO2 | Water | CO2 × Water |
|---|---|---|---|
| Asat-mass (nmol g-1 s-1) | 55.98 (<0.001) | 2.52 (0.151) | 5.69 (0.044) |
| Amax-mass (nmol g-1 s-1) | 19.17 (0.002) | 6.06 (0.039) | 3.03 (0.120) |
| Ci/Ca (unitless) | 2.18 (0.178) | 5.61 (0.045) | 8.56 (0.019) |
| Ci (ppm) | 288.14 (<0.001) | 1.26 (0.294) | 2.71 (0.138) |
| gsCO2-mass(mmol g-1 s-1) | 7.99 (0.022) | 4.59 (0.065) | 8.48 (0.019) |
| RL-mass(nmol g-1 s-1) | 1.03 (0.339) | 0.44 (0.526) | 0.0004 (0.984) |
| RD-mass(nmol g-1 s-1) | 17.65 (0.003) | 0.18 (0.681) | 5.76 (0.043) |
| Log CEmass (mmol g-1 s-1 bar-1) | 18.04 (0.003) | 1.95 (0.200) | 3.06 (0.118) |
| Log TNC (mg g-1) | 20.06 (0.002) | 0.56 (0.476) | 2.46 (0.156) |
| HGR (cm day-1) | 10.60 (0.012) | 23.21 (0.001) | 2.99 (0.122) |
| Log DGR (cm day-1) | 24.54 (0.001) | 11.62 (0.009) | 0.26 (0.621) |
| SLA (m2 kg-1) | 116.26 (<0.001) | 1.24 (0.297) | 0.25 (0.629) |
| ΔAL (m2 per plant) | 0.15 (0.705) | 34.66 (<0.001) | 1.09 (0.326) |
| Log ΔWL (g per plant) | 2.10 (0.185) | 35.69 (<0.001) | 0.25 (0.629) |
| Log ΔWS (g per plant) | 18.99 (0.002) | 16.63 (0.004) | 0.41 (0.540) |
| Log ΔWR (g per plant) | 38.36 (<0.001) | 4.68 (0.063) | 0.02 (0.883) |
| Log SRR (unitless) | 23.30 (0.001) | 1.61 (0.240) | 0.14 (0.715) |
| RGR (g kg-1 day-1) | 24.25 (0.001) | 22.32 (0.001) | 0.04 (0.855) |
| Log ΔWT (g per plant) | 19.36 (0.002) | 18.60 (0.003) | 0.25 (0.626) |
| Log CUW [kg (water) per plant] | 15.99 (0.004) | 59.06 (<0.001) | 0.04 (0.844) |
| WUEP[g (DM) kg-1(water)] | 200.19 (<0.001) | 13.21 (0.007) | 8.93 (0.017) |
Tab. 2 - Height growth rate (HGR), diameter growth rate (DGR), specific leaf area (SLA), gain of leaf area (ΔAL), intercellular CO2 concentration (Ci), and leaf respiration in the light (RL-mass) and leaf dark respiration on a mass basis (RD-mass) in Carapa surinamensis at two water regimes (soil at 50% and 100% FC) and two CO2 levels (400 ppm and eCO2 -700 ppm). Within rows, significant differences between mean values are indicated with different small letters within a CO2 level and different capital letters within a water regime (Fisher’s LSD test, p ≤ 0.05). Each value represents the mean (± SD) of five plants (n = 5). In the last four columns and within rows, significant differences between means of CO2 levels over water regimes and between means of water regimes over CO2 levels are indicated with different capital letters (Fisher’s LSD test, p ≤ 0.05, n = 10).
| Parameter | 400 ppm | 700 ppm | 400 ppm | 700 ppm | 100% FC | 50% FC | ||
|---|---|---|---|---|---|---|---|---|
| 100% FC(1) | 50% FC(2) | 100% FC(3) | 50% FC(4) | |||||
| HGR (cm day-1) | 0.22 ± 0.08 Aa | 0.08 ± 0.02 Ab | 0.13 ± 0.04 Ba | 0.06 ± 0.02 Ab | 0.15 A | 0.09 B | 0.18 A | 0.07 B |
| DGR (mm day-1) | 0.03 ± 0.01 Ba | 0.02 ± 0.01 Ba | 0.05 ± 0.02 Aa | 0.04 ± 0.01 Ab | 0.03 B | 0.05 A | 0.04 A | 0.03 B |
| SLA (m2 kg-1) | 19.9 ± 0.8 Aa | 20.9 ± 1.4 Aa | 15.5 ± 1.6 Ba | 15.9 ± 0.9 Ba | 20.4 A | 15.7 B | 17.7 A | 18.4 A |
| ΔAL (m2 per plant) | 0.78 ± 0.35 Aa | 0.21 ± 0.09 Ab | 0.65 ± 0.23 Aa | 0.25 ± 0.12 Ab | 0.49 A | 0.45 A | 0.71 A | 0.23 B |
| Ci (ppm) | 253 ± 15 Ba | 227 ± 15 Ba | 396 ± 25 Aa | 401 ± 26 Aa | 240 B | 399 A | 325 A | 314 A |
| RL-mass (nmol g-1 s-1) | 3.45 ± 1.42 Aa | 3.73 ± 0.88 Aa | 3.03 ± 0.29 Aa | 3.32 ± 0.83 Aa | 3.59 A | 3.17 A | 3.24 A | 3.53 A |
| RD-mass (nmol g-1 s-1) | 8.15 ± 1.09 Aa | 7.45 ± 0.61 Aa | 5.49 ± 0.65 Ba | 5.98 ± 1.04 Aa | 7.80 A | 5.73 B | 6.82 A | 6.71 A |
Fig. 2 - Carboxylation efficiency of Rubisco on a mass basis (CEmass, panel a) and total nonstructural carbohydrates (TNC, panel b) in Carapa surinamensis grown at 400 and 700 ppm of CO2 and two water regimes, soil at 50% FC and 100% FC. Significant differences between boxes are indicated with different small letters within a CO2 level and different capital letters within a water regime (Fisher’s LSD test, p ≤ 0.05). Further information is described in Fig. 1.
Biomass allocation, water-use efficiency and TNC
Growth in diameter was greater under eCO2 than in ambient CO2 conditions (p = 0.001), whereas height growth was enhanced at ambient CO2 (p = 0.012 - Tab. 1, Tab. 2). Irrespective of the CO2 treatment, growth rates in diameter and height were greater in well-watered plants than under drought (p ≤ 0.009 - Tab. 1, Tab. 2). CO2-enrichment did not affect ΔWL (p = 0.18 - Tab. 1) and, over CO2 levels, ΔWL was reduced by 59% under drought stress (46.8 vs. 19.0 g per plant, p < 0.001 - Fig. 3a). The ΔWS was greater (83%) at eCO2 (63.2 vs. 34.5 g per plant over water regimes), but it was significantly reduced (52%) by drought over CO2 levels (66.1 vs. 31.6 g per plant, p = 0.004 - Fig. 3b, Tab. 1). Over water regimes, ΔWR more than doubled under eCO2 (30.9 vs. 10.3 g per plant, p < 0.001 - Tab. 1), and across CO2 levels it was reduced (51%) by drought (27.6 vs. 13.6 g per plant, p = 0.06 - Fig. 3c, Tab. 1). Mean SRR declined under eCO2 from 6.9 to 3.5 (p = 0.001), with no effect of water regimes (p = 0.24 - Fig. 3d, Tab. 1).
Fig. 3 - Gain of leaf dry matter (ΔWL, panel a), stem dry matter (ΔWS, panel b), root dry matter (ΔWR, panel c), and shoot/root ratio (SRR, panel d) in Carapa surinamensis grown at 400 and 700 ppm of CO2 and two water regimes, soil at 50% FC and 100% FC. Significant differences between boxes are indicated with different small letters within a CO2 level and different capital letters within a water regime (Fisher’s LSD test, p ≤ 0.05). Further information is described in Fig. 1.
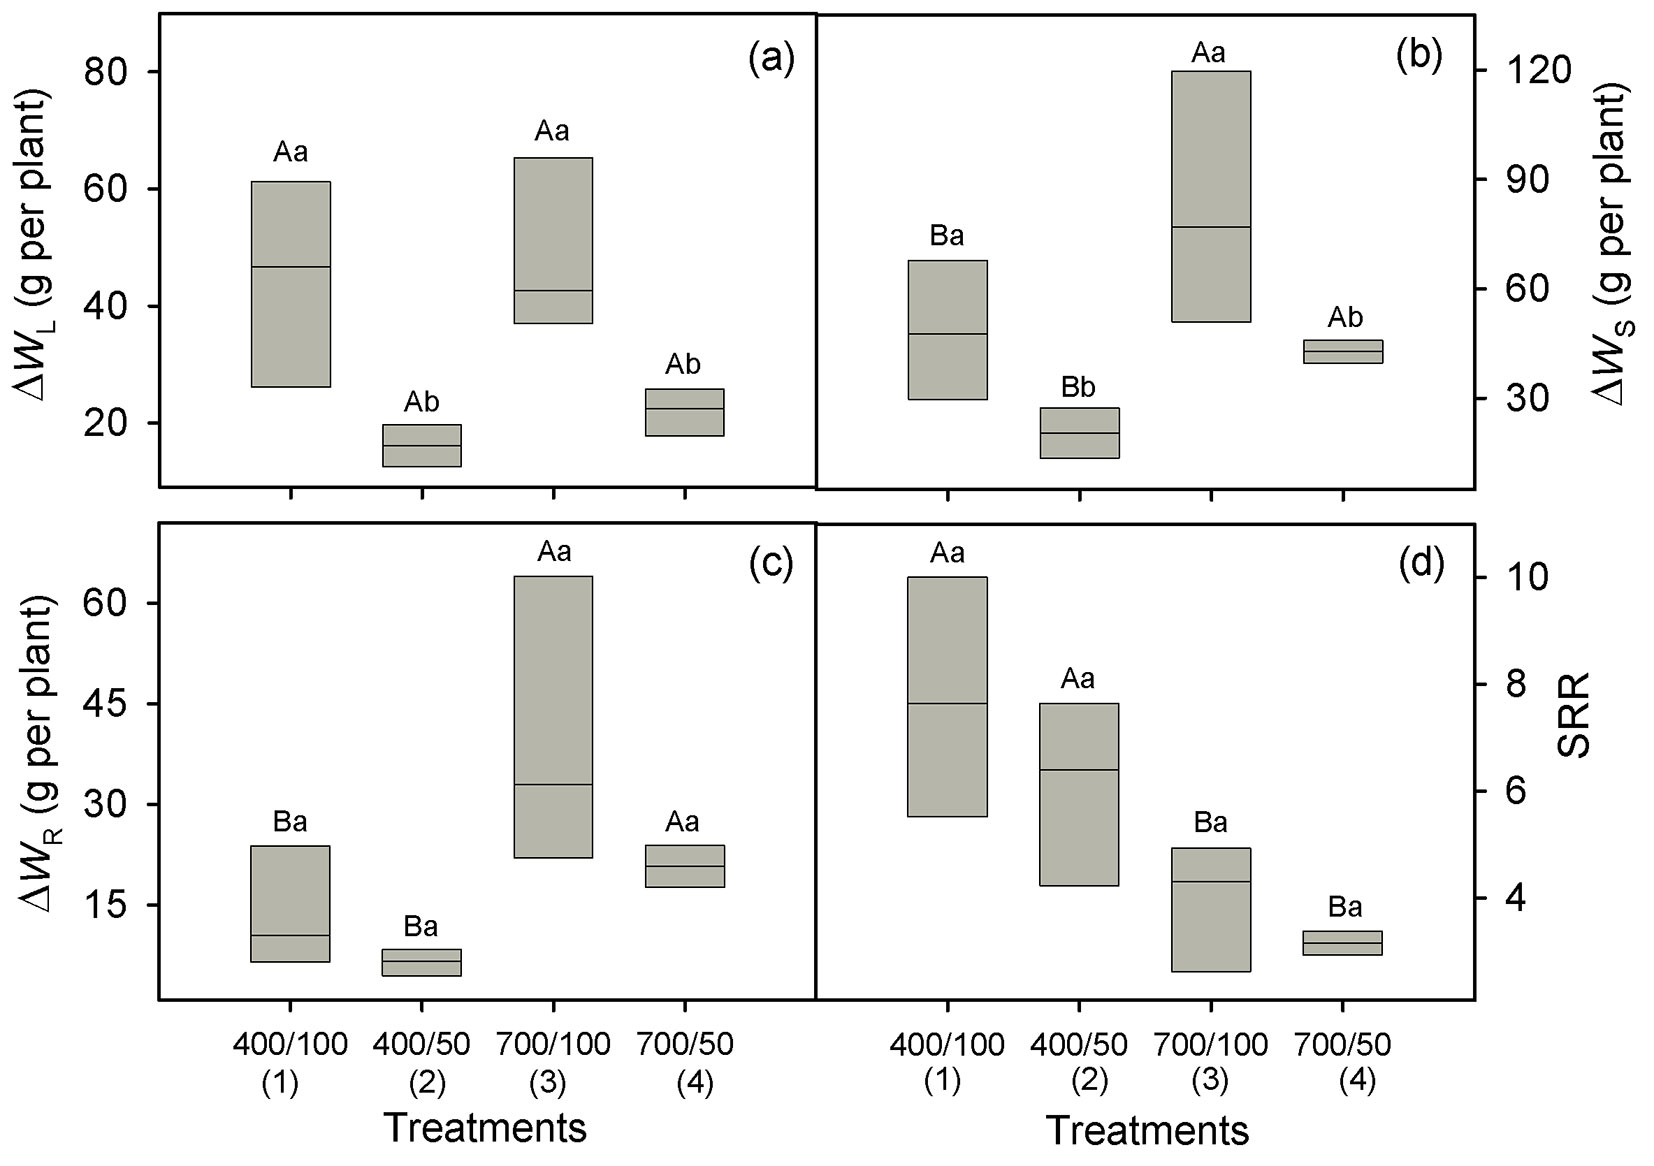
Over water regimes RGR was improved (51%) at eCO2 (7.55 vs. 5.01 g kg-1 day-1), and across CO2 levels, it declined (32%) under drought (7.50 vs. 5.07 g kg-1 day-1, p = 0.001 - Fig. 4a, Tab. 1). Total leaf area gain (ΔAL) was not affected by CO2-enrichment (p = 0.70), but across CO2 levels, it was lower under drought (0.71 vs. 0.23 m2 per plant, p < 0.001 - Tab. 1, Tab. 2). Although the plants were a little taller under ambient conditions, across water regimes ΔWT was 73% greater at eCO2 (129.8 vs. 75.0 g per plant, p = 0.002 - Fig. 4b, Tab. 1) and, over CO2 levels, it was reduced 54% by drought (140.5 vs. 64.2 g per plant, p = 0.003 - Fig. 4b). One can see in this figure that CO2 enrichment greatly mitigates the effect of drought, as ΔWT doubled under drought at eCO2 (85.5 vs. 43.0 g per plant).
Fig. 4 - Relative growth rate (RGR, panel a), gain of total dry matter (ΔWT, panel b), consumptive use of water (CUW, panel c) and whole-plant water-use efficiency (WUEP, panel d) in Carapa surinamensis grown at 400 and 700 ppm of CO2 and two water regimes, soil at 50% FC and 100% FC. Significant differences between boxes are indicated with different small letters within a CO2 level and different capital letters within a water regime (Fisher’s LSD test, p ≤ 0.05). Further information is described in Fig. 1.
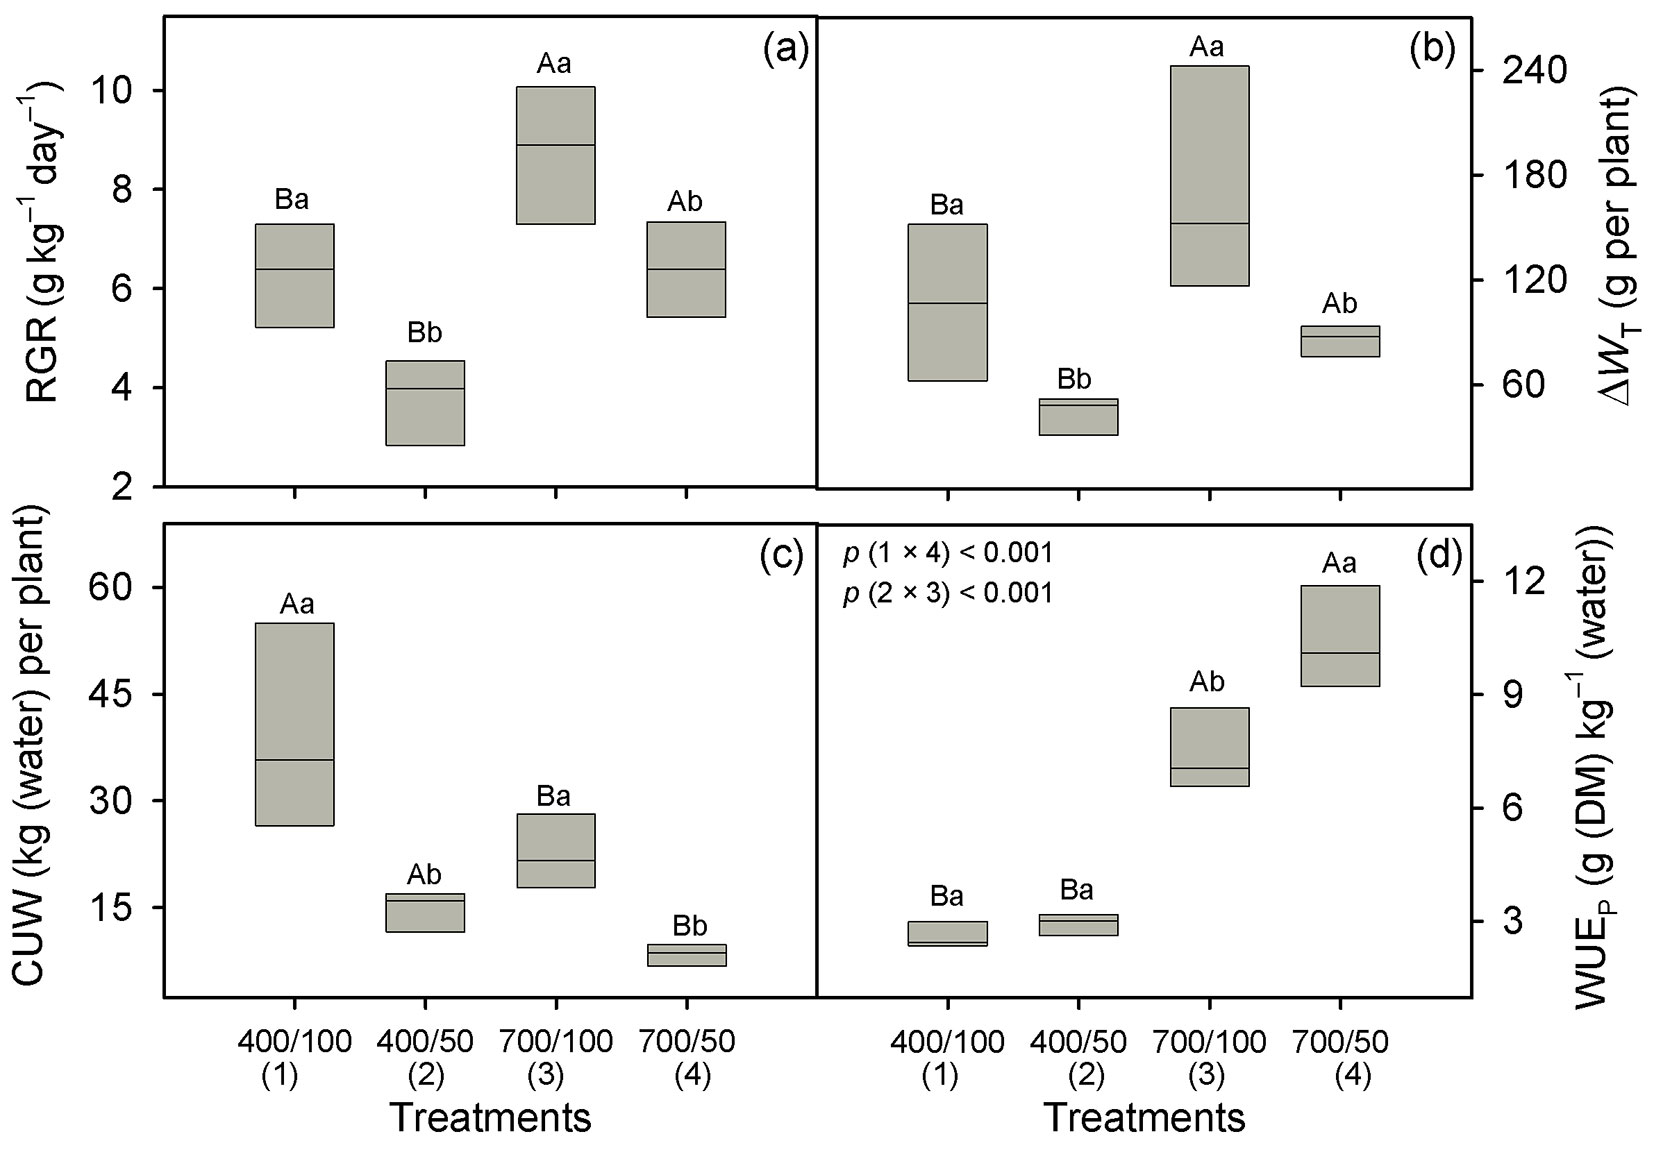
Across water regimes, CUW was reduced (43%) under eCO2 (27.2 vs. 15.5 kg [water] per plant over the whole study period) and across CO2 levels it was 63% lower under drought (31.2 vs. 11.5 kg [water] per plant, p < 0.001 - Fig. 4c, Tab. 1). Therefore, the WUEp was substantially improved by CO2-enrichment, particularly under drought (Fig. 4d). At eCO2, it was improved by 188% in well-watered plants and by 262% under drought. However, WUEp was not improved by drought at ambient CO2 (p = 0.66, Fig. 4d). Across water regimes, SLA declined (23%) at eCO2 (20.4 vs. 15.7 m2 kg-1, p < 0.001 - Tab. 1, Tab. 2) with no effect of soil water content on SLA (p = 0.29). Likewise, the TNC content was only affected by CO2 enrichment, with an increase of 27% under eCO2 (179 vs. 227 mg g-1, p = 0.002 - Fig. 2b, Tab. 1).
Discussion
Irrespective of the water regime, Asat-mass was greater in plants subjected to eCO2 than in those kept at ambient CO2 conditions, which indicates that the new leaves flushed during the experimental period did not experience down-regulation of photosynthetic at sustained eCO2. Because the Ci values were higher at eCO2 (240 ppm at ambient CO2 against 399 ppm at eCO2), this suggests that at ambient CO2 the Rubisco carboxylation rate was limited by the diffusion of CO2 to the carboxylation sites ([27], [30]). Improvement of carbon assimilation under CO2 enrichment is in accordance with the findings reported by others ([13], [34], [1], [2]). In well-watered plants we found a rise of 28% in Asat-mass under eCO2, but that improvement was greater (93%) in plants submitted to drought. The decline of Asat-mass under drought at ambient CO2 can be the result of the combined effect of diffusive (gs and mesophyll conductance) and non-diffusive (biochemical) limitations of photosynthesis ([12], [36], [19]). One can see in Fig. 1a,c that the decrease in Asat-mass at ambient CO2 under water stress was associated with a drop in gsCO2-mass. It has been proposed that the decline in photosynthetic rate under mild drought (leaf water potential above -0.9 MPa) is most of time associated with a decline in stomatal conductance ([12]). The increase of Asat-mass at eCO2 concurs with the results reported by Ainsworth & Long ([1]) and Nowak et al. ([34]) who found that photosynthesis increases by about 30-50% under eCO2. Kelly et al. ([23]) also reported an improvement in photosynthetic rates and a decline in the Ci/Ca ratio in response to CO2-enrichment, which is in agreement with the results we found in this study (Fig. 1d).
There was a slight decline (17%) of CEmass under elevated eCO2 (Fig. 2a), which can be ascribed to a decrease in SLA (Tab. 2), as leaf thickness inversely increased with SLA ([27]). However, it is apparent that this small decline in CEmass did not impair Asat-mass which increased at eCO2. This concurs with the result of a meta-analysis carried out by Ainsworth & Long ([1]) who found just a slight decline (6%) in the maximum carboxylation rate of Rubisco. Both RL-mass and RD-mass tended to decrease at eCO2 (11-20%) but the effect of eCO2 was only significant for dark respiration (Tab. 1). This is in agreement with the result reported by Curtis & Wang ([13]), who found a small decrease (18%) in RD-mass under eCO2. The decrease in leaf respiration can be ascribed, at least in part, to a decrease in SLA under eCO2. Much of the discrepancy on the effect of eCO2 on leaf respiration can be attributed to the difficulty in measuring this parameter with gas exchange techniques ([29]). We found an increase (27%) in TNC under eCO2, and it has been suggested that the accumulation of leaf carbohydrates at eCO2 can reduce the expression of genes coding for photosynthetic enzymes ([11]), but in this study we did not found evidence of photosynthetic acclimation.
Subjecting the plants to eCO2 mitigates the negative effect induced by low water availability and, on average, Asat-mass increased 54% at eCO2. However, contrary to expectation Amax-mass declined at eCO2 in well-watered plants and under drought at ambient CO2. The decline of Amax-mass under ambient CO2 can be attributed, at least partially, to a reduction in gsCO2-mass (Fig. 1c), but an effect of mesophyll conductance cannot be ruled out ([19]). In fact, in several species there is a close correlation between mesophyll conductance and photosynthetic rate ([28], [40], [3]). It has been reported that an increase in TNC under eCO2 can lead to down-regulation of photosynthesis ([30], [18]). Although Asat-mass was not reduced by eCO2 (Fig. 1a), down-regulation of Amax-mass in response to an increase in TNC cannot be entirely disregarded. It is important to note, however, that Amax-mass was measured at a Ca value of 2000 ppm (mean Ci of about 1100 ppm) against a Ca of 700 ppm (Ci of 399 ppm) used for measuring Asat at eCO2. Kitao et al. ([25]) found that mesophyll conductance exponentially declines with increasing Ci. Furthermore, Leakey et al. ([30]) suggested that the apparent down-regulation of carboxylation rates at eCO2 can also be caused by a decrease in mesophyll conductance. Thus, it seems plausible to suggest that the decline of Amax-mass at eCO2 was caused by a decline of mesophyll conductance and, to a lesser extent, by the increase in TNC at eCO2.
In well-watered plants, gsCO2-mass was lower under eCO2 which is not unexpected, as the most common response is a decrease of stomatal conductance under eCO2 ([13], [1], [29], [30]). One can see in Fig. 1c that gsCO2-mass did not decline under drought at eCO2, which leads to similar Ci/Ca values under CO2 enrichment (Fig. 1d). This shows that stomata were sensitive to drought at ambient CO2, but rather insensitive at eCO2, which suggests some stomatal acclimation (a physiological change triggered by a new environmental condition) to eCO2 ([33]). Yan et al. ([44]) found that under drought, stomatal conductance was dependent on xylem-abscisic acid concentration at ambient CO2, whereas it was insensitive to abscisic acid and predominantly regulated by leaf turgor at eCO2. We show that subjecting the plants to eCO2 negates the effect of drought on stomatal conductance, and consequently water stress did not lead to a reduction in Asat-mass under eCO2. Even when predawn leaf water potential only slightly declined under drought (-0.20 to -0.34 MPa), there was a sharp decline of gsCO2-mass at ambient CO2 under drought, which suggests that andiroba is rather sensitive to small changes in leaf water potential ([8]).
Besides the effect of eCO2 on gsCO2-mass, the pronounced reduction in total leaf area under water stress also contributed to reduce CUW under drought (Fig. 4c). This occurs because of the negative effect of water stress on leaf production, as cell division and leaf expansion are greatly reduced under drought ([5], [42]). At eCO2 the drop in CUW essentially mirrored the drop in ΔWL, as gsCO2-mass did no decline under drought at eCO2. At ambient CO2, however, the drop in CUW reflected both the decline in ΔWL and gsCO2-mass. Besides, in the greenhouse the air was slightly drier (10% lower RH) and a little (1.5 °C) warmer than in the growth chamber, which could also have had a small effect on CUW and thereby on WUEP at ambient CO2.
WUEP was greatly improved by submitting the plants to eCO2 (Fig. 4d), because of the combined effect of a decline in CUW and an increase in ΔWT. The enhancement of WUEP at eCO2 is agreement with the results reported by others ([22], [23]). Cernusak et al. ([10]) found that WUEP of seedlings of Swietenia macrophylla and Ormosia macrocalyx (tropical trees) can improve from 54% (S. macrophylla) to 91% (O. macrocalyx) in response to eCO2, which shows that WUEP can exhibit large variation between species even at the same experimental conditions. It is worth noting, that gsCO2-mass and WUEP followed different trends. For example, gsCO2-mass declined under drought at ambient CO2, whereas WUEP remained unchanged in that condition (Fig. 4d). This can be explained if we take into account that, besides stomatal conductance, WUEP also depend on other factors including biomass allocation to plant organs, leaf morphology, plant respiration and canopy boundary layer conductance, which ultimately leads to difference between A/E and WUEP ([27], [30]).
The ΔWT increased 73% at eCO2 and decreased by 54% under drought over CO2 levels. This is in tandem with the increase of Asat-mass recorded at eCO2 (28% and 93%, depending on water regime), which resulted in greater amount of carbon allocated to stems and roots. Our ΔWT values are greater than the above ground biomass gain (20-30%) reported by others ([13], [1]) in plants subjected to eCO2. This discrepancy can be explained by considering that Carapa trees grow at high rates during the juvenile stage ([16], [8]). On the other hand, our results are consistent with those reported by Cernusak et al. ([10]), who found that the biomass of well-watered tropical seedlings can increase from about 70% (Swietenia macrophylla) to 150% (Ormosia macrocalyx) at eCO2. Large biomass allocation to stems and roots suggests that these plant organs can be the predominant sinks of Carapa saplings under CO2 enrichment, as ΔWL remained unaltered at eCO2. In comparison with ambient CO2, more carbon was allocated to roots at eCO2 (Fig. 3c), and due to the absence of an effect of eCO2 on ΔWL, this ultimately led to a lower SRR. The decline of SRR at eCO2 is rather unexpected, as in several species it remains unchanged under eCO2 ([37]). The drastic reduction in ΔWT at ambient CO2 under water stress is consistent with the long-term decline in total biomass (250 to 150 Mg(C) ha-1, in 10 yrs) observed under drought (i.e., a 50% reduction in water supply - [21]). RGR increased under eCO2, which concurs with the finding reported by Poorter & Nagel ([37]). We found that the amount of carbon stored as TNC increased only 27% at eCO2, i.e., less than the starch increase of 60-80% reported by Nowak et al. ([34]), which is consistent with the large fraction of biomass accumulated in stems and roots. SLA was greatly decreased under CO2-enrichment. This is in accordance with the rise in TNC often found at eCO2 ([13], [1]).
Conclusions
We postulated that plants under CO2-enrichment enhance Asat-mass, biomass accumulation and WUEP, and that eCO2 leads to a reduction of stomatal conductance, which was supported by data. However, surpassing our expectations, submitting the plants to eCO2 entirely nullifies the negative effect of drought on Asat-mass and gsCO2-mass, and improves total biomass accumulation, but unexpectedly CO2-enrichment leads to a decline in Amax-mass. Total leaf area was greatly reduced by drought, but the absence of a positive effect of eCO2 on leaf area production was unexpected. These findings widen our understanding of the effect of eCO2 and water stress on the physiology of Carapa, an important species of multipurpose use, particularly in the Amazon region. It should be acknowledged, however, that several factors can affect the performance of mature trees in their natural environment (e.g., light, nutrient and water availability, and the capacity of the root system to explore the soil for water and nutrients), which suggests caution in extrapolating results from green-house experiments to forest ecosystems.
List of abbreviations
(A): net photosynthetic rate; (AL): total leaf area; (Asat-mass): light saturated photosynthesis on a mass basis; (Amax-mass): light and CO2-saturated photosynthesis on a mass basis; (B): biomass; (ΔB): biomass gain over the experimental period; (Ca): ambient CO2 concentration; (CEmass): carboxylation efficiency on a mass basis; (Ci): intercellular CO2 concentration; (CUW): consumptive use of water (amount of water consumed by a plant); (DM): dry matter; (eCO2): elevated CO2 concentration; (gsCO2-mass): stomatal conductance to CO2 on a mass basis; (Log): logarithm; (PAR): photosynthetically active radiation; (RL-mass): leaf respiration in the light on a mass basis; (RD-mass): dark respiration on a mass basis; (RGR): relative growth rate; (SLA): specific leaf area; (SRR): shoot/root ratio; (TNC): total nonstructural carbohydrate; (WL): leaf DM; (WS): stem DM; (WR): root DM; (WT): total DM; (WUEP): whole-plant water-use efficiency.
Acknowledgments
The authors acknowledge the Brazilian Ministry of Science, Technology, Innovations and Communications (MCTIC/INPA PRJ 15.120), and the National Council for Scientific and Technological Development (CNPq, 302041/2015-0) for grant (to RAM) and scholarship to MFO. We thank the anonymous reviewers for their useful comments and suggestions.
Author contributions
MFO collected data and conducted statistical analysis and RAM supervised the experimental work and wrote the article with contributions of the first author.
References
Gscholar
Gscholar
CrossRef | Gscholar
CrossRef | Gscholar
Gscholar
CrossRef | Gscholar
Gscholar
Supplementary Material
Authors’ Info
Authors’ Affiliation
Instituto Nacional de Pesquisas da Amazônia - INPA, Botany Graduate Program, Avenida André Araújo, 2936, 69067-375 Manaus, AM (Brazil)
Instituto Nacional de Pesquisas da Amazônia -INPA, Coordination of Environmental Dynamic, Tree Ecophysiology Laboratory, 69067-375 Manaus, AM (Brazil)
Corresponding author
Paper Info
Citation
Oliveira MF, Marenco RA (2019). Gas exchange, biomass allocation and water-use efficiency in response to elevated CO2 and drought in andiroba (Carapa surinamensis, Meliaceae). iForest 12: 61-68. - doi: 10.3832/ifor2813-011
Academic Editor
Rossella Guerrieri
Paper history
Received: Apr 14, 2018
Accepted: Nov 14, 2018
First online: Jan 24, 2019
Publication Date: Feb 28, 2019
Publication Time: 2.37 months
Copyright Information
© SISEF - The Italian Society of Silviculture and Forest Ecology 2019
Open Access
This article is distributed under the terms of the Creative Commons Attribution-Non Commercial 4.0 International (https://creativecommons.org/licenses/by-nc/4.0/), which permits unrestricted use, distribution, and reproduction in any medium, provided you give appropriate credit to the original author(s) and the source, provide a link to the Creative Commons license, and indicate if changes were made.

Web Metrics
Breakdown by View Type
Article Usage
Total Article Views: 50917
(from publication date up to now)
Breakdown by View Type
HTML Page Views: 40583
Abstract Page Views: 5794
PDF Downloads: 3605
Citation/Reference Downloads: 6
XML Downloads: 929
Web Metrics
Days since publication: 2711
Overall contacts: 50917
Avg. contacts per week: 131.47
Article Citations
Article citations are based on data periodically collected from the Clarivate Web of Science web site
(last update: Mar 2025)
Total number of cites (since 2019): 8
Average cites per year: 1.14
Publication Metrics
by Dimensions ©
Articles citing this article
List of the papers citing this article based on CrossRef Cited-by.
Related Contents
iForest Similar Articles
Research Articles
A resource capture efficiency index to compare differences in early growth of four tree species in northern England
vol. 10, pp. 397-405 (online: 24 March 2017)
Research Articles
Links between phenology and ecophysiology in a European beech forest
vol. 8, pp. 438-447 (online: 15 December 2014)
Research Articles
Effects of nitrogen loading under low and high phosphorus conditions on above- and below-ground growth of hybrid larch F1 seedlings
vol. 11, pp. 32-40 (online: 09 January 2018)
Research Articles
Relationship between volatile organic compounds released and growth of Cunninghamia lanceolata roots under low-phosphorus conditions
vol. 11, pp. 713-720 (online: 06 November 2018)
Research Articles
Gas exchange characteristics of the hybrid Azadirachta indica × Melia azedarach
vol. 8, pp. 431-437 (online: 17 December 2014)
Research Articles
Calibration of a multi-species model for chlorophyll estimation in seedlings of Neotropical tree species using hand-held leaf absorbance meters and spectral reflectance
vol. 9, pp. 829-834 (online: 17 May 2016)
Research Articles
Variations in the performance of hybrid poplars subjected to the inoculation of a microbial consortium and water restriction
vol. 16, pp. 352-360 (online: 13 December 2023)
Research Articles
Relationships between leaf physiognomy and sensitivity of photosynthetic processes to freezing for subtropical evergreen woody plants
vol. 12, pp. 551-557 (online: 17 December 2019)
Research Articles
First vs. second rotation of a poplar short rotation coppice: leaf area development, light interception and radiation use efficiency
vol. 8, pp. 565-573 (online: 27 April 2015)
Research Articles
Allometric models for the estimation of foliage area and biomass from stem metrics in black locust
vol. 15, pp. 281-288 (online: 27 July 2022)
iForest Database Search
Search By Author
Search By Keyword
Google Scholar Search
Citing Articles
Search By Author
Search By Keywords
PubMed Search
Search By Author
Search By Keyword


