Developing stand transpiration model relating canopy conductance to stand sapwood area in a Korean pine plantation
iForest - Biogeosciences and Forestry, Volume 14, Issue 2, Pages 186-194 (2021)
doi: https://doi.org/10.3832/ifor3291-014
Published: Apr 14, 2021 - Copyright © 2021 SISEF
Research Articles
Abstract
With increasing concern for forest water use and anthropogenic alteration of forest structures, understanding the effects of structural changes in forests on transpiration is important. Our aim is to develop a stand transpiration model relating canopy conductance with stand sapwood area (SA) and environmental conditions for assessing the interannual variation in stand transpiration. The stand transpiration model is developed based on multiplicative empirical Gc estimations at eight Korean pine stands with different SAs. The model integrated the response of stomatal conductance to various environmental variables as vapor pressure deficit (D), photosynthetic active radiation (Q), air temperature (Ta), and soil water content (θ). The reference Gc (Gc at D=1kPa) and stomatal sensitivity to D was found to have a significant relationship with the SA, whereas other parameters like stomatal sensitivity to Q or Ta did not show significant relationships with it. The Gc model successfully reproduced changes in stand transpiration with changes in SA and climatic conditions. As this model uses SA, a simple and easily measurable structural variable, it can be easily applied to other Korean pine forests and can help estimate the spatial and temporal variations in stand transpiration.
Keywords
Sapwood Area, Canopy Conductance, Stand Transpiration, Empirical Model
Introduction
Forest stand structures, such as standing biomass, stand density, and species composition are the important factors controlling forest water use and yield. Many studies have confirmed the effects of structural changes in forests, by natural disturbance or forest management practices, on forest water balance ([18], [42]). Important forest structural properties that regulate forest water balance have been identified, and one of the most sensitive structural parameters in determining the spatial heterogeneity of forest water use and yield is the spatial variation of stand sapwood area ([47], [2]). Sapwood area is highly correlated with the index of the stand leaf area ([27]). In addition, the easiness of measurement makes the sapwood area a useful index for estimate transpiration over a large area.
However, using a stand sapwood area alone fails to estimate interannual variations in forest water use. In short term, large temporal variation in stand transpiration is mainly owing to the physiological regulation of transpiration by controlling stomatal conductance under various climatic conditions ([44]). Trees reduce the stomatal conductance to prevent excessive water loss under drought conditions and maintain internal water potentials within the operative range. In addition, adjustments of the tree structure to climatic conditions control temporal variability of transpiration at a long-time scale. For example, trees tend to allocate more to conducting tissue under drier conditions, which changes in leaf to sapwood area ratios ([6]). These sources of spatial and temporal variations can be connected through canopy conductance (GC), as GC is mainly correlated by both stand leaf area index (and sapwood area) and climatic conditions.
To estimate GC, empirical and mechanistic models have been used. Mechanistic models consider the response of GC against internal physiological processes in plants, such as the regulation of stomatal guard cells by the ion channel and signalling ([49]). On the contrary, empirical models rely on the observed responses of GC to variations in environmental conditions, and do not provide any specific physiological interpretations, but have been employed primarily at field-level analysis due to their simplicity and effectiveness ([32], [3]). For example, multiplicative models use a set of limiting functions to modify the maximum conductance to account for the empirical relationships among environmental variables ([19]).
To develop the empirical models, continuous measurements of GC under various environmental and structural conditions are needed. Due to the difficulties in directly measuring GC, indirect measurements from stand transpiration by using sap flux density measurement are widely used ([14], [3], [26]). In pine species, also, large variations in physiological regulation with stand structural properties or climatic conditions were analysed by sap flow measurements in large geographical areas ([34], [45]). Under moist conditions, the reference GC increased with leaf area index until saturation regardless of soil types ([45]). The GC sensitivity to vapor pressure deficit and soil moisture deficit increased with summer evaporative demand as well ([34]). These sap flux measurements are suitable for areas with complex terrain structures like Korean forests and could be used in developing and validating stand transpiration estimates by empirical model, which is enabling reliable estimation of forest water use. This is important for forest management planning because forest transpiration mainly controls the water yield ([5]).
In this paper, we developed a model that connects stand transpiration with stand structural attributes and environmental conditions. The model estimated stand transpiration was validated with calculated stand transpiration by upscaling measured sapflux density during the four consecutive growing seasons in even-aged Korean pine (Pinus koraiensis) plantation. Our objectives were to (1) find the main controlling environmental variables in stand transpiration, (2) relate changes of model parameter values with stand sapwood area variability, and (3) test the model applicability under diverse environmental conditions.
Material and methods
Study sites
The study was conducted at Mt. Taehwa in central Korea (37.18° N, 127.18° E, 190 m a.s.l.). The experiments were conducted at eight sites with different stand densities (SDs), basal areas (BAs), and sapwood areas (SAs - Tab. 1). The experiment sites were located adjacent each other, and under the same environmental conditions. The mean annual temperature at the nearest weather station is 11.4 ± 0.6 °C, and the mean annual precipitation is about 1355.8 ± 300.2 mm, where most of the precipitation occurs during the summer season due to the monsoon climate. Soil is loam generated from granite mixed with gneiss mother rock. Each experimental site was 0.04 ha and the distance among nearest plots was 5 m and the maximum distance among plots was 30 m. They featured even-aged single-canopy species (Pinus koraiensis), and a few deciduous understory species that occupied less than 5% of the total stand basal area. These understory species were not considered in stand transpiration estimation. Korean pine was selected as the target species because it is one of the main planting species in Korea (occupying more than 20% of coniferous plantation area ([1]), and provides valuable ecosystem services like carbon sequestration and pine nut production.
Tab. 1 - Stand characteristics of experimental plots. Stand density (SD), basal area (BA), and sapwood area (SA) are expressed per hectare, diameter at breast height (DBH) is expressed stand arithmetic means ± 1 standard error (SE), and leaf area index (LAI) estimated by allometric relationship on March 2012 is expressed leaf area per ground area.
| Plot | SD (trees ha-1) |
BA (m2 ha-1) |
SA (m2 ha-1) |
DBH (cm) |
LAI (m2 m-2) |
|---|---|---|---|---|---|
| P1 | 400 | 29.2 | 18.2 | 29.9 ± 1.5 | 4.41 |
| P2 | 375 | 26.1 | 16.8 | 29.5 ± 1.0 | 2.70 |
| P3 | 300 | 22.2 | 13.9 | 30.4 ± 1.4 | 2.69 |
| P4 | 325 | 28.1 | 16.8 | 33.0 ± 1.0 | 3.46 |
| P5 | 300 | 27.7 | 16.0 | 34.1 ± 1.2 | 2.96 |
| P6 | 400 | 25.6 | 17.0 | 28.3 ± 1.0 | 3.89 |
| P7 | 250 | 17.6 | 11.4 | 29.8 ± 0.9 | 1.93 |
| P8 | 225 | 14.7 | 9.8 | 28.8 ± 0.7 | 2.00 |
Following the end of the growing season in 2011, the initial diameter-at-breast height (DBH) was measured for all trees in the experimental plots. Annual growth was continually measured by hand-made dendrometers installed on 98 out of a total of 103 trees (including all trees monitored for sap flux density) within experimental plots. Each tree diameter growth was recorded manually 7-13 times per growing season and used to calculate sapwood area increment of each plot.
Environmental conditions, photosynthetic active radiation (Q, LI-190, LI-Cor), precipitation (03319-00, Cole-Parmer), air temperature (Ta), and relative humidity (RH, HMP-45C, Campbell Scientific) were measured on a 25-m-high walk-up tower and were gap-filled with a nearby 50-m high flux tower. Volumetric soil water content (θ) of the top 30 cm of the soil layer was measured by TDR sensors (CS-616, Campbell Scientific, USA). All the environmental variables were measured by 30-second interval and 30-minutes averaged values were stored. Vapor pressure deficit (D) was calculated from Ta and RH.
Stand transpiration measurement
Stand transpiration was estimated from sap flux density (JS) measured during 4 consecutive growing seasons from 2012 to 2015 by the hand-made Granier-type thermal dissipation probe method ([12]). This method employs two probes, an upper heating probe and a lower reference probe. The upper probe was heated by a constant power (0.2 W), and the temperature differences between upper and lower probes were measured by 30-second intervals and averaged by 30-minutes. To minimize natural temperature gradient, the probes were installed on the northern side of stems and shielded by light-reflecting covers. The reference probes were installed at least above 120 cm from the ground, and upper probes were installed vertically 10 to 15 cm apart from the reference sensors to prevent thermal interferences. To prevent the errors from sensor dislocation caused by stem growth, new sensors were reinstalled at proper depth on high growth trees. For considering tree-to-tree variation in JS, we installed the sensors on 12 trees per plot. In addition, radial variations of sap flux density were measured on 4 sample trees covering most of diameter range within study plots. Three sensors per tree were installed radially (0-20, 20-40, and 40-60 mm), and measured the radial variation in sap flux density under changes in environmental conditions ([30]).
The temperature differences between the probes were converted into sap flux density by the following equation ([12] - eqn. 1):
where JS is sap flux density (g m-2 s-1), ΔTmax is the maximum temperature difference recorded at zero flux, and ΔT is the temperature difference recorded at each time step. Because coefficients in eqn. 1 are highly sensitive to the applied heat ([12]), constant power (0.2 W) was supplied to the heating probe. The zero flux was determined by biophysical conditions (night time with low D, < 0.1 kPa) and stability of ΔT (less than 0.05 standard deviation changes in ΔT for 2 hours).
A power failure after a typhoon event caused 20-day data gaps in sap flux density measurements from June 2012 to July 2012. These data gaps were filled using the relationship between JS and environmental variables. (mean and minimum r2 between JS and environmental variables were 0.62 and 0.49, respectively). At other times during the study periods, single tree data gaps occasionally occurred due to sensor damage. These individual tree data gaps in JS were filled using the linear relationship with other trees in the same plot (mean and minimum r2 between trees were 0.96 and 0.83, respectively).
Daily stand-level transpiration (ET, mm d-1) was scaled up by multiplying the measured sapflux density with the relevant sapwood area (eqn. 2):
where Jsi is the daily aggregated sapflux density of the outer- (0-20 mm), mid- (20-40 mm), and inner- (40-60 mm) sapwood (kg m-2 d-1), respectively, ASi is the relevant sapwood area (m2), and AP is the total stand area (m2). Due to little color distinction between heartwood and sapwood, the active sapwood area was determined by the zero-sapflux density depth. The outer 60 mm of each tree’s BA was assumed to be a conductive SA because sap flow across sapwood area deeper than 60 mm was considered negligible ([29]). On average, outer sapwood transported most (> 80%) of sap flow. Mid- and inner-sapwood area contributed less than 20% of sap flow, where sap flux density of mid-sapwood was 13.67% of outer sap flux density and that of inner sapwood was 6.86% of outer sap flux density. The sapwood area was selected as the only scaling factor because total needle mass was highly correlated with DBH ([39]), which in turn showed a high correlation with sapwood area.
Stand transpiration estimation model
The model development processes consist of three steps. First, GC is calculated from stand transpiration estimated by sap flux density measurements. Second, the limitation in GC according to each environmental variable is analysed. Third, the limiting function of GC is related to the structural parameters (sapwood area), and its applicability to different climatic conditions was tested.
The canopy conductance was estimated by the inversion of the simplified Penman-Monteith equation ([20], [25]). This equation assumes that equilibrium evaporation is negligible, and can be applied to coniferous plantations closely coupled to overhead atmosphere owing to their short characteristic leaf length ([21]). The equation expressed GC as (eqn. 3):
where ρ is the density of air (kg m-3), CP is its specific heat (J K-1 kg-1), GC is canopy conductance (mm d-1), D is vapor pressure deficit (kPa), γ is the psychrometric constant (kPa K-1), and λ is the latent heat of water vaporization (J kg-1).
The modeled Gc calculated by the relationship between environmental conditions and ET was used as the reference in the estimation model. This model uses the sensitivity of Gc against environmental variables, and a set of limiting function was applied as follows ([19], [15], [37] - eqn. 4):
where f1(D), f2(Q), f3(Ta), and f4(θ) are functions expressing the responses of Gc to the daily mean vapor pressure deficit (D), photosynthetically active radiation (Q), air temperature (Ta), and soil water contents (θ), respectively. Each response was modeled as follows (eqn. 5 - eqn. 8):
where GCref is the reference value of Gc when D = 1.0 kPa, m is the slope between Gc and ln(D), δ is the parameter that determines the sensitivity of Q to limitations in Gc, Tmin, Tmax, and Topt are the minimum, maximum, and optimum Ta for GC, respectively, θmin is the soil water content where stomata are completely closed by soil water limitation, and θmax is the soil water content where limitation by soil water no longer exists. At first, the observed Gc was compared with D. Q was compared with GC divided by f1(D), Ta was compared with GC divided by f1(D) f2(Q), and θ was compared with GC divided by f1(D) f2(Q) f3(Ta).
All the above parameter values were estimated by the gradient-based L-BFGS-B algorithm in the “optim” function in R software ([36]), which minimizes the variance between the structural characteristics of the observed Gc and the estimated Gc. Of the parameters, GCref and m showed large variations between sites ([33], [17]). On the contrary, other parameters like δ showed very conservative characteristics regardless of the difference in stand structure ([9]). This indicates that structural characteristics of the stand can be assumed to be related to GCref and m, but not to the other parameters.
To test the compatibility of the stand transpiration model with various environmental and sapwood area conditions, three model parameter set-ups were compared with a four-year continually measured stand transpiration data from eight plots. The first model used optimized parameter values for each plot and each year (hereinafter, the E1 model). The second model used GCref and m estimated by the quadric relationship between SA and the other optimized parameter values in each plot in the first measurement year (hereinafter, the E2 model). The third model used the same values of GCref and m as the E2 model, with the mean values of the plots for the other parameters (hereinafter, the E3 model). The performance of each model was compared by the overall coefficient of determination for 4 years, and correlation coefficients were used to compare the performance of models on each growing season.
Statistical analysis
The sensitivities of sap flux density against environmental variables were tested before model development. The parameters for describing canopy conductance (Gc) response to D variations (GCref and m) were calculated with boundary-line analysis ([40]). The data recorded on low D (< 0.6 kPa) conditions were excluded in boundary-line analysis. The parameters for radiation sensitivity (δ) were determined by employing least-squares method on regressing the relationship between observed Gc divided by f1(D) and Q. The parameters for temperature sensitivity (Tmin, Tmax, and Topt) were also determined by least-square method on the regression of the relationship between observed Gc divided by f1(D) f2(Q) and Ta. The same method was applied on the parameters for soil moisture sensitivity (θmin and θmax) using observed Gc divided by f1(D) f2(Q) f3(Ta) and θ.
The performance of each model (E1, E2, and E3) was compared by an overall coefficient of determination for 4 years, and correlation coefficients, mean absolute error (MAE) and mean bias error (MBE) were used to compare the performance of models on each growing season. All analyses were conducted in R ([36]).
Results
Environmental variables
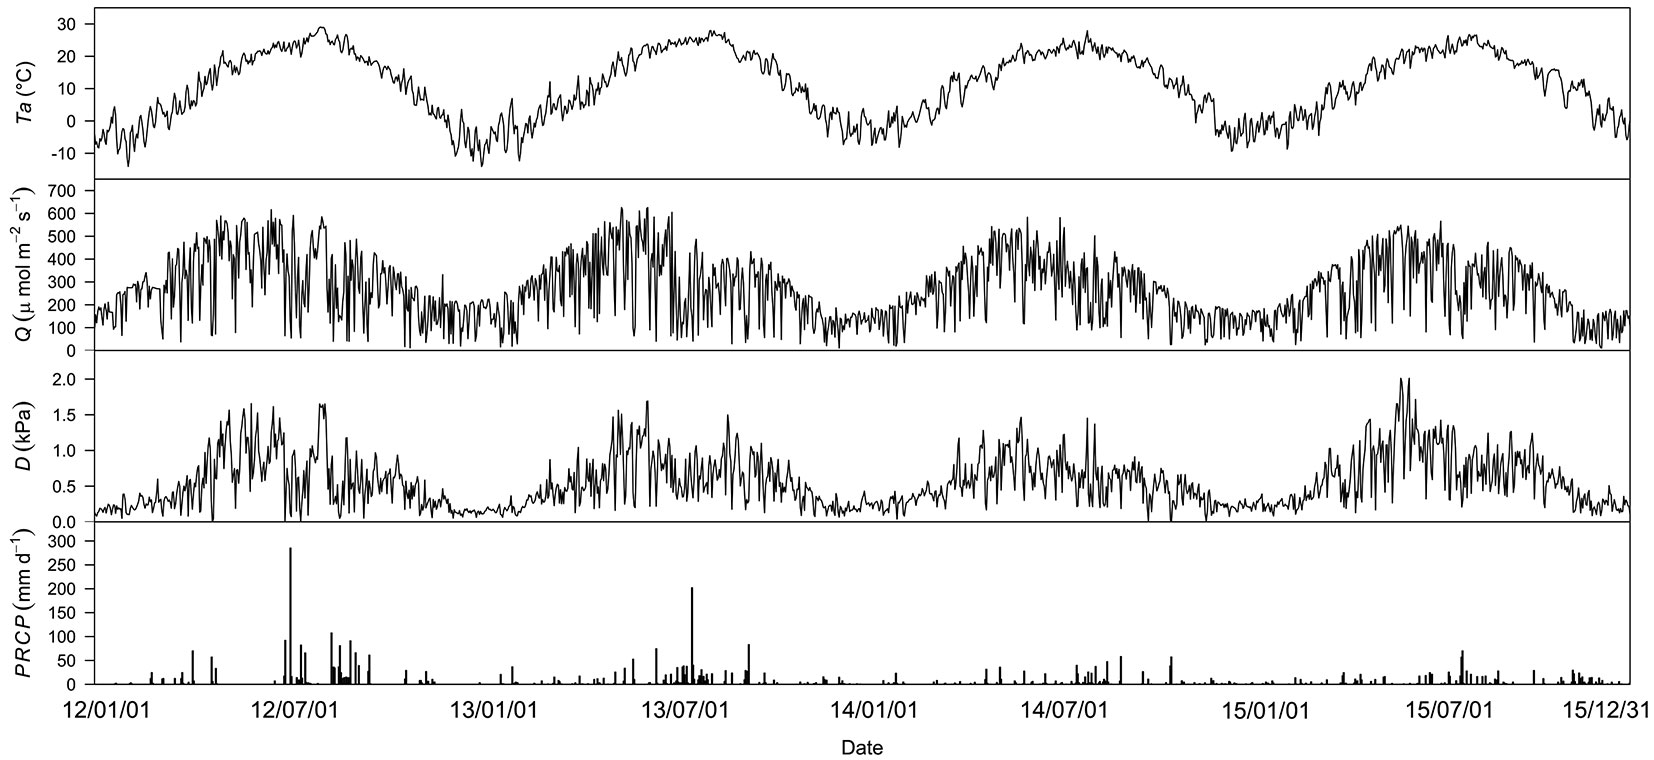
Environmental conditions showed interannual variations over the 4-year study period. Ta was similar during the study period (Fig. 1a). Annual mean Q highest in 2012 and lowest in 2014 (Fig. 1b). Notably, the annual mean D was similar among the first 3 years but was highest in 2015 (Fig. 1c). The first two years were generally wet and the last two years were dry (Fig. 1d). These conditions resulted in a distinct combination of environmental variables during the measurement years. In general, 2012 was a wet year with high light, 2013 was a wet year with low light, 2014 was a dry year with a humid atmospheric condition, and 2015 was a dry year with a dry atmospheric condition (Fig. 1a-d).
Fig. 1 - Meteorological conditions from 2012 to 2015. (a) Daily mean air temperature (Ta); (b) daily mean photosynthetically active radiation (Q); (c) daily mean vapor pressure deficit (D); (d) daily precipitation (PRCP).
Environmental constraints on canopy conductance
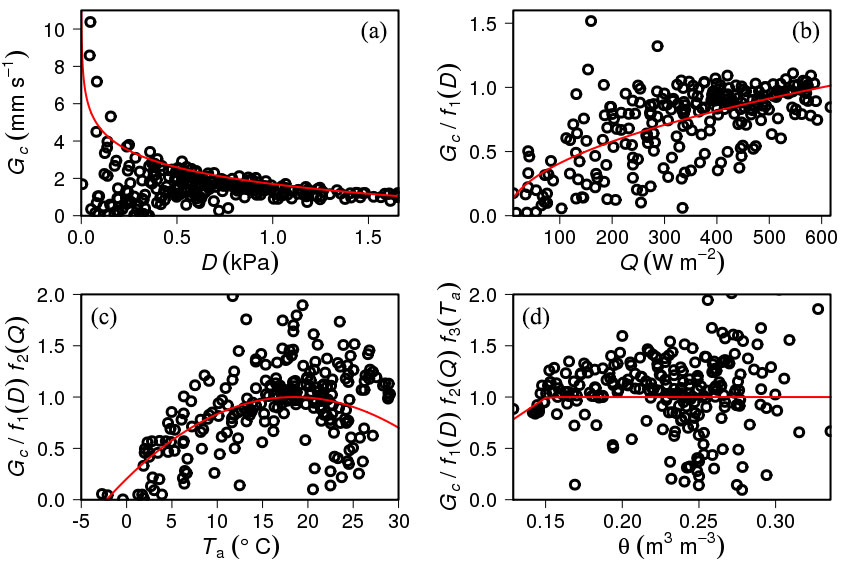
Fig. 2shows the relationships between environmental variables (D, Q, Ta, and θ) and canopy conductance (GC). Each plot in Fig. 1represents the limiting interaction of each environmental variable during the 2012 growing season. The results of P1 for the first measurement year are only shown here, but the same processes were conducted on other plots and for other years.
Fig. 2 - Relationships (a) between vapor pressure deficit (D) and canopy conductance (Gc), (b) between photosynthetic active radiation (Q) and GC divided by estimated GC using D only (f1(D)), (c) between air temperature (Ta) and Gc divided by estimated GC by using D and Q (f1(D)f2(Q)), and (d) between volumetric soil water content (θ) and GC divided by estimated GC by using D, Q, and Ta (f1(D)f2(Q)f3(Ta)). The red line in each plot indicates the function expressing the response of GC to D, Q, Ta, and θ, respectively. The data from single plot and single growing season were shown.
Relationship between parameter values and sapwood area
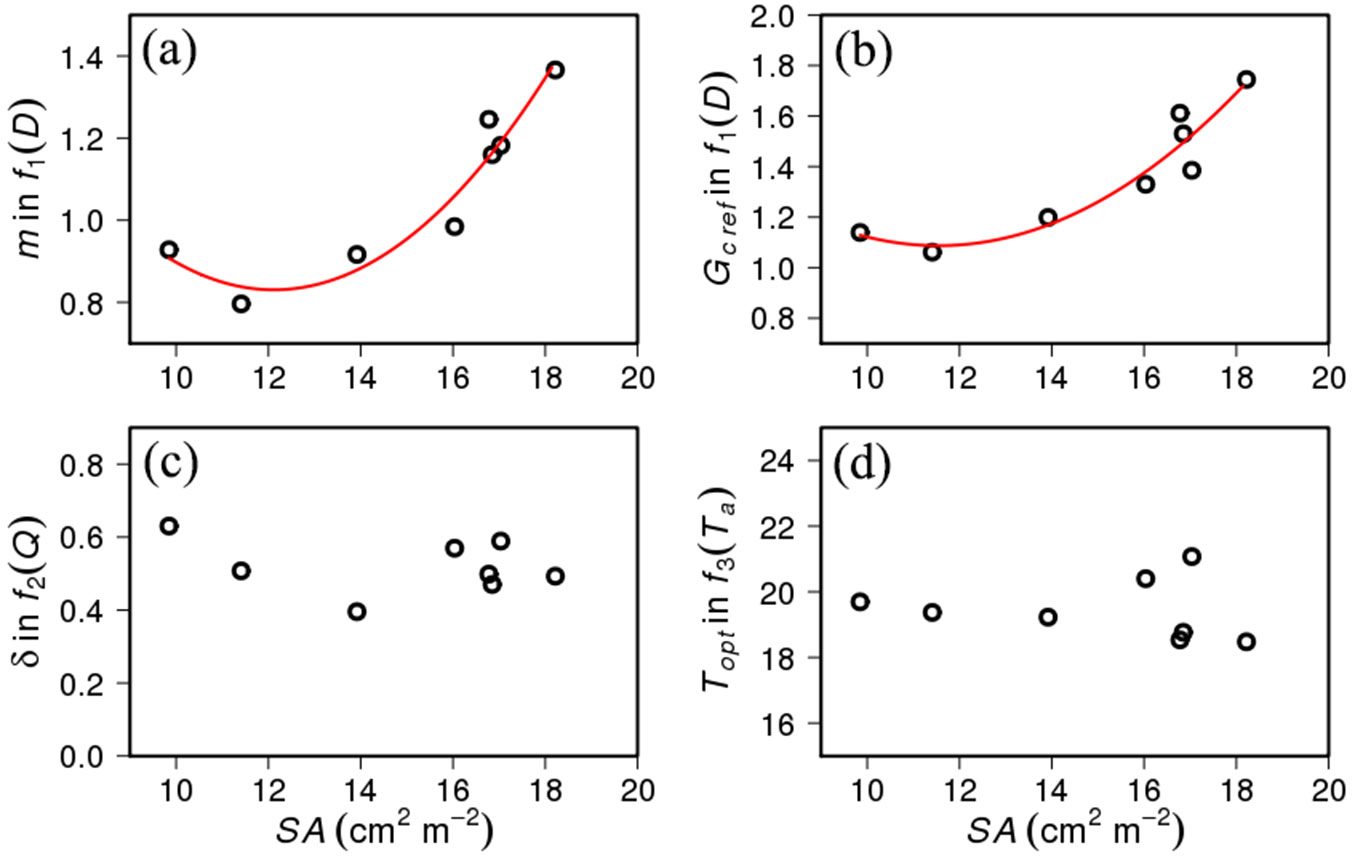
There were large inter-plot variations in m and GCref. The maximum values of m (1.37 mm d-1 kPa-1) and GCref (1.74 mm d-1) were approximately 70% higher than the minimum values of m (0.79 mm d-1 kPa-1) and GCref (1.06 mm d-1). δ showed a variation among the plots as well (maximum δ = 0.63 and minimum δ = 0.40). Topt exhibited a smaller variation among them than GCref, m, and δ (minimum Topt = 18.5 °C and maximum Topt = 21.1 °C).
The parameters m and Gcref showed significant correlations with the stand sapwood area (Fig. 3a, Fig. 3b). The second-order regression explains 90.5% of the variation in m (P < 0.001) and 85.8% of that in GCref (P < 0.001). The regression lines were determined as m = 0.014SA2 - 0.362SA + 3.02, and GCref = 0.014SA2 - 0.334SA + 3.016, respectively. The other two parameters did not show a significant correlation with the SA (Fig. 3c, Fig. 3d).
Fig. 3 - Relationship (a) between stand sapwood area (SA) and the slope (m) in f1(D), (b) between SA and reference canopy conductance (GCref) in f1(D), (c) between SA and the regression coefficient (δ) in f2(Q), and (d) between SA and optimum air temperature (Topt) in f3(Ta). The red lines indicate statistically significant regression between SA, and (a) m and (b) GCref, respectively.
Stand transpiration estimated by the combination of limiting functions
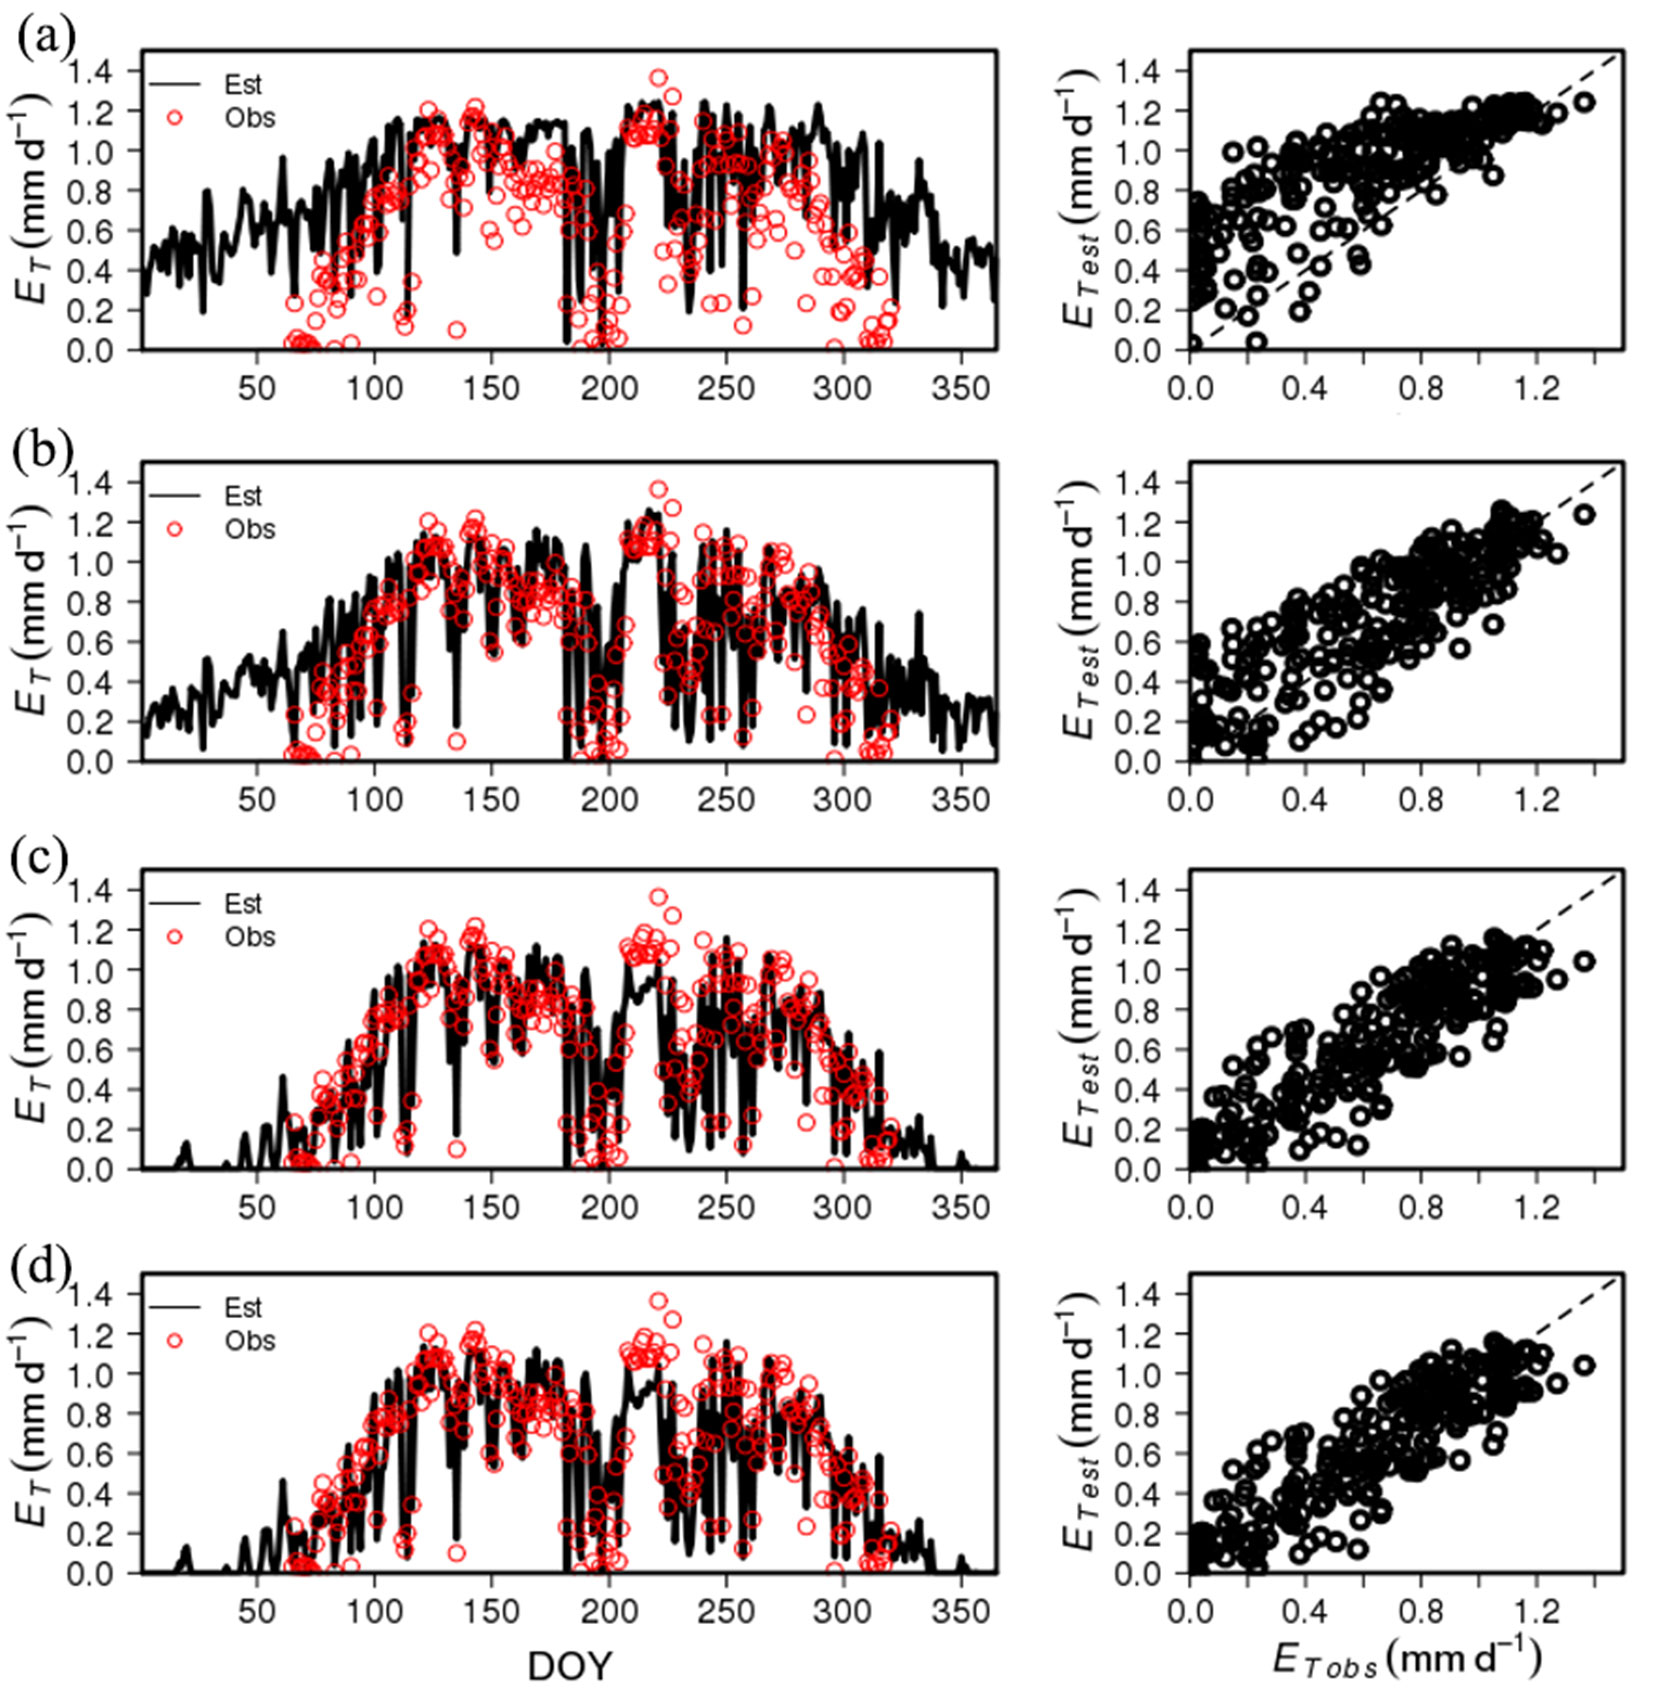
Fig. 4shows the serial time steps in the estimation of stand transpiration. At first, stand transpiration was calculated by canopy conductance estimated by using only f1(D). This caused an overestimation in the spring, monsoon, late autumn, and winter seasons, when Q was generally low, and resulted in a relatively low determination coefficient (adj. R2 = 0.624 - Fig. 3a). When limitation by Q was considered, errors in spring, monsoon, and autumn were reduced, but still showed considerable overestimation in winter. The determination coefficient was slightly increased (adj. R2 = 0.705 - Fig. 3b). These errors in winter decreased by considering a limitation by Ta. The estimated ET reproduced the seasonal variation in the observed ET, and the determination coefficient significantly increased (adj. R2 = 0.805 - Fig. 3c). The limitation by soil water content had little effect on stand transpiration estimation, and the determination coefficient slightly increased (adj. R2 = 0.807 - Fig. 3d).
Fig. 4 - Time series of observed daily transpiration (ET) for P1 in 2012 and ET estimated by stomatal conductance model (a) using D only, (b) D and Q, (c) D, Q, and Ta, and (d) using all of variables (D, Q, Ta and θ). The figures on the right side show the correlation between the estimated ET and observed ET.
Evaluating model performance
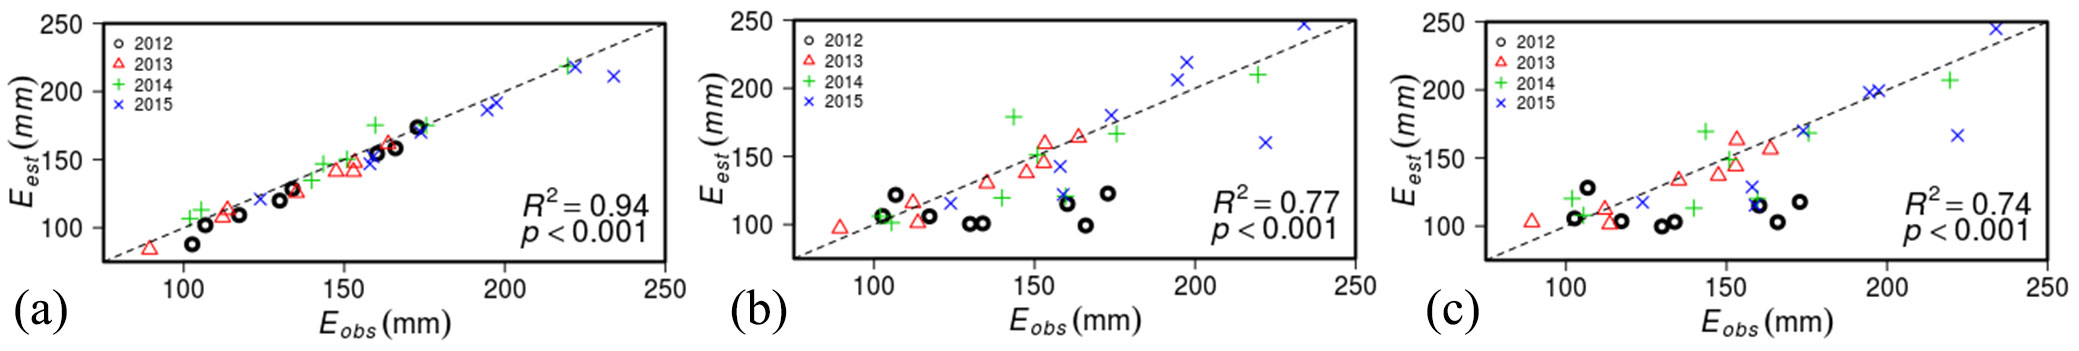
Fig. 5shows the relationship between the observed stand transpiration and estimated transpiration using an E1 model (Fig. 4a), E2 model (Fig. 4b), and E3 model (Fig. 4c). As parameters were estimated by less measurement data periods, model performance was decreased, but estimated ET by most simple model (E3) still showed good agreements with measured ET. The estimated ET by the optimized parameters for each year and plot was strongly correlated with the observed ET (r = 0.97, P < 0.001, MAE=9.33, MBE=-7.3). The use of SA-related parameters reduced the correlation between the estimated ET and observed ET (r = 0.88, P < 0.001, MAE=19.24, MBE= -10.76). The correlation coefficient showed a reduction over year, and was the highest in 2012 (r = 0.98, P < 0.001) and the lowest in 2014 (r = 0.80, P = 0.016). The other two years showed intermediate correlations (in 2013, r = 0.87, P = 0.005, in 2015, r = 0.82, P = 0.012). The use of the plot’s mean parameter values slightly reduced the correlation coefficient (r = 0.86, P < 0.001, MAE=19.24, MBE=-12.25). Same in the previous model, the correlation was highest in 2012 (r = 0.96, P < 0.001) and lowest in 2014 (r = 0.73, P = 0.039).
Fig. 5 - Relationship between observed annual stand transpiration for 4 years (2012-2015) and estimated stand transpiration from 8 plots by E1 model (a), by E2 model (b), and by E3 model (c).
Interannual variation in parameters
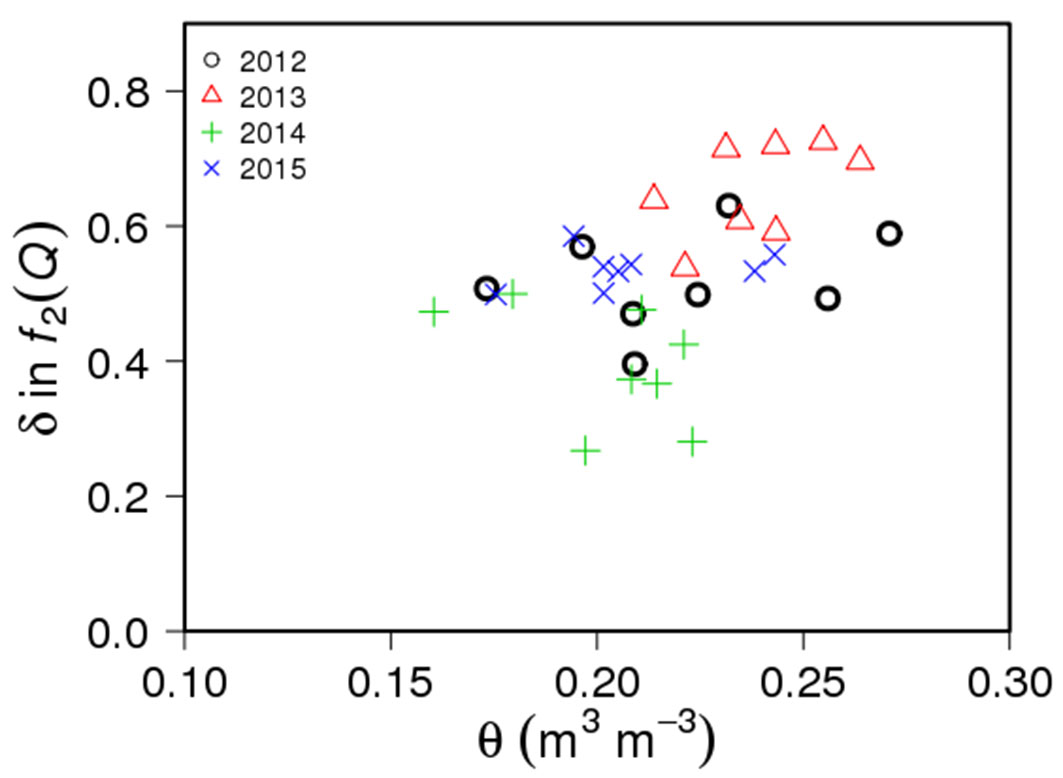
In general, the parameter values in each limiting function were relatively conservative and showed minor interannual variations (Fig. 6, Tab. S1 in Supplementary material). The m and GCref showed similar relationships with SA during 4 growing seasons, and less variation was observed in GCref than m. The radiation sensitivity, δ, showed relatively large interannual variation than other parameters (Fig. 6c). These interannual variations in δ were related to the annual mean θ (Fig. 7). The θ variation does not explain the inter-plot differences in δ, but the mean δ was highest in 2013 when annual mean θ was the highest and was lowest in 2014 when θ was the lowest.
Fig. 6 - Interannual variation in relationship between (a) stand sapwood area (SA) and the slope (m) in f1(D); (b) SA and reference canopy conductance (GCref) in f1(D); (c) SA and regression coefficient (δ) in f2(Q); and (d) SA and optimum air temperature (Topt) in f3(Ta).
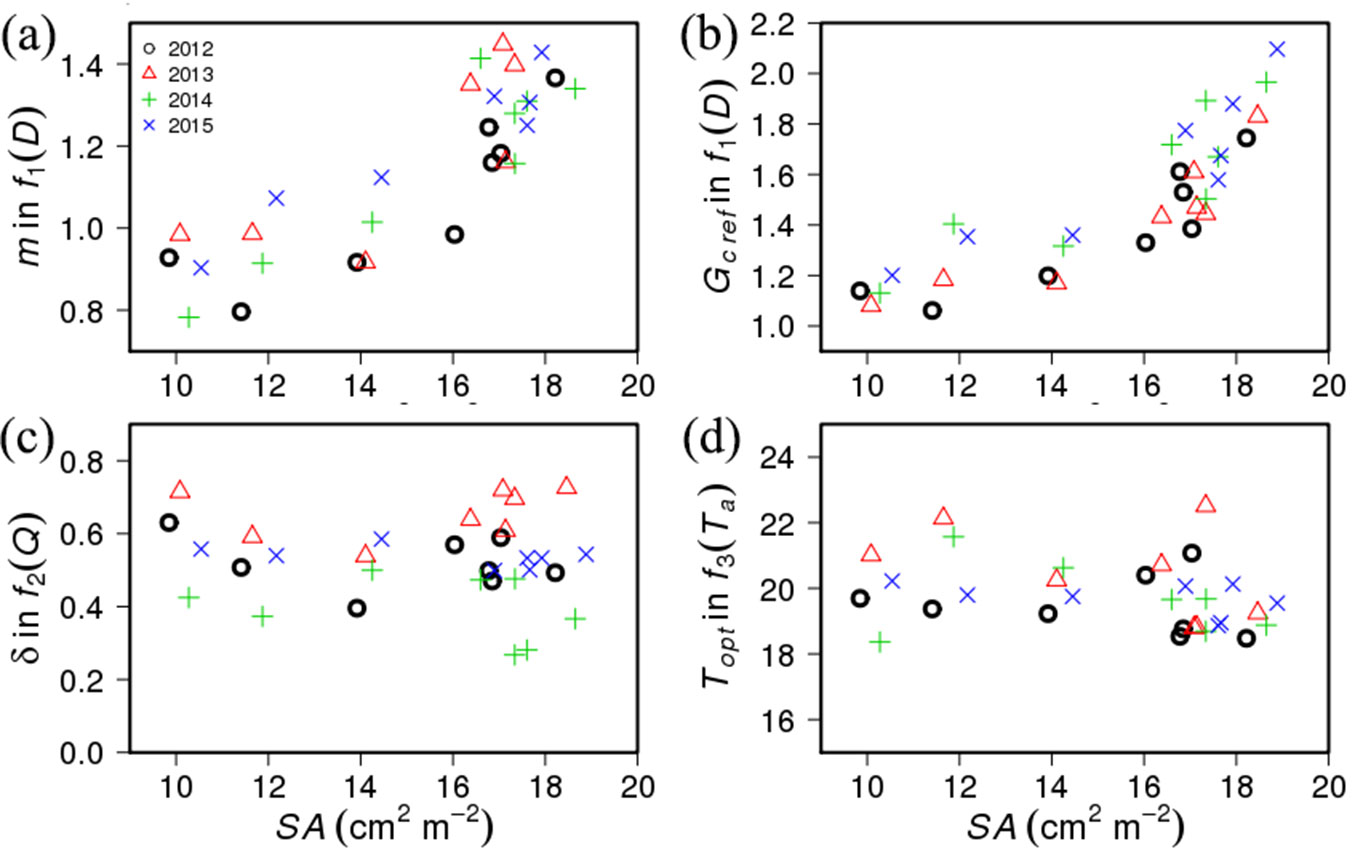
Fig. 7 - Relationship between interannual variation of parameter for canopy conductance sensitivity to radiation (δ) and annual mean soil water content (θ) of each plot.
Discussion
Sensitivity of canopy conductance to environmental and structural variables
The developed stand transpiration model successfully reproduced interannual and seasonal variations in the observed ET in eight plots with different sapwood areas for four years (Fig. 4, Fig. 5). D was the most significant limiting factor in canopy conductance and explained 62% of temporal variations in ET alone. The incorporation of limitations by other environmental variables increased model performance slightly (Fig. 4b, Fig. 4c), but θ did not influence ET estimation (Fig. 5d). One reason that the relation between soil water status and ET is not significant may be that θ is not a limiting factor in investigated forests, or at least during the first measurement period (during the 2012 growing season) when empirical relationships are analysed. The θ-related reduction in GC was not observed in other temperate forests ([24]), but significant soil water limitation effects have been reported elsewhere ([43], [22]).
The increased model performance in spring, autumn, and monsoon season by incorporation of Q limitation (Fig. 4b) is caused by water availability. The Asian monsoon region generally experiences dry periods before and after summer monsoon ([50]), and this could lead to a decline in hydraulic conductance by embolism associated with D stress ([7]). Monsoon reduces water stress, and tree water use is further affected by the available energy. Limitation due to Ta has a dominant effect on Gc in winter and early spring. GC shows its optimum under Ta conditions between 15 to 20 °C ([11]), and starts decreasing when Ta is below 15 °C ([13]).
GCref and m showed significant interactions with stand sapwood area (Fig. 3). In general, GCref has a positive relationship with stand leaf area, the ratio of sapwood-to-leaf area, and the inverse of canopy height ([31]). However, the GC-SA relationship found in this study was different from that of previous studies, which reported saturation of canopy conductance at high LAI (> 6 m2 m-2 - [14]). This was due to low stand density and sapwood area. The LAI estimated by a site-specific allometric equation ([39]) ranged from 1.93 to 4.41 (Tab. 1) and was much lower than the reported LAI (≈6) at saturation of the observed GC.
Interannual variation in parameters
The conservative characteristics of parameter values in each limiting function (Fig. 6) was partly caused by the physical characteristics of the target species. Pinus species generally showed isohydric characteristics ([23], [38]). They constantly regulated water loss within certain ranges to reduce the variation in leaf water potential ([4]). In isohydric species, GCref and m showed a conservative relationship, regardless of the difference in species and climatic conditions ([32], [8]), which was also shown in this study. Furthermore, leaf water potential was considered to be regulated within relatively constant ranges regardless of soil water status. This led to similar relations between D and GC under a variety of climatic conditions. These results were different from the previous study which reported interannual variations in D sensitivity with soil moisture conditions ([45]). However, the limited effects of soil moisture were also reported due to the use of deep soil water under drought periods ([35]), or monsoon caused moist conditions when atmospheric evaporative demand was high in the summer season.
There was an interaction between interannual variations in radiation sensitivity (δ) and soil water availability (θ - Fig. 7). Both soil water availability and energy input by radiation control the forest transpiration, and the relative importance between them could vary by soil water conditions. Under sufficient soil water conditions, radiation limits the transpiration which causes higher GC sensitivity to radiation, but the sensitivity could be reduced when transpiration was limited by soil water availability.
The model that used the site-specific and year-to-year parameter values showed the best performance. However, the models using estimated or general mean parameter values also showed acceptable (r2 > 0.74) performance in annual stand transpiration estimation.
Limitations
Empirical approaches exhibit reasonable performance in limited ranges of environmental conditions. As they have been developed under constrained ranges of environmental conditions, extreme climatic conditions like drought reduce their capability in terms of estimations of Gc ([10]). Thus, the applicable range of empirical models depends on the generality of the observed relationship and the range in which it is valid.
There are sources of uncertainty in upscaling from sapflux density measurements to stand transpiration. Although the measured radial and circumferential variations of sapflux density ([29]) were used for upscaling, the assumption of similar radial variations, regardless of stand sapwood area, could be invalid because they can be significantly altered by stand density ([28]). Moreover, the relationship between SA and LAI can be affected by stand density. In less competitive plots, trees can access more water and nutrients and allocate more biomass to above-ground. This could make trees support more leaf area per unit basal area in low-density stands ([41]). The assumption of same sapwood depth regardless of tree size could also increase the uncertainty of stand transpiration estimation. However, due to even-aged stand conditions and similar canopy positions in this study, differences in sapwood depth among trees may be small. Moreover, since most of sap was transported through the outer sapwood area, uncertainties in inner sapwood depth did not result in large errors in stand transpiration estimation.
In the simplification of the Penman-Monteith equation, aerodynamic conductance is assumed to be infinite. This assumption is generally accepted for coniferous forests ([16]), but forest stand structures and surface roughness affect aerodynamic conductance. As a result, applying the simplified Penman-Monteith equation on a stand with low aerodynamic conductance causes an overestimation of canopy conductance.
Implications for forest management
Similar methods have been applied to predict ET at various sites ([14], [2]). However, the empirical relationships in those studies could not be directly applied to other specific forests or tree species. The ET model developed in this study can be very useful to estimated changes in ET in Korean pine forests with forest management-induced structural changes.
The ET model helps estimate spatial variation in ET and total forest water use with the combined use of a forest digital map and National Forest Inventory data. The most powerful aspect of this model is the use of the simple and easily measurable forest structural variable (SA). However, this model application is constrained to Pinus koraiensis forests at present. The direct application of the empirical relationship found in this study to other types of forest can generate erroneous estimations of ET, but the concept underlying it is useful for developing an ET model for forests composed of other species.
Furthermore, this model can help to estimate forest productivity when combining stand water use with water use efficiency estimated by other approaches such as stable isotope discrimination measurements ([46], [48]).
Conclusion
This study found the main environmental constraint in stand transpiration and developed a stand transpiration model that related the stand structural variable with canopy conductance. The stand transpiration was regulated mostly by vapor pressure deficit. The stomatal sensitivity to vapor pressure deficit and reference canopy conductance were increased with stand sapwood area. The model successfully reproduced changes in stand transpiration against changes in stand sapwood area and climatic conditions.
The results indicate that measurement on a single growing season on stands with various sapwood areas can generate a reliable stand transpiration model for mono-species’ forests. Moreover, the use of simple forest structural variables can lend generality to this method and enable an easy application to other forests. This can help us understand the mechanisms underlying spatial and temporal variations in forest water use.
Acknowledgments
This work was supported by Korea Forest Service (S211315L020120, S111215L020110, 2020185D10-2022-AA02) and Korea Meteorological Administration (KIMPA-2012-0001-2). We are also thankful for supports of the Mt. Teahwa Seoul National University Forest and its staff.
References
Gscholar
CrossRef | Gscholar
CrossRef | Gscholar
CrossRef | Gscholar
Gscholar
Authors’ Info
Authors’ Affiliation
Hyun Seok Kim
National Center for Agro Meteorology, Seoul (Rep. of Korea)
Daun Ryu 0000-0002-0782-0859
Department of Forest Sciences, Seoul National University, Seoul (Rep. of Korea)
Interdisciplinary Program in Agricultural and Forest Meteorology, Seoul National University (Rep. of Korea)
Department of Earth and Environment, Boston University, Boston, MA (USA)
Corresponding author
Paper Info
Citation
Park J, Cho S, Moon M, Ryu D, Kim HS (2021). Developing stand transpiration model relating canopy conductance to stand sapwood area in a Korean pine plantation. iForest 14: 186-194. - doi: 10.3832/ifor3291-014
Academic Editor
Rossella Guerrieri
Paper history
Received: Nov 12, 2019
Accepted: Feb 08, 2021
First online: Apr 14, 2021
Publication Date: Apr 30, 2021
Publication Time: 2.17 months
Copyright Information
© SISEF - The Italian Society of Silviculture and Forest Ecology 2021
Open Access
This article is distributed under the terms of the Creative Commons Attribution-Non Commercial 4.0 International (https://creativecommons.org/licenses/by-nc/4.0/), which permits unrestricted use, distribution, and reproduction in any medium, provided you give appropriate credit to the original author(s) and the source, provide a link to the Creative Commons license, and indicate if changes were made.

Web Metrics
Breakdown by View Type
Article Usage
Total Article Views: 37383
(from publication date up to now)
Breakdown by View Type
HTML Page Views: 30675
Abstract Page Views: 3339
PDF Downloads: 2681
Citation/Reference Downloads: 3
XML Downloads: 685
Web Metrics
Days since publication: 1900
Overall contacts: 37383
Avg. contacts per week: 137.73
Article Citations
Article citations are based on data periodically collected from the Clarivate Web of Science web site
(last update: Mar 2025)
Total number of cites (since 2021): 1
Average cites per year: 0.20
Publication Metrics
by Dimensions ©
Articles citing this article
List of the papers citing this article based on CrossRef Cited-by.
Related Contents
iForest Similar Articles
Research Articles
Allometric models for the estimation of foliage area and biomass from stem metrics in black locust
vol. 15, pp. 281-288 (online: 27 July 2022)
Research Articles
Leaf transpiration of drought tolerant plant can be captured by hyperspectral reflectance using PLSR analysis
vol. 9, pp. 30-37 (online: 05 October 2015)
Research Articles
Links between phenology and ecophysiology in a European beech forest
vol. 8, pp. 438-447 (online: 15 December 2014)
Research Articles
Canopy temperature variability in a tropical rainforest, subtropical evergreen forest, and savanna forest in Southwest China
vol. 10, pp. 611-617 (online: 17 May 2017)
Research Articles
Gas exchange characteristics of the hybrid Azadirachta indica × Melia azedarach
vol. 8, pp. 431-437 (online: 17 December 2014)
Research Articles
Effects of mild drought on the morphology of sun and shade needles in 20-year-old Norway spruce trees
vol. 12, pp. 27-34 (online: 10 January 2019)
Research Articles
Drought tolerance in cork oak is associated with low leaf stomatal and hydraulic conductances
vol. 11, pp. 728-733 (online: 06 November 2018)
Research Articles
Coupling daily transpiration modelling with forest management in a semiarid pine plantation
vol. 9, pp. 38-48 (online: 06 August 2015)
Research Articles
Oak sprouts grow better than seedlings under drought stress
vol. 9, pp. 529-535 (online: 17 March 2016)
Research Articles
Testing a dual isotope model to track carbon and water gas exchanges in a Mediterranean forest
vol. 2, pp. 59-66 (online: 18 March 2009)
iForest Database Search
Search By Author
Search By Keyword
Google Scholar Search
Citing Articles
Search By Author
Search By Keywords
PubMed Search
Search By Author
Search By Keyword


