Density management diagram for teak plantations in Tabasco, Mexico
iForest - Biogeosciences and Forestry, Volume 10, Issue 6, Pages 909-915 (2017)
doi: https://doi.org/10.3832/ifor2247-010
Published: Dec 01, 2017 - Copyright © 2017 SISEF
Research Articles
Abstract
Density management diagrams are valuable tools for managing specific forest species. The aim of this study was to obtain a density management diagram for teak (Tectona grandis L.) plantations in the State of Tabasco in Mexico. To achieve this objective, a set of 10 plantations were studied, in which 42 plots were established. Two equations were fitted simultaneously, including one related to the quadratic mean diameter, stand density and dominant height and the other which related the total stand volume to the quadratic mean diameter, stand density and dominant height. The results showed that the diagram had an acceptable predictability, thus indicating its usefulness and accuracy in planning silvicultural interventions. This diagram is a very powerful tool that can enable stakeholders to manage teak plantations in the State of Tabasco.
Keywords
Silvicultural Interventions, Stand Density Diagram, Quadratic Mean Diameter, Tectona grandis
Introduction
The determination of maximum stand densities can be useful in fulfilling the aims of silvicultural management. Normally, these densities are only reached in forests that are not subject to forestry interventions, in which stand growth occurs at the expense of the death of a proportion of individual trees. Indeed, the study of stand density is one of the most important aspects of forest science, which guides stand management, predicts stand growth over time and helps determine how stands will respond to operational forestry practices.
In recent decades, a variety of management tools has been developed to obtain information about stand density. One of these tools is the density management diagram (DMD), which represents graphic yield, density and mortality at various stages of stand development. It presents the relationship between the number of trees per hectare, dominant height, volume and quadratic mean diameter, and includes a series of reference curves for different levels of site occupancy. DMDs are extremely useful for describing the current condition of a stand, which are compared to other conditions according to pre-specified management objectives ([26]). In addition, they can be valuable tools for facilitating adequate planning, monitoring silvicultural interventions and maximizing site use by guiding the appropriate manipulation of competition levels within the stand ([18], [30]).
The first generation of stand density management diagrams was developed by Ando ([1]) in Japan for red pine. Subsequently, there have been several modifications and improvements, including the replacement of original production, the introduction of density equations and the application of different density indexes ([20], [23], [22]). Moreover, during the early to mid-1990s, DMDs were developed for even-aged plantation stands containing a number of additional species by employing earlier modelling approaches, including the development of DMDs for mixed species stands ([22], [31], [19], [7]).
In the State of Tabasco, Mexico, the number of commercial teak plantations established for industrial purposes has increased considerably in recent years; they represent 4% of all commercial plantations in 2005 ([11]). According to the CONAFOR ([6]) website, commercial teak plantations grew to represent 15% of all commercial forest plantations in Mexico. In the State of Tabasco, this percentage is higher, with a value of 29% between the years 2000 and 2014.
In Mexico, teak industrial plantations have increased their importance. Over time, the management model has changed from low-cost and long-term to intensive, with a short rotation, instead of traditional management procedures. For example, soil preparation before planting, fertilization programs, and thinning and pruning, among other factors, are components for the new style of management ([5]). Companies such as Proteak and Santa Genoveva use highly improved materials in intensively managed plantations, including compost and other fertilizers. In Tabasco and Campeche States, they also occasionally use drip irrigation to obtain maximum tree growth and shorten the period of rotation.
Under intensive management, acceptable teak rotations range from 15 to 25 years to obtain approximately 200 trees ha-1 at the end of rotation. Growth rates for commercial volumes vary from 6 m3 ha-1 year-1 to a maximum of 15 m3 ha-1 year-1 ([5]). A reasonable estimate for sites of average and high quality is 10 m3 ha-1 year-1 ([5]). According to De Camino et al. ([8]), 20 m3 ha-1 can be extracted from the lower limit of yield potential of a plantation in the first thinning, but this volume is not merchantable. In a second thinning, 30 m3 ha-1 can be extracted, and this volume is suitable for the market. In the final cut, up to 70 m3 ha-1 can be obtained, so the total production is approximately 120 m3 (an average of 6 m3 ha-1 year-1). From an average of yield potential plantation, 30 m3 ha-1 is expected in the first thinning (not merchantable), 40 m3 ha-1 in the second thinning and 130 m3 ha-1 in the final cut, i.e., a total of 200 m3 ha-1 (an average of 10 m3 ha-1 year-1).
Due to the limited research about the management of these plantations in the State of Tabasco, there is a need to produce a density management diagram locally, but few data are available. Therefore, this work is a first approximation in order to provide management alternatives by developing a density management diagram for T. grandis in this region.
Materials and methods
Study area
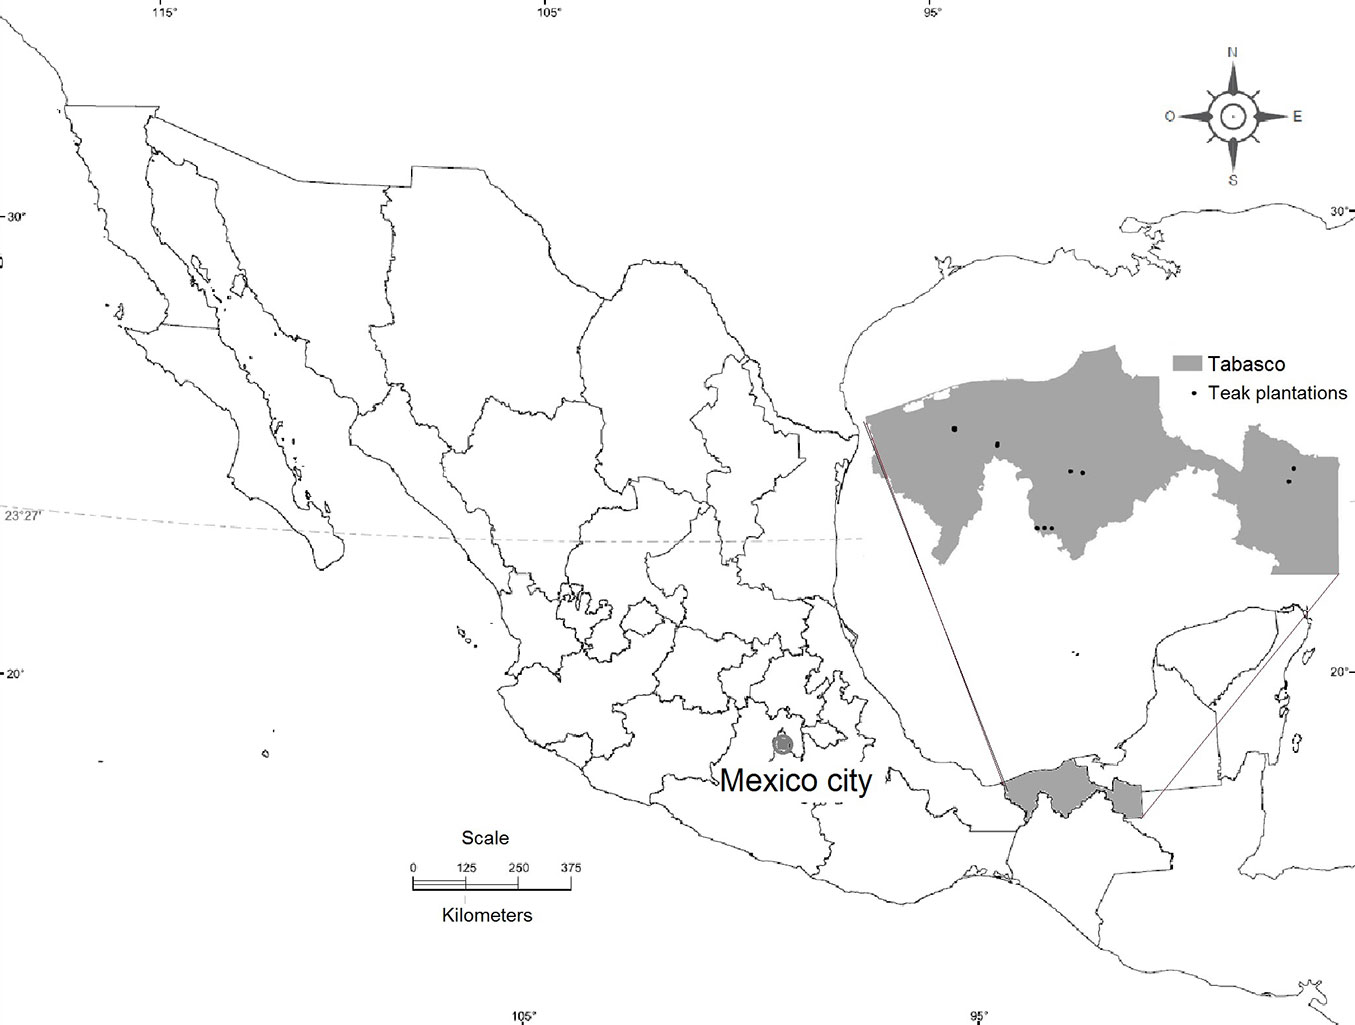
The study area was located in the State of Tabasco, Mexico (Fig. 1), in the municipalities of Cunduacán, Teapa, Jalapa, Cardenas and Balancán. The sampling sites were located in Rancho Hawai, Rancho la Reforma, Falcón 100, Falcón 300, Jacinto, Bocanegra, Rancho San Agustín, Rancho Bellavista, C-16 and Santandreu. The environment of Tabasco consisted of the following forest formations: high evergreen forest, medium evergreen forest, low deciduous forest, low flooded forest (canacohital), tinto forest and gallery forest ([13]). The most important soils were Vertisols, Regosols, Solonchak, Gleysols, Cambisols, Fluvisols, Rendzinas and Acrisols ([14]). The teak plantations are mainly installed on cattle ranches. Today, ancient jungles (high evergreen forest, medium evergreen forest, low deciduous forest) that were converted into pastureland for cattle 40 years ago, retrieve their forest use. Teak plantations are established on neutral soils or slightly basic, rich and well drained, which are the most appropriate for the species.
Data
The data were collected from 42 sample plots among 10 teak plantations, which represent the extensive silvicultural sites in Tabasco State. A total of 3177 trees were measured. The oldest plantations were established in 1994 and the youngest in 1999. The diameter at breast height (dbh) and the total height (ht) of all of the trees in the plots were measured using a caliper and a Haga’s hypsometer, respectively. The majority of measurements were taken using a 0 × 4 m frame in plots with 100 trees, representing a total of 625 trees ha-1. However, due to the diverse planting patterns, some plots varied in surface area, and the distance between trees ranged from 2.5 × 2.5 to 6 × 6 m.
The sample plots used in this study were installed to perform extensive management. The vegetation material was collected from selected mother trees, but there was no control over the progeny or complete fertilization. The density that maximized the growth of individual trees was not considered, but the density that maximized stand growth was taken under consideration. For this reason, the rotation period was approximately 30 years.
The following stand variables were calculated for each plot: density (number of trees per hectare, N), quadratic mean diameter (Dg), mean diameter (D), dominant height (Ho, defined as the mean height of the 100 thickest trees per hectare), total plot volume (V) and Reineke index (SDI). The volume of each individual tree was calculated using the equation proposed by Mora & Gómez ([21]) for teak plantations in Costa Rica and expanded to account for hectares (eqn. 1):
where v is the tree volume (m3); dbh is the diameter (cm) at the breast height (1.30 m); and ht is the total tree height (m).
The main characteristics of the stand variables are shown in Tab. 1.
Tab. 1 - Main characteristics of the teak plantation plots (n= 42). (N): number of trees per unit area (trees ha-1); (Dg): quadratic mean diameter (cm); (V): volume per unit area (m3 ha-1); (Ho): dominant height (m); (SDI): Reineke index.
| Parameter |
N
|
D g |
V
|
H o |
SDI |
|---|---|---|---|---|---|
| Mean | 705 | 22.01 | 191.22 | 18.81 | 496.74 |
| Standard Deviation | 411.49 | 5.7 | 79.41 | 3.69 | 189.14 |
| Minimum | 181 | 9.2 | 50.21 | 11 | 195.22 |
| Maximum | 1800 | 29.9 | 355 | 26.9 | 831.22 |
Statistical analysis
Two non-linear equations (eqn. 2 and eqn. 3) were fitted to develop the DMD. eqn. 2 linked the quadratic mean diameter to the number of trees per hectare and the dominant height of the stand, and eqn. 3 linked the stand volume to the quadratic mean diameter, the dominant height of the stand and the number of trees per hectare (eqn. 2, eqn. 3):
where Dg is the quadratic mean diameter (cm); N is the stand density (trees ha-1); Ho is the dominant height (m); V is the volume (m3 ha-1); βi (i = 0 - 6) is the regression coefficients.
This system of the two equations was fitted simultaneously. The fitting was assessed by the statistical parameters SSE (the sum of the square of residuals) and R2 (the determination coefficient). The whole process was performed using the R-project (SQLDF package - [27]).
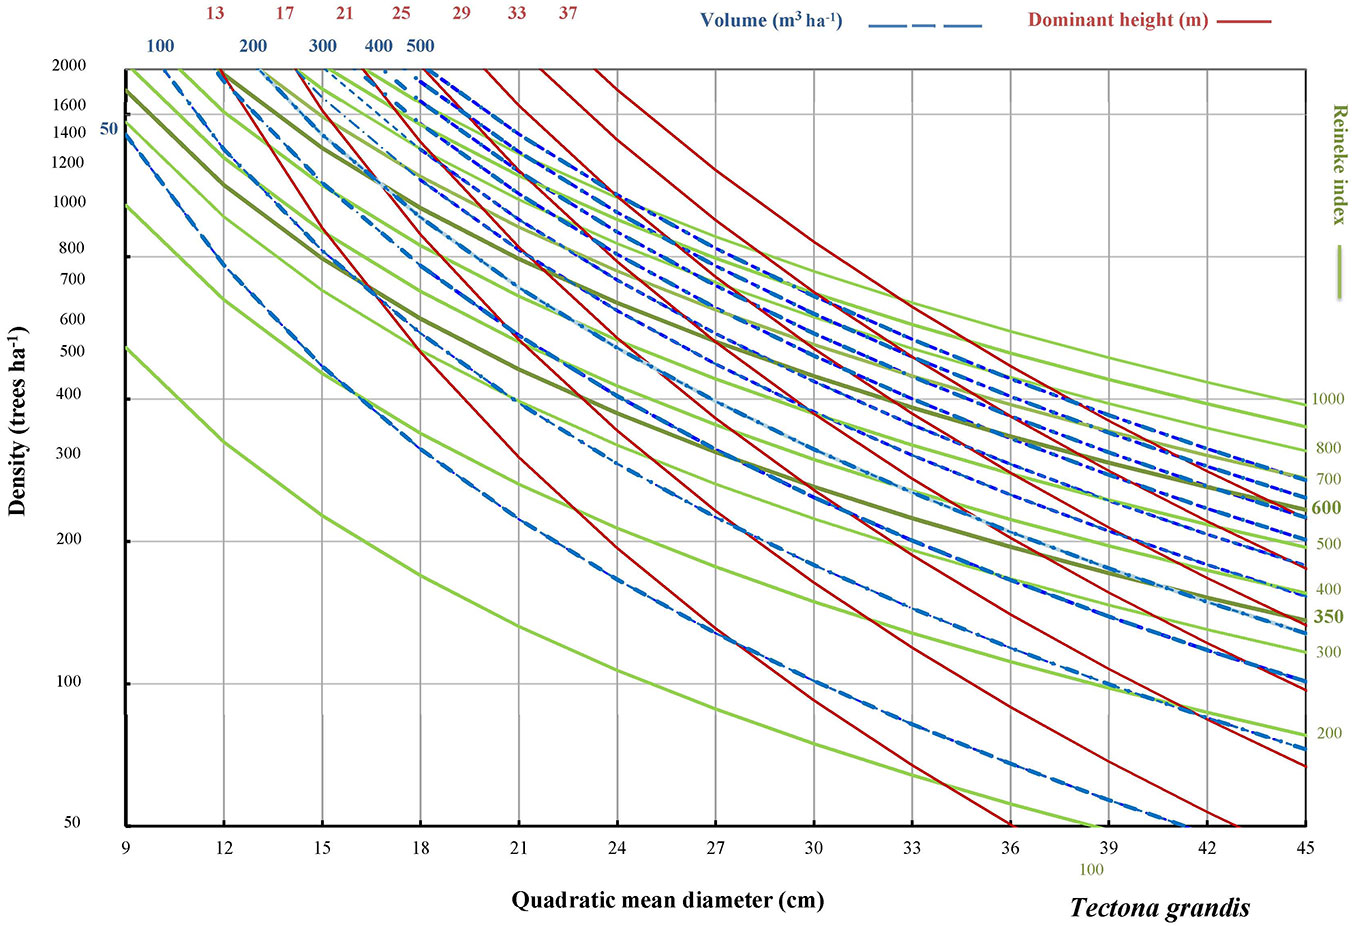
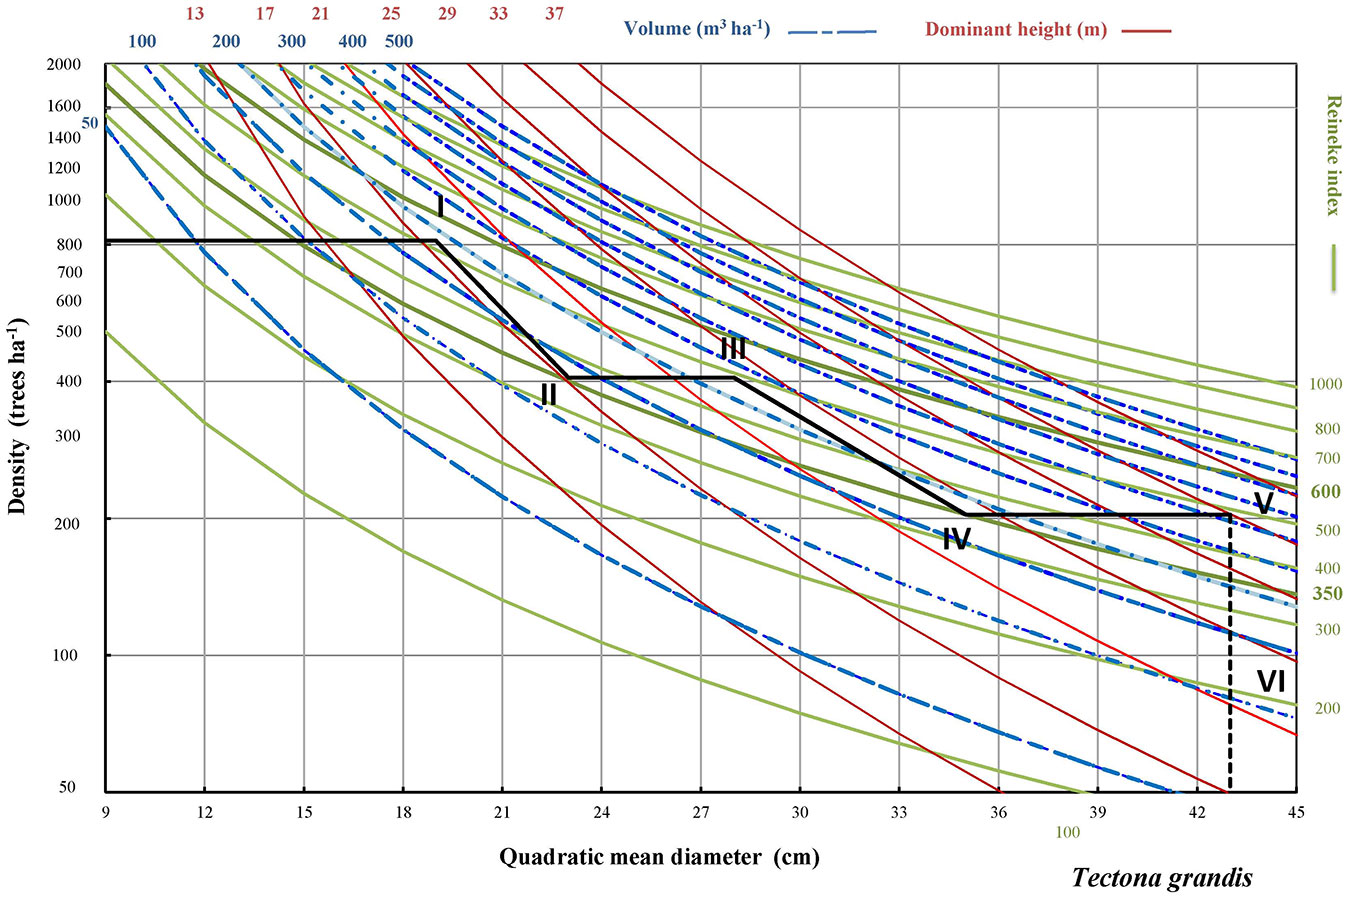
The equations fitted were also presented graphically. The quadratic mean diameter was linearly represented on the x-axis, while the number of trees per hectare was logarithmically represented on the y-axis. The isolines representing the dominant height, the volume and the Reineke density index were overlaid on the graph. However, the relative stand density isolines were plotted to represent different limits of stand management (60% and 35%). The DMD for teak plantations in Tabasco was created following the methodology proposed by Barrio-Anta & Alvarez-González ([3]) and Valbuena et al. ([33]). Natural mortality was not considered, and the trajectory of the density size line was parallel to the x-axis ([20], [10], [3]).
To determine the maximum density of Reineke, data of previous researchers from Latin America was considered ([2], [25], [29]). We averaged the values found by these authors and then we made a proposal for teak plantations in Tabasco that was 1000.
Results
The results of the simultaneous fitting process are shown in Tab. 2. The two equations showed good values for the parameters sum of square error and coefficient of determination, but the coefficient of determination value for the volume equation was greater, implying a greater predictive power than the quadratic mean diameter. Estimators were significant at the 5% level (Tab. 2), thus the non-linear two-equation model was selected to develop the DMDs for teak plantations in Tabasco.
Tab. 2 - Results of the non-linear regression coefficients obtained by simultaneous fitting. (SSE): sum of square error; (R2): coefficient of determination.
| Equation | Parameter | Estimator | Error |
|---|---|---|---|
| Eqn. 2 | β 0 |
22.5097 | 8.4916 |
β 1 |
0.301 | 0.0338 | |
β 2 |
0.6432 | 0.1078 | |
| SSE | 2957 | - | |
| R2 | 0.7785 | - | |
| Eqn. 3 | β 3 |
0.000493 | 0.000307 |
β 4 |
1.6307 | 0.1351 | |
β 5 |
0.6976 | 0.1008 | |
β 6 |
0.9009 | 0.0501 | |
| SSE | 127595 | - | |
| R2 | 0.9506 | - |
The DMD was created by overlaying the Reineke index, the dominant height and the volume lines for the 42 study plots (Fig. 2). The dominant height axis ranged from 13 to 37 m, whereas quadratic mean diameter ranged from 9 to 45 cm. The density axis varied from 50 to 2000 trees ha-1 on a logarithmic scale. The volume ranged from 50 to 500 m3 ha-1 and the values on the Reineke index axis from 100 to 1000. Therefore, using the DMD, the dominant height, the volume and the Reineke index values could be obtained through stand number of trees and quadratic mean diameter.
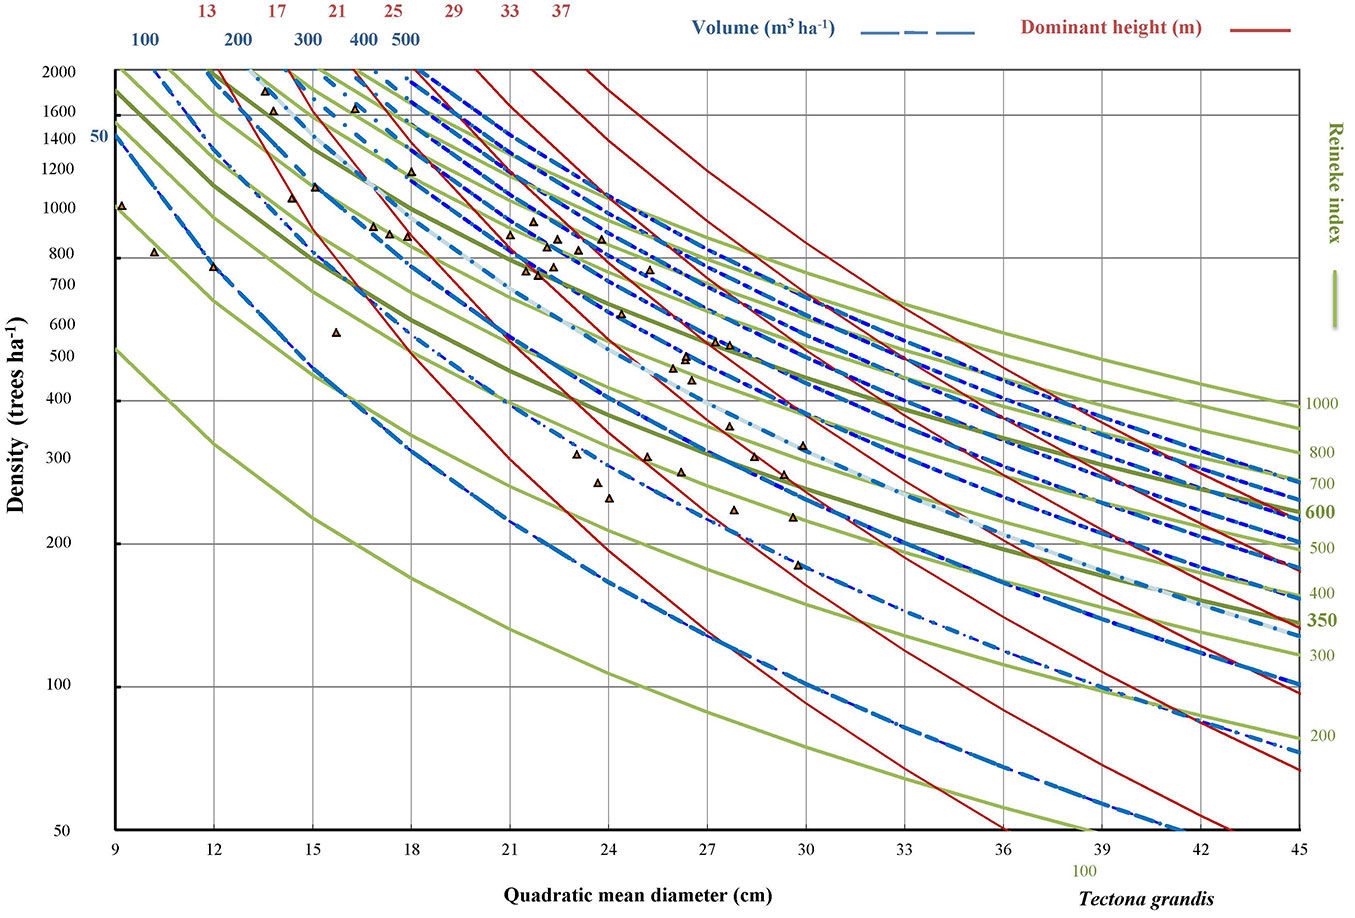
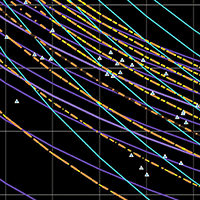
Fig. 3 shows the quadratic mean number and number of trees values from the 42 plots and the relative proportion of the plots according to their Reineke index intervals. The points located above 60% Reineke index represent the plots that should have been thinned previously. There were a total of 14 plots, representing 33.3% of the total number of plots. The points located within the interval between 35% and 60% Reineke index represented the plots that currently must be thinned (16 plots), which represented approximately 38.1% of the total. Finally, the points below the lower Reineke index limit were the plots requiring no intervention at this time, 28.6% of the sample plots, indicating that they were young plots.
Fig. 3 - Relationship between the quadratic mean diameter and the log of density of the 35 teak plots measured in the State of Tabasco in 2006.
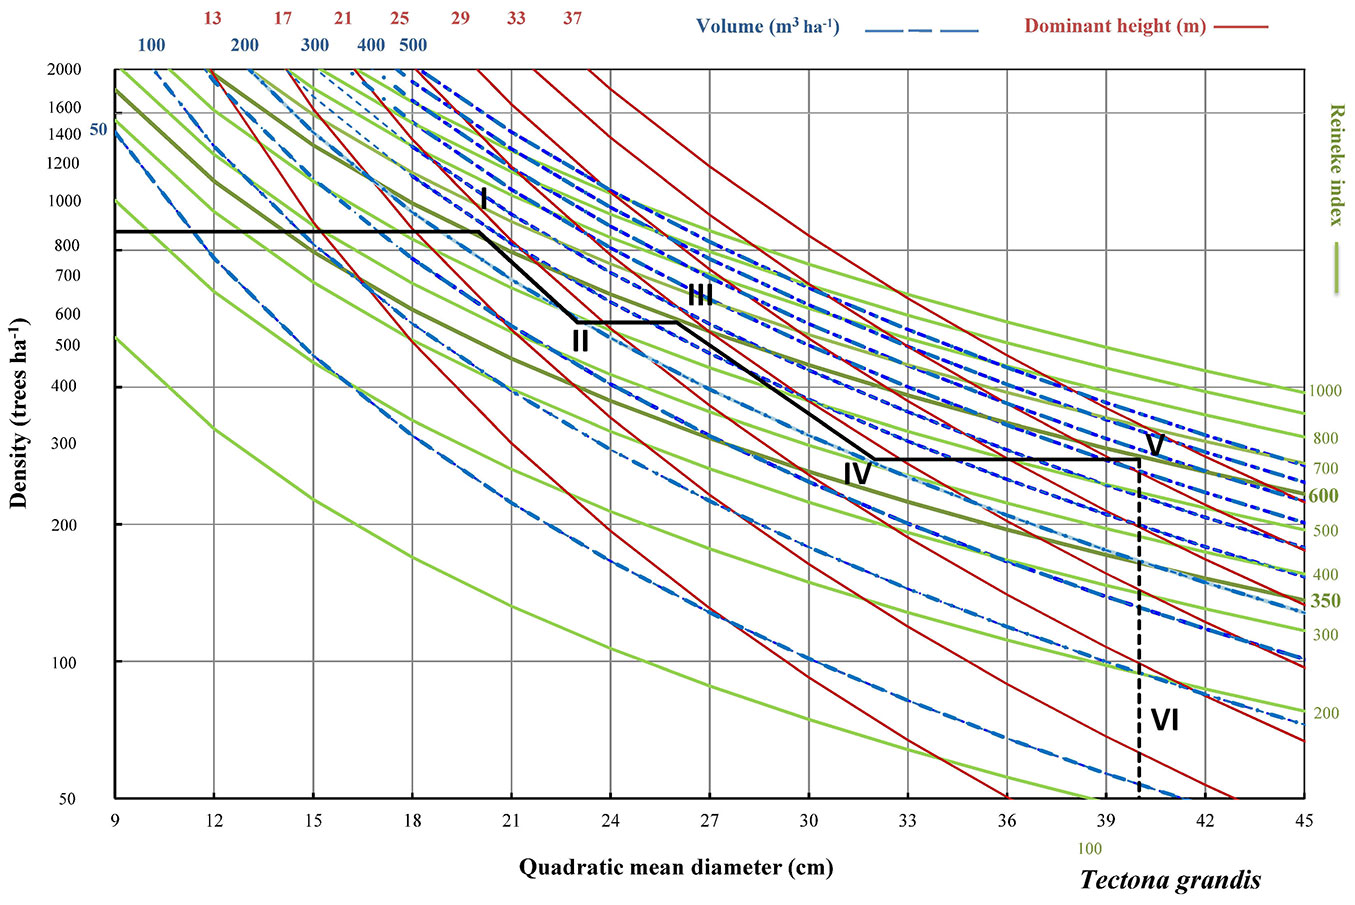
Fig. 4 and Fig. 5 show that after thinning the Reineke index decreased while the quadratic mean diameter and tree volume increased as usual. Thinnings reduced the number of entries required for a stand to reach a target quadratic mean diameter. A DMD can provide the justification for fewer entries being used to achieve an end-of-rotation target. It is also true that initial stand conditions or deviation of stand development from DMD predictions impose some management limitations. Thus, the limits of the Reineke index must be recognized because it represented the approximate boundaries of the management zone. Additionally, economic and non-timber constraints often made it infeasible to strictly maintain stands within the management zone.
Fig. 4 - Silvicultural management of Tectona grandis density in Tabasco. Recommended treatment to maximize the total stand production of a real plantation with 880 trees ha-1.
Fig. 5 - Management alternative for Tectona grandis density in Tabasco. Recommended treatment to maximize individual tree growth, which means maximizing the quadratic mean diameter with a starting point of 816 trees ha-1 and spacing of 3.5 × 3.5 m.
Discussion
Our findings showed a higher coefficient of determination for volume than for quadratic mean diameter, but all the parameters presented a significance level of 5%. Similar results were found for other species using the same fitting process. Valbuena et al. ([33]) obtained a coefficient of determination of 97% for volume and 69% for quadratic mean diameter for Pinus halepensis and Pinus pinaster in the Mediterranean region. Kumar et al. ([17]) and Tewari & Alvarez-Gonzaléz ([30]) found similar results for teak in two different areas of India. The first author found coefficients of determination equal to 98% and 97% for total volume and quadratic mean diameter, respectively, and the second author found a coefficient of determination equal to 74% and 89% for total volume and quadratic mean diameter, respectively.
The maximum Reineke stand density index value used in this study was 1000, which was lower than the value of 1200 found by Kumar et al. ([17]). However, it was comparatively higher than 940 as determined by Tamarit ([29]), and lower than those found by Arias ([2]), Perez & Kanninen ([25]) and Jayaraman & Zeide ([16]) who found values of 1053, 1049 and 1102, respectively, for teak plantations.
Compared to the number of plantations and plots used in other works, our data were limited, but they provide a good first approximation. For example, Kumar et al. ([17]) used data of 193 temporary sample plots from stands between 5 and 83 years of age; Tewari & Alvarez-Gonzaléz ([30]) used data of 27 unthinned plantations aged 11 to 38 years; and Castedo et al. ([4]) used data from permanent sample plots established in 223 plantations aged between 5 and 47 years. Our data only used 10 teak plantations in Tabasco, aged 4 to 18 years. Despite this limitation, the results of our work appeared to be relevant, but reliability requires a larger data set. Further research will be necessary to resolve this limitation in order to validate these results in the future.
A silvicultural proposal for stand density was determined through the application of two different thinning regimes. The first one was achieved by selecting the plot with the highest Reineke density index and applying two successive thinnings, leaving the first 50% of the initial planting density and the second 50% (25% of the initial density), respectively. The Reineke index was maintained at higher values compatible with the maximum growth in volume per hectare of the stand (60% to 40% of the maximum Reineke index). The second alternative for plantation managers was proposed based on the lower planting densities used in the region (816 trees ha-1) and two successive thinnings, leaving the first 50% of the initial planting density and the second 50% of the above density, respectively. The Reineke index was maintained at values that achieved maximum tree diameter growth and medium density (50% to 35% of the maximum Reineke index).
Tab. 3 shows the results of the silvicultural management option, while Tab. 4 shows the alternative management outcomes for the studied plantations. The two thinnings (50% and 50%) allowed for the selection of the highest quality crop trees. In addition, the difference between the values found before and after thinning was considered in the analysis of the status of the stand, i.e., in the determination of either growth or natural evolution.
Tab. 3 - Silvicultural management of Tectona grandis density in Tabasco. (Dg): quadratic mean diameter); (SDI): Reineke index; (Density): number of trees per hectare; (V): volume; (Ng): natural growth; (T): thinning.
| Entry | Dg (cm) |
SDI
|
Density (trees ha-1) | V (m3 ha-1) |
Change (m3 ha-1) | Evolution | |||||
|---|---|---|---|---|---|---|---|---|---|---|---|
| Before | After | Before | After | Before | After | Before | After | Thinning | Growth | ||
| 0-I | 9 | 20 | 170.7 | 615.1 | 880 | 880 | 27 | 236 | - | 209 | Ng |
| I-II | 20 | 23 | 615.1 | 486.4 | 880 | 556 | 236 | 196 | 40 | - | T |
| II-III | 23 | 26 | 486.4 | 592.1 | 556 | 556 | 196 | 274 | - | 78 | Ng |
| III-IV | 26 | 32 | 592.1 | 413.2 | 556 | 278 | 274 | 205 | 68 | - | T |
| IV-V | 32 | 40 | 413.2 | 591.1 | 278 | 278 | 205 | 377 | - | 171 | Ng |
| V-VI | 40 | 40 | 591.1 | 0 | 278 | 0 | 377 | 0 | 377 | - | Final cut |
Tab. 4 - Silvicultural management alternative for Tectona grandis density in Tabasco. (Dg): quadratic mean diameter); (SDI): Reineke index; (Density): number of trees per hectare; (V): volume; (Ng): natural growth; (T): thinning.
| Entry | Dg (cm) |
SDI
|
Density (trees ha-1) | V (m3 ha-1) |
Change (m3 ha-1) | Evolution | |||||
|---|---|---|---|---|---|---|---|---|---|---|---|
| Before | After | Before | After | Before | After | Before | After | Thinning | Growth | ||
| 0-I | 9 | 19 | 158.3 | 525.3 | 816 | 816 | 25 | 187 | - | 162 | Ng |
| I-II | 19 | 23 | 525.3 | 356.9 | 816 | 408 | 187 | 134 | 53 | - | T |
| II-III | 23 | 28 | 356.9 | 489.4 | 408 | 408 | 134 | 229 | - | 95 | Ng |
| III-IV | 28 | 35 | 489.4 | 350.1 | 408 | 204 | 229 | 179 | 50 | - | T |
| IV-V | 34 | 43 | 334.1 | 487.1 | 204 | 204 | 166 | 313 | - | 148 | Ng |
| V-VI | 43 | 43 | 487.1 | 0 | 204 | 0 | 313 | 0 | 313 | - | Final cut |
The practical applications of silvicultural management and the alternative option are shown in Fig. 4 and Fig. 5, respectively. In the first scenario, the average value of density was used for this species in Latin America. In the diagram, this value ranged between 1111 and 880 trees ha-1, using a spacing of 3 × 3 m between trees, with a Reineke index value from 600 to 420. The main purpose of this management option was to maximize total stand production, whereas the alternative proposal aimed to maximize the individual tree growth, which meant maximizing the quadratic mean diameter. In fact, the spacing commonly used in Mexico is 3.5 × 3.5 m or 4 × 3 m, providing a total of 816 trees ha-1 with a Reineke index value between 500 and 350, as observed in the diagram. In Tabasco, foresters apply a criterion of 50% and 50% for the initial plantation regardless of the failure within the interval; i.e., from a grid of 4 trees, two are removed in the first intervention and one in the second.
In the DMD of teak plantations in Tabasco (Fig. 3), thinning operations were based on a self-thinning rule beginning with a maximum value of 60% (line 600) for the Reineke index ([9]) and a minimum value of 35% (line 350), allowing full site occupancy. Whole-stand models, as with a DMD, allow managers to make decisions in a cost-effective manner in low-economic-return silvicultural systems. Other modelling approaches, such as empirical individual-tree or process-base models, can be more useful for understanding ecosystem dynamics, but DMD are practical tools for the application of extensive silviculture in low- and high-productivity forests.
The intervals between thinning periods provided sufficient time for the trees to grow naturally. The length and frequency of the interventions depended on the growth rates of the trees, which in turn were affected by productivity and stand age.
The thinning lines in the diagram for density management (Fig. 4 and Fig. 5) illustrate the interventions. The inclined segments represented thinning zones, and the horizontal segments represented post-thinning zones, i.e., areas of natural evolution (Fig. 4 and Fig. 5). In the case of the horizontal lines (post-thinning), the management of the stand was characterized by maintaining the density and increasing the quadratic mean diameter. The inclined lines represent the extraction of suppressed, intermediate and co-dominant individuals (C-grade thinning from below - [24]), whereby the thinning slope did not strictly follow the dominant height isolines. This pattern occurs when thinning was applied from below, assuming that this intervention had no effect on dominant height.
The DMD is an important tool to improve decision making and provide sufficient information to calculate the timber volume in a given area. Moreover, it allows to assess the quality and properties of the timber as well as the characteristics of the site or the habitat. By combining the diagrams of the functions of dominant height and age, it is possible to estimate the time needed to reach planned stand developmental stages under different management schemes and to differentiate among types of thinning ([32], [4]). This type of diagram was developed to sustainably manage forest stands while exploiting their full potential at the same time, so our findings will have a beneficial impact on the local teak population.
This option provides a very useful model for the appropriate management of plantations in the State of Tabasco because it is easy to use and has minimal cost. According to the theory of Langsaeter ([28]), a DMD can be planned to maximize either individual growth or total biomass production. Alternatively, empirical models of individual trees or processes may be more useful for understanding ecosystem dynamics, but density management diagrams are basic tools that can be applied in both extensive silviculture and low-productivity forests ([15], [22]).
The teak DMD presented here is based on stands of less than 20 years of age, and future efforts will include older stands. Furthermore, mortality curve trajectories would be added to the present teak DMD. The addition of mortality curves improves the utility of the diagram and reduces the errors caused by false assumptions made by the user ([12]). Moreover, the development of an application for tablets and smartphones could be a continuation of this work, with further research on up-scaling to empower owners to better manage their plantations.
Conclusions
The stand density management diagram designed for teak in the State of Tabasco is particularly useful for the planning and assessment of the consequences of alternative silvicultural management regimes. These projections are facilitated by a computer-based decision support system, and it is especially important in the management of plantation densities for different purposes. By using standard measurements (quadratic mean diameter, volume, number of trees, dominant height and Reineke index), forest managers can determine the total volume of the stand, the dominant height and the relative potential growth. If related to key dominant height-age functions, the diagrams can also be used to determine the most likely direction of future stand development. The density diagram serves to foster strong and uniform forestry management. Furthermore, it is a user-friendly, practical silvicultural support tool that may have a positive social impact on the understanding of applied silvicultural techniques.
The DMD can be used to identify stands that require thinning to reduce density-related mortality and to project the resulting stand. Ongoing market and economic changes in the Mexican forest industry are causing a shift in forest management planning from maximizing merchantable fibre production to optimizing tree size for timber products, and DMDs are one option in a suite of required tools as the forest industry in Tabasco shifts toward value-oriented silvicultural strategies. In addition, the density diagram constructed in this study represents a valuable support tool for the density management planning of even-aged stands of T. grandis in the State of Tabasco, Mexico.
Acknowledgements
This study was funded by a grant from the Spanish Agency for International Cooperation and Development (AECID). The data were provided by the State Forestry Commission of Tabasco (COMESFOR) and evaluated as part of the “Diagnosis of the State of Silviculture and Development of the Management Plan for Teak (Tectona grandis L.f.) and Melina (Gmelina arborea Roxb.) in Tabasco” project financed by FOMIX CONACYT- Tabasco. Special thanks to Mehari Alebachew Tesfaye for his logistical support during the development of the study.
References
Gscholar
Online | Gscholar
Gscholar
CrossRef | Gscholar
Gscholar
Online | Gscholar
Gscholar
Gscholar
Gscholar
Gscholar
Online | Gscholar
Gscholar
Gscholar
Gscholar
Authors’ Info
Authors’ Affiliation
Celia Herrero De Aza
Pablo Martínez-Zurimendi
Instituto Universitario de Gestión Forestal Sostenible, Universidad de Valladolid, Avda. de Madrid 44, 34071 Palencia (Spain)
Instituto Multidisciplinario de Investigaciones Biológicas (CONICET-UNSL), Avda. Ejército de los Andes 950, 5700 San Luis (Argentina)
ECM Environment Engineering, S.L. C/ Curtidores 17, 34004 Palencia (Spain)
El Colegio de la Frontera Sur Unidad Villahermosa, Carretera Villahermosa-Reforma km 15.5, Ranchería Guineo, sección II CP 86280, Villahermosa, Tabasco (Mexico)
Corresponding author
Paper Info
Citation
Minoche D, Risio-Allione L, Herrero De Aza C, Martínez-Zurimendi P (2017). Density management diagram for teak plantations in Tabasco, Mexico. iForest 10: 909-915. - doi: 10.3832/ifor2247-010
Academic Editor
Emanuele Lingua
Paper history
Received: Oct 11, 2016
Accepted: Aug 29, 2017
First online: Dec 01, 2017
Publication Date: Dec 31, 2017
Publication Time: 3.13 months
Copyright Information
© SISEF - The Italian Society of Silviculture and Forest Ecology 2017
Open Access
This article is distributed under the terms of the Creative Commons Attribution-Non Commercial 4.0 International (https://creativecommons.org/licenses/by-nc/4.0/), which permits unrestricted use, distribution, and reproduction in any medium, provided you give appropriate credit to the original author(s) and the source, provide a link to the Creative Commons license, and indicate if changes were made.
Web Metrics
Breakdown by View Type
Article Usage
Total Article Views: 49862
(from publication date up to now)
Breakdown by View Type
HTML Page Views: 41373
Abstract Page Views: 3148
PDF Downloads: 4250
Citation/Reference Downloads: 40
XML Downloads: 1051
Web Metrics
Days since publication: 2959
Overall contacts: 49862
Avg. contacts per week: 117.96
Article Citations
Article citations are based on data periodically collected from the Clarivate Web of Science web site
(last update: Mar 2025)
Total number of cites (since 2017): 6
Average cites per year: 0.67
Publication Metrics
by Dimensions ©
Articles citing this article
List of the papers citing this article based on CrossRef Cited-by.
Related Contents
iForest Similar Articles
Research Articles
Climatic fluctuations trigger false ring occurrence and radial-growth variation in teak (Tectona grandis L.f.)
vol. 9, pp. 286-293 (online: 28 September 2015)
Research Articles
Is it needed to integrate mixture degree in Stand Density Management Diagram (SDMD)?
vol. 16, pp. 274-281 (online: 28 October 2023)
Research Articles
Modelling taper and stem volume considering stand density in Eucalyptus grandis and Eucalyptus dunnii
vol. 14, pp. 127-136 (online: 16 March 2021)
Research Articles
Heuristic forest planning model for optimizing timber production and carbon sequestration in teak plantations
vol. 10, pp. 430-439 (online: 24 March 2017)
Research Articles
A silvicultural stand density model to control understory in maritime pine stands
vol. 10, pp. 829-836 (online: 25 September 2017)
Research Articles
Using soil-based and physiographic variables to improve stand growth equations in Uruguayan forest plantations
vol. 12, pp. 237-245 (online: 03 May 2019)
Review Papers
Tectona grandis Linn. f. secondary metabolites and their bioactive potential: a review
vol. 15, pp. 112-120 (online: 26 March 2022)
Technical Advances
Forest stand height determination from low point density airborne laser scanning data in Roznava Forest enterprise zone (Slovakia)
vol. 6, pp. 48-54 (online: 21 January 2013)
Research Articles
Estimation of stand crown cover using a generalized crown diameter model: application for the analysis of Portuguese cork oak stands stocking evolution
vol. 9, pp. 437-444 (online: 02 December 2015)
Research Articles
Effect of stand density on longitudinal variation of wood and bark growth in fast-growing Eucalyptus plantations
vol. 12, pp. 527-532 (online: 12 December 2019)
iForest Database Search
Search By Author
Search By Keyword
Google Scholar Search
Citing Articles
Search By Author
Search By Keywords
PubMed Search
Search By Author
Search By Keyword

