A silvicultural stand density model to control understory in maritime pine stands
iForest - Biogeosciences and Forestry, Volume 10, Issue 5, Pages 829-836 (2017)
doi: https://doi.org/10.3832/ifor2173-010
Published: Sep 25, 2017 - Copyright © 2017 SISEF
Research Articles
Abstract
The aim of this study was to provide optimal silvicultural guidelines for the maintenance of low understory vegetation cover in maritime pine (Pinus pinaster Ait.) stands in Mediterranean areas prone to the occurrence of forest fires. An extensive data set from maritime pine stands of northern Portugal was used to assess the effect of stand density on the understory cover. A statistically significant relationship between the spacing-top height factor (Fw) and the understory cover was found. An ecologically-based density regulation model was developed based on Fw = 0.21, which provided the optimal stand density and canopy cover to prevent the understory growth and proliferation, thereby reducing the vulnerability to forest fire and ensuring at the same time the highest values of stand yield. The developed model represents a supporting tool for density regulation of maritime pine stands in areas prone to forest fires. The representativeness of the supporting data set (in terms of number of sample plots and variability of the stands characteristics) provides confidence in the generalization of our results to different maritime pine stands in the Mediterranean area. This study suggests that managing stand density may be an effective adaptive management procedure which can help reducing the forest fire hazard.
Keywords
Silviculture, Density Regulation, Understory Reduction, Pinus pinaster
Introduction
Stand density is a key variable in forest management, as it directly influences the growth and yield at a particular station. Based on a criterion of spacing, marked by thinning, different models of silviculture were defined and used as guidelines for density regulation. The models are normally based on the usage of specific values of relative spacing factors or of the Stand Density Index (SDI - [32]). The Reineke’s index is given as SDI = N (dg/25)b, where N is the variable that represents the number of trees (trees ha-1), dg represents the quadratic mean diameter (cm) and b is an allometric coefficient. In Portugal, the stocking criterion for softwood species is traditionally defined by the Wilson’s spacing factor: Fw = 100N-0.5hd-1 ([35]), where hd refers to the dominant height defined as the average height (m) of the 100 thickest trees per hectare. There is an equivalence link between the Wilson factor and the Hart-Becking spacing index (H-B) for a square compass, in that case: H-B = 100 Fw.
The most abundant softwood species in Portugal is maritime pine (Pinus pinaster Ait.), occupying 23% of its mainland forested area ([20]). The forest systems of maritime pine are essentially managed for timber as pure and even-aged stands. Stands have their origin through plantation/seeding or, in case of fire disturbances, through natural regeneration. The typical silvicultural model considers the first thinning at age 17-20 years and a second at age 25-30 years. The thinning interval is located between short to medium (5-10 years), corresponding to a top height growth of 2 to 3 m. The harvest age occurs around 40-45 years. Values of Fw after thinning, in the range between 0.20 (moderate low thinning) and 0.28 (very heavy low thinning) are correspondent to the classical thinning description of grades C/D and E, respectively. These values have been reported in literature for this species ([19], [16], [9], [31], [29], [3]). Luis & Fonseca ([24]) have suggested the use of relative values of the SDI factor, with b = 1.897, for density regulation. Relative values of SDI are established by dividing the SDI values by the maximum value of SDI for the species (estimated as being equal to 1859 trees ha-1 for a dg = 25 cm), and multiplying it by 100. The authors hypothesized that 60% and 35% are adequate values for the upper and lower limits of the optimum growth-density interval, respectively, and 25% is the reasonable value for the crown closure for Pinus pinaster in the Portuguese environment. Automatic management procedures, based on the use of SDI and Fw, are available in the ModisPinaster model ([13]), which is designed to help the management of the species and is freely available for use in the Capsis platform (⇒ http://www.inra.fr/capsis - [14]). The use of two distinct measures of density allow managers to perform simulations based on the ecological concept of self-thinning, intimately associated to the SDI metric and to the traditional guidelines based on the dominant height growth development accounted for in the Fw metric.
The recurrent forest fires in the Mediterranean region are a significant menace to the maintenance and development of this pine ecosystem and have direct consequences on the characteristics of the wood material that becomes available at the end of the incident, and can result in considerable economic loss. The fire regime affects genetic diversity in the short-term, without generating maritime pine genetic erosion ([23]). The species has evolutionary adaptations that helps its perpetuation in fire-prone environments, as thick bark and reproductive processes that facilitate recovery after stand replacement fire from seeds stored in serotinous cones ([12]). Yet, recurrent forest fires that return after a short period of time menace the perpetuity of the species, because the young regenerated plants are unable to reach reproductive maturity between the consecutive fires. Adaptive management actions, such as the modification of the structure and quantity of aerial and surface fuels to manage fire hazard (e.g., prescribed fire) or the use of silvicultural models more oriented to control the proliferation of shrubs, are therefore essential. It is often advocated that high densities should be maintained as a control measure over the understory vegetation ([16], [34]), given that P. pinaster presents a sparse canopy that facilitates the passage of light to the ground, thereby promoting the development of an abundant undergrowth ([34], [33], [17]). In fact, the impact of density on the occurrence of understory happens due to the interception of irradiance by the canopy and can be assessed by the metric Leaf Area Index (LAI) of the canopy. LAI depends on tree species, age, and density and on the social position of trees within the canopy structure. When LAI is not available, the stand density and the diameter of the trees can be used as a proxy of canopy closure. Additional factors, such as topography ([15]), soil characteristics, competition between the understory species for water and nutrients, might also interfere in the development and structure of the understory vegetation.
The evaluation of the overstory cover effect on the understory vegetation has been stated for different forest systems. McKenzie et al. ([28]) explored the relationships between overstory characteristics and the abundance of herbs and shrubs in mature forests of softwood species (hemlock, fir and Douglas-fir). The authors found that shrub cover was negatively correlated with overstory variables. Among the overstory variables tested (e.g., basal area, number of trees, SDI, percent canopy cover, tree quadratic mean diameter, coefficient of variation of tree diameters), the SDI and tree quadratic mean diameter presented the strongest correlation with shrub cover. Bailey & Tappeiner ([4]), in a study conducted in Douglas-fir stands, found that shrub density was related to thinning intensity and stand density. The density and the frequency of tall shrubs were significantly greater in thinned stands compared to unthinned stands. In thinned stands the density and frequency of tall shrubs were negatively correlated with relative density and trees ha-1. Gracia et al. ([15]) found that overstory cover and basal area in temperate forests in NE Spain negatively affected the presence of two shade-intolerant shrub species, decreasing their abundance when light decreases. A significant relationship between stand cover on understory vegetation has been reported also by Coll et al. ([11]), referring to some species of the Pinaceae and Fagaceae families in forests of Catalonia (Spain), and by Botequim et al. ([8]) in Portuguese forests of different cover types.
The effect of overstory density on the understory vegetation layer is critical in fire prone forest ecosystems. This study seeks to statistically investigate whether or not the understory levels in maritime pine stands are influenced by the density of the stands, as measured by the spacing factor. In case a significant relationship is identified, it provides opportunities to propose better-suited density prescriptions to the species in order to guarantee a low abundance of understory vegetation in the stands. This would be a strategic adaptive measure to assist and reduce the vulnerability of forest fires in areas prone to this hazard.
Material and methods
Study area
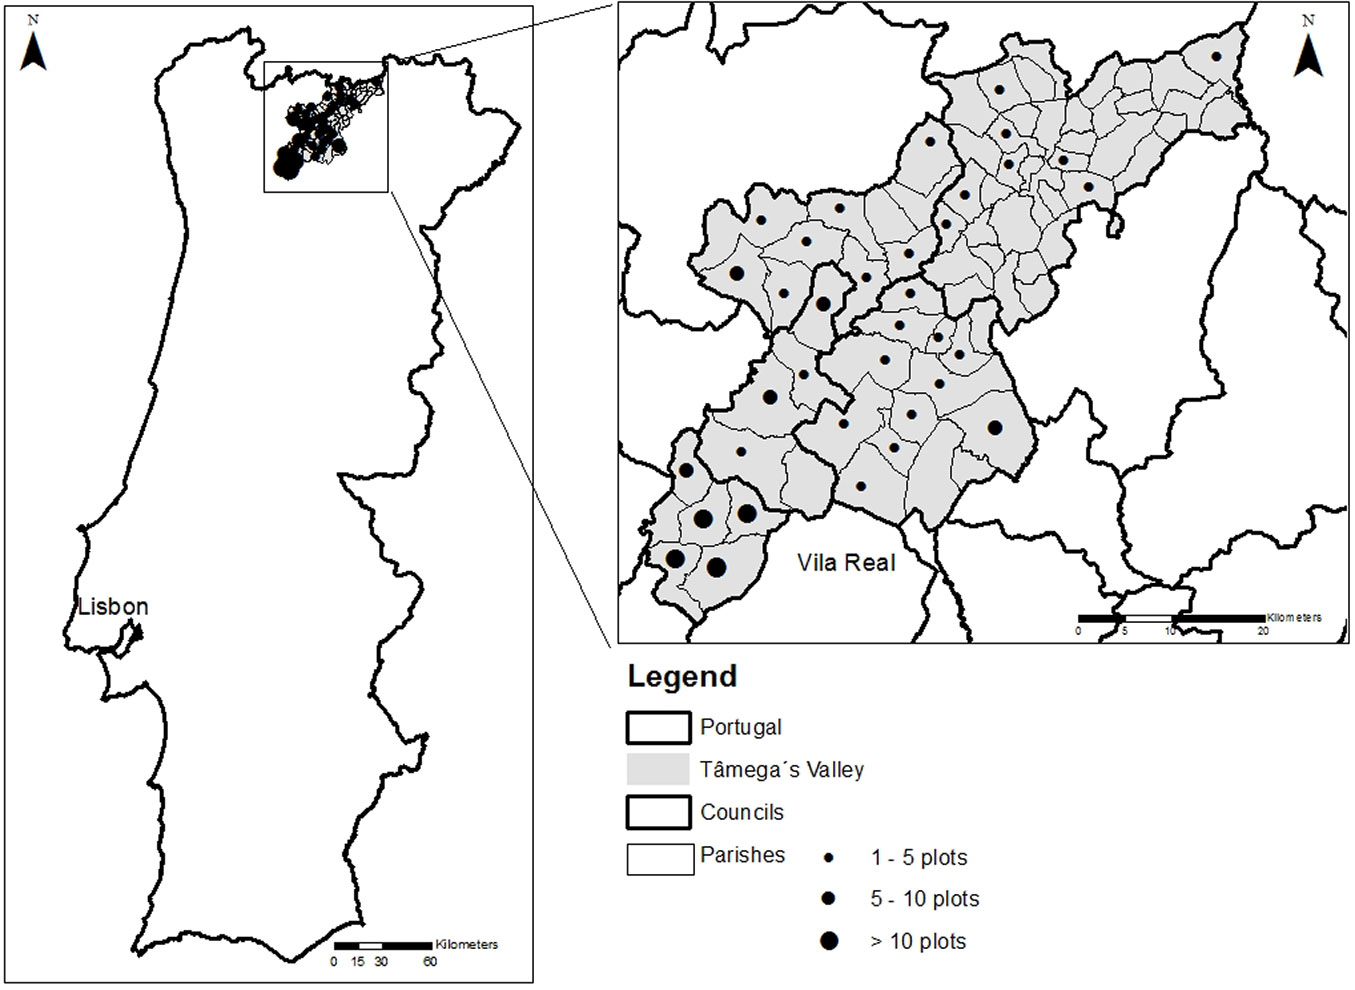
The study area is located in North Portugal (Fig. 1), in the Tâmega Valley region (latitude range: 41° 15′ - 41° 52′ N, longitude range: 7° 20′ - 8° 00′ W, altitude range: 100-900 m a.s.l.), where there is one of the major continuous maritime pine covers in Portugal, occupying around 35.000 ha. The soils in the region are derived from granite and schist. A climate variability due to the Atlantic and continental influences and to the range in altitude is mentioned for the region ([27]): “Up to the level of 400 m, mean annual temperature varies eastward between 13.1 and 16 °C. Above that level, mean annual temperature decreases to a value of 9.8 °C in the higher elevations. The values of mean annual rainfall are between 660 and 1400 mm in the lower sites, increasing with altitude from 1000 to 2900 mm”. For detailed information, please refer to Marques ([26], [27]).
Fig. 1 - Location of the study area in Portugal.
Stands are even-aged and are handled in a thinned managed regime. Depending on site quality, stands attain their biological rotation age for the volume variable at 35-45 years ([29]). The harvesting age according to that criterion corresponds to the year where the Mean Annual Increment (MAI) is equal to the Periodic Annual Increment (PAI). The average diameter of the stand ranges from 25 to 35 cm at the final cut, depending on the site quality. Density regulation has been mainly based on the experience of the operators, being translated into Fw values ranging between 0.16 and 0.28 ([9]). A detailed list of understory species occurring in these ecosystems can be found in Marques ([26]). The species noticeably represented in the Tâmega Valley can be grouped into 6 major families: ericaceous (Calluna vulgaris, Erica spp.), fabaceous (Pterospartum tridentatum, Ulex minor, Ulex europaeus), graminaceous (Agrostis spp.) cistaceous (Halimium lasianthum), leguminaceous (Cytisus scoparius) and ferns (Pteridium aquilinum). The results by Marques ([26], [27]) point towards a probable association of Pteridium aquilinum with sites of good quality, while the absence of ferns and the presence of Pterospartum tridentatum is associated with poor sites. Information of flammability and calorific power for the species can be found in Martin & Lara ([25]).
Material
Understory vegetation and stand information was collected from forest inventories drawn up over the last three decades of the pine stands from the Tâmega Valley (Data_Pinaster). A synthesis of part of Data_Pinaster can be found in Fonseca ([13]). A consistent database encompassing different conditions of density and levels of understory vegetation was selected and organized to support the statistical analysis. All the information that has been used in this study refers to data collected in pure stands of maritime pine. Plots with no information about the percentage of understory and plots where there was a record of occurrence of disturbances, such as cutting and burning understory, were discarded. The database used in the study corresponds to 160 circular sample plots (0.05-0.1 ha) distributed throughout the study area and covering a large range of stand densities (Tab. 1). The inventory data were obtained by different teams using two different methods for understory cover data registry, according to the specific inventory guidelines proposals followed during data collection. The determination of total cover percentage ([7]) was assessed by the intercept line method ([10]) in 77 plots and by visual estimation in 83 plots. We assumed that the rigor associated with the visual estimation is compatible with the study purposes, not only because the latter method was based on the use of graphical charts of percent cover ([6]), but also due to the joint training and assessment of the various elements of the work team, as suggested by Klimes ([21]) in order to reduce the variability of outcomes from different operators. The species found in the 160 plots include the major species associated to the communities listed earlier in this Section. Four series of understory cover, encompassing all situations, were considered: (1) absence; (2) fair (< 10%); (3) fair to medium cover (10-30%); and (4) medium to high cover (> 30%). According to the authors’ experience, which has been corroborated by an expert on forest fire research (P. Fernandes, personal communication), series 2, 3 and 4 might be associated with the following values of understory vegetation fuel load: to 2.5 t ha-1, from 2.5 to 5.5 t ha-1 and > 5.5 t ha-1, being categorized as low, medium, or high fuel load, respectively. The characterization of stand variables is presented in Tab. 1. The variables refer to age, tree size (diameter and height) and site index. Summary values of density were provided, which were assessed both by the variable spacing factor of Wilson (Fw) and by the variable Stand Density Index (SDI). Hereafter, we will focus especially on the Fw because this index is the measure that has been traditionally used to regulate density in this maritime pine system.
Tab. 1 - Stand statistical characteristics of the test material (n = 160 observations). (t): stand age; (N): number of trees per hectare; (hd): dominant height; (dg): quadratic mean diameter; (SI): site index at 35 years reference age ([26], [27]); (Fw): spacing factor of Wilson; (SDI): Stand Density Index of Reineke; (Pi): percentile value; (i): 10, 50 (median) and 90; (mean): arithmetic mean; (sd): standard deviation.
| Stand variable | P 10 | P 50 | P 90 | mean ± sd |
|---|---|---|---|---|
| t (years) | 24 | 38 | 51 | 38 ± 10.3 |
| N (trees ha-1) | 340 | 850 | 2002 | 1024 ± 672 |
| hd (m) | 10.6 | 15.6 | 20.9 | 15.8 ± 3.9 |
| dg (cm) | 12.5 | 21.9 | 32.3 | 22.1 ± 7.3 |
| SI35(m) | 12.3 | 16.0 | 18.6 | 15.6 ± 2.5 |
| Fw | 0.17 | 0.22 | 0.31 | 0.23 ± 0.06 |
| SDI (%) | 22.1 | 32.8 | 44.5 | 33.3 ± 9.6 |
Statistical analysis
Relationship between stand density and understory vegetation
To test the hypothesis that claims the existence of a significant relationship between stand density and understory vegetation in pine stands two approaches were followed.
The first approach consisted of the evaluation of the differences between the mean values of the Wilson spacing factor across the understory series defined for the analysis. The normality of the distributions was checked for deviations using normal quantile plots. To evaluate the differences between the means, the parametric post-hoc Duncan’s multiple comparison test and the t-test (with significance level P < 0.05) were used. The analysis was complemented with the nonparametric Wilcoxon test, which was used to account for deviations of normality. Differences were evaluated considering the original four series of data (1, 2, 3, and 4) and considering new groups, by merging series 1 and 2 (corresponding to null or low understory cover) and series 3 and 4. Analysis of overstory effects on understory vegetation was additionally performed by means of logistic regression. The overstory variables tested were the spacing factor (Fw) and the Stand Density Index (SDI), the basal area (G), the number of trees per hectare (N) and the stand age (t). The response variable was defined as the categorical variable understory classified as being 0 or lower than 10%, or equal or higher than 10%.
Stand density model
The second step of the statistical analysis was aimed to identify and model the relationship between the absolute measure of tree density, as assessed by N, and a proxy variable related with understory vegetation. The association was studied graphically and statistically through regression modelling. Tentative regression models were tested and the selected candidate models were carefully analyzed in terms of statistical conformation to the least squares assumptions of linear and nonlinear model fitting. The appropriateness was based on the biological trend captured into the models and judged by the graphical analysis of the residuals. Fitting criteria that was recorded for presentation referred to the coefficient of determination (R2) and the R2-like statistic, for nonlinear models and to the standard deviation of the residuals (statistic root mean square error, syx), in the original units. The statistical analyses were performed using the JMP® (v. 10.0) software of SAS® Institute Inc.
Results
Relationship between stand density and understory vegetation
Tab. 2 presents the number of stands (n), the mean value and the standard deviation (sd) of Fw for each series of understory considered. An examination of the plots showed fairly straight distributions for series 1, 2 and 3, and just a slight deviation for series 4. No inconsistent values were detected for the overall data nor for each of the series taken individually. The sample was therefore considered as representative of the observed communities and to fulfil, in general, the Duncan test conditions. According to the Duncan test results, the Fw averages of series 1 and 2 were not significantly different at the 5% significance level. The same occurred for the Fw averages of series 3 and 4. Hence, the analysis was performed again by considering just two groups. The new series considered in the subsequent analysis distinguish stands with none or scarce understory vegetation (0-10%, 77 observations) and stands with a significant presence of understory (>10%, 83 observations). The Fw averages on the new series, coded as “absence” vs. “presence”, were significantly different at the 5% significance level, as judged by the parametric t-test (P-value < 0.0001). The Wilcoxon nonparametric test confirmed differences between the distributions of the new series “absence” and “presence” (P-value < 0.001). The average (standard value) of stocking for the subset of data with understory vegetation was 0.25 ± 0.07, while for stands showing no vegetation or low percentages of understory vegetation cover (< 10%), the mean spacing factor was markedly lower (0.21 ± 0.04).
Tab. 2 - Values of the Wilson spacing factor (mean ± standard deviation), by series of understory. Means with the same letter are not significantly different (p>0.05) after the Duncan’s test.
| Series | Understory | n | Fw | Series | Understory | Fw |
|---|---|---|---|---|---|---|
| 1 | 0 | 34 | 0.20 ± 0.03 a | Absence | 0-10% | 0.21 ± 0.04 a |
| 2 | < 10% | 43 | 0.22 ± 0.04 a | |||
| 3 | 10-30% | 30 | 0.25 ± 0.06 b | Presence | ≥ 10% | 0.25 ± 0.07 b |
| 4 | > 30% | 53 | 0.26 ± 0.07 b |
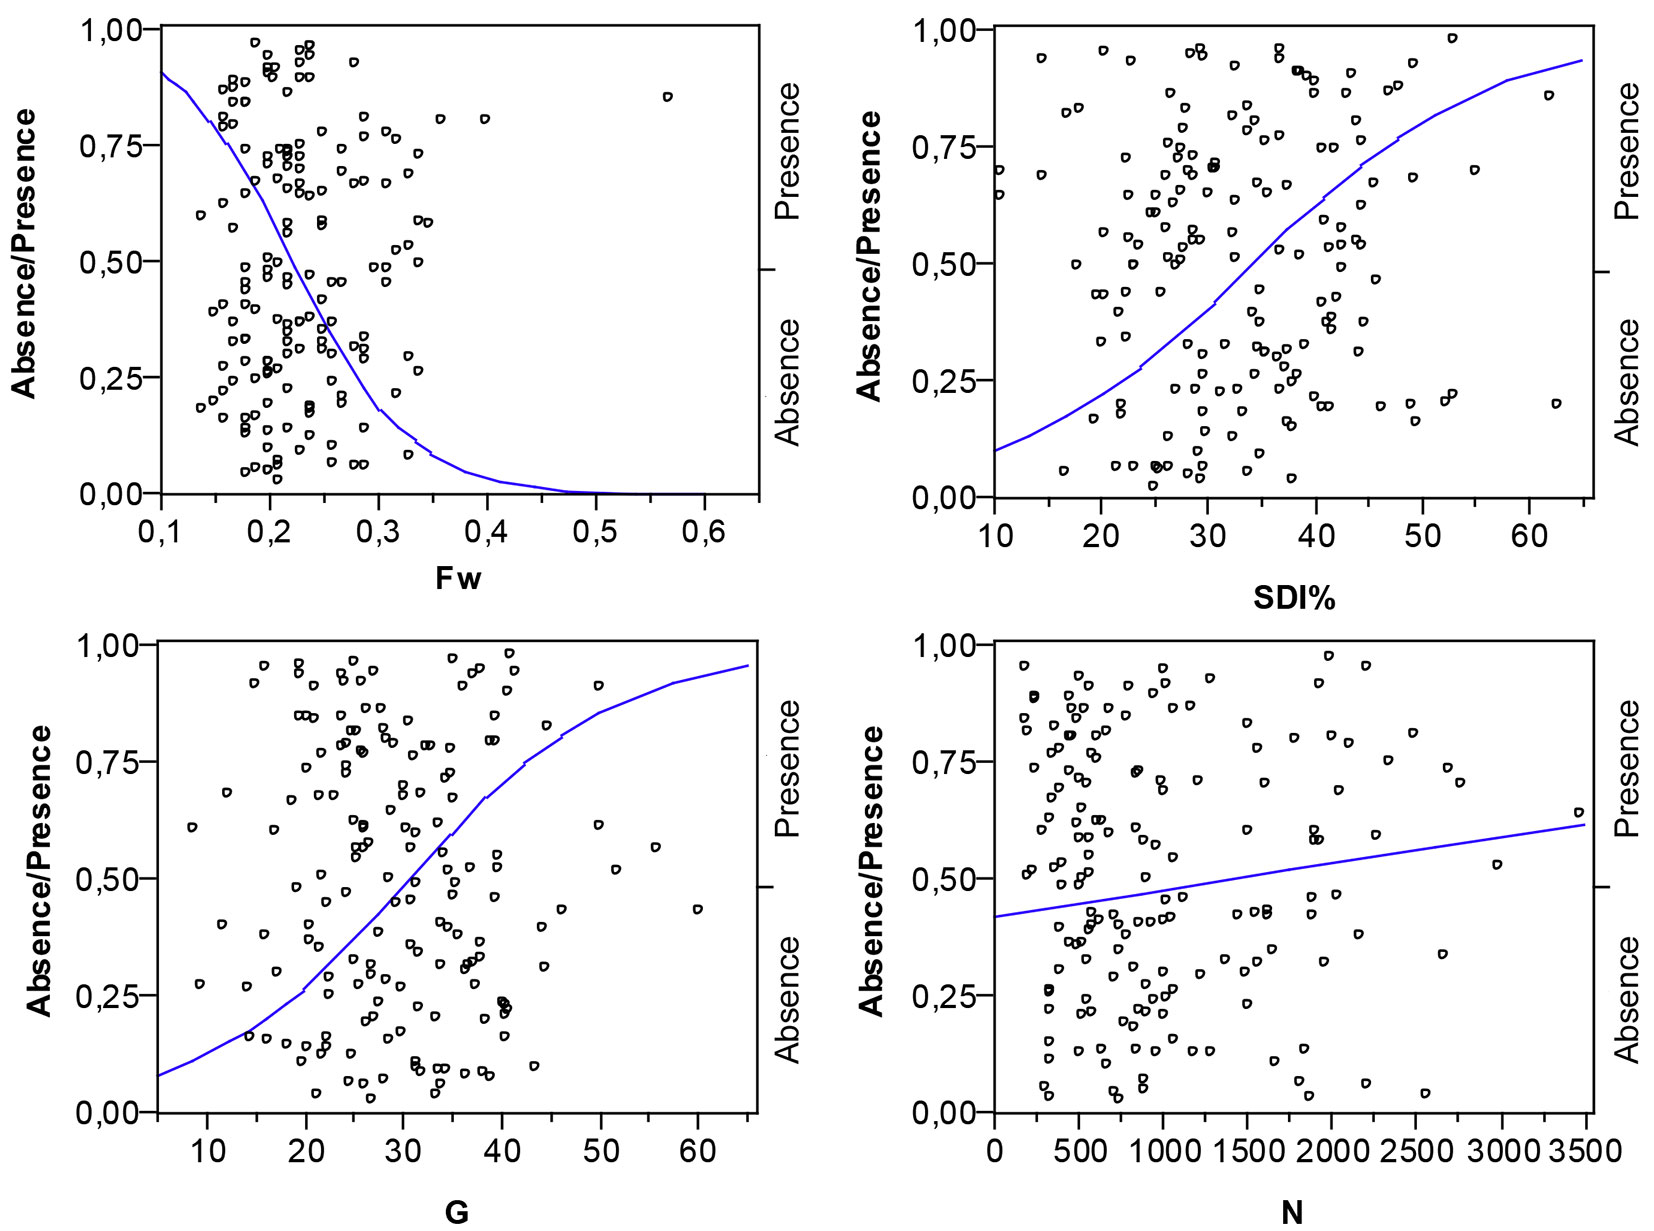
The influence of stand density on understory cover was estimated using a logistic model (Fig. 2) that also points towards a statistically significant relationship between the Wilson spacing factor and the log odds of absence/presence of understory vegetation, as attested by the χ2-test statistic (P-value < 0.0001). Statistically significant relationships (P-value < 0.0001), although with a lower explanatory power, were also noticed with the Stand Density Index (SDI, %) and with stand basal area (G, m2ha-1). The number of trees per hectare (N, trees ha-1) proved to be non-statistically significant (P-value = 0.3365) in the log odds of absence/presence of understory vegetation.
Fig. 2 - Logistic fit of understory vegetation by spacing factor of Wilson (Fw) for log odds of Absence/Presence. (Absence): stands with 0-10% understory vegetation cover; (Presence): stands with understory vegetation cover > 10%.
Stand density model
After confirming the effect of overstory stand density on understory vegetation and the recognition of Fw as the variable that best accounts for the likelihood of absence/presence of understory, we analysed the relationship between N and Fw in order to obtain practical density guidelines.
Fig. 3 characterizes the 160 stands in terms of number of trees per hectare and quadratic mean diameter. The diameter was selected for the X-axis, given that this variable is more straightforwardly measured than tree height and it is regularly reported in current inventories. Also, it is shown the line that corresponds to the number of trees per hectare as estimated by the models by Oliveira ([30]) and Moreira & Fonseca ([29]), setting a Fw = 0.21. This value of 0.21 equals the average value of the spacing indices found for the “absence” series and can be conservatively assumed as the value which guarantees a null or lower understory vegetation cover percent (< 10%) in the stands. The values of dg associated to the values of hd were read directly from the stand tables by Oliveira ([30]) and Moreira & Fonseca ([29]). This procedure allowed to obtain pairs (N, dg) for a range of hd values, supporting the drawing of the trend line.
Fig. 3 - Number of trees and mean diameter of the studied pine stands. Representation of the dataset in terms of number of trees per hectare and quadratic mean diameter. The subset E1 refers to the stands with Fw ≤ 0.21 (above the black trend line), while E2 refers to the subset of stands with Fw > 0.21 (below the trend line). (Absence): stands with 0-10% understory vegetation cover (white circles); (Presence): stands with understory vegetation cover > 10% (grey triangles).
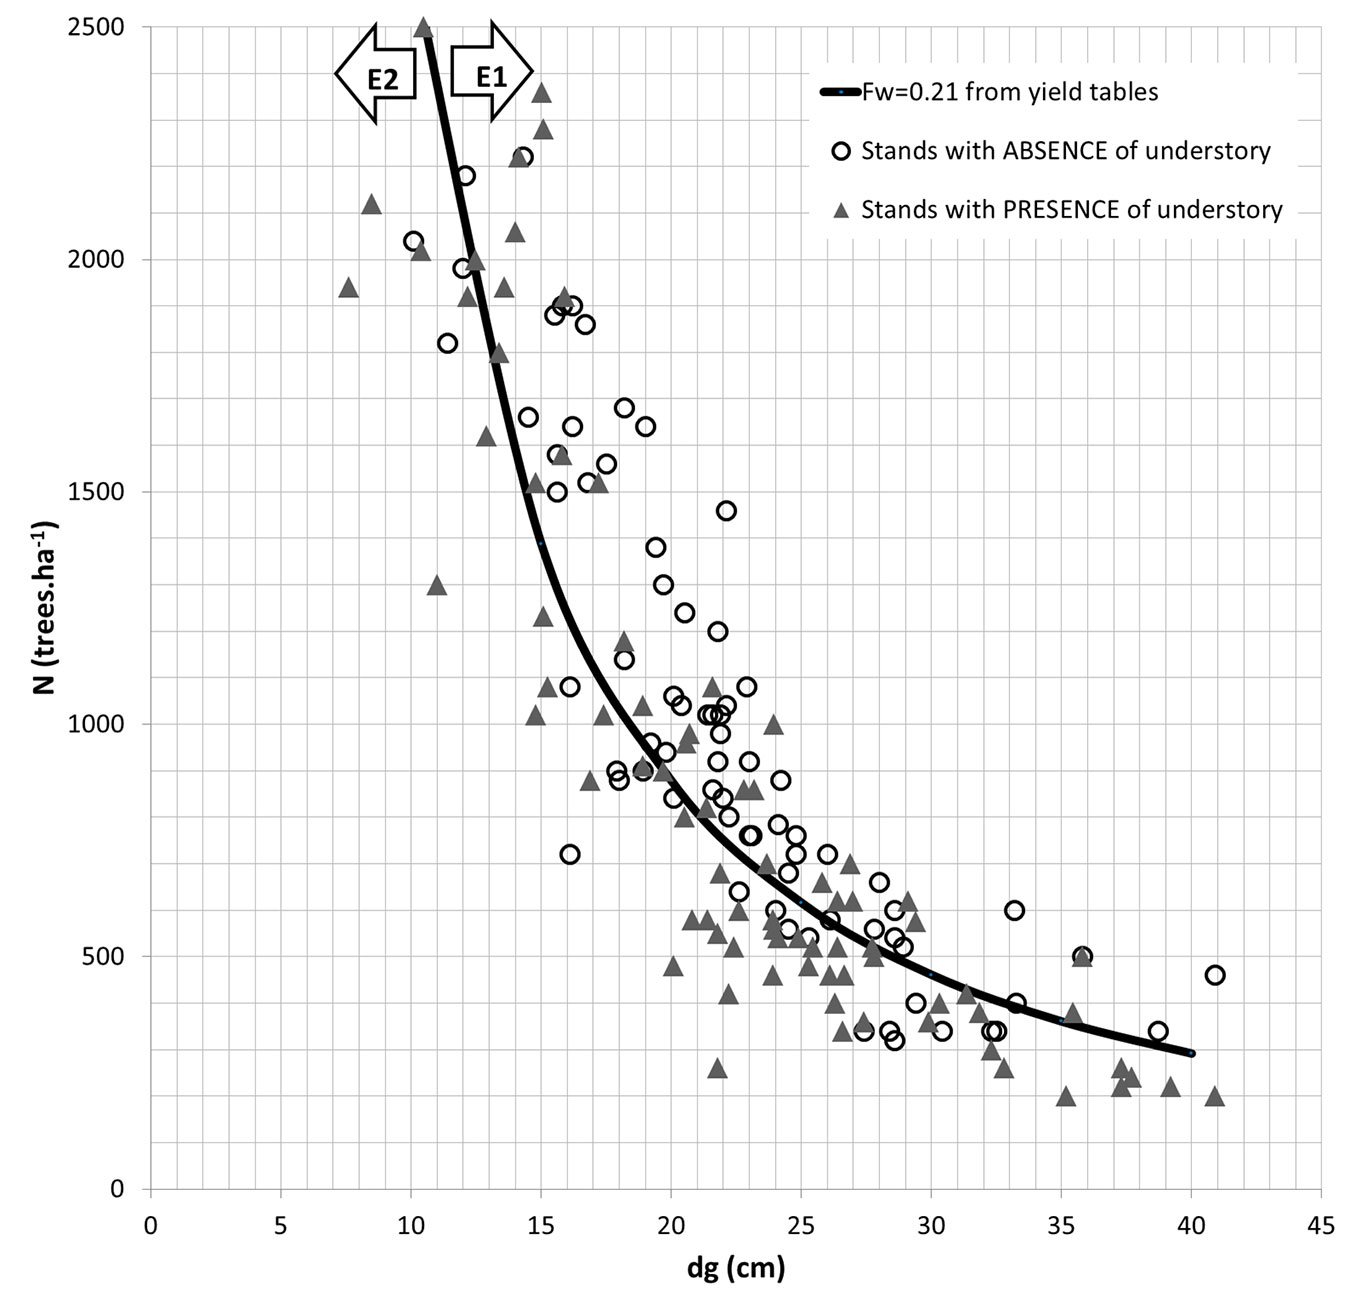
The trend line in Fig. 3 divides the stands in two different subsets. The first subset of stands is characterized by higher tree density (Fw ≤ 0.21) with low (or null) understory vegetation cover (subset E1). The second refers to pine stands with larger spacing between trees (Fw > 0.21 - subset E2) which are associated with understory cover > 10%.
We analysed the association between the number of trees (N, trees ha-1) as the response variable, and the quadratic mean diameter (dg, cm) and the average spacing factor (Fw) as explanatory variables. The overall dataset was used to model the relationship between N, dg and Fw. Scatter plots of N over dg and Fw revealed a curvilinear trend; therefore, transformations for N, Fw and for dg were used. The selected model had the following form (eqn. 1):
where βi (i = 0, 1, 2) represents the parameters of the model and ε is the error term. The logarithmic transformation of N accounts for non-uniform variance of N across the domain of the regressor variables. The analysis of residuals of the fitted model did not present any symptoms of heteroscedasticity or non-normality of the error term. The conversion of logarithmic estimates to original units led to eqn. 2:
The index of fit (R2-like statistic) was 0.918 and the root mean square error (syx) in original units was equal to 194 trees ha-1. The correction factor for bias ([5]) slightly deviated from 1 (CF = 1.01), thus the correction was deemed unnecessary.
A clear relationship emerged by setting Fw equal to the threshold value of 0.21 in eqn. 2, whereby the value of the variable N directly varies with changes in the dg values, as reflected in the following equation (eqn. 3):
This relationship between the number of trees and their average size defines the expected stand density level that ensures a null or lower cover of the understory. The reference value of Fw = 0.21 refers to the average spacing between trees after a low thinning operation.
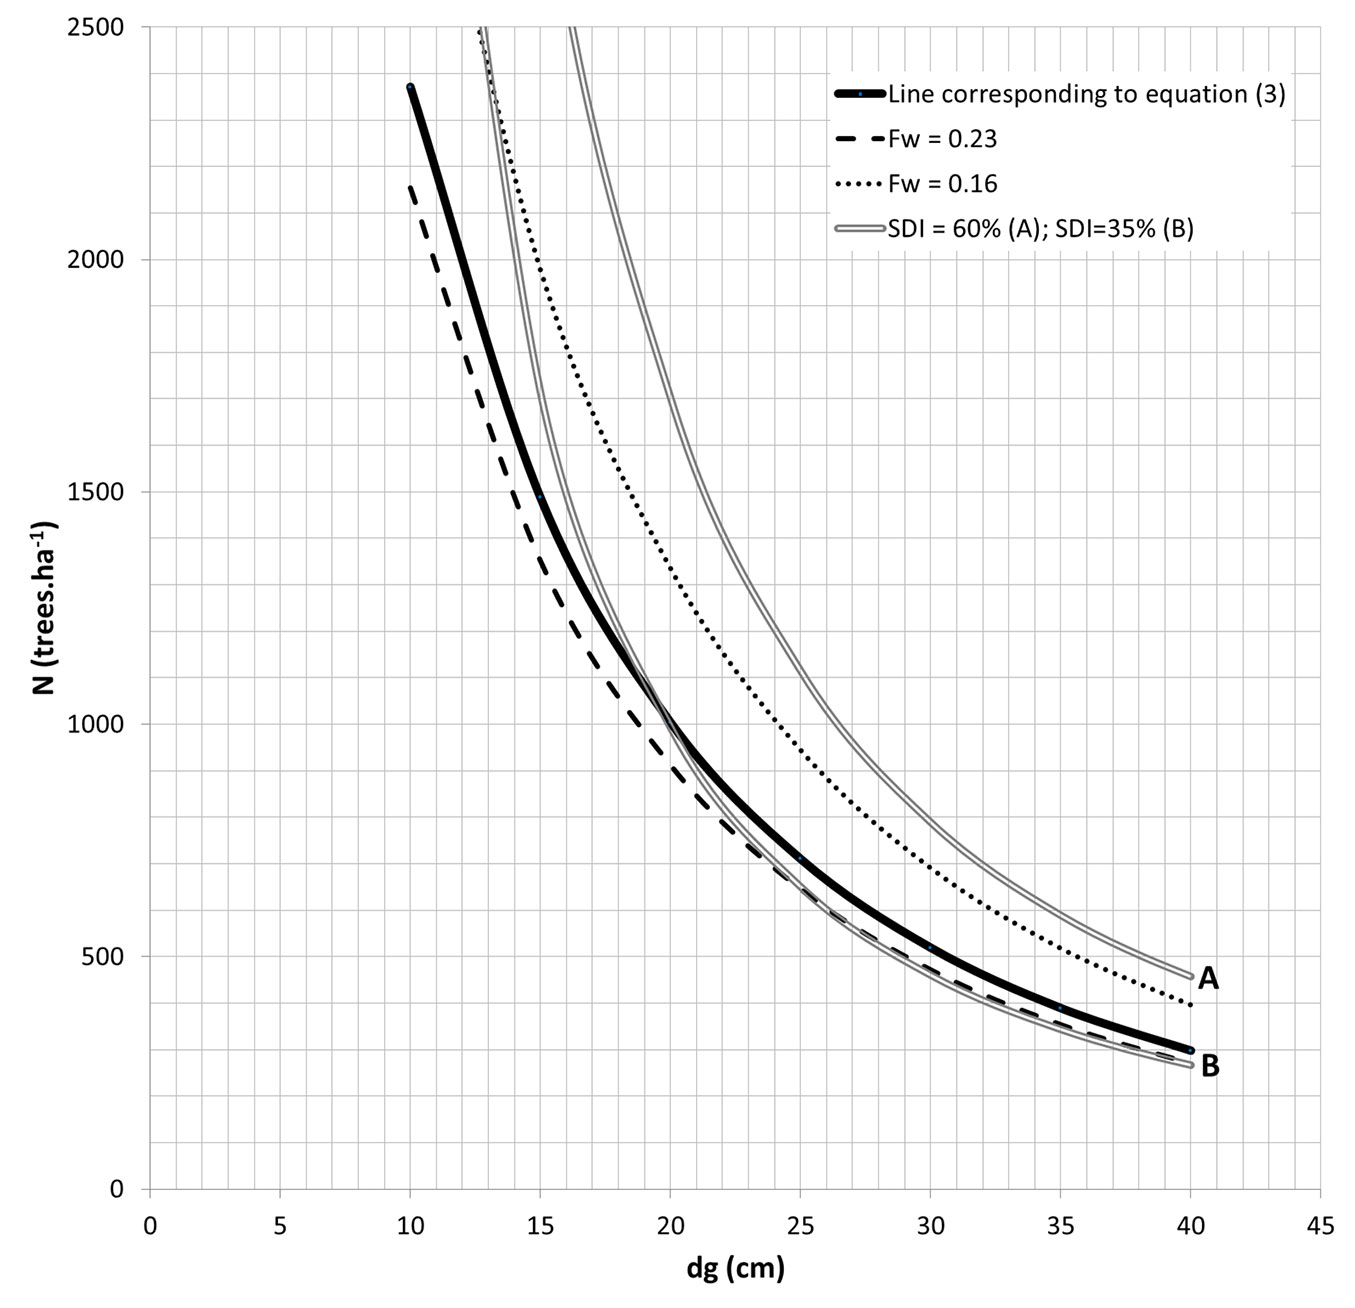
The relationship shown in eqn. 3 is depicted in Fig. 4 with the usual recommended prescription of Fw = 0.23 ([30], [29]) and the maximum density for the species that is still appropriate to thin (Fw = 0.16), as admitted by the authors and supported by the database for the maritime pine ecosystems (Data_Pinaster). The upper and lower limits for optimal growth, SDI = 60 % and 35%, respectively, are also shown, in accordance with Luis & Fonseca ([24]).
Fig. 4 - Examples of density regulation guidelines for maritime pine. Regulation of density in maritime pine stands. Solid line: recommended prescription for the amount of trees to maintain based on a Fw = 0.21, dashed lines: usual recommended prescription (Fw = 0.23, [30] and [29]), and minimum spacing appropriate to thin (Fw = 0.16), and double lines: lower (SDI = 35%) and upper limit (SDI = 60%) of the optimum growth-density interval, the latter corresponding to the beginning of self-thinning.
Based on the above results, we propose a new guideline based on the stand density which stems from the obtained silvicultural model. An example of such guideline is presented in Tab. 3. The simulations of stand growth and thinning practices were obtained with ModisPinaster, assuming a density of 2200 trees ha-1 at age 15. This value of stand density is in line with the tree density reported for the species in the stand tables by Moreira & Fonseca ([29]) at age 15, being consistent with the average values detected in the database Data_Pinaster for the lower age classes. Results obtained with a traditional density guideline are also provided for comparison purposes.
Tab. 3 - Summary of the output results obtained with ModisPinaster assuming a standard traditional model (spacing factor of Wilson, Fw = 0.23) and a new silviculture model (Fw = 0.21), for a stand in a medium site quality (SI35 = 16 m), with an initial number of trees at age 15 of N = 2200 trees ha-1. For both models it was assumed a thinning regime with a 7-year cycle with a first thinning made at stand age of 22 years, and a final cut at 50 years. The differences in percentage points among scenarios are displayed in brackets. (Fw): Wilson’s spacing factor; (t): stand age; (N): number of trees per hectare; (dg): quadratic mean diameter; (V): stem volume. The “r” symbol refers to the removed material by thinning (thin.) or at the final cut.
| t (years) | Fw = 0.23 | Fw = 0.21 | ||||
|---|---|---|---|---|---|---|
| Nr (trees ha-1) |
dgr (cm) |
Vr (m3 ha-1) |
Nr (trees ha-1) |
dgr (cm) |
Vr (m3 ha-1) |
|
| 22 (1st thin.) |
844 | 9.6 | 36.8 | 574 (- 32%) |
9.5 (- 1.0%) |
24.2 (- 34.2%) |
| 29 (2nd thin.) |
484 | 14.2 | 57.0 | 580 (+ 20%) |
13.3 (- 6.3%) |
60.0 (+ 5.3%) |
| 36 (3rd thin.) |
229 | 19.0 | 57.1 | 274 (+ 20%) |
17.8 (- 6.3%) |
59.2 (+ 3.7%) |
| 43 (4th thin.) |
129 | 23.5 | 56.2 | 155 (+ 20%) |
21.9 (- 6.8%) |
58.5 (+ 4.1%) |
| 50 (final cut) |
514 | 31.5 | 374.7 | 617 (+ 20%) |
29.9 (- 5.1%) |
409.1 (+ 9.2%) |
| 50 (Total) |
- | - | 581.8 | - | - | 611.0 (+ 5.0%) |
Discussion
Relationship between stand density and understory vegetation
In this study, we empirically assumed that a high tree density in maritime pine stands results in the reduction of the existing understory vegetation, although to our best knowledge it has not been statistically tested so far. Indeed, it is expected that the higher light interception exerted by denser overstory canopy could negatively affect understory vegetation growth.
Our results showed a significant effect of stand density on understory cover in maritime pine stands, in accordance with the empirical statement and in line with the expectations. The “regulating” effect of overstory density on understory has been reported for other forest systems ([4], [28], [15], [11], [8]). Results are also in agreement with the expected dynamics of development of these ecosystems. The spacing factor Fw displayed a stronger relationship between the absence/presence of understory vegetation than any of the stand density variables considered as predictor variables in the logistic regression model. The relationship points towards an increasing likelihood of the understory presence (cover ≥ 10%) with increasing values of the Wilson factor, i.e., with larger average space among the trees (Fig. 2). The Stand Density Index and the basal area of the stands were also significantly related to the understory presence. The opposite curve trend associated with those variables (Fig. 2) reveals a tendency similar to that reported for Fw, with the denser stands less prone to present understory vegetation. Other authors have also reported strong negative correlations of canopy cover with understory development, quantified in terms of SDI ([28]) or stand basal area ([15], [11], [8]).
Stand density model
The proposed density option with a reference value of Fw = 0.21 is slightly far from the recommended prescription by Oliveira ([30]) and Moreira & Fonseca ([29]) of Fw = 0.23, in terms of number of standing trees, but distant from the density level for which it is still appropriate to thin (Fw = 0.16).
The proposed values of N and dg can also be analyzed in terms of Stand Density Index values. Considering the self-thinning allometric model ([24]), the proposed guideline corresponds to keeping the stand after thinning in the 30 to 40% interval of SDI, close to the optimum growth-density zone, according to Long ([22]). Hence, it is not expected to observe losses in total yield due to self-thinning. Assuming that the results obtained by Alegria ([2]), using natural regeneration of maritime pine for a scenario with Fw = 0.20 (this being the most similar to our proposal) are generalizable, it is expected that the silvicultural model results in one of the highest values for stand yield, average annual increment and pulp wood yield.
Compared to the common standard (Fw = 0.23), the proposed option will result in a 20% increase in the number of standing trees with a collateral modification in average tree size and in total stand yield. These values can change depending on the adopted management regime of thinning and vary with site quality. When we simulated the stand growth by ModisPinaster assuming different management scenarios in sites of low, medium and high quality, the largest differences were found in a site with medium quality and with a 7-year thinning cycle. In this simulation scenario, a decrease by 1 to 6.8% is likely to occur in the tree diameter (both standing and cut trees) and an increase of about 2.2 to 5% in the total volume of the stand (which represents an overall range of 13 to 29.2 m3 ha-1). The reported values are shown in Tab. 3.
The reduction in the average diameter obtained using Fw = 0.21 was 1 to 6.8%, reflecting variations between 0.1 and 1.6 cm. However, admitting the usual amplitude class of 5 cm adopted in Portugal, these differences ar not expressive as the values of dg for both spacings (Fw = 0.23 and 0.21) are kept globally in the same diameter classes for the thinning and rotation ages, allowing an equal return in monetary value.
The silvicultural model obtained by setting Fw = 0.21 has several advantages compared to the recommended (Fw = 0.23) option in P. pinaster, in terms of reduced proliferation of understory and more cylindrical and longer stem logs suitable for pole production. On the other hand, its application might be technically more demanding, as denser stands may results in very high values of slenderness ratio (h/d), which could compromise the stability of stands and increase their vulnerability. However, it is interesting to note that the risk of damage remains similar for both the above silvicultural models, and lower than that expected for critical situations (e.g., Fw = 0.16). In a previous study on the probability of mortality in pine stands associated with wind damages, Fonseca ([13]) concluded that, for a given value of h/d ratio for the dominant trees, stands with spacing factors greater than 0.20 (which include the model proposed here) are less likely to suffer damages compared to stands with lower spacing values (Fw ≤ 0.20). The probability of mortality increases with thinning weight, but it does not vary as much by changing densities from 0.20 to 0.23.
The stocking option proposed here for P. pinaster stands in northern Portugal and based on Fw = 0.21 (H-B = 21, for a square spacing) is recommended as a control measure over the understory vegetation, as it ensures at the same time one of the highest values of stand yield, without endangering the stand stability due to wind and snow. The management option based on Fw = 0.21 is expected to be an adequate silvicultural model in other maritime pine forests in the Mediterranean region. The negative effect of stand density on the understory might also depress the natural regeneration of maritime pine. While this might be of concern for some species, it is not especially relevant for the case study, as maritime pine is an intolerant species.
Managing density as an adaptive management procedure
Managing fire hazard is much more complex than solely reducing the proliferation of understory vegetation. Understory is not the only variable determining flame length and fire severity. Other variables, including the fuel vertical continuity characterized by the vertical structure of the understory and overstory, as well as the canopy base height and the canopy bulk density, need to be taken into account ([1]). Nevertheless, as understory fuel is a critical component of fire hazard, it is crucial to keep a dense canopy cover to shade the understory and reduce the available fuel, as an alternative to the fuel treatments proposed by Graham et al. ([18]), such as the case of prescribed fire. As stated by Coll et al. ([11]), managing the canopy cover to control the understory shrubby vegetation is an ecological alternative to the current mechanical management techniques. The silvicultural option for pine maritime forests suggested in this study can help the adaptive management of maritime pine forests in areas prone to forest fires.
Conclusions
A statistically significant relationship between stand density, measured by the Wilson spacing factor, and the understory cover was found for maritime pine stands, confirming empirical knowledge. A new stand density regulation option, based on Fw = 0.21, is proposed for maintaining the minimum number of trees in the stand which ensures sufficient shading to prevent the proliferation of understory vegetation, thus reducing crown fire hazard. The model developed here represents a supporting, ecologically-based tool for density regulation of maritime pine stands in areas prone to forest fires.
The studied area is the largest continuous area covered with P. pinaster in mainland Portugal, encompassing a wide range of stand conditions in terms of density and understory vegetation. The representativeness of the supporting data set (in terms of number of sample plots and variability of the stands characteristics) provides confidence in the generalization of the results for the same species in different locations.
Acknowledgements
The authors would like to thank Prof. Carlos Pacheco Marques (UTAD, Portugal) for supporting data collection and the preparation of the Data_Pinaster database. This research has been funded by PAMAF Project 4004 and Project Agro 372.
The authors would like to thank Teresa Enes for her assistance in the preparation of Fig. 1.
The authors had equally contributed to database organization, data analysis, model development, discussion of the results and paper writing.
References
Gscholar
Gscholar
Gscholar
Gscholar
Gscholar
Gscholar
Online | Gscholar
CrossRef | Gscholar
Gscholar
Gscholar
Gscholar
Gscholar
Online | Gscholar
Gscholar
Gscholar
Authors’ Info
Authors’ Affiliation
Departamento de Ciências Florestais e Arquitetura Paisagista (CIFAP), Universidade de Trás-os-Montes e Alto Douro, 5000-801 Vila Real (Portugal)
Instituto de Conservação da Natureza e das Florestas, Parque Florestal, 5000-567 Vila Real (Portugal)
Corresponding author
Paper Info
Citation
Fonseca TF, Duarte JC (2017). A silvicultural stand density model to control understory in maritime pine stands. iForest 10: 829-836. - doi: 10.3832/ifor2173-010
Academic Editor
Rupert Seidl
Paper history
Received: Jul 16, 2016
Accepted: Jun 26, 2017
First online: Sep 25, 2017
Publication Date: Oct 31, 2017
Publication Time: 3.03 months
Copyright Information
© SISEF - The Italian Society of Silviculture and Forest Ecology 2017
Open Access
This article is distributed under the terms of the Creative Commons Attribution-Non Commercial 4.0 International (https://creativecommons.org/licenses/by-nc/4.0/), which permits unrestricted use, distribution, and reproduction in any medium, provided you give appropriate credit to the original author(s) and the source, provide a link to the Creative Commons license, and indicate if changes were made.

Web Metrics
Breakdown by View Type
Article Usage
Total Article Views: 51313
(from publication date up to now)
Breakdown by View Type
HTML Page Views: 42049
Abstract Page Views: 3500
PDF Downloads: 4573
Citation/Reference Downloads: 21
XML Downloads: 1170
Web Metrics
Days since publication: 3187
Overall contacts: 51313
Avg. contacts per week: 112.71
Article Citations
Article citations are based on data periodically collected from the Clarivate Web of Science web site
(last update: Mar 2025)
Total number of cites (since 2017): 14
Average cites per year: 1.56
Publication Metrics
by Dimensions ©
Articles citing this article
List of the papers citing this article based on CrossRef Cited-by.
Related Contents
iForest Similar Articles
Research Articles
Long-term implications of traditional forest regulation methods applied to Maritime pine (Pinus pinaster Ait.) forests in central Spain: a century of management plans
vol. 3, pp. 33-38 (online: 02 March 2010)
Research Articles
Influence of tree density on climate-growth relationships in a Pinus pinaster Ait. forest in the northern mountains of Sardinia (Italy)
vol. 8, pp. 456-463 (online: 19 October 2014)
Review Papers
Should the silviculture of Aleppo pine (Pinus halepensis Mill.) stands in northern Africa be oriented towards wood or seed and cone production? Diagnosis and current potentiality
vol. 12, pp. 297-305 (online: 27 May 2019)
Research Articles
Is it needed to integrate mixture degree in Stand Density Management Diagram (SDMD)?
vol. 16, pp. 274-281 (online: 28 October 2023)
Research Articles
Role of serotiny on Pinus pinaster Aiton germination and its relation to mother plant age and fire severity
vol. 12, pp. 491-497 (online: 02 November 2019)
Research Articles
Effects of defoliation by the pine processionary moth Thaumetopoea pityocampa on biomass growth of young stands of Pinus pinaster in northern Portugal
vol. 3, pp. 159-162 (online: 15 November 2010)
Research Articles
Impact of wildfire on the edaphic microarthropod community in a Pinus pinaster forest in central Italy
vol. 8, pp. 874-883 (online: 05 May 2015)
Research Articles
Age and thinning effects on elemental composition of Pinus pinaster and Pinus radiata needles
vol. 14, pp. 299-306 (online: 08 June 2021)
Research Articles
Tree-oriented silviculture: a new approach for coppice stands
vol. 9, pp. 791-800 (online: 04 August 2016)
Commentaries & Perspectives
Benefits of a strategic national forest inventory to science and society: the USDA Forest Service Forest Inventory and Analysis program
vol. 1, pp. 81-85 (online: 28 February 2008)
iForest Database Search
Search By Author
Search By Keyword
Google Scholar Search
Citing Articles
Search By Author
Search By Keywords
PubMed Search
Search By Author
Search By Keyword


