Effects of altitudinal gradients on leaf area index, soil microbial biomass C and microbial activity in a temperate mixed forest ecosystem of Northwestern Turkey
iForest - Biogeosciences and Forestry, Volume 10, Issue 1, Pages 334-340 (2016)
doi: https://doi.org/10.3832/ifor1974-009
Published: Dec 15, 2016 - Copyright © 2016 SISEF
Research Articles
Abstract
A high leaf area index (LAI) can provide indications of high fertility, such as optimal health and productivity in forest ecosystem. Yet, studying the microbial biomass and inherent activity in any forest ecosystem may enable better understanding of the role of microorganisms in soil quality and nutrient cycling. This study was carried out in the western Black Sea region of Turkey with the aim to determine the influence of elevation on LAI, microbial biomass and activity in a mixed forest ecosystem. Marked differences in the LAI, light transmission, soil temperature, Corg/Ntotal ratio, and microbial properties were found at sites sampled at different elevations along an altitudinal gradient (i.e., 1200, 1300 and 1400 m a.s.l.). The LAI was statistically (P < 0.05) higher at 1300 (3.28 m2 m-2) and 1400 m (3.20 m2 m-2) elevations compared to 1200 m (2.84 m2 m-2) elevation, whereas the light transmission was statistically (P < 0.05) lower at 1300 and 1400 m elevations than that at 1200 m elevation. The amount of microbial biomass C at 1300 m (892.26 µg g-1) and 1400 m (725.99 µg g-1) elevations was significantly (P < 0.05) higher than that at 1200 m (650.84 µg g-1) elevation. Basal respiration did not vary significantly (P > 0.05) along the altitudinal gradient. An increase in respiration per unit biomass (i.e., increasing the metabolic quotient - qCO2) was also found in the sampling sites at 1200 m a.s.l. There was a positive relationship between the microbial biomass C and LAI (r = 0.612, P < 0.01) and negative relationship between the qCO2 and LAI (r = - 0.592, P < 0.01). Our results showed that the elevation gradient has a significant influence on the LAI, microbial biomass C and microbial activity in the forest stand type analyzed. A subdivision of the forest stand types into different sub-types according to their productivity and development is advisable and recommended for forest management and administration purposes.
Keywords
Basal Respiration, Bornmullerian Fir, Cmic/Corg Percentage, Metabolic Quotient (qCO2), Oriental Beech, Soil
Introduction
Leaf area index (LAI), broadly defined as the amount of leaf area (m2) in a canopy per unit ground area (m2), is a measure of canopy foliage content commonly used in studies of vegetation and ecosystem. LAI can be measured by direct biomass harvest methods, litter trapping, or indirect optical techniques like an analysis of hemispherical photographs ([7]). Knowledge of LAI is important to quantify energy and mass exchange rates of water and carbon between the vegetative canopy and atmospheric interface that contain fluxes of carbon, solar energy, and water. Interception or transmission of light is also related to LAI ([42]). In addition, LAI is a major structural characteristic of the forest ecosystem as it affects several significant ecological processes, including evapotranspiration, photosynthesis, rainfall, interception, surface albedo, and dry deposition ([28], [40]). According to Perry et al. ([35]), LAI firmly combines with litterfall, microclimate and productivity, thus directly and indirectly affecting the forest floor and soil properties.
As an ecological indicator, soil microbial biomass is the living part of soil organic matter measurements, which is useful for determining the degree of disturbance and subsequent system recovery. In terms of soil productivity, soil biomass controls the major processes of nutrient transformation and cycling, soil organic matter maintenance, and macroaggregation for favorable water and aeration characteristics ([41]) as it is responsible for the decomposition and mineralization of plant and animal residues in the soil ([6]).
The microbial biomass C to organic C ratio (Cmic/Corg) is mainly utilized to measure soil C losses during decomposition as well as the efficiency of organic C conversion into microbial C. It is a qualitative soil parameter that allows comparison across soils with different organic matter content ([43], [47]) and it can provide effective early warning for soil quality deterioration ([49]). The basal respiration of a soil reflects either the overall activity or the energy spent by the indigenous microbial pool ([3]), thereby it represents a well-established parameter to be used to determine decomposition rates ([43]), and a good indicator of soil microbial activity ([34]).
The metabolic quotient (qCO2) or the amount of CO2-carbon produced per unit microbial biomass carbon an equivalent unit is dominated the specific respiration rate ([43]). In other words, qCO2 reflects the energy necessary to maintain metabolic activity in relation to the energy necessary for synthesizing biomass. Therefore, it has been used as a microbial stress indicator ([17]). In a previous study ([3]), qCO2 has been used to elucidate issues regarding soil development, substrate (glucose, protein, carbohydrate, etc.) quality, ecosystem development and the response to stress.
In Turkey, the forest stand type is a part of the forest which covers at least one hectare area and is distinguished from the forest or other vegetation types in the surrounding areas based on age, tree species, tree species composition, arrangement, density, growth, etc. The forest stand type is the smallest unit of both silviculture and forest management activities. It is assumed that productivity and growth of trees are similar within its boundaries as most ecological factors (e.g., climatic, edaphic and biotic factors) are supposed to be homogeneous within a forest stand type. On the other hand, it is believed that soil properties, productivity and growth within the same forest stand type may vary as a consequence of differences in elevation, which has proven to affect the aforementioned ecological factors. Therefore, we hypothesize that LAI, soil microbial biomass and inherent activity will show a decrease with increasing elevation in Turkish fir-beech mixed forest ecosystem. In particular, we expect LAI, soil microbial biomass C and basal respiration at lowest elevations to be higher compared with higher elevations. For this reason, we selected three study sites at different altitudes (1200, 1300 and 1400 m a.s.l., respectively) in order to determine any changes of the above parameters within the same forest stand type across different elevations. To our best knowledge, changes in LAI, soil microbial biomass and activity along altitudinal gradients in Turkey was not yet studied. The specific goals of this work were to: (1) investigate the effects of altitudinal gradients on LAI, light transmission, microbial biomass C, basal respiration, and metabolic quotient; and (2) analyze possibile relationships among LAI, light transmission, microbial biomass C, basal respiration and other soil characteristics.
Material and methods
Site description
The study area covered about 26.65 ha near the town of Ovacuma, Karabük Province, in the Western Black Sea region of Turkey (longitude: 32° 40′ 26″ - 32° 40′ 49″ E; latitude: 41° 23′ 20″ - 41° 23′ 28" N). The area has an average elevation of 1325 m a.s.l. (range: 1200-1450 m) with an average slope of 45% and northwest aspect. Based on the Thornthwaite’s method ([44]), the study area is classified as very humid and microthermal, with little or no water deficit and a temperate-efficiency regime that is normal to megathermal (AC’2ra’). The annual mean precipitation over the past 30 years was 1681.2 mm, and the annual mean temperature was 6.6 °C. Brown forest soils lay here on gravel and limestone parent materials belonging to clastic and carbonate rocks of Ulus and Ahmetusta formations. The study area is covered by a temperate mixed forest dominated by Bornmullerian fir (Abies nordmanniana subsp. bornmülleriana Mattf.) and Oriental beech (Fagus orientalis Lipsky).
The forest stand type analyzed in this study is an uneven-aged mixed forest (young/mature Fir-Beech - GKnD), with a mean canopy closure of approx. 85% (range: 71-100%), with a a mean timber volume of 363.4 m3 ha-1. It is fairly homogeneous in terms of tree species composition, basal area, number trees per hectare, age, productivity (mainly phytomass) and growth, and easily distinguishable from the neighboring forest stand type.
Three different sites along an altitudinal gradients were selected in the study area at 1200, 1300, and 1400 m a.s.l. Six experimental sites at a distance of 100-m each other were established at each elevation, totaling 18 different sites. The experimental sites were selected among those showing similar environmental conditions (e.g., climate, geological substrate) to better compare LAI and soil properties across different elevations.
Canopy leaf area
Hemispherical photography is a common technique used to determine the percentage of light transmission through canopy gaps ([15], [40]). Three hemispherical photographs were taken at each experimental site using a Sigma 8 mm fisheye lens mounted on a Canon EOS 5D digital SLR camera. In total, 54 hemispherical photographs were taken at the different elevation. Additional hemispherical photographs were taken at each point where soil samples were collected (see below). The exact dating and timing of each photograph was recorded. All the photographs were taken under similar weather conditions, avoiding rain or snow periods, and direct sunlight during image collection.
LAI, light transmission, and canopy gaps were assessed on digital photographs using the software package Hemisfer® ver. 1.5.3 ([40]). According to Nobis & Hunziker ([31]), automatic thresholding was used for image analysis, while for the LAI estimation the Lang’s method was preferred ([24]). Parts of the trees other than their leaves, such as stems and branches, can influence the values of LAI; thus, the corrections recommended by Schleppi et al. ([40]) for non-linearity and slope and by Chen & Cihlar ([13]) for clumping effect were integrated into the calculations.
Soil sampling
On July 2013, soil samples of mineral topsoil (0-6.5 cm depth) were collected at 100-m distance from one another at each elevation after removing stones, plant and root debris. The soil depth of 0-6.5 cm was chosen since this layer is considered to be more easily influenced by any change compared to lower layers. At each sampling site, one sample was collected for physical and chemical analyses, and one sample for the microbial analysis, totaling 36 samples from 18 sites (6 sites per elevation). The samples collected for microbial analysis were sifted using 2 mm sieve and stored at 4 °C until the measurement of the microbial biomass C and basal respiration, while the samples for physical and chemical analyses were collected as soil cores (8.1 cm diameter), air-dried, ground and sieved (< 2 mm).
Physical and chemical analyses
We determined soil moisture content gravimetrically by drying the soil samples at 105 °C in an oven until they achieved a constant weight. The hydrometer method was used to calculate the particle size distribution of the soil ([11]). The pH of the soil in a 1:2.5 soil/water suspension was measured using a pH meter, while the electrical conductivity of the soil was determined with an electrical conductivity meter using a 1:5 soil/water extract. The organic C content of the soil samples was estimated using potassium dichromate oxidation, and the total N content was measured using Kjeldahl digestion. The soil bulk density (g cm-3) was calculated via weight-to-volume ratio using both mass and volume. The particle density (g cm-3) was measured on soil samples using the Pycnometer method, and pore space was calculated using bulk and particle densities ([38]). Soil temperature was measured directly using a sensitive thermometer that was approximately inserted into the surface soil to a depth of 0-6.5 cm.
Biochemical analyses of soils
Soil microbial biomass C (Cmb) was determined by extracting 30 g oven-dried equivalents of field moist mineral soil samples in 0.5 M K2SO4 (1:4 w/v) using the chloroform fumigation extraction method, and calculated using the following equation ([46] - eqn. 1):
where KEC refers to the difference in extractable organic C between the fumigated and unfumigated samples. The proportionality factor for the biomass C released by fumigation extraction was 2.64.
Basal respiration was determined using the sodium hydroxide (NaOH) trap method. In brief, basal respiration was measured by placing 30 g of soil into 500 ml beakers and incubating the soil in the dark at 25 °C in airtight, sealed jars along with 25 ml 1 M NaOH. After 7 days, the generated CO2 was measured with a titration of excess NaOH with 1 M HCl ([1]). The metabolic quotient (qCO2) was calculated as the basal respiration rate (mg CO2-C h-1 g-1) of microbial biomass ([3]). All the analyses were performed with two replications.
Statistical analysis
The effect of altitude on LAI and soil characteristics was assessed by one-way ANOVA using a 95% confidence limit (α = 0.05). Duncan’s test was applied for testing the differences among means. Additionally, Pearson’s correlation analysis was carried out to assess the relationships among the considered variables. All the statistical analyses were performed using the software package SPSS® ver. 16.00 (SPSS Inc., Chicago, IL, USA).
Results and discussion
Physical and chemical properties
Differences in the physical and chemical properties of soils at the different altitudinal ranges are summarized in Tab. 1. Although no statistically significant (P > 0.05) differences were found in soil moisture among the elevations, the soil moisture content was slightly higher at 1200 m a.s.l. when compared to elevations of 1300 and 1400 m. According to Pierce & Running ([36]), LAI is an important structural property of the forest. Because leaf surfaces are the primary sites of energy, gas and water exchanges and of important physiological processes such as photosynthesis, interception, transpiration, and evapotranspiration are a function of LAI. Hoff & Rambal ([19]) have also indicated that with increasing LAI, drainage decreases while transpiration and interception increases. Therefore, the relatively high soil moisture content at 1200 m elevation might have been due to the lower LAI. Further, the correlation between soil moisture and LAI was negative (r = - 0.287) but not significant (P > 0.05 - Tab. 2). Moreover, a significant difference in soil temperature was found among the considered altitudinal ranges.
Tab. 1 - Comparisons of the physical and chemical characteristics of the soil at different elevation of the sampling sites. Values represent the means of 18 samples ± standard deviation. Different letters in the same row indicate significant differences (P < 0.05) among means after one-way ANOVA.
| Soil characteristics | Elevation (m a.s.l.) | ||
|---|---|---|---|
| 1200 | 1300 | 1400 | |
| Soil temperature (°C) | 15.41 ± 1.23 a | 13.75 ± 0.20 b | 13.70 ± 0.75 b |
| Bulk density (g cm-3) | 1.12 ± 0.14 a | 1.26 ± 0.31 a | 1.29 ± 0.14 a |
| Particle density (g cm-3) | 2.66 ± 0.02 a | 2.69 ± 0.06 a | 2.67 ± 0.04 a |
| Pore space (%) | 57.91 ± 5.52 a | 53.27 ± 11.55 a | 51.53 ± 4.64 a |
| Sand (%) | 46.13 ± 4.41 a | 44.25 ± 9.55 a | 56.12 ± 5.95 b |
| Silt (%) | 21.54 ± 4.22 a | 21.15 ± 4.89 a | 17.72 ± 2.09 a |
| Clay (%) | 32.33 ± 5.97 a | 34.60 ± 6.39 a | 26.16 ± 3.95 b |
| Soil texture | Sandy clay loam | Sand clay loam | Sandy clay loam |
| Moisture content (%) | 23.00 ± 6.89 a | 16.51 ± 2.78 a | 16.76 ± 5.29 a |
| Soil pH (H2O) | 5.80 ± 0.77 a | 6.43 ± 0.92 a | 5.69 ± 0.36 a |
| Electrical conductivity (dS m-1) | 0.69 ± 0.11 a | 0.81 ± 0.25 a | 0.71 ± 0.15 a |
| Organic C (%) | 4.38 ± 1.15 a | 4.63 ± 0.72 a | 4.70 ± 0.48 a |
| Total N (%) | 0.47 ± 0.14 a | 0.34 ± 0.03 a | 0.39 ± 0.13 a |
| Corg/Ntotal ratio | 9.35 ± 0.42 a | 13.79 ± 3.24 b | 12.97 ± 3.61 b |
Tab. 2 - Pairwise correlation matrix (Pearson’s r - n = 36) for the chemical and microbiological characteristics of the soil at elevations of 1200, 1300, and 1400 m a.s.l. (*): P < 0.05; (**): P < 0.01; (ns): not significant.
| Variables | Soil temperature |
Soil moisture |
LAI | Light transmission |
Organic C | Total N | Corg/Ntotal | Microbial biomass C |
Cmic/Corg ratio |
Basal respiration |
qCO2 |
|---|---|---|---|---|---|---|---|---|---|---|---|
| Soil temperature (°C) | 1 | -0.034 ns | -0.609** | 0.680** | -0.402 ns | 0.018 ns | -0.274 ns | -0.499* | -0.125 ns | -0.018 ns | 0.335 ns |
| Soil moisture (%) | - | 1 | -0.287 ns | 0.134 ns | 0.463 ns | 0.776** | -0.534* | -0.106 ns | -0.490* | 0.499* | 0.619** |
| Leaf area index (LAI, m-2 m-2) | - | - | 1 | -0.894** | 0.041 ns | -0.317 ns | 0.343 ns | 0.612** | 0.598** | -0.179 ns | -0.592** |
| Light transmission (%) | - | - | - | 1 | 0.004 ns | 0.265 ns | -0.250 ns | -0.595** | -0.625** | 0.274 ns | 0.643** |
| Organic C (%) | - | - | - | - | 1 | 0.565* | 0.133 ns | 0.344 ns | -0.571* | 0.738** | 0.509* |
| Total N (%) | - | - | - | - | - | 1 | -0.727** | 0.060 ns | -0.435 ns | 0.446 ns | 0.474* |
| Corg/Ntotal ratio | - | - | - | - | - | - | 1 | 0.155 ns | 0.008 ns | 0.046 ns | -0.133 ns |
| Microbial biomass C (μg g-1) | - | - | - | - | - | - | - | 1 | 0.508* | 0.280 ns | -0.239 ns |
| Cmic/Corg (%) | - | - | - | - | - | - | - | - | 1 | -0.443 ns | -0.707** |
| Basal respiration (µg CO2-C g-1 h-1) | - | - | - | - | - | - | - | - | - | 1 | 0.844** |
| qCO2 (mg CO2-C g-1 Cmic h-1) | - | - | - | - | - | - | - | - | - | - | 1 |
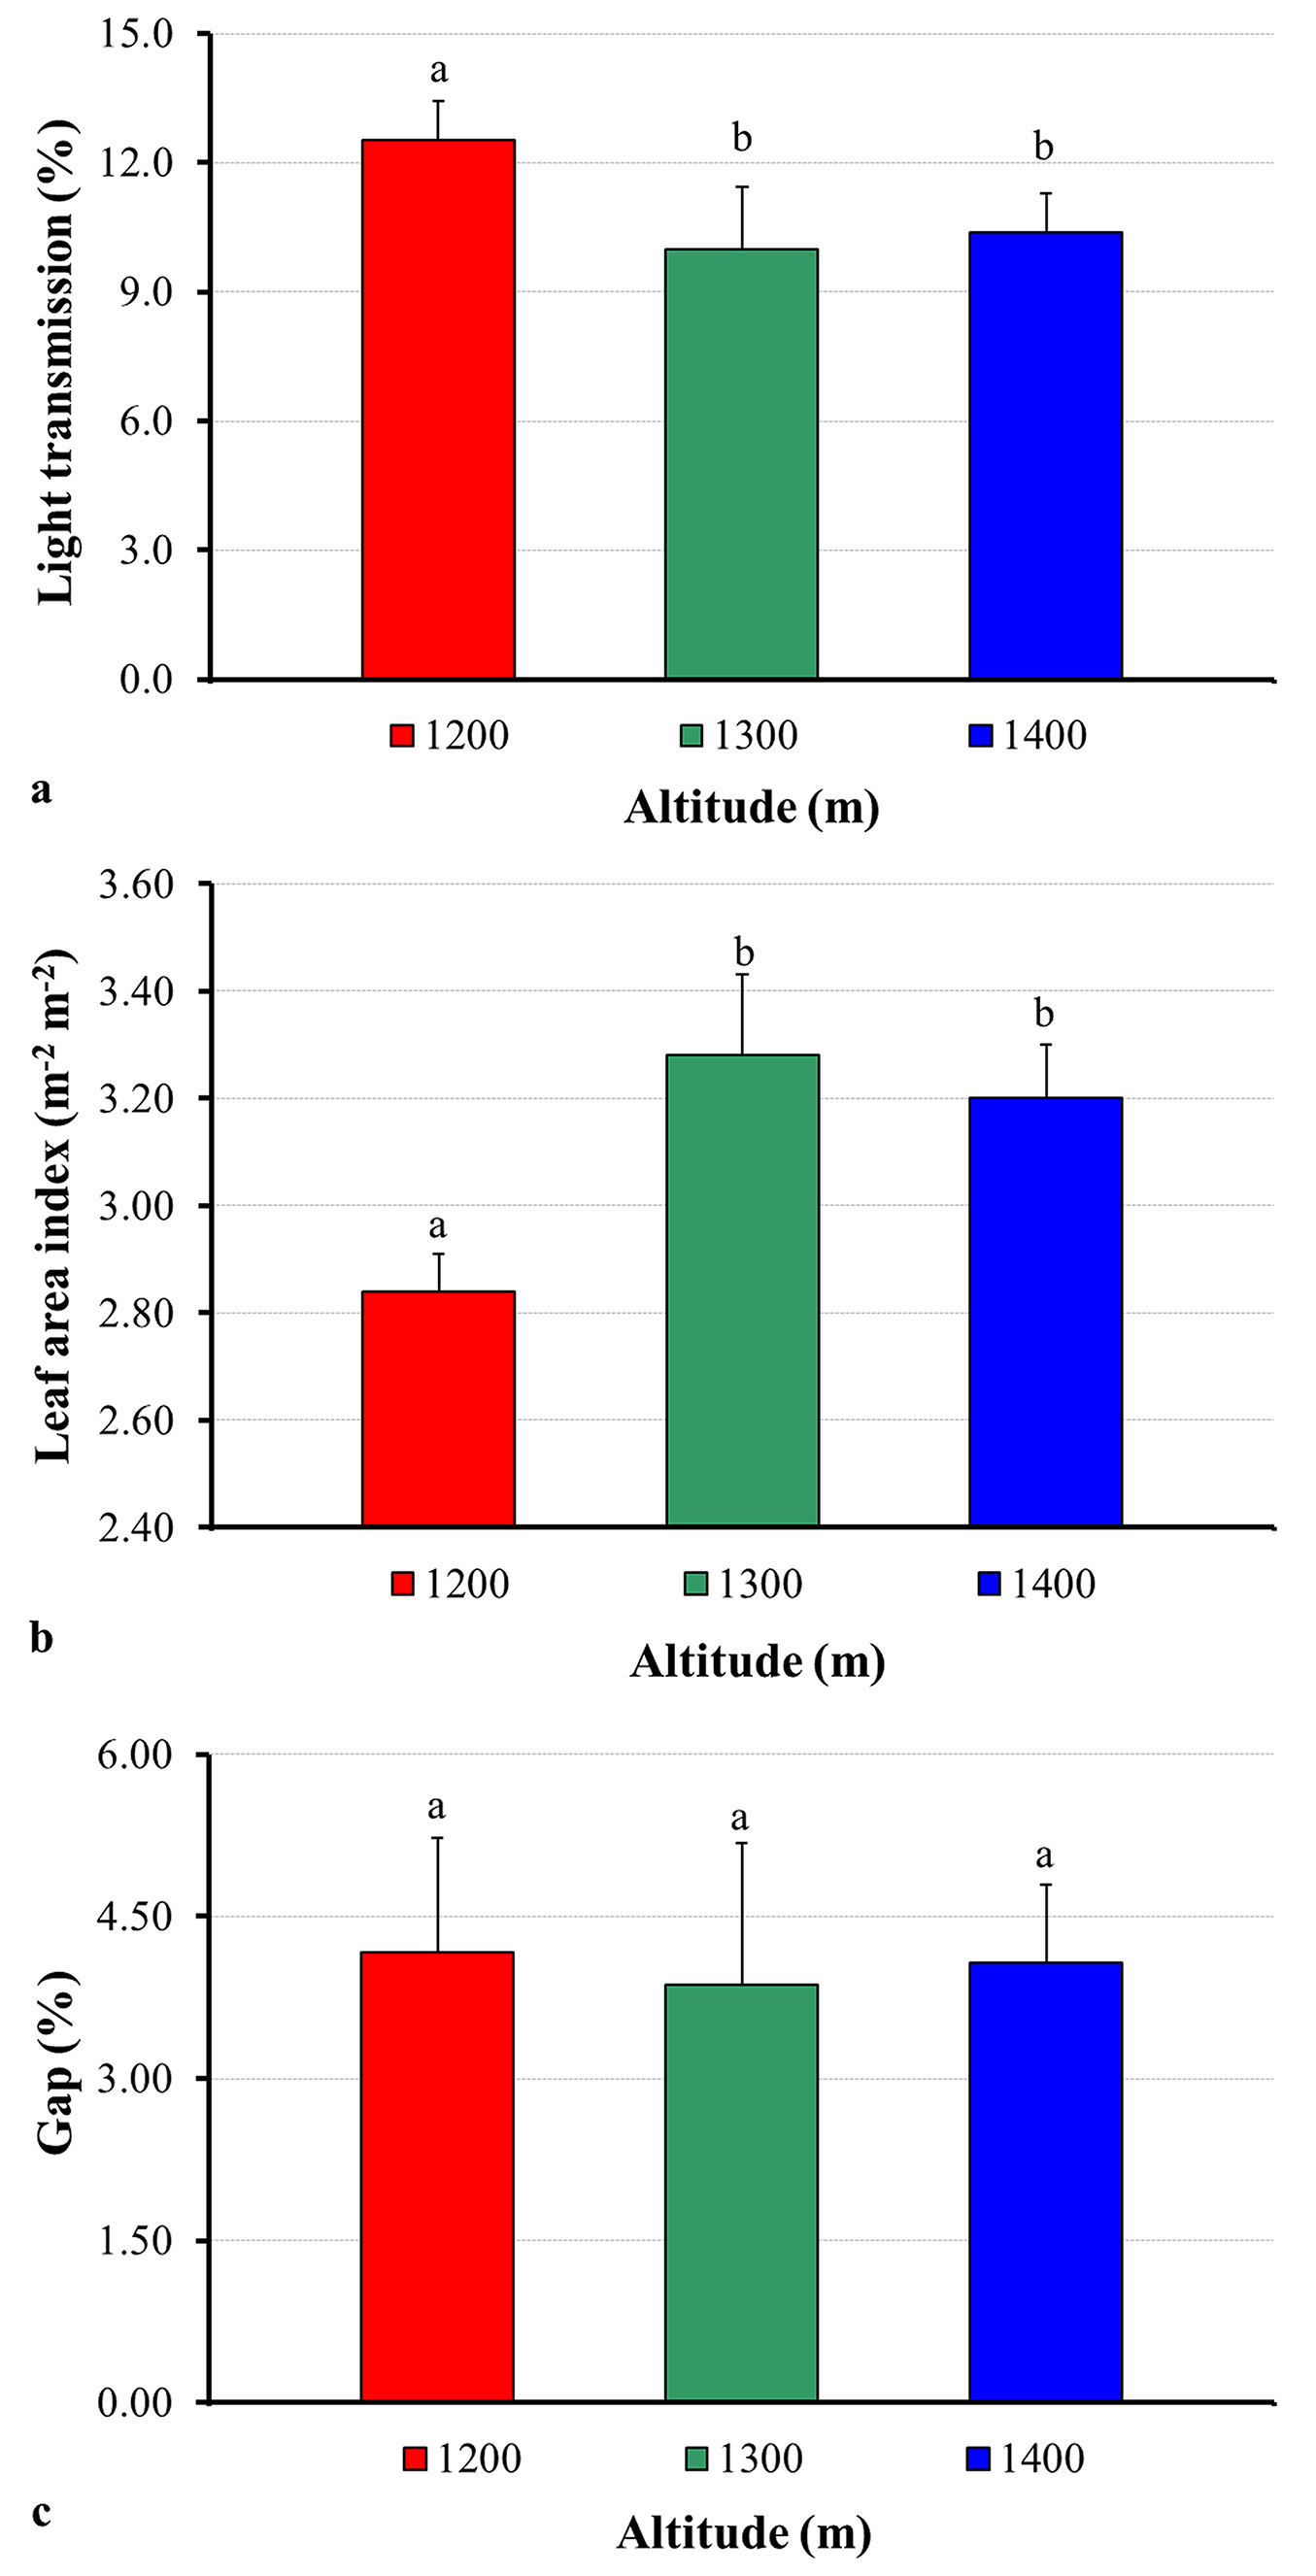
Soil temperature at the elevation of 1200 m a.s.l. was significantly higher compared to 1300 and 1400 m elevations (P < 0.05). Similarly, light transmission was higher at an elevation of 1200 m compared to the other elevations (Fig. 1a). The increase in the LAI results in a lower light penetration through the gaps, leading to a decrease in soil temperature, as also reported by Öztürk & Bolat ([33]). Fassnacht et al. ([16]) stated that the LAI of a canopy determines light, thermal, and moisture conditions within that canopy. In the current study, the correlation between the soil temperature and the LAI was negative (r = - 0.609; P < 0.01 - Tab. 2), while the correlation between soil temperature and light transmission was positive (r = 0.680; P < 0.01). Additionally, large and regular gaps within or between canopies, as is the case for the sites at 1200 m altitude, permit a greater amount of light to penetrate the canopy ([18]).
Fig. 1 - Variation in the light transmission (a), leaf area index (b), and gap (c) at different elevations. Error bars represent the standard deviation. Different letters (above the bars) indicate significant differences (P < 0.05) between the different elevation of the sampling sites.
On the other hand, the lower Corg/Ntotal ratio (i.e., decomposition ratio) at 1200 m elevation compared to the other elevations may have been due to high soil temperature, moisture content, and total N (Tab. 1). These factors may accelerate the decomposition of soil organic matter, which would be further harmful to soil quality in sites with lower soil organic matter ([47]). The correlations between soil moisture, total N, and temperature and the Corg/Ntotal ratio were positive (r = 0.619, 0.474, and 0.335, respectively - Tab. 2). In addition, a rapid decomposition of organic matter is not necessarily a favorable feature of the soil, as stable organic matter plays a considerable positive role in the soil physical and chemical characteristics ([43]).
Leaf area index, light transmission, and gap
In this study, the LAI values differed at different elevations, ranging from 2.75 to 2.84 m2 m-2 at 1200 m, from 2.95 to 3.57 m2 m-2 at 1300 m, and from 3.04 to 3.20 m2 m-2 at 1400 m a.s.l. The mean LAI values were significantly higher (P < 0.05) at an elevation of 1300 m (3.28 m2 m-2) and an elevation of 1400 m (3.20 m2 m-2) than at an elevation of 1200 m (2.84 m2 m-2 - Fig. 1b). This result was really unexpected and not consistent with the findings of other studies, indicating a reduction in LAI with elevation ([23]). However, Luo et al. ([27]) stated that LAI showed a negative quadratic relationship to elevation (r2 = 0.58, P < 0.001), whereas net primary productivity (NPP) generally decreased with increasing elevation with a linear relationship (r2 = 0.73, P = 0.001). Breda & Granier ([12]) and Meier & Leuschner ([29]) noted that LAI has paramount importance for forest biogeochemical fluxes since interception, radiation, canopy conductance, stand transpiration and productivity are all closely linked to LAI. Additionally, Breda & Granier ([12]) reported that a high LAI is an indication of the high site fertility and also the optimal health and productivity of the stand. Hence, the results obtained in the current study may reflect a rise in carbon gain at higher elevations and may suggest an increment in the aboveground biomass and tree height. Indeed, a high LAI at the 1300 m elevation may reflect an increase in primary productivity, biomass, and other biophysical properties in the forest ecosystem. Maass et al. ([28]) reported that LAI may also change within ecosystems depending on the site conditions, especially soil fertility, nutrients, and water supply. On the other hand, other authors have investigated the LAI in different forest ecosystems, reporting values varying from 1.7 to 5.3 m2 m-2 in a coniferous forest ([36]), from 0.5 to 8 m2 m-2 in temperate deciduous forests ([25]) and from 5.6 to 9.5 m2 m-2 in European beech stands ([26]). The latter values are greater than the LAI values obtained in the current study. According to previous studies ([12], [26]), these differences could be due to the type and age of the stand and the availability of water in the soil, which is determined by climate and the properties of the soil as well as the different methods used.
In this study maximum and minimum percentages of light transmission along the elevation gradient varied from 11.63% to 13.64% at 1200 m, from 8.19% to 11.87% at 1300 m, and from 9.30% to 11.36% at 1400 m. The mean percentage of light transmission at 1300 m (9.98%) and 1400 m (10.39%) elevation were significantly lower (P < 0.05) than the percentage of light transmission at 1200 m elevation (12.53% - Fig. 1a). It is well known that understory light availability decreases as overstory density increases ([30]). In other words, light penetration through the canopy to the forest floor bounds upward based on the amount of canopy foliage, commonly defined as LAI ([45]). Others factors such as leaf size, specific leaf area, canopy form and deciduous leaf mass also affect light penetration ([14]). In the current study, there was a significant negative correlation (r = - 0.894, P < 0.01) between LAI and light transmission (Tab. 2). Similarly, Schleppi et al. ([39]) found that the LAI has a negative correlation to the light index of ground vegetation.
Gap percentages at elevations of 1200, 1300, and 1400 m were 3.01-6.26%, 2.20-5.14%, and 2.92-5.61%, respectively. Gap percentage was greater at the 1200 m elevation than at the 1300 and 1400 m elevations (4.17, 3.87, and 4.07%, respectively). However, there was no obvious difference (P > 0.05) in the mean gap percentage for the three different altitudes (Fig. 1c). According to Perry et al. ([35]), the gap is a physical opening in the canopy that allows light to reach seedlings in the forest understory and most tree species require gaps in order to reach maturity.
Microbial biomass C, Cmic:Corg percentage, basal respiration, and metabolic quotient
The mean values for microbial biomass C were 650.84 µg g-1, 892.26 µg g-1 and 725.99 µg g-1 at elevations of 1200, 1300 and 1400 m, respectively. An important observation from this study is that the amount of soil microbial biomass increases as the elevation increases. Indeed, the results showed that at the elevations of 1300 and 1400 m soils comprised significantly higher microbial biomass C than soil at an elevation of 1200 m a.s.l. (Fig. 2a). Because microbial biomass C responds more rapidly and to a greater extent to changes, it can be taken into account to be a more sensitive indicator of soil quality than organic matter or TOC ([37]). Wardle & Ghani ([48]) also reported that low microbial biomass values can be characteristic of either disturbance or stress. Hence, the results obtained in this study showed that there were more favorable conditions for microbial biomass at the 1300 m and 1400 m altitudes than at the 1200 m altitude. This difference may be caused by high levels of organic C at the 1300 m and 1400 m altitudes, although there were no significant (P > 0.05) differences along the altitudinal gradient (Tab. 1). Jenkinson ([21]) indicated that the amount and activity of soil microbial biomass are extremely influenced by soil organic matter. Additionally, Anderson ([4]) stressed that every metabolic activity of organisms is dependent on available carbon sources, and found a very close quantitative relationship between microbial biomass C and the total C. Similarly, the correlation between the microbial biomass C and soil organic C in this study was positive (r = 0.344), though not significant (P > 0.05 - Tab. 2).
Fig. 2 - Variation in the microbial biomass C (a), Cmic/Corg % (b), basal respiration (c), and metabolic quotient (qCO2 - d) at different elevations . Error bars represent the standard deviation. Different letters (above the bars) indicate significant differences (P < 0.05) between the different elevation of the sampling sites.
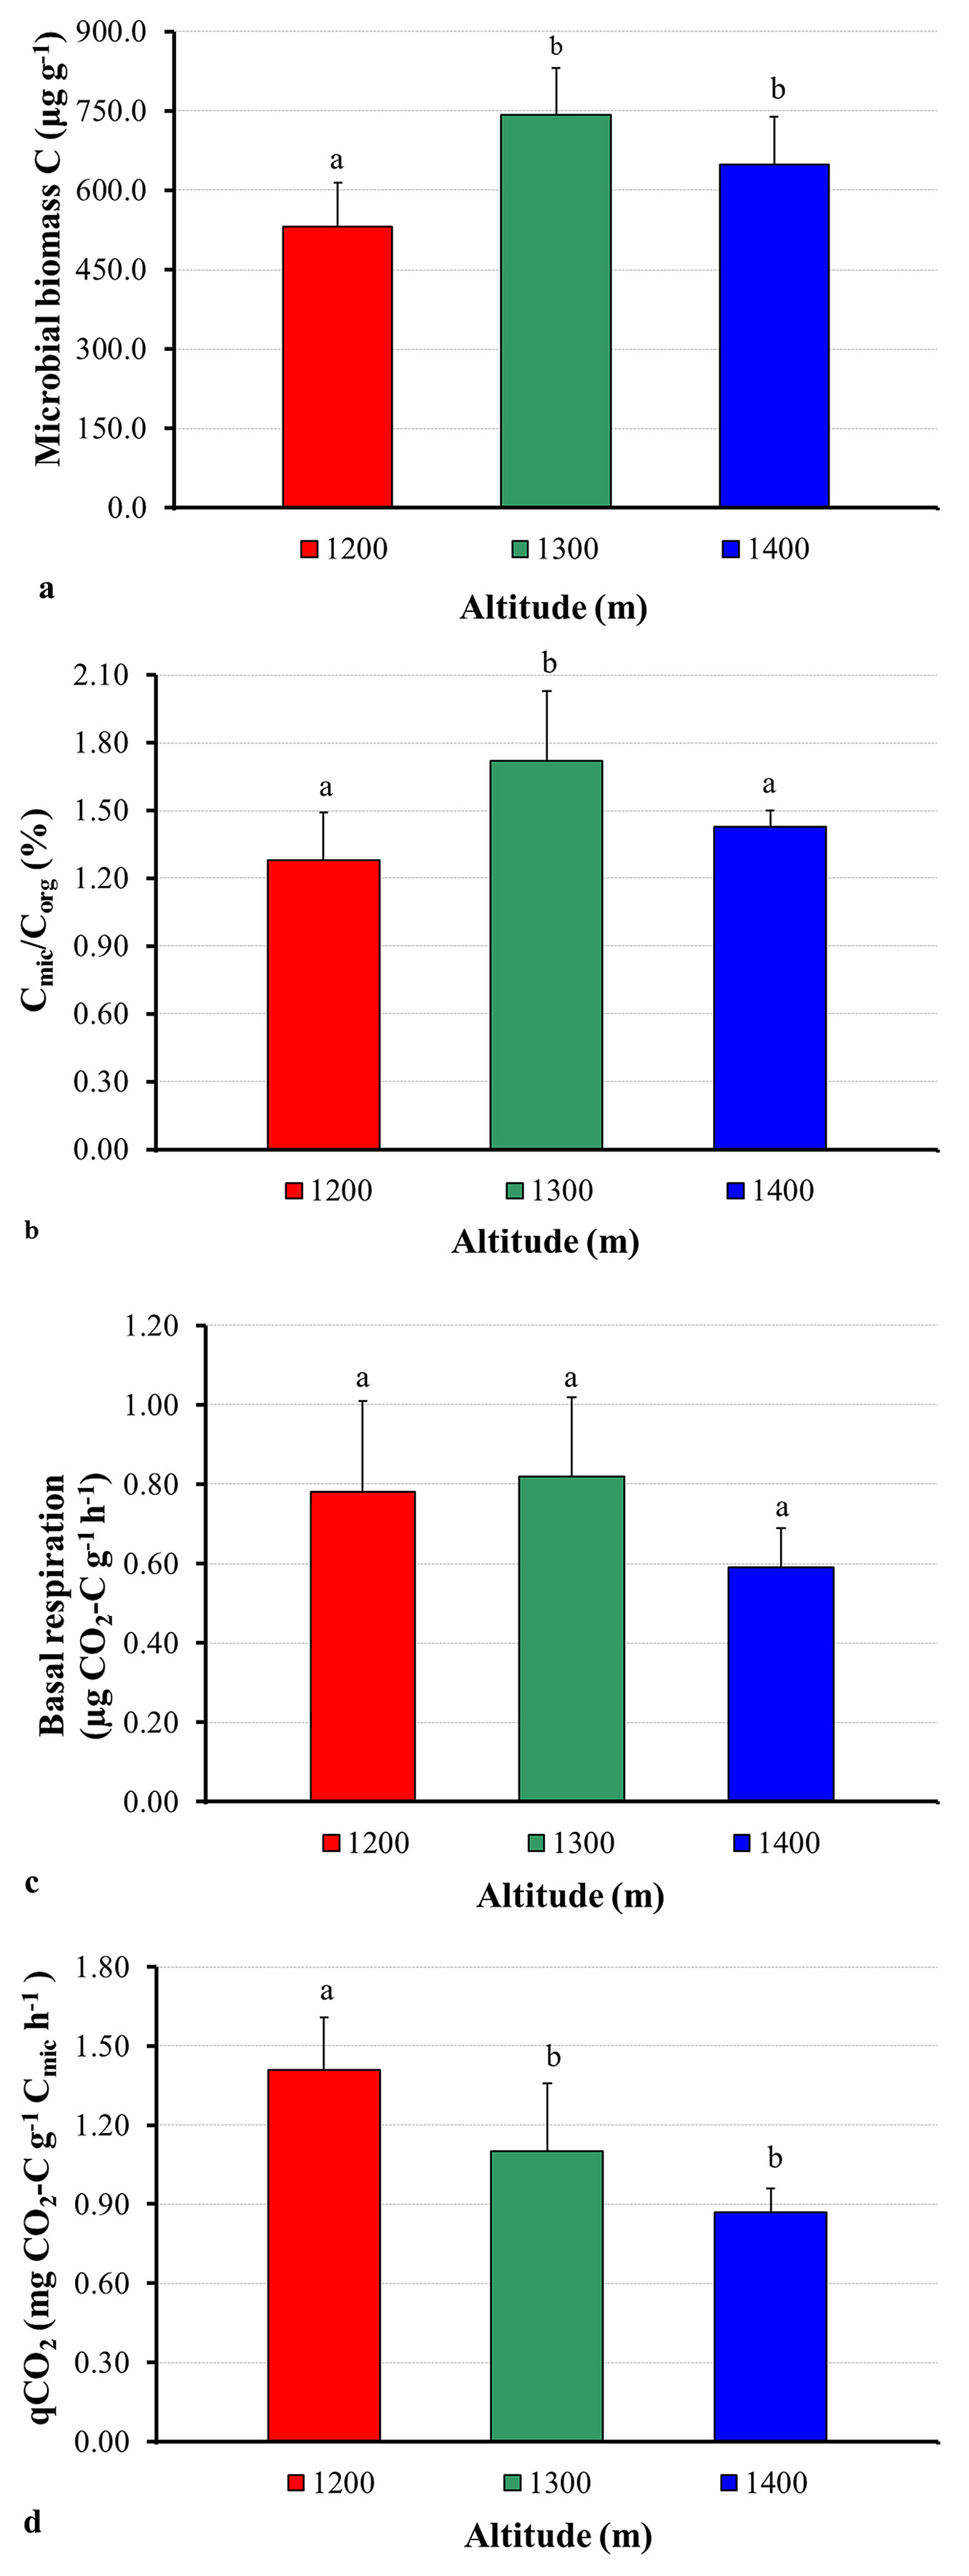
In the current study, the Cmic:Corg percentage was higher at the elevation of 1300 m than at the elevation of 1200 and 1400 m, with averages of 1.72, 1.28, and 1.43%, respectively (Fig. 2b). This difference may be caused by the higher soil microbial biomass C amount at the 1300 m elevation. According to Anderson & Domsch ([2]), the Cmic/Corg percentage may indicate if the soil carbon is at equilibrium, or it increases or decreases. Such parameter is also related to the substrate quality (glucose, protein, carbohydrate, etc.) and could be used as a stability indicator for quick recognition of any environmental change ([4]). The Cmic/Corg percentage should usually range between 0.27 to 7.0% ([2]), and the values detected in this study are within this range, though they are below the equilibrium threshold for soil proposed by Jenkinson & Ladd ([22]), namely, about 2.2% of soil organic carbon were found to belong to the microbial biomass. Eventually, the high value of the Cmic/Corg percentage found at the 1300 m elevation, as compared with other elevations, pointed out high inputs and availability of organic matter for soil microorganisms, thus reflecting favorable environmental conditions for the improvement of soil microorganisms. Otherwise, despite the fact that no statistical differences were found in the soil pH among the altitudinal gradients (Tab. 1), decreasing Cmic/Corg percentages observed at both the 1200 m and 1400 m elevations could be due to increasing soil acidity. Likewise, it is reported in the literature that the Cmic/Corg percentage can remarkably decrease under acidic conditions when compared to neutral conditions ([5]).
Pascual et al. ([34]) suggested that because soil microbial activity has a direct influence on both ecosystem stability and fertility, basal respiration is a good indicator of soil microbial activity. This parameter points out the oxidative capacity of soil microorganisms and, therefore, is affected both by the number of microorganisms and the energy sources present in the soil ([8]). In the current study, mean soil basal respiration was 0.78, 0.82, and 0.59 µg CO2-C g-1 h-1 for the elevation of 1200, 1300, and 1400 m, respectively. The highest basal respiration was found at the 1300 m elevation. However, there was no obvious a difference (P > 0.05) in basal respiration along the elevation gradient (Fig. 2c). The high basal respiration denoting a great biological activity at the 1300 m elevation might be explained by high soil organic carbon and microbial biomass at these sites, since the correlations between soil organic carbon and microbial biomass with soil basal respiration were positive (r = 0.738 and 0.280, respectively - Tab. 2). Indeed, Nsabimana et al. ([32]) hypothesized that soil basal respiration positively correlated with soil organic carbon and microbial biomass and substrate (glucose, protein, carbohydrate, etc.) availability can be the main factor that influences both size and activity of the microbial community. On the other hand, Islam & Weil ([20]) suggested that high rates of basal respiration can occur either as a result of a large pool of labile C substrates or rapid oxidation of a smaller pool. High basal respiration may represent either ecological stress and degradation or a high level of ecosystem productivity. Because of this ambiguity, a clearer interpretable parameter is the rate of basal respiration per unit of microbial biomass (qCO2).
In this study, the soil metabolic quotient (qCO2) ranged from 1.13 to 1.85 mg CO2-C g-1 Cmic h-1 (mean: 1.42) at elevation 1200 m, from 0.70 to 1.50 mg CO2-C g-1 Cmic h-1 (mean: 1.10) at elevation 1300 m, and from 0.76 to 1.01 mg CO2-C g-1 Cmic h-1 (mean: 0.87) at elevation 1400 m (Fig. 2d). This parameter is the most straightforward index in the literature and is extensively used to evaluate ecosystem development, disturbance, or system maturity. Physiologically, this index defines the substrate (glucose, protein, carbohydrate, etc.) that is mineralized per unit of microbial biomass carbon ([8]). Additionally, Bauhus & Khanna ([9]) reported that if the qCO2 is high (supposedly increased), available C amount and substrate (glucose, protein, carbohydrate, etc.) quality are low for microbial biomass. Therefore, less biomass can be produced because more carbon is used for respiration ([4]). In this context, our results demonstrated that there was a stress on soil microbial biomass at elevation 1200 m since there was an increase in respiration per unit biomass (i.e., increasing qCO2). Conversely, the lower qCO2 obtained at both 1300 and 1400 m elevation indicated a high efficiency of soil microbial biomass in the utilization of available C for respiration. Consequently, a high qCO2 reflects a high maintenance carbon demand, and if the soil system cannot replenish the carbon which is lost through respiration, microbial biomass must decline ([5]). On account of this, it has been reported that the relationship between qCO2 and microbial biomass was negative ([48]), which is consistent with the results of our study (Tab. 2). Additionally, qCO2 was negatively related (P < 0.05) to the Cmic/Corg percentage (Tab. 2). According to Bolat ([10]), this negative relationship denotes that relatively more C is used for growth than for respiration under favorable soil conditions, such as good substrate (glucose, protein, carbohydrate, etc.) quality. Indeed, a negative relationship between qCO2 and the Cmic/Corg percentage has been previously reported ([6], [10]).
Conclusion
Based on the results obtained in this study, altitude significantly affects the LAI and light transmission, whereas the altitudinal gradient has no significant influence on the canopy gaps. As expected, elevation can affect soil chemicals and microbiological properties by changing soil temperature, moisture, nutrient availability, metabolic quotient, microbial biomass and activity, all of which are sensitive indicators of soil quality. Consequently, the productivity and health of the same forest type at different elevations may differ, depending on stand characteristics (e.g., age, tree species, density, growth etc.) as well as on soil health and quality in Turkish forests. Therefore, a subdivision of forest stand types into different sub-types according to their productivity and development is advisable and recommended for forest management and administration purposes. Further, this study provides valuable insight into the relationship between elevation gradients and microbial biomass and activity in Turkish forest ecosystems.
Acknowledgements
We are grateful to Ahmet Ergün and Kivanç Yüksel for their valuable efforts during the field and laboratory works. The authors thank the Turkish General Directorate of Forestry (TGDF) and the Turkish State Meteorological Service (TSMS) for assistance and data support throughout this study. We gratefully acknowledge the anonymous referees for their comments and constructive suggestions.
The authors declare no conflict of interest with any other persons or communities.
References
Gscholar
Gscholar
Gscholar
Gscholar
Gscholar
Authors’ Info
Authors’ Affiliation
Bartin University, Faculty of Forestry, Department of Forest Engineering, Division of Soil Science and Ecology, Bartin (Turkey)
Bartin University, Faculty of Forestry, Department of Landscape Architecture, Division of Landscape Techniques, Bartin (Turkey)
Corresponding author
Paper Info
Citation
Bolat I, Öztürk M (2016). Effects of altitudinal gradients on leaf area index, soil microbial biomass C and microbial activity in a temperate mixed forest ecosystem of Northwestern Turkey. iForest 10: 334-340. - doi: 10.3832/ifor1974-009
Academic Editor
Francesco Ripullone
Paper history
Received: Jan 07, 2016
Accepted: Jul 20, 2016
First online: Dec 15, 2016
Publication Date: Feb 28, 2017
Publication Time: 4.93 months
Copyright Information
© SISEF - The Italian Society of Silviculture and Forest Ecology 2016
Open Access
This article is distributed under the terms of the Creative Commons Attribution-Non Commercial 4.0 International (https://creativecommons.org/licenses/by-nc/4.0/), which permits unrestricted use, distribution, and reproduction in any medium, provided you give appropriate credit to the original author(s) and the source, provide a link to the Creative Commons license, and indicate if changes were made.

Web Metrics
Breakdown by View Type
Article Usage
Total Article Views: 74066
(from publication date up to now)
Breakdown by View Type
HTML Page Views: 57422
Abstract Page Views: 11678
PDF Downloads: 3615
Citation/Reference Downloads: 60
XML Downloads: 1291
Web Metrics
Days since publication: 3485
Overall contacts: 74066
Avg. contacts per week: 148.77
Article Citations
Article citations are based on data periodically collected from the Clarivate Web of Science web site
(last update: Mar 2025)
Total number of cites (since 2017): 8
Average cites per year: 0.89
Publication Metrics
by Dimensions ©
Articles citing this article
List of the papers citing this article based on CrossRef Cited-by.
Related Contents
iForest Similar Articles
Research Articles
Effect of different dolomitic limestone dosages on soil respiration in a mid-altitudinal Norway spruce stand
vol. 12, pp. 357-365 (online: 05 July 2019)
Short Communications
Influences of Black Locust (Robinia pseudoacacia L.) afforestation on soil microbial biomass and activity
vol. 9, pp. 171-177 (online: 16 February 2015)
Research Articles
Influences of forest gaps on soil physico-chemical and biological properties in an oriental beech (Fagus orientalis L.) stand of Hyrcanian forest, north of Iran
vol. 13, pp. 124-129 (online: 07 April 2020)
Research Articles
Short-time effect of harvesting methods on soil respiration dynamics in a beech forest in southern Mediterranean Italy
vol. 10, pp. 645-651 (online: 20 June 2017)
Research Articles
Spatial heterogeneity of soil respiration in a seasonal rainforest with complex terrain
vol. 6, pp. 65-72 (online: 07 February 2013)
Research Articles
Soil respiration along an altitudinal gradient in a subalpine secondary forest in China
vol. 8, pp. 526-532 (online: 01 December 2014)
Research Articles
Seasonal dynamics of soil respiration and nitrification in three subtropical plantations in southern China
vol. 9, pp. 813-821 (online: 29 May 2016)
Research Articles
Relationship between microbiological, physical, and chemical attributes of different soil types under Pinus taeda plantations in southern Brazil
vol. 17, pp. 29-35 (online: 28 February 2024)
Research Articles
Soil respiration and carbon balance in a Moso bamboo (Phyllostachys heterocycla (Carr.) Mitford cv. Pubescens) forest in subtropical China
vol. 8, pp. 606-614 (online: 02 February 2015)
Research Articles
Thinning effects on soil and microbial respiration in a coppice-originated Carpinus betulus L. stand in Turkey
vol. 9, pp. 783-790 (online: 29 May 2016)
iForest Database Search
Search By Author
Search By Keyword
Google Scholar Search
Citing Articles
Search By Author
Search By Keywords
PubMed Search
Search By Author
Search By Keyword


