The estimation of canopy attributes from digital cover photography by two different image analysis methods
iForest - Biogeosciences and Forestry, Volume 7, Issue 4, Pages 255-259 (2014)
doi: https://doi.org/10.3832/ifor0939-007
Published: Mar 26, 2014 - Copyright © 2014 SISEF
Research Articles
Abstract
Proximal sensing methods using digital photography have gained wide acceptance for describing and quantifying canopy properties. Digital hemispherical photography (DHP) is the most widely used photographic technique for canopy description. However, the main drawbacks of DHP have been the tedious and time-consuming image processing required and the sensitivity of the results to the image analysis methods. Recently, an alternative approach using vertical photography has been proposed, namely, digital cover photography (DCP). The method captures detailed vertical canopy gaps and performs canopy analysis by dividing gap fractions into large between-crown gaps and small within- crown gaps. Although DCP is a rapid, simple and readily available method, the processing steps involved in gap fraction analysis have a large subjective component by default. In this contribution, we propose an alternative simple, more objective and easily implemented procedure to perform gap fraction analysis of DCP images. We compared the performance of the two image analysis methods in dense deciduous forests. Leaf area index (LAI) estimates from the two image analysis methods were compared with reference LAI measurements obtained through the use of litter traps to measure leaf fall. Both methods provided accurate estimates of the total gap fraction and, thus, accurate estimates of the LAI. The new proposed procedure is recommended for dense canopies because the subjective classification of large gaps is most error-prone in stands with dense canopy cover.
Keywords
Digital Cover Photography, Canopy Cover, Gap Fraction, Leaf Area Index, Dense Canopy
Introduction
The canopy regulates the main ecological and ecophysiological processes within the forest ecosystem. As such, the canopy drives the future growth of vegetation communities ([15]). The description and quantification of the canopy is a relevant target for both understanding and modeling ecosystem functioning, for monitoring and research programs and for calibrating remotely sensed vegetation indexes ([3]). However, due to the difficulty of direct measurement, indirect methods based on gap fraction measurements from ground level are frequently employed ([2], [9]).
Digital hemispherical photography (DHP), also known as fisheye photography, is the most widely used of several photographic techniques for canopy description. The method measures the gap fraction at multiple zenith angles, thus permitting simultaneous determination of several canopy descriptors, such as the leaf area index (LAI), light transmittance and foliage clumping using a field of view (FOV) of approximately 180° ([7], [5]). However, a drawback of hemispherical photography is the need for tedious and time-consuming image processing steps and the sensitivity of the results to the image processing method ([5], [1]). Despite recent improvements in the image analysis methods ([13]), accurate measurements of canopy characteristics using DHP still necessitate tedious and time-consuming analysis steps; accordingly, rapid and simplified procedures are strongly needed, particularly in the case of routine measures and/or large image sets.
As an alternative to DHP, Macfarlane et al. ([14]) proposed a photographic method that measures the gap fraction at a single zenith angle, namely, digital cover photography (DCP). The method has many advantages compared with DHP. Images taken from a single (vertical) and restricted FOV have better spatial resolution than DHP and, thus, are less sensitive to light conditions and camera exposure; as a consequence, DCP can be applied during normal working hours, unlike DHP. When used to estimate the LAI, DCP captures detailed vertical canopy gaps, which allows the division of the gap fraction into large, between-crown gaps and small, within-crown gaps, thus correcting the LAI for foliage clumping after the gap-removal process ([4]). In addition, the LAI is less affected by woody vegetation at narrow vertical angles than in hemispherical-sensor based methods ([10]). The greatest disadvantage of DCP for estimating the LAI is that it requires additional assumptions regarding leaf angle distribution. DHP does not require these assumptions ([5]).
As an approach to image analysis, DCP is a simple, rapid and convenient method and is, therefore, potentially highly suitable for the routine, broad-scale indirect measurement and monitoring of forest canopy attributes. However, the image processing steps used by default in DCP are not automated, and the classification of gap sizes into large gaps and small gaps has a substantial subjective component.
In this study, we propose an alternative procedure to provide a more objective, easily implemented classification of gap sizes into large gaps and small gaps. The performance of the two image analysis procedures was also compared in the study. The LAI estimates obtained with the two image analysis methods were compared with independent data obtained from litterfall measurements.
Material and methods
Foreground to digital cover photography
Cover photography is a single, restricted view angle method. Macfarlane et al. ([14]) tested photographs of the canopy obtained by upward-pointing digital cameras using a 70 mm equivalent lens, FOV approximates 30°. The resulting vertical image provides a measure of canopy cover; the output differs from that of hemispherical image, which provides a measure of canopy closure (or its complement, canopy openness = 1 - canopy closure; [8]). The differences between these two basic canopy measurements are schematized in Fig. 1.
Fig. 1 - Comparison of canopy closure from fisheye image (A) vs. canopy closure from cover images (B).
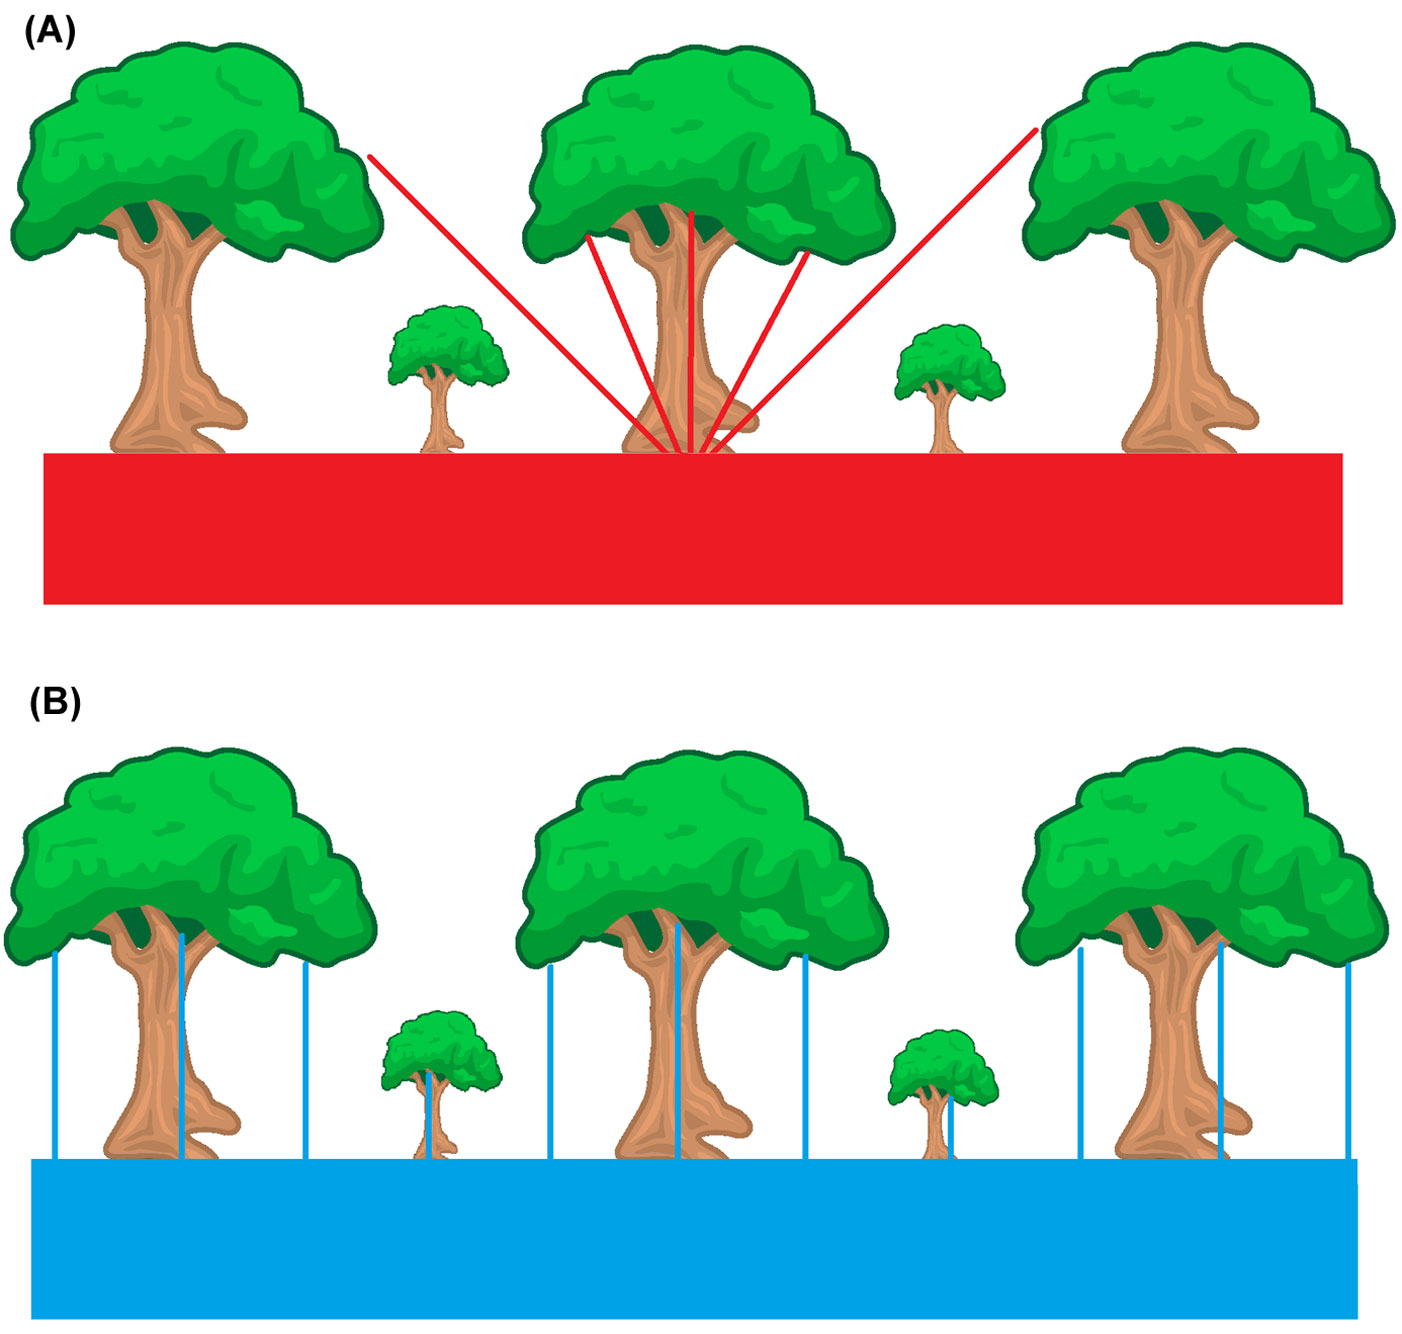
A relevant strength of cover photography, compared with hemispherical photography, is the method of capturing detailed vertical canopy gaps. The resulting high-resolution imagery allows the large, between-crown gaps (gL) to be discriminated from total gaps (gT). Large gaps are used to derive the complementary attribute, namely, crown cover (fc, eqn. 1), defined as the proportion of the forest floor covered by the vertical projection of the tree crowns. In contrast, foliage cover (ff, eqn. 2) is calculated as the complement of the total gap fraction (eqn. 1, eqn. 2):
Crown porosity (Ï ) is then calculated as the proportion of gaps within crown envelopes, excluding large gaps (eqn. 3):
Once fc, ff and Ï are determined, the LAI is computed based on a modified Beer-Lambert law (eqn. 4):
Eqn. 4 applies the Beer-Lambert law only within crowns. Therefore, it corrects the LAI estimates for clumping effects ([4], [14]). The LAI can alternatively be calculated considering the total gap fraction, thus omitting the clumping correction (eqn. 5):
The LAI estimates using eqn. 4 and eqn. 5 both require the assumption of a zenithal extinction coefficient (k).
Finally, the zenithal clumping index (Ω0) is computed as follows (eqn. 6):
Study sites
The data used in this study were sourced from Chianucci & Cutini ([6]); nine 0.5-1 ha permanent plots of dense deciduous forests (reference LAI measures ranging from 3.9 to 7.3 m2 m-2) were sampled in central Italy. The stands consisted of pure, even-aged stands with varying species composition (Turkey oak, Quercus cerris L.; beech, Fagus sylvatica L.; chestnut, Castanea sativa Mill.), age and basal area. Tab. 1 lists the principal stand characteristics of the studied stands.
Tab. 1 - Main characteristics of the studied stands.
| Species | Plot | Elevation | Age | Stems | Basal area |
|---|---|---|---|---|---|
| ID | m a.s.l. | years | n ha-1 | m2 ha-1 | |
| Q. cerris | 1 | 566 | 51 | 4509 | 30.2 |
| 2 | 568 | 51 | 3181 | 33.2 | |
| 3 | 589 | 51 | 4198 | 31.1 | |
| 4 | 594 | 54 | 402 | 21.2 | |
| F. sylvatica | 5 | 1080 | 66 | 108 | 14.7 |
| 6 | 1100 | 66 | 419 | 34.6 | |
| 7 | 1050 | 66 | 3324 | 45.3 | |
| C. sativa | 8 | 870 | 29 | 580 | 28.4 |
| 9 | 850 | 29 | 447 | 23.9 |
Image collection and analysis of DCP
Cover images were collected as FINE quality at maximum resolution (3 871 488 pixels) and as JPEG images using a point-and-shoot digital camera (Coolpix 4500, Nikon, Japan). The in-camera fixed lens was set to F2 (about 70 mm focal length in 35 mm equivalent format), aperture priority, maximum F-stop (9.6), ISO 100, auto-focus and auto-exposure. The lens was leveled and pointed upwards. For each stand, 15-25 photographs were taken at a height of 1.5 m on a grid of sample points, which were aligned to the litter traps grid. Images were collected near 10:30 AM, under uniform sky conditions. Image analysis was first performed on color imagery using GIMP (GNU image manipulation program - ⇒ http://www.gimp.org - hereafter: subjective procedure). We did not use the blue channel of RGB images because it should be preferably used to analyze images taken under diffuse sky conditions (i.e., near dawn or dusk, overcast sky - [11]). For each image, large between-crown gaps of RGB images were visually selected using the “Fuzzy” tool (GIMP). Total gaps were selected using the “select by color” (GIMP) tool, which automatically identifies gaps with color and luminance characteristics similar to those of large gaps.
The alternative procedure tested to perform gap size analysis (henceforth: assisted) moved from the consideration that total gap fraction was an objective, easily reproducible measure, whereas the distinction between large gaps and small gaps was noticeably operator-dependent. Therefore, we proposed an image analysis procedure that objectively classified large gaps from the total estimated gap fraction. Images were first pre-processed by applying a simple transformation to generate a feature representing greenness from the three channels of RGB images; similar transformations of digital images were commonly experienced in the agricultural literature (e.g., [12], [19] - eqn. 7):
This transformation provides more uniform illuminance while enhancing the contrast between the reflected light intensity of leaves and sky elements, allowing an objective discrimination between sky and non-sky pixels. For simplicity, woody vegetation is ignored due to its low contribution at a narrow vertical angle, and also based on the recognition that leaves tend to present themselves to obscure the underlying stems from the sun ([10]). Each image was then divided into nine (3x3) sub-images. We used R version 3.0.2 with the EBImage package uploaded to perform these pre-processing steps.
We used the following functions of the EBImage package ([16]) for R version 3.0.2 ([17]):
- readImage: for loading cover images into R programming environment;
- channel: for extracting R, G and B channels from each image;
- + and -: for calculating Greenness from the R, G and B channels of each image (eqn. 7);
- untile: for image sub-divisions.
For each sub-image, the total gaps were computed using the “select by color” tool in GIMP, and the ratio of total gaps to leaves was computed. We classified large gaps as those having a gaps-to-leaves ratio ≥ 0.50; this threshold was arbitrarily set after previous calibration with GIMP. Finally, gap fraction data were calculated at the image level and were used to estimate canopy attributes and the LAI from DCP theory (eqn. 1 to eqn. 6). To compute the LAI, we used extinction coefficients for Turkey oak, beech and chestnut of 0.57, 0.46 and 0.47, respectively, as calibrated in a previous study ([6]).
Direct measurements of LAI
Reference LAI values were directly estimated using litter traps. Chianucci & Cutini ([6]) describe the procedure and the accuracy of the method. In each plot, 9-15 litter traps were set out on a grid at 1 m above ground level with traps spaced 7-20 m apart based on the homogeneity and structure of the stand. Litterfall was collected every 2 weeks in fall and winter, with the last collection timed soon after the last leaf fall. Litter was sorted into its main components and then dried for at least 24 h to a constant weight in a fan-forced stove at 85 ± 2 °C. This method provides leaf dry mass per unit of ground area (g m-2). Specific leaf area (SLA - cm2 g-1) was estimated from a sub-sample of approximately 200 leaves for each stand, with samples collected at every litterfall. The area of unwrinkled and undamaged leaves was measured with a Li-Cor 3000 area meter (Licor, Lincoln, NE, USA), and the dry weight was measured. The resulting SLA was corrected using a shrinkage coefficient (ranging from 2.0 to 6.8%) estimated from a sub-sample of green leaves collected in the vicinity of the research plots. Finally, the total dry mass of leaves collected was converted to the LAI by multiplication of the dry weight by the corrected SLA.
Statistical analyses
We compared the effect of site (first factor) and image classification method (second factor) on estimated canopy attributes (fc, ff, Φ , LAICC, LAINC, Ω0) using a two-way ANOVA. No interactions between factors were observed; hence, the interaction term was removed from the analysis. The LAI values calculated from the image analysis methods were also compared with reference LAI values derived from independent measurements using litter traps ([6]). We used an RMA regression analysis because we were interested in determining whether the true slope of the relationship was equal to one and if intercept did not differ from zero ([18]). All analyses were performed using R version 3.0.2 ([17]).
Results
Tab. 2 lists the mean canopy attributes derived from DCP using different image analysis methods. No differences were observed for foliage cover estimates obtained from the two methods, implying that the total gap fraction was accurately estimated by both the methods; as a consequence, LAINC estimates did not differ significantly between the two methods even though the assisted procedures yielded slightly greater estimates of both ff and LAINC. In contrast, the assisted procedure yielded significantly greater foliage cover and, thus, larger crown porosity and smaller LAICC (ANOVA, p < 0.05).
Tab. 2 - Mean and standard error (in brackets) of crown cover (fc), foliage cover (ff), crown porosity (Φ) and leaf area index either corrected (LAICC) or not corrected (LAINC) for clumping, along with the zenithal clumping index (Ω0) obtained from DCP using either assisted or subjective image analyses. Asterisks indicate that the means of the canopy attributes differed between the two image analysis methods (p < 0.05).
| Method | n | f c | f f |
Φ
|
LAI CC | LAI NC | Ω0 |
|---|---|---|---|---|---|---|---|
| Assisted | 180 | 0.96 (0.01)* | 0.89 (0.01) | 0.08 (0.00)* | 5.18 (0.11)* | 4.73 (0.12) | 0.91 (0.02)* |
| Subjective | 180 | 0.92 (0.01)* | 0.87 (0.01) | 0.05 (0.01)* | 5.61 (0.11)* | 4.46 (0.12) | 0.79 (0.01)* |
The differing performance of the two methods was also apparent from the regressions of the LAI from photography against the LAI from the litter traps (Tab. 3).
Tab. 3 - RMA regression coefficients for leaf area index (LAI) from DCP using two image analysis methods (y-axis) and LAI from litter traps (x-axis). The regression model was as follows: LAIDCP = a ·LAILITTERTRAPS + b. Coefficients of determination (R2), root mean squared errors (RMSE) and probability (p) of the regressions were reported. (*): models in which the intercept does not differ from zero and the slope does not differ from 1 (p <0.05).
| Method | LAI | n | a | b | R2 | RMSE | p |
|---|---|---|---|---|---|---|---|
| Assisted | CC | 9 | 1.21* | -0.39* | 0.96 | 0.48 | 0.01 |
| NC | 9 | 1.20* | 0.27* | 0.7 | 0.31 | 0.01 | |
| Subjective | CC | 9 | 0.63* | 3.08* | 0.51 | 0.6 | 0.05 |
| NC | 9 | 1.11* | 1.06* | 0.82 | 0.39 | 0.05 |
Overall, the DCP method provided good estimates of the LAI, regardless of the image analysis method applied, due to the strong correlation with the LAI from the litter traps (the slopes did not differ from unity, and the intercept did not differ from zero). Prior to the correction of the LAI for clumping, the two image analysis methods showed similar performance; after correction of the LAI for clumping, the assisted method outperformed the subjective analysis of cover images based on its stronger correlation with the LAI from litter traps, its slope value closer to unity and its intercept value closer to zero than those of the subjective method. The poorer results obtained from the subjective classification indicated that large gaps were not adequately estimated by the operator.
Discussion
We have shown that both image analysis methods employed in DCP provided accurate gap fraction measurements and, therefore, accurate estimates of the LAI. Because the stands investigated were characterized by a dense canopy, the results were attributed to the high image resolution of DCP, which allowed accurate gap fraction retrieval near the zenith, in agreement with a previous report ([6]). This conclusion is supported by the similar foliage cover estimates obtained from the two image analysis methods; accordingly, foliage cover or total gaps can be regarded as objective, operator- independent measures that can be used directly to estimate LAI, in agreement with previous studies ([14], [6]). In contrast, the assisted method was found to provide more accurate estimates of crown cover and porosity than the subjective method, due to the superior correlation of the LAICC with the LAI from the litter traps. The default image analysis involved the visual selection of large between-crown gaps to estimate crown cover and porosity; however, a clear distinction between large and small gaps was a challenging issue in dense canopies, and the classification of large gaps in such dense stands depended largely on the operator’s choice (Fig. 2).
Fig. 2 - Example of a cover image (plot ID = 2) that was classified into total gaps (yellow + blue) and large gaps (blue) using either the assisted (A) or the subjective (B) image analysis. Foliage cover in both methods averaged 0.95. The assisted procedure provided estimate of crown cover of 0.98, while subjective procedure provided estimate of crown cover of 0.96.
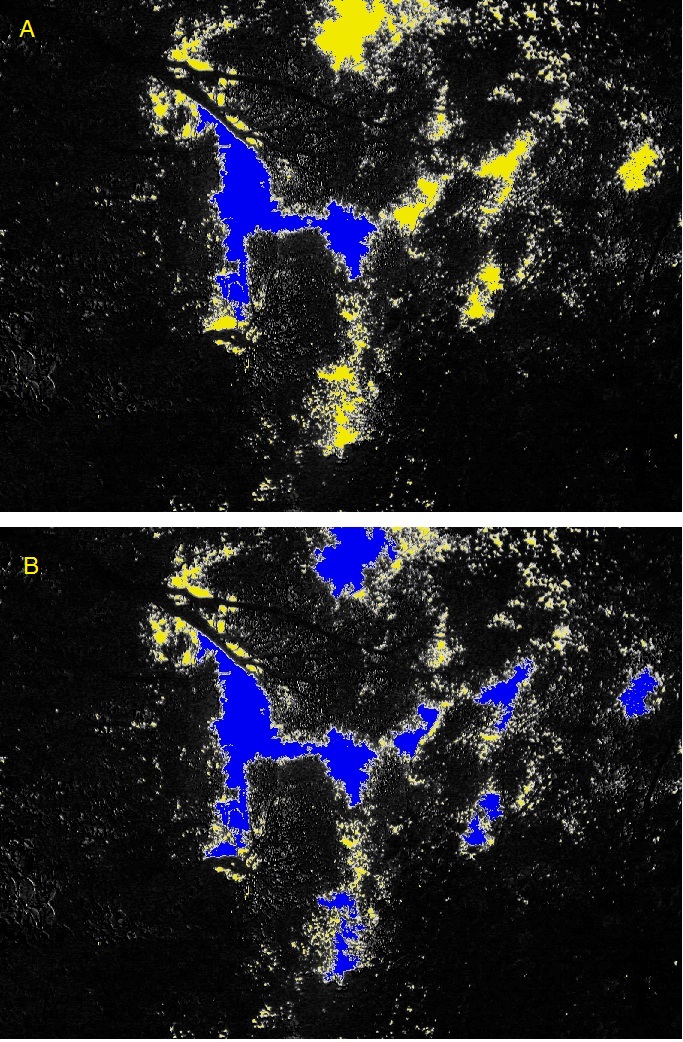
In the current study, a comparison of individual images suggested that more gaps were subjectively classified as large gaps in images with very high cover (fc ≥ 0.95), resulting in lower estimates of crown cover than in the assisted procedure. Most likely, the use of objective and automated procedures to classify large gaps based on their area is strongly recommended, particularly in the case of dense forest canopies. We conclude that the methodology proposed herein can greatly improve cover image analysis due to its simple and robust procedure. This procedure can be implemented easily using software programming languages.
Acknowledgments
This research was supported by RI.SELV. ITALIA Research Program 3.1 - “Silviculture, productivity and conservation of forest ecosystems” research project and by Research Program D.M. 19477/7301/08 - “Maintenance of collections, databases, and other activities of public interest” funded by the Italian Ministry of Agriculture and Forest Policies. We thank an anonymous reviewer for the helpful and insightful comments, which help us to greatly improve the manuscript.
References
Gscholar
Gscholar
Authors’ Info
Authors’ Affiliation
Ugo Chiavetta
Andrea Cutini
Consiglio per la Ricerca e la sperimentazione in Agricoltura - Forestry Research Centre, v.le Santa Margherita 80, I-52100 Arezzo (Italy)
Corresponding author
Paper Info
Citation
Chianucci F, Chiavetta U, Cutini A (2014). The estimation of canopy attributes from digital cover photography by two different image analysis methods. iForest 7: 255-259. - doi: 10.3832/ifor0939-007
Academic Editor
Francesco Ripullone
Paper history
Received: Dec 20, 2012
Accepted: Mar 03, 2014
First online: Mar 26, 2014
Publication Date: Aug 01, 2014
Publication Time: 0.77 months
Copyright Information
© SISEF - The Italian Society of Silviculture and Forest Ecology 2014
Open Access
This article is distributed under the terms of the Creative Commons Attribution-Non Commercial 4.0 International (https://creativecommons.org/licenses/by-nc/4.0/), which permits unrestricted use, distribution, and reproduction in any medium, provided you give appropriate credit to the original author(s) and the source, provide a link to the Creative Commons license, and indicate if changes were made.

Web Metrics
Breakdown by View Type
Article Usage
Total Article Views: 63036
(from publication date up to now)
Breakdown by View Type
HTML Page Views: 51765
Abstract Page Views: 3954
PDF Downloads: 5652
Citation/Reference Downloads: 53
XML Downloads: 1612
Web Metrics
Days since publication: 4505
Overall contacts: 63036
Avg. contacts per week: 97.95
Article Citations
Article citations are based on data periodically collected from the Clarivate Web of Science web site
(last update: Mar 2025)
Total number of cites (since 2014): 16
Average cites per year: 1.33
Publication Metrics
by Dimensions ©
Articles citing this article
List of the papers citing this article based on CrossRef Cited-by.
Related Contents
iForest Similar Articles
Short Communications
Estimation of canopy attributes of wild cacao trees using digital cover photography and machine learning algorithms
vol. 14, pp. 517-521 (online: 17 November 2021)
Review Papers
Digital hemispherical photography for estimating forest canopy properties: current controversies and opportunities
vol. 5, pp. 290-295 (online: 17 December 2012)
Technical Advances
Thermal canopy photography in forestry - an alternative to optical cover photography
vol. 8, pp. 1-5 (online: 07 May 2014)
Research Articles
Evaluation and correction of optically derived leaf area index in different temperate forests
vol. 9, pp. 55-62 (online: 11 June 2015)
Research Articles
On the exposure of hemispherical photographs in forests
vol. 6, pp. 228-237 (online: 13 June 2013)
Research Articles
Estimation of forest cover change using Sentinel-2 multi-spectral imagery in Georgia (the Caucasus)
vol. 13, pp. 329-335 (online: 07 August 2020)
Research Articles
Mapping Leaf Area Index in subtropical upland ecosystems using RapidEye imagery and the randomForest algorithm
vol. 7, pp. 1-11 (online: 07 October 2013)
Research Articles
Bird composition and diversity in oak stands under variable coppice management in Northwestern Turkey
vol. 11, pp. 58-63 (online: 25 January 2018)
Research Articles
Effect of environmental gradients on leaf morphological traits in the Fandoghlo forest region (NW Iran)
vol. 13, pp. 523-530 (online: 13 November 2020)
Research Articles
Short-term effects in canopy gap area on the recovery of compacted soil caused by forest harvesting in old-growth Oriental beech (Fagus orientalis Lipsky) stands
vol. 14, pp. 370-377 (online: 10 August 2021)
iForest Database Search
Search By Author
Search By Keyword
Google Scholar Search
Citing Articles
Search By Author
Search By Keywords
PubMed Search
Search By Author
Search By Keyword


