Thermal canopy photography in forestry - an alternative to optical cover photography
iForest - Biogeosciences and Forestry, Volume 8, Issue 1, Pages 1-5 (2015)
doi: https://doi.org/10.3832/ifor1129-007
Published: May 07, 2014 - Copyright © 2015 SISEF
Technical Advances
Abstract
Hemispherical canopy photography is a widely used technique to observe crown-related forest variables. However, standardization of this technique remains challenging, as exposure and threshold settings continue to constitute the main sources of variation of such photographs. This paper, therefore, presents a new method to overcome standardization issues by using thermal canopy photography. With a thermal camera, images are produced which are not critically limited in their dynamic range so that photographic exposure becomes irrelevant. Moreover, the high temperature contrast between “sky” and “non-sky”, resulting from extreme low sky temperatures, facilitates the unambiguous selection of a threshold which separates “sky” from “non-sky” pixels. For our comparison, we have taken canopy images with a high-resolution thermal camera (VarioCam hr head [Infratec, Dresden, Germany]) and an optical camera (Nikon D70s). The correlation of canopy closure values derived from the image pairs was r = 0.98. Our findings thus show that thermal canopy photography is a promising and simple to use alternative to optical canopy photography, because it limits possible sources of variability, since exposure settings and threshold definition cease to be an issue.
Keywords
Hemispherical Photographs, Exposure, Thresholding, Thermal Images, Canopy Structure
Introduction
Information on gap fraction, leaf area, and other structural variables of forest canopies are required parameters in a wide range of studies, but their “measurement” is evidently difficult. Cover photography ([15], [16]) and hemispherical photography in particular are terrestrial remote- sensing techniques widely employed to produce upward facing images of sections of the forest canopy ([9]). The term “hemispherical” here refers to the approach of taking wide-angle photographs. These photographs, frequently taken with a fisheye lens, form the basis for subsequent analyses with gap fraction (or its complement canopy closure) being the most frequently derived target variable ([11]). Moreover, canopy related attributes like, e.g., near-ground solar radiation ([33]), leaf area index ([32]), and microclimate below canopy ([29]) are modeled from hemispherical photographs.
Yet before they may be analyzed, raw photographs need to be pre-processed, i.e., converted into binary images comprising just “sky” and “non-sky” pixels. Here, a crucial step is the selection of a radiometric threshold value that correctly separates “sky” from “non-sky” in the photograph, a process referred to as “thresholding”. Thresholding has been identified as a source of inconsistencies by several studies that aim at identifying an “optimal threshold” either through automatic ([19], [17]) or manual approaches ([8]). When preparing a threshold, it is important to take the canopy photographs with a photographic exposure setting that allows for a clear separation of the classes “sky” and “non-sky” ([24]). However, the definition of a standardized optimal exposure is challenging because various conditions, including cloudiness and illumination geometry may interfere. The effects of photographic exposure on optical hemispherical photography can be immense and have been discussed intensively ([4], [30], [31], [14], [32], [2]). For neither of the processing steps - exposure and threshold definition - standard protocols do yet exist which are consistently applied throughout the scientific community. As a consequence, comparability between and within studies is hampered. Furthermore, gamma correction is another critical pre-processing step ([5]) that can affect estimates based on hemispherical photography ([12]) and mainly influences the lighter midtones of an optical photograph which are linked to canopy transmittance.
While hemispherical and cover photography of forest canopy has been implemented and researched most frequently by using optical cameras that work in the visible spectral domain, we suggest a novel approach using a thermal camera which records the emission of radiation instead of a blend of direct, scattered, reflected, and transmitted radiation in the visible range of the spectrum. We hypothesize that recent technological advances in thermal photography might allow to overcome the challenges mentioned in standardizing terrestrial forest canopy photographs.
All objects that have a temperature above absolute zero (-273°C) emit radiation in the wavelength range of 7-14 µm (thermal infrared). Thermal cameras are sensitive in this spectral range, record thermal infrared radiation, and translate it into temperature values. Thermal images may be employed for research into any temperature-related features including plant physiological processes like stomatal conductance ([18]) or the comparison of crown temperatures between urban tree species ([13]). Contrary to the thermal radiation emitted by plant tissue which is close to the ambient air temperature, there is only a small amount of thermal radiation emitted by the upper atmosphere. A thermal camera pointed to clear sky will measure a temperature of around -30 °C independent from the ambient air temperature. This large difference in temperature between the sky as background and the tree canopy in the foreground promises to be an excellent basis to unambiguously distinguish “sky” pixels from “non-sky” pixels in a terrestrial canopy photograph taken with a thermal camera. Under cloudy conditions the temperature difference will decrease because the amount of emitted radiation from low-lying clouds is higher but the measured cloud temperature is below zero degree nevertheless.
Moreover, the dynamic range of a thermal camera is large: it covers a range from -40 to 120 °C and is thus considerably larger than that occurring in a forest canopy thermal photograph. In contrast, optical cameras have a limited dynamic range (in the order of magnitude of 6 to 8 f-stops), which frequently causes an over-exposure of vegetation parts due to inadequate exposure settings ([31], [32], [2]).
In this study we compare canopy closure estimates obtained from canopy photographs taken with an optical camera with those derived from images taken with a thermal camera. We introduce thermal photography as a possibility for the standardization of terrestrial forest canopy photography.
Materials and methods
Study site
Canopy photographs were taken at 12 locations within the Forest Botanical Garden at Göttingen University (WGS84: 51° 3′ 28.08″ N, 9° 57′ 44.28″ E). Optical and thermal photographs were taken at the same locations immediately one after another. The selection of the 12 locations was such that a range of canopy openness situations was covered as we expect it to be typical in deciduous forests. As we were focusing on pure methodological differences, we did not apply a probabilistic sampling scheme as it would be recommended for, e.g., assessing light conditions in a forest ([12], [16]).
Estimation of canopy attributes from thermal photography
Thermal images were taken with a VarioCAM hr head 720 (Infratec, Dresden, Germany) that has a resolution of 640x480 pixels and a spectral range of 7.5-14 µm. The camera was equipped with a 30 mm lens with a field-of-view of 30° x 23° and was mounted on a tripod at 1.3 m height. It was orientated to magnetic north using a compass and leveled to exactly face the vertical using a bubble-level. Images were stored in a raw format with a dynamic range of 16 bit in a temperature range between -40 to +120 °C. Photographs were taken between 8 and 10 a.m. on 26/07/2013 where the day temperatures ranged between 18 and 23 °C. We assumed a constant emissivity of 0.98 as an average for forest vegetation ([25]).
For data processing the software packages Irbis 3 Plus (InfraTec, Dresden, Germany) and “R” ([22]) with the EBImage package ([28]) were used. We converted each thermal raw image into an ASCII-file of temperature values per pixel. To separate “sky” and “non-sky” pixels we applied a global threshold of 0 °C. Each pixel below 0 °C was classified as “sky”, while pixels above 0 °C were classified as “non-sky”. Canopy closure estimates, computed as unweighed gap fraction ([7]), were derived by counting the “non-sky” pixels per image.
Estimation of canopy attributes from optical photography
A NIKON D70s single lens reflex camera equipped with a standard 17-35 mm 1:2.8-4 lens (Tamron SP AF Aspherical DI LD - IF) was used for the acquisition of optical photographs. For the comparison of the field-of-view, we took one photograph with a 180° fisheye lens (Sigma AF 2.8/4.5 DC). Like the thermal camera, the optical camera was mounted on a tripod at 1.3 m height and leveled to face exactly the vertical using a bubble-level. The top of the camera (position of the flash socket) was orientated to the magnetic north using a compass ([1]). The photographs were taken without direct sunlight entering the lens ([23]) in the early morning. The basic camera settings mode “P” (Programmed Auto), ISO = 200, and matrix metering were used; the focal length was fixed to 17 mm. At each location a photograph was taken following the protocol for histogram exposure ([2]). Further, an auto-exposed photograph was taken.
Each photograph was manually aligned with the slightly smaller thermal images and cropped to the same extent using Adobe Photoshop® (Adobe Systems Corporation, San Jose, CA, USA). The section of the photograph covering the same scene as the thermal image was resampled to the resolution of the thermal camera. To the blue color plane of the 8-bit photograph an automated global thresholding was applied to avoid variations in the threshold setting caused by the manual interpretation of the photographs ([10]). Following Beckschäfer et al. ([3]), the “minimum thresholding algorithm” ([21]) implemented in ImageJ ([27]) was used.
Results
Due to the narrow field-of-view of the thermal camera only a small part of the canopy is depicted in the photograph if compared to the area covered in a photograph taken with a 180° fisheye lens.
Thermal images (Fig. 1e and Fig. 1f) taken in the forest cover a wide range of temperature values from cold sky (-30 °C) to warm vegetation (+20 °C). In the temperature histogram (Fig. 1f), two distinct peaks can be clearly identified. The peak occurring at -23 °C represents “sky” pixels, with the majority of sky pixels showing a temperature in the range of -25 to -18 °C; this variation, of course, is also due to the composition of the atmosphere. The second peak at +20 °C represents “non-sky”, i.e., vegetation pixels with temperature values ranging from 15 to 28 °C. Between the two peaks the frequency values are very low. These intermediate temperature values are caused by mixed pixels covering vegetation and sky.
Fig. 1 - (A) Optical photograph (histogram-exposed, aperture F8.0, shutter speed 1/250) and (B) its grey value histogram. (C) Autoexposed optical photograph and (D) its grey value histogram. (E) Thermal image taken at the same location as (A) and (B), where black indicates sky and yellow represents vegetation; and (F) the corresponding temperature value histogram. The two peaks indicate sky and vegetation pixels. The peaks are best pronounced in the thermal image.
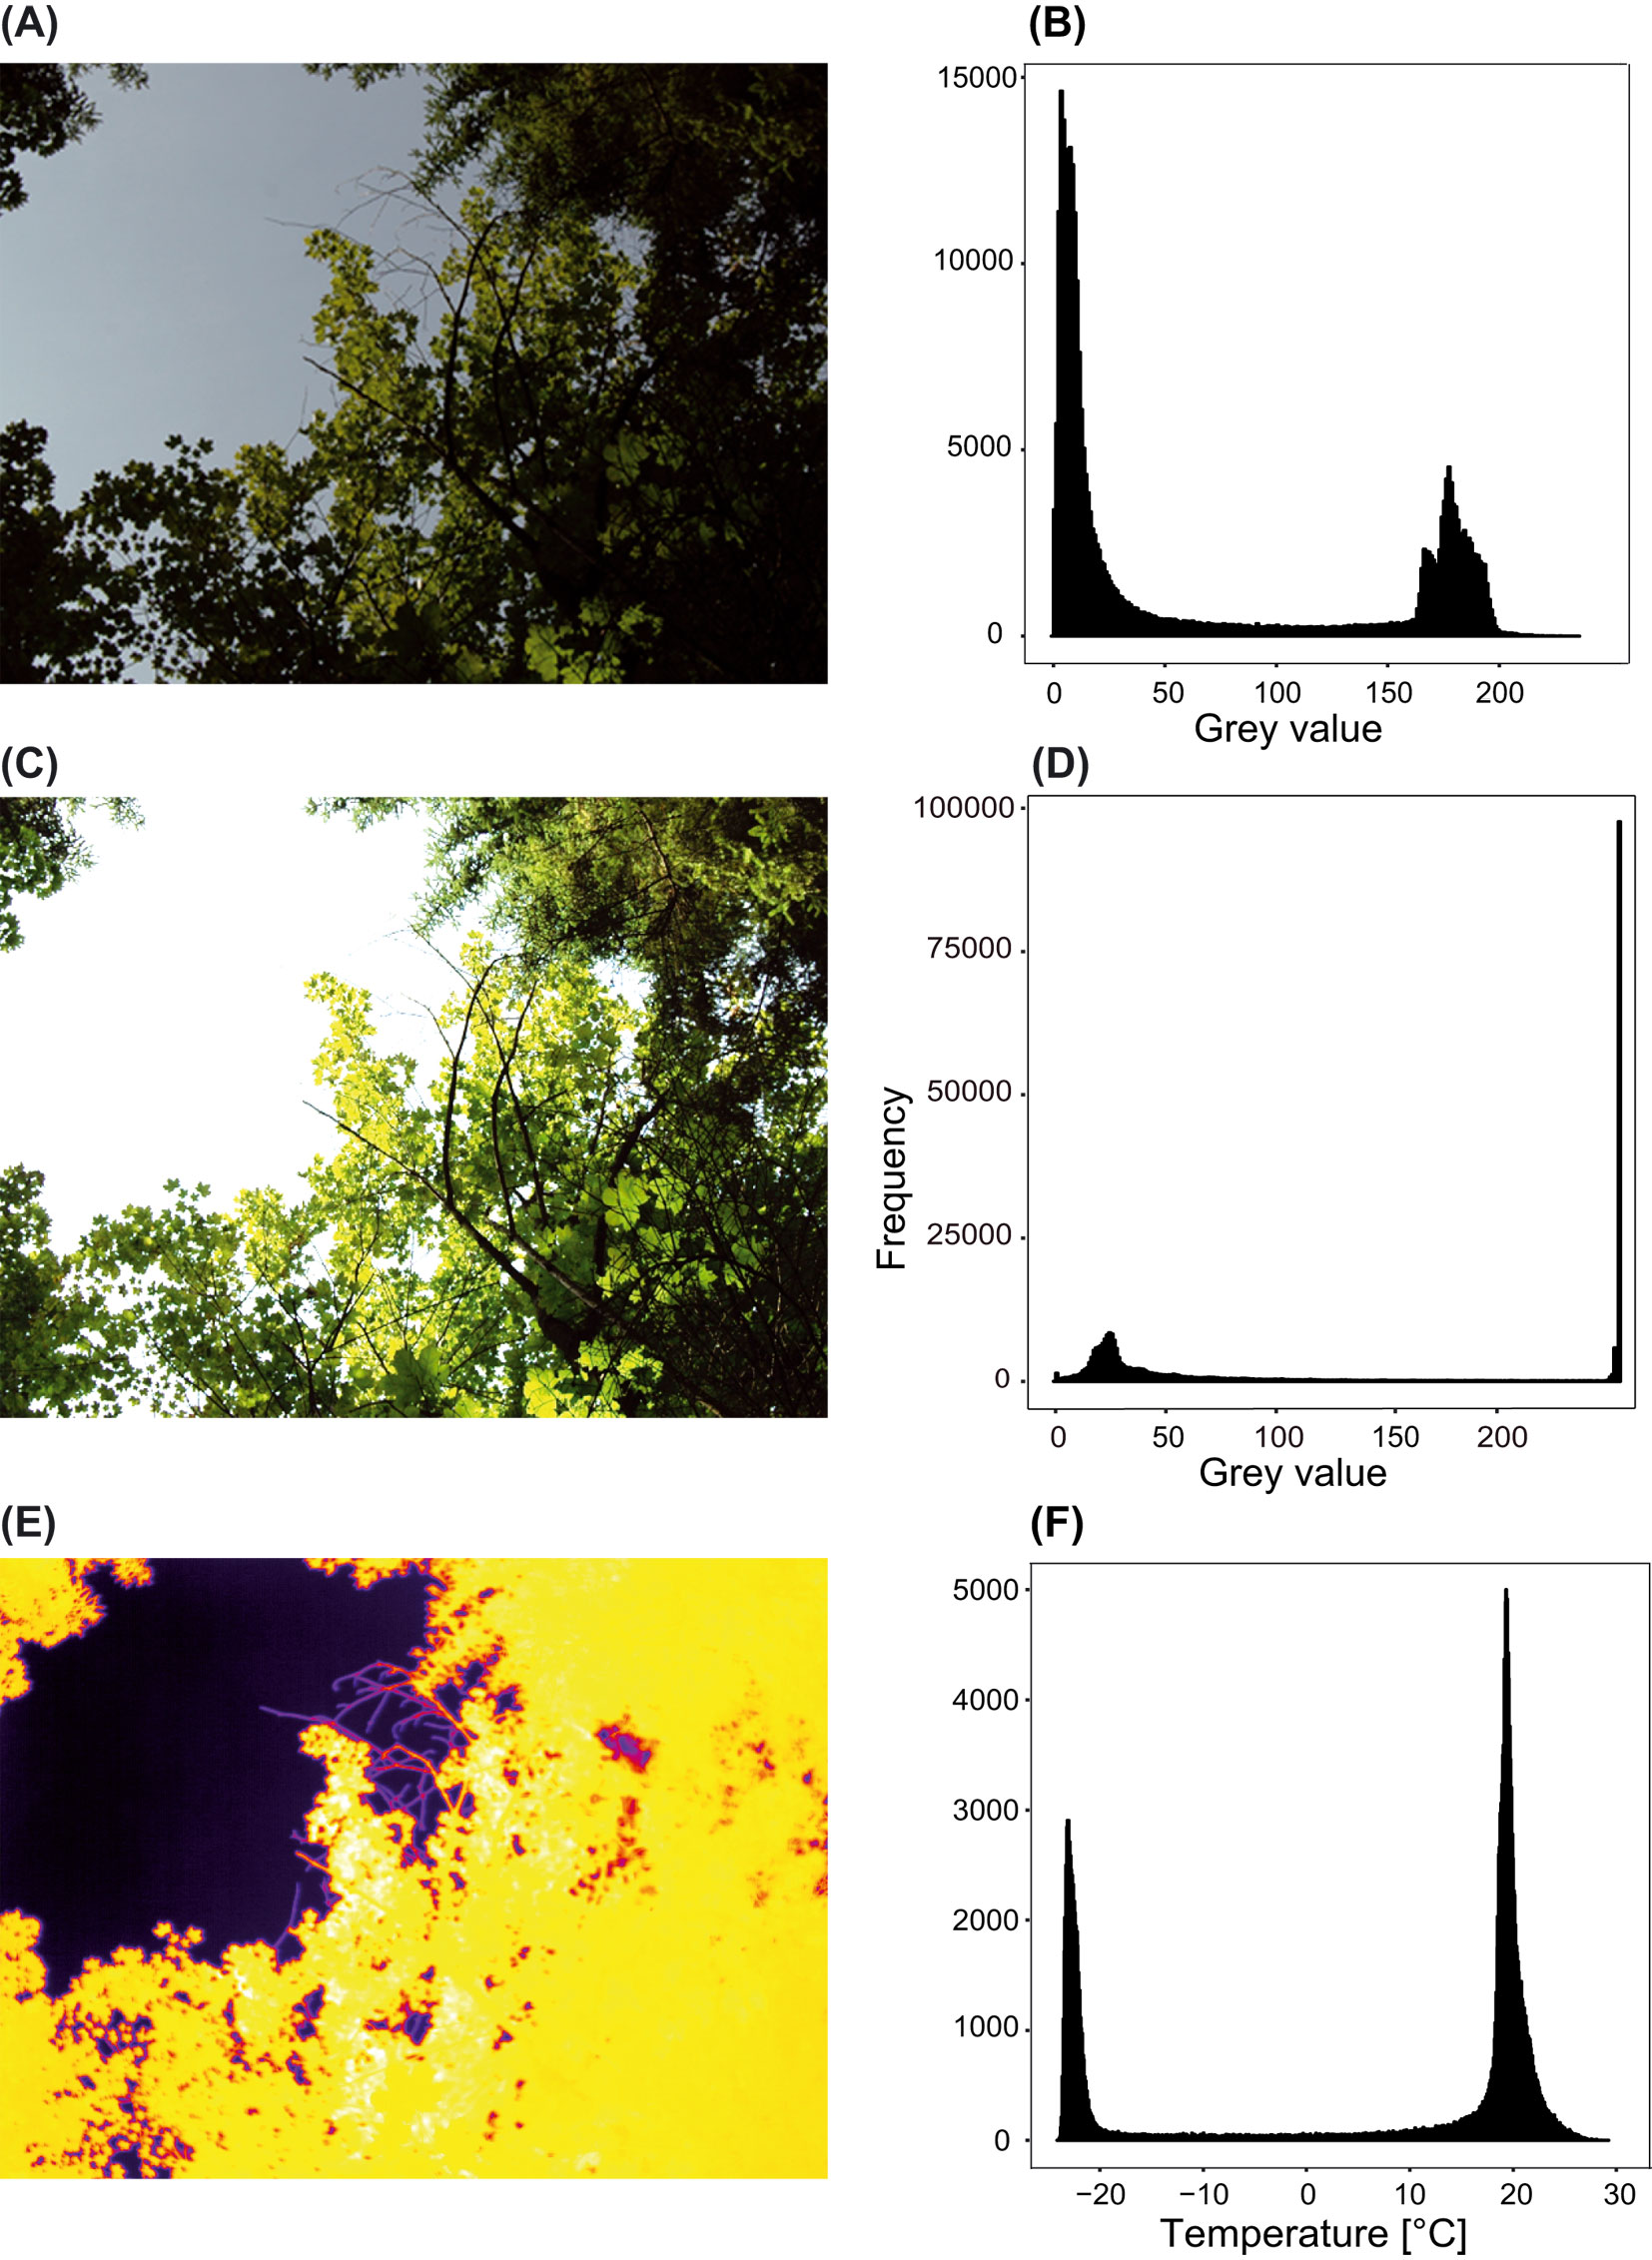
A visual comparison of Fig. 1a, Fig. 1c, and Fig. 1e shows that the thermal camera also clearly depicts small features like branches or individual leaves in the image. Thus, the thermal image allows a very clear distinction between sky and vegetation and no over-exposure occurs. In comparison, the auto-exposed image taken with the optical camera (Fig. 1c) shows a considerable loss of information due to overexposure: the corresponding histogram shows that half of the pixels are white (Fig. 1d).
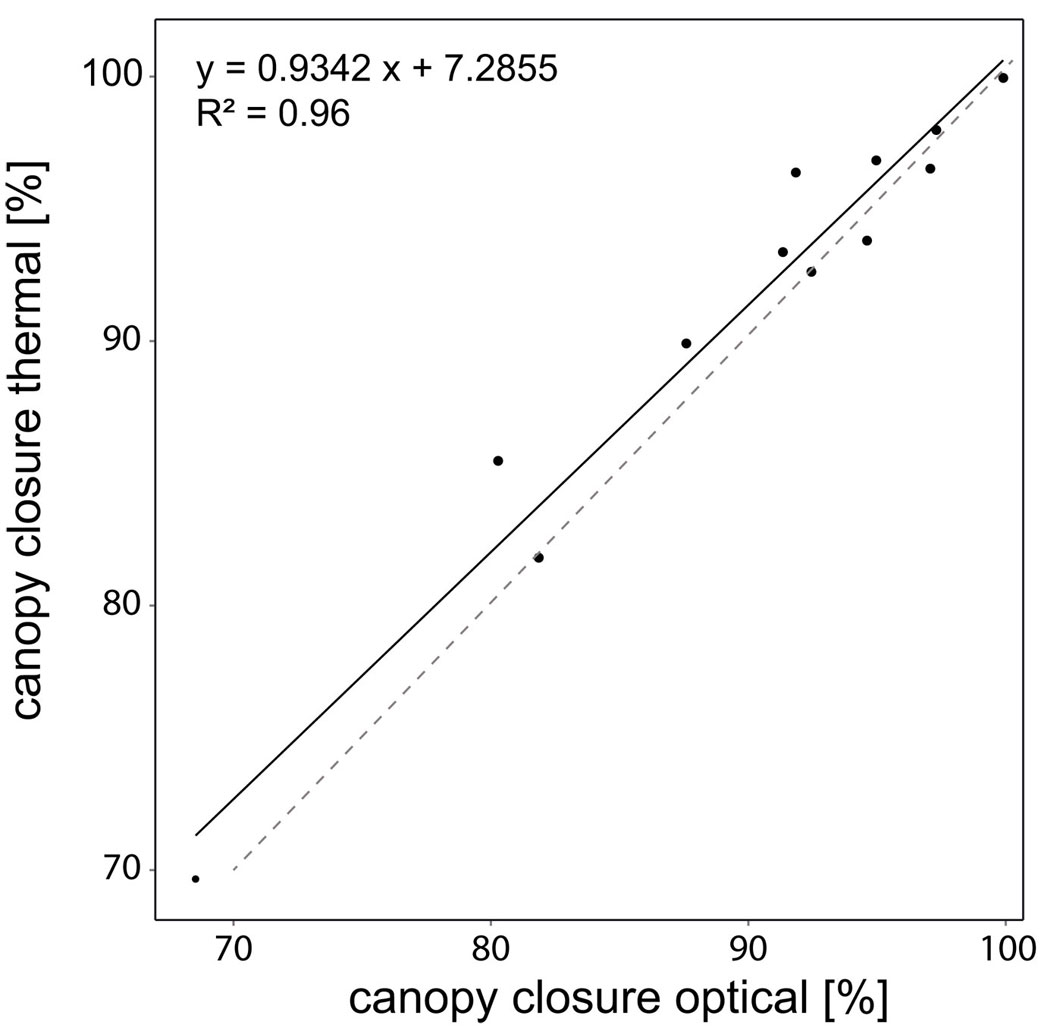
Canopy closure values for the same image sections of thermal photography and optical photography showed a relatively strong relation (R2 = 0.96 - Fig. 2); the mean absolute difference was 1.6 % and the regression line did not significantly deviate from the 1:1 line. Additionally, the slope indicated that the canopy closure of the thermal image increased by 0.9342 if the optical canopy closure increased by 1.
Fig. 2 - Canopy closure values based on optical photographs against canopy closure estimates based on thermal images. The dashed line is the 1:1 line and the solid line is the linear regression.
Discussion and Conclusion
Our study clearly demonstrates the potential of terrestrial thermal canopy photography to overcome the challenges of standardization in conventional optical canopy photography, while resulting in the same canopy closure observations. The major advantage of thermal canopy photography is that a standardized protocol can be formulated easily, because no exposure setting or gamma correction is needed and the process of determining a threshold is straightforward and insensitive to thresholding algorithm issues. In thermal photographs, a threshold to separate “sky” from “non-sky” pixels may be unambiguously defined due to the high contrast between sky and vegetation pixels in the temperature histogram. This facilitates the retrieval of reproducible results and increases the comparability of results among studies.
Extreme temperature contrasts occur during dry weather with clear sky (or low cloud cover). Although this is the ideal weather condition for image acquisition, nearly all weather conditions excluding rain will potentially allow for equally suitable images.
Thermal camera systems use uncooled microbolometer focal plane arrays (FPA) with a limited resolution of 640 x 480 pixels (0.3 megapixel) detecting the long wave radiation emitted by an object. Currently such thermal camera systems are referred to as high-resolution. Nevertheless, compared to the resolution of optical cameras (12-24 megapixel) their resolution is quite low. Thermal camera systems are not sensitive to visible light where the sun radiates the most energy and are therefore not affected by short-term variability in direct and diffuse solar radiation. Hence, cutting off the wavelengths lower than 8000 nm decreases the energy of the sun that reaches the detector and finally results in very low temperature values for the “sky” pixels. It is this physical principle that constitutes a strong advantage as images can be taken at any time of the day, compared to optical photographs which need to be taken during early morning or late evening hours. Changing sky conditions can represent challenging issues for optical cover photography (i.e., shifting from clear sky to patchy cloud sky conditions). The application of thermal cameras may ultimately overcome the problem of changing sky conditions, and therefore, greatly increase the flexibility of work organization.
Optical cameras, in contrast, use high-resolution APS-C sensors (3008 x 2000 pixels) which are sensitive to the full visible spectrum of light, but as the dynamic range of such a sensor is smaller than the dynamic range of the scene to be photographed, overexposure, associated with a loss of information, frequently occurs in optical photographs.
Currently, a disadvantage of thermal photography is that only narrow field-of-view lenses are available for thermal cameras; full hemispherical or fisheye lenses are not yet on the market. Therefore, to date, an ideally suitable application for thermal cameras is cover photography as introduced by Macfarlane et al. ([15], [16]) which is a single view-angle method using a narrow field-of-view lens. This method has advantages over hemispherical photography ([20]), e.g., more accurate gap retrieval ([26], [6]), and is much closer to the thermal photography approach. To obtain nearly the same canopy image compared to a standard 35 mm lens for digital single lens reflex cameras, we recommend using a high-resolution thermal camera with a wide-angle 12.5 mm lens and field-of-view of 65° x 51°. An obstacle for the use of thermal camera systems in forest research might be the much higher price of the equipment (US$ 25000) compared to a standard optical DSLR cameras (US$ 1000). Nonetheless, our results and theoretical considerations suggest that thermal cameras equipped with hemispherical lenses may well overcome the critical standardization issues which currently constitute a challenge in optical terrestrial canopy photography.
Acknowledgements
This study is an outcome of the research project KL894/14 “Enhancing the understanding of canopy biodiversity: estimating forest canopy surface temperature by airborne laser scanning, thermal infrared scanning, and 3D radiation modeling” funded by DFG, the German Research Foundation as a contributing project to the DFG Priority Program “Exploratories for large-scale and long-term functional biodiversity research”. We thank the managers of the three exploratories, Swen Renner, Sonja Gockel, Kerstin Wiesner, and Martin Gorke for their work in maintaining the plot and project infrastructure; Simone Pfeiffer and Christiane Fischer for giving support through the central office, Michael Owonibi for managing the central data base, and Markus Fischer, Eduard Linsenmair, Dominik Hessenmöller, Jens Nieschulze, Daniel Prati, Ingo Schöning, François Buscot, Ernst-Detlef Schulze, Wolfgang W. Weisser and the late Elisabeth Kalko for their role in setting up the Biodiversity Exploratories project.
References
Gscholar
Gscholar
Authors’ Info
Authors’ Affiliation
Philip Beckschäfer
Christoph Kleinn
Chair of Forest Inventory and Remote Sensing, Georg-August-Universität Göttingen, Büsgenweg 5, D-37077 Göttingen (Germany)
Corresponding author
Paper Info
Citation
Nölke N, Beckschäfer P, Kleinn C (2015). Thermal canopy photography in forestry - an alternative to optical cover photography. iForest 8: 1-5. - doi: 10.3832/ifor1129-007
Academic Editor
Francesco Ripullone
Paper history
Received: Sep 17, 2013
Accepted: Mar 13, 2014
First online: May 07, 2014
Publication Date: Feb 02, 2015
Publication Time: 1.83 months
Copyright Information
© SISEF - The Italian Society of Silviculture and Forest Ecology 2015
Open Access
This article is distributed under the terms of the Creative Commons Attribution-Non Commercial 4.0 International (https://creativecommons.org/licenses/by-nc/4.0/), which permits unrestricted use, distribution, and reproduction in any medium, provided you give appropriate credit to the original author(s) and the source, provide a link to the Creative Commons license, and indicate if changes were made.

Web Metrics
Breakdown by View Type
Article Usage
Total Article Views: 60694
(from publication date up to now)
Breakdown by View Type
HTML Page Views: 50066
Abstract Page Views: 3540
PDF Downloads: 5561
Citation/Reference Downloads: 29
XML Downloads: 1498
Web Metrics
Days since publication: 4468
Overall contacts: 60694
Avg. contacts per week: 95.09
Article Citations
Article citations are based on data periodically collected from the Clarivate Web of Science web site
(last update: Jul 2026)
Total number of cites (since 2015): 3
Average cites per year: 0.25
Publication Metrics
by Dimensions ©
Articles citing this article
List of the papers citing this article based on CrossRef Cited-by.
Related Contents
iForest Similar Articles
Research Articles
On the exposure of hemispherical photographs in forests
vol. 6, pp. 228-237 (online: 13 June 2013)
Review Papers
Digital hemispherical photography for estimating forest canopy properties: current controversies and opportunities
vol. 5, pp. 290-295 (online: 17 December 2012)
Research Articles
Evaluation and correction of optically derived leaf area index in different temperate forests
vol. 9, pp. 55-62 (online: 11 June 2015)
Research Articles
Estimates of selective logging impacts in tropical forest canopy cover using RapidEye imagery and field data
vol. 9, pp. 461-468 (online: 11 January 2016)
Research Articles
The estimation of canopy attributes from digital cover photography by two different image analysis methods
vol. 7, pp. 255-259 (online: 26 March 2014)
Research Articles
The physicomechanical and thermal properties of Algerian Aleppo pine (Pinus halepensis) wood as a component of sandwich panels
vol. 15, pp. 106-111 (online: 21 March 2022)
Research Articles
Litter quality changes during decomposition investigated by thermal analysis
vol. 8, pp. 827-837 (online: 19 March 2015)
Research Articles
Distribution of juveniles of tree species along a canopy closure gradient in a tropical cloud forest of the Venezuelan Andes
vol. 9, pp. 363-369 (online: 08 December 2015)
Research Articles
Thermo-modified native black poplar (Populus nigra L.) wood as an insulation material
vol. 14, pp. 268-273 (online: 29 May 2021)
Research Articles
Estimating crown defoliation of Scots pine (Pinus sylvestris L.) trees using small format digital aerial images
vol. 6, pp. 15-22 (online: 14 January 2013)
iForest Database Search
Search By Author
Search By Keyword
Google Scholar Search
Citing Articles
Search By Author
Search By Keywords
PubMed Search
Search By Author
Search By Keyword


