A simplified methodology for the correction of Leaf Area Index (LAI) measurements obtained by ceptometer with reference to Pinus Portuguese forests
iForest - Biogeosciences and Forestry, Volume 7, Issue 3, Pages 186-192 (2014)
doi: https://doi.org/10.3832/ifor0096-007
Published: Feb 17, 2014 - Copyright © 2014 SISEF
Technical Advances
Abstract
Forest leaf area index (LAI) is an important structural parameter controlling many biological and physiological processes associated with vegetation. A wide array of methods for its estimation has been proposed, including those based on the sunfleck ceptometer, a ground-based easy-to-use device taking non-destructive LAI measures. However, use of ceptometer in pine stands leads to the underestimation of LAI due to foliage clumping of this species. Previous studies have proposed a correction of biased LAI estimates based on the multiplication by a constant factor. In this study, a new method for obtaining a correction factor is proposed by considering the bias (the difference between the ceptometer measure and the reference LAI) as a function of the stand structural variables, namely the basal area. LAI data were collected from 102 sampling plots (age range: 14-74) established in Pinus pinaster forests all across northern Portugal. Data from 82 sampling plots were used for the adjustment of the LAI ceptometer correction model, while the remaining 20 plots were used for the model validation. The observed LAI ranged from 0.34 to 6.4 as expected from the large heterogeneity of the sampled pine stands. Significant differences were detected between LAI values estimated by ceptometers and LAI reference values. Different correction methods have been compared for their accuracy in predicting LAI reference values. Based on the results of the statistical analysis carried out, the new proposed LAI correction outperformed all the other methods proposed so far. The new approach for bias reduction proposed here has the advantage of being easily applied since the basal area is almost always available from forest inventory or can be inferred from remote sensing surveys. However, the bias correction model obtained is site-specific, being dependent on stand species composition, soil fertility, site aspect, etc. and should therefore be applied only in the study area. Nonetheless, the development of a correction methodology based on an allometric approach has proved to greatly improve LAI ceptometer estimations.
Keywords
Introduction
Jonckheere et al. ([16]) and Zarate-Valdez et al. ([35]) refer to LAI as a dimensionless variable, which was originally defined as the total one-sided area of photosynthetic tissue per unit ground surface area. Gower & Norman ([13]) defined LAI as the projected leaf area per unit ground area, which means half of the total leaf area per unit of ground surface ([3]). According to Chen & Black ([2]), both definitions are unproblematic for flat broadleaf species, but are less applicable to coniferous species, whose leaves may be cylindrical or nearly hemicylindrical, and grouped in foliar clumps of various shapes (e.g., spherical or ellipsoidal). These difficulties have led to numerous studies defining LAI on the basis of projected leaf area. Jonckheere et al. ([16]) suggested that half of the total interception area per unit ground surface would be a more suitable definition of LAI for non-flat leaves than projected leaf area.
LAI is a fundamental characteristic of terrestrial ecosystems because it is an important canopy structure variable affecting vegetation processes and their interactions with soil and climate ([12]). As reported by Zarate-Valdez et al. ([35]), this parameter is essential for modeling the processes occurring in the soil-plant-atmosphere continuum. LAI is highly related to rates of evapotranspiration and photosynthesis, forest production and site water balance ([18]). LAI is also an important variable in carbon balance models ([4], [11]). Bréda ([1]) summarizes the importance of LAI. According to this author, it drives both the within and the below canopy microclimate, determines and controls canopy water interception, radiation extinction, water and carbon gas exchange and therefore is a key component of biogeochemical cycles in ecosystems. Hence, it is a critical variable for forest management ([15]).
LAI can be estimated either directly or indirectly ([13], [6], [3], [9], [1]). Direct methods are naturally destructive of the forest stands and involve analysis of canopy dimensions, which implies that they are laborious and time consuming. Alternatively, indirect methods such as point quadrant, allometric and non-contact methods, have been developed. As reported by Chianucci & Cutini ([5]), over the last two decades much attention has been given to indirect measurements of canopy properties in forest ecosystems using ground-based instruments, mainly because harvesting of trees for direct measurement is labor-intensive, time-consuming, destructive, and practical only over small areas.
Pompelli et al. ([28]) reported that allometric models can be very accurate and proved their capacity to produce results with the same level of accuracy as other more complex estimation models or expensive equipment. According to Jonckheere et al. ([16]), allometric techniques are indirect methods of LAI measurement and rely on relationships between leaf area and any dimension(s) of the woody plant element carrying the green leaf biomass, i.e., stem diameter, tree height, crown base height, etc. Pompelli et al. ([28]) concluded that allometric methods, which are based on destructive sampling, can be very accurate. However, allometric relations are influenced by site-dependent factors such as species, age, stand density and other stand parameters, and therefore may not be transferable to other stands ([3], [6]). Additionally, the use of such allometric equations is not only restricted because of their site-specificity, but also because in some cases the method may not be applied, e.g., in areas where conservation or scientific interests outweigh the benefits of destructive sampling ([16]). Chianucci & Cutini ([5]) reported that after adjustment allometric equations allow LAI estimation in a non destructive way and have been applied frequently in forest ecosystems.
Processing of data from satellite remote sensing is another method for indirect measurement of LAI ([3], [10], [1]), which is especially useful for investigations covering large areas. However, remotely sensed vegetation indexes need at present a site- and stand-specific calibration against ground-based measurements of LAI, and still do not provide suitable results for complex canopies such as forests with a high LAI ([1]), even if huge improvements have been developed since their introduction in forest ecology studies. According to Demarez et al. ([8]), these non-destructive methods that generally use optical sensors are fast to apply and allow the sampling of large areas. Nonetheless, it is difficult to obtain accurate LAI estimations of high spatial resolution over large areas, as reported by Hernández et al. ([15]).
More recently, other approaches, such as the use of hemispherical photography, have been tested by the scientific community in forestry applications, with very promising results ([8]). Similar results have been achieved with fullframe and cover photography ([25]). Digital photography is a less expensive and readily available alternative. Chianucci & Cutini ([5]) report that the more recently developed Digital Cover Photography method offers strong potential for indirect measurement and monitoring of LAI and other canopy properties in deciduous forests. The method provided accurate estimates of LAI in dense deciduous forests, assuming a spherical leaf angle distribution, even without measurement of the zenithal light extinction coefficient. Macfarlane et al. ([26]) tested whether leaf area index (LAI) in eucalypt vegetation could be accurately estimated from gap fraction measurements made using both fisheye and non-fisheye digital photography, and found that methods of obtaining and analysing gap fraction and gap size distributions from fisheye photography need further improvement to separate the effects of foliage clumping and leaf angle distribution.
The disadvantages of direct methods have led to the development of instrumentation enabling a rapid estimation of LAI in the field ([13]). Chen & Cihlar ([3]) asserted that optical instruments have proved attractive to many investigators because of their non-destructive nature and the speed with which measurements can be obtained. According to Chen & Cihlar ([3]), Leblanc & Chen ([19]), and Chianucci & Cutini ([5]), some of the most important instruments currently in use for this purpose are the Plant Canopy Analyzers (LAI-2000, Li-Cor), and the Demon and the Sunfleck Ceptometers, using measurements of radiation transmission through the canopy. The LAI-2000, which detects penetrating diffuse light at five angles simultaneously, and similar plant canopy analyzers (CA), estimate LAI by inversion from measured canopy transmittance (gap fraction) under the assumption that leaves are randomly (Poisson) distributed in the canopy ([32]). Unfortunately, this assumption generally does not hold in coniferous forests, which has led a number of investigations to conclude that CAs tend to underestimate the true LAI in these circumstances. Chen & Cihlar ([3]) suggest that in coniferous forests CAs yield the shoot area index, since in most stands of this type shoots are the principal foliage elements. Leblanc ([20]) reported that for a highly clumped canopy with a large gap fraction, the resulting LAI can be more than 100% smaller than previously estimated.
Some investigators have attempted to counter this disadvantage of CAs by proposing methodologies to correct for this underestimation ([17], [3], [13], [9]). According to Bréda ([1]), the most challenging factor influencing the derivation of accurate LAI using optical methods are woody elements (Plant Area Index - PAI vs. Leaf Area Index - LAI), foliage clumping, and also accurate transmittance or gap fraction measurements. Clumping effects accounted for by the LAI-2000 instrument, called the “apparent” clumping index, were dependent on canopy cover, crown shape and canopy height ([30]). The apparent clumping index from LAI-2000 is a clumping correction above the shoot scale, whilst other methods such as TRAC ([3]) and photography can discriminate clumping effects at the shoot scale, therefore exhibiting higher spatial discrimination power ([21], [26], [5]). Lang & Yuequin ([17]) proposed a correction based on log averaging the gap fraction, currently the most widely applied correction for measurements taken by the LAI-2000 ceptometer and photography. Leblanc et al. ([21]) combined this approach with the one from Chen & Cihlar ([3]) by tracing radiation and architecture of canopies (TRAC) and photography.
Looking more carefully at the Gower & Norman ([13]) correction, they proposed the multiplication of the observed LAI value by the ratio of the total projected needle area to shoot silhouette area. This ratio ranged between 1.67 and 1.40 (median value = 1.5) for the four studied species (Quercus rubra, Pinus strobus, Pinus resinosa and Larix decidua). Chen & Cihlar ([3]) developed a new theory for gap size analysis to improve the optical measurement of LAI in plant canopies. They defined an element-clumping index to quantify the effect of the non-random spatial distribution of foliage elements that derives from the change in canopy gap fraction after the removal of large gaps appearing at probabilities in excess of predictions for a random canopy. In practice, the corrected LAI (LAICOR) is obtained as follows (eqn. 1):
where γE is the ratio of half the total leaf area in a shoot to half the total shoot area, ΩE is the clumping index for elements (shoots), and LAIOBS is the measured LAI value. Tab. 1 reports the median values found by Chen & Cihlar ([3]) for γE and ΩE for the two coniferous species analyzed, red pine (Pinus resinosa Ait.) and jack pine (Pinus banksiana Lamb.).
Tab. 1 - Correction factors for γE and ΩE. (source: [3]).
| Species | γE | ΩE |
|---|---|---|
| red pine | 2.08 | 0.91 |
| jack pine | 1.3 | 0.88 |
Dufrêne & Bréda ([9]) proposed an alternative way of dealing with the problem of LAI underestimation, which essentially refers to best practice recommendations in the use of ceptometers. They argue that the most restricting factor affecting the use of these instruments within forest vegetation communities is the difficulty of achieving correct reference measurements, in other words eliminating the edge effect. They propose that a second equipment set is used to provide reference measurements if there is no sufficiently large clear area near to a forest stand, although this increases the cost of data collection. Some ceptometers measure transmittance at the zenith (0°), LAI-2000 used 5 rings (0-74°), and these authors maintain that the most satisfactory measurement of LAI using this LAI-2000 is obtained when the field view is restricted to the upper three rings (0-43°).
Van Gardingen et al. ([33]) stated that alternative methods applying a uniform correction factor to conventional analysis may produce erroneous results when the scale of clumping is not uniform throughout the canopy. Basically, there are two ways (and possibly a third) to correct for clumping: (i) using the log averaging procedures proposed by Lang & Yuequin ([17]) derived from gap fraction distribution (LX), which was also applied to hemispherical photography by Van Gardingen et al. ([33]); (ii) to remove large gaps from total gaps, the Chen & Cihlar’s (CC - [3]) method, which is a gap size distribution correction; (iii) to combine the two above approaches.
The present analysis starts from the commonly accepted assumption that measurement of LAI by ceptometer will underestimate this variable, and then derive a new estimate of LAI by means of allometric equations. A close correspondence between the theoretical and allometric LAI would be taken to indicate that the latter could be regarded as a reference LAI against which to correct the ceptometer measurements, based on the assumptions of Pompelli et al. ([28]). This new methodology provides that the Ceptometer LAI is corrected based on structural variables (in this case the basal area per hectare), and counters the assumption that ceptometer measurements invariably underestimate reference LAI values and that the bias is not always a constant fraction of the estimated value. This investigation was carried out with reference to a tree species that is extremely important for Portugal, especially northern Portugal, namely Pinus pinaster.
Materials and Methods
Study area and experimental design
According to the last National Forest Inventory, Pinus pinaster stands are primarily located in the north of Portugal, predominantly in the Aveiro, Bragança, Vila Real, Viseu, and Porto districts: the Viseu district is known as the “Pinus region”.
Some 102 sampling plots - each with an area of 500 m2 - were established in representative areas for Pinus pinaster spread all over the north of Portugal. This dataset was divided in 82 sampling plots for the adjustment of the correction model, of which 20 were used for the model validation. In each sampling plot, general dendrometric variables were measured, following the approach of traditional and generic forest inventories (see [22], [24]).
Specific leaf area determination
Specific leaf area (SLA) was determined by collecting 300 leaves from trees randomly selected across all the sampling plots, taking care of sampling at least 3 trees per sampling plot. Leaves were collected at several heights and from different parts of the sampled trees. Sampled leaves were young, fully expanded, and free from apparent herbivore or pathogen damage.
Leave measurements were taken by following the methodology developed by Steve Hallgren (Oregon State University, Corvallis, OR, USA) and fully described by Lopes ([22]). The radius (r) and length (l) of each needle was measured, and the area per fascicle (Af) calculated as follows (eqn. 2):
where n represents the number of needles per fascicle. Sampled leaves were then dried at 70 °C and weighed after weight stabilization (on average, 2 days) to determine their dry mass.
Diameter at breast height (DBH) was measured for each tree within the sampling plots and allometric equations were used to estimate the foliar biomass (leaf mass).
A reference leaf area index (LAIr) to be used for comparison with ceptometer measurements was obtained based on SLA using the recognized procedure by Nemani & Running ([27]) and Bréda ([1]) as follows (eqn. 3):
The dry leaf area biomass for each individual tree in all sampling plots was estimated using previously adjusted allometric models and then extrapolated to hectare. LAIr was therefore obtained based on the ratio between leaf area and dry leaf mass.
LAI estimation using allometric approaches
In this study, allometric equations were adjusted for Pinus using biomass data from 35 trees (DBH range: 7.5-37.5 cm) sampled across the whole north of Portugal. Details on modeling and selection of the best models are described in Lopes ([22]). Biomass data collection for each tree followed the methodology proposed by Gregoire et al. ([14]). A leaf biomass model was adjusted based on the dataset by Lopes & Aranha ([23]), and thus leaf biomass estimated as follows (eqn. 4):
(R2 = 0.770; R2adj =0.762).
Ceptometer LAI measurements
LAI measurements were carried out during summer months over the period 2001-2009. Not all measures were taken specifically for this study: a database was built by assembling data from previous studies by the authors ([22], [34]).
For each sampling plot in the database both LAI values estimated by the Sunfleck ceptometer (LAIc) and other structural parameters (e.g., DBH measured for each tree) were available, so a reference LAI (LAIr) based on allometric equations could be estimated for each plot based on the procedure described above.
Several measurements were taken at each sampled point using the Sunfleck ceptometer, which is a stick with 80 sensors linearly distributed. LAIc was determined according to manufacturer’s recommendations ([7]). Incident radiation in the PAR waveband was measured below the canopy (inside the stand) and in a nearby open area (outside the stand). A more detailed description was presented by Bréda ([1]) and Lopes ([22]). Transmittance was calculated as the percent fraction of below-canopy light divided by the incident radiation. LAI was also estimated from transmitted light values measured with the ceptometers, making use of the Beer-Lambert law and assuming a light extinction coefficient k = 0.50 (after [5]).
Adjustment of the LAI correction model
The main goal of this study is the adjustment of a correction factor for the LAI ceptometer, in order to avoid errors related to the clumped nature of the Pinus canopy.
The identification of the input variables to be adjusted in the model for bias reduction was obtained by looking at the available structural variables showing the largest correlation with the LAI bias (eqn. 5):
Comparison of the LAIr and LAIc revealed the level of bias for this species and provided the basis for examining the connections with stand structural variables. The corrected LAI will be then obtained by summing the ceptometer-measured value with the bias (eqn. 6).
where LAIcorr is the corrected LAI and LAIobs is the observed LAI value.
This new correction differs from those previously employed, which multiplied the ceptometer LAI value by a correction factor (CF) that was not constant, being estimated as a function of the stand structural variables (eqn. 7):
where CF is the correction factor.
The following section seeks to evaluate the previous and new methodologies for correcting observed LAI by testing for differences between the reference, estimated and corrected LAI values. The output results were statistically analyzed by comparing LAI correction methods, and also the direct ceptometer measurement (with no correction), by fitting RMA regression lines, using the LAIr as the predicted variable.
To confirm the obtained results from the adjustment phase, a validation dataset (20 additional sampling plots) was used. The mean error (ME - eqn. 8) and the mean absolute error (MAE - eqn. 9) were estimated as follows:
in which n represents the number of plots.
All the statistical analyses were performed using the software package R version 2.13.1 ([29]).
Results
Dendrometric measurements
Tab. 2 summarizes the main dendrometric information of the analyzed Pinus stands for both the adjustment model and the validation datasets. It is worth noting that in general both datasets show similar values for almost all variables (Tab. 2). For the adjustment dataset, the average age is 37, ranging from 14 to 74. The metioned age heterogeneity is typical of these forest species in Portugal. Tab. 2 shows the available structural/dendrometric variables which can be exploited in the assessment of LAI underestimation when measured by a ceptometer.
Tab. 2 - Pinus pinaster dendrometric variables for the analyzed stands, considering the adjustment (82 sampling plots) and the validation dataset (20 sampling plots). (dg): average DBH; (hg): average height; (vg): average volume; (t2001): stands age in 2001; (N): number of tree per hectare; (G): basal area per hectare; (V): volume per hectare.
| Parameter | Adjustment Dataset | Validation Dataset | ||||||
|---|---|---|---|---|---|---|---|---|
| Max | Avg | Min | Std | Max | Avg | Min | Std | |
| dg (cm) | 48.1 | 23.3 | 11.4 | 9.16 | 41.3 | 24.6 | 11.6 | 9.23 |
| hg (m) | 25.5 | 14.4 | 6.1 | 4.09 | 22.3 | 15.3 | 7.2 | 4.35 |
| vg (m3) | 2.041 | 0.397 | 0.020 | 0.42 | 1.322 | 0.442 | 0.034 | 0.375 |
| t2001 | 74 | 37 | 14 | 14.8 | 64 | 41 | 19 | 14.6 |
| N (tree ha-1) | 3240 | 930 | 220 | 723 | 1540 | 776 | 220 | 455.3 |
| G (m2 ha-1) | 62.87 | 32.42 | 4.00 | 13.007 | 66.59 | 31.57 | 9.76 | 16.077 |
| V (m3 ha-1) | 612.3 | 223.5 | 14.5 | 143.06 | 555.3 | 233.2 | 44.6 | 158.33 |
| LAI | 6.40 | 3.10 | 0.34 | 1.366 | 6.19 | 2.98 | 0.82 | 1.658 |
Allometric equations for Pinus pinaster
The final biomass database compiled by Lopes ([22]) was used to adjust foliage biomass for this species. Linear and nonlinear models were tested as described by Lopes ([22]). All the adjustments (including other biomass components not considered at this stage) were done using the Systat® software package.
Adjustment of the LAI correction model
The first step was to establish the relationships between dendrometric variables and the bias, as previously defined. To this purpose, pairwise Pearson’s correlation coefficient between the bias and the stand structural variables were calculated (Tab. 3). Bias strongly related with basal area and volume, both per unit area. Apart from the number of trees per hectare, almost all the structural variables were related with the LAI bias. The adjustment of the LAI correction model was applied as defined previously. According to the new proposed correction, the estimated bias will be a function of the basal area per unit hectare (see eqn. 10). Basal area (G) is easily determined as a function of DBH, which is routinely measured in forest inventories, thus making the proposed correction easily applicable in almost all situations.
Tab. 3 - Pearson correlation coefficient (R) between stand dendrometric variables and the LAI bias. For variable labels, see caption of Tab. 2. Correlation coefficient is highly statistically significant for R > 0.283 (df: 80).
| Parameters | hg2001 | dg2001 | vg2001 | V2001 | N2001 | t2001 | DH2001 | SI | G2001 | Bias_LAI |
|---|---|---|---|---|---|---|---|---|---|---|
| hg2001 | 1 | 0.94 | 0.91 | 0.83 | -0.55 | 0.90 | 0.81 | -0.17 | 0.54 | 0.51 |
| dg2001 | 0.94 | 1 | 0.95 | 0.80 | -0.61 | 0.91 | 0.85 | -0.17 | 0.54 | 0.53 |
| vg2001 | 0.91 | 0.95 | 1 | 0.80 | -0.51 | 0.86 | 0.82 | -0.32 | 0.53 | 0.51 |
| V2001 | 0.83 | 0.80 | 0.80 | 1 | -0.20 | 0.76 | 0.79 | -0.22 | 0.84 | 0.69 |
| N2001 | -0.55 | -0.61 | -0.51 | -0.20 | 1 | -0.59 | -0.49 | -0.10 | 0.11 | 0.06 |
| t2001 | 0.90 | 0.91 | 0.86 | 0.76 | -0.59 | 1 | 0.80 | -0.12 | 0.48 | 0.53 |
| DH2001 | 0.81 | 0.85 | 0.82 | 0.79 | -0.49 | 0.80 | 1 | -0.19 | 0.68 | 0.61 |
| SI | -0.17 | -0.17 | -0.32 | -0.22 | -0.10 | -0.12 | -0.19 | 1 | -0.14 | -0.12 |
| G2001 | 0.54 | 0.54 | 0.53 | 0.84 | 0.11 | 0.48 | 0.68 | -0.14 | 1 | 0.82 |
| Bias_LAI | 0.51 | 0.53 | 0.51 | 0.69 | 0.06 | 0.53 | 0.61 | -0.12 | 0.82 | 1 |
The bias estimated for Pinus pinaster was as follows (eqn. 10):
(R = 0.820; R2 = 0.672; R2adj= 0.669; RMSE = 0.649) with standard errors for intercept and slope of 0.166381 and 0.004757, respectively (Pvalue = 1.07E-12 and Pvalue = 5.71E-26, respectively).
Comparison of the obtained LAI values
Results from the specific leaf area calculation showed that the average SLA for Pinus pinaster was 52.5 ± 5.68 cm2 g-1.
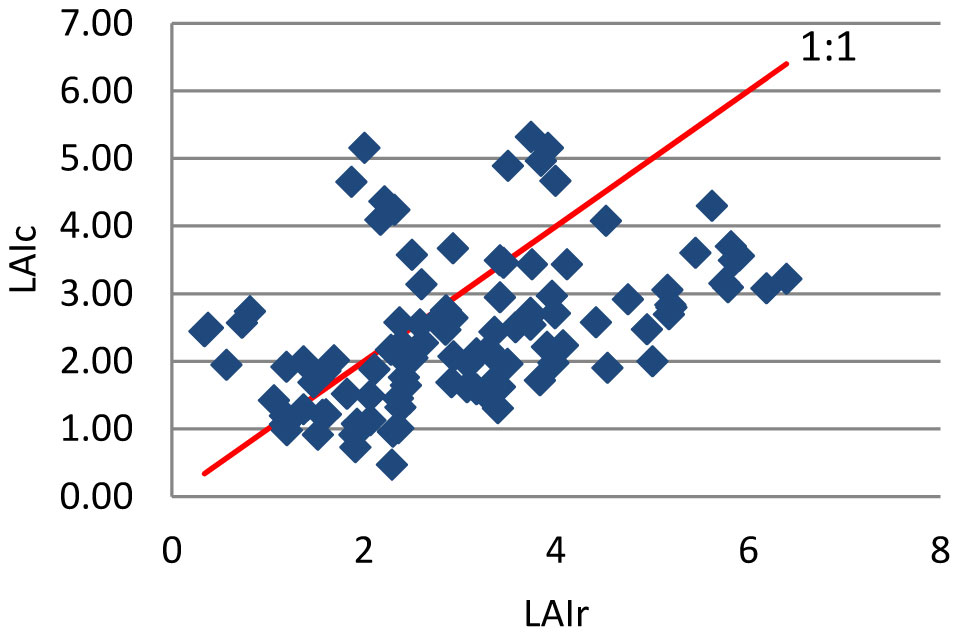
Gower & Norman ([13]) reported no differences in SLA between conifers and a broadleaved species (Quercus rubra). Our results show that the CAs tend to underestimate LAI compared to reference values, though overestimates were detected in the lower part of its range (Fig. 1, Tab. 4).
Fig. 1 - LAIr compared to LAIc for Pinus pinaster. For more details, see text.
Tab. 4 - RMA regression coefficients for leaf area index (LAI) using different correction methods. The expression used for regressions was: LAIr = a LAIc + b. (*): intercepts for which the 95% confidence interval includes zero, and slopes not significantly different from 1 (p < 0.05).
| Corrected Methodology for LAI | a | b | R2 | p | RMSE |
|---|---|---|---|---|---|
| Corrected LAI with the Chen & Cihlar ([3]) correction for red pine | 0.4729* | 0.6486 | 3.597e-01 | 2.611e-09 | 1.0860e+00 |
| Corrected LAI with the Chen & Cihlar ([3]) correction for jack pine | 0.7317* | 0.6486 | 3.597e-01 | 2.611e-09 | 1.0860e+00 |
| Corrected LAI combining the Chen & Cihlar ([3]) corrections for red and jack pines | 0.5725* | 0.6486 | 3.597e-01 | 2.611e-09 | 1.0860e+00 |
| Corrected LAI with the Gower & Norman ([13]) correction | 0.7207* | 0.6486 | 3.597e-01 | 2.611e-09 | 1.0860e+00 |
| LAI_c | 1.0810* | 0.6486 | 3.597e-01 | 2.611e-09 | 1.0860e+00 |
| Corrected LAI with the proposed methodology | 0.8737* | 0.3734* | 8.328e-01 | 8.275e-33 | 5.5497e-01 |
Tab. 5 summarises the average and standard deviation for LAI values obtained when all the correction measures were applied. The average value for the LAIc was 2.27 ± 0.758 and the allometric one was 3.10 ± 1.366. Again, LAIc measurements were lower than reference values and more homogeneous.
Tab. 5 - Results of the statistical tests to identify differences between LAI obtained from tested methodologies. (Avg): average; (STD): standard deviation.
| Source | df | Sum of squares |
Mean square |
F-value | P-value |
|---|---|---|---|---|---|
| Model | 6 | 434.72947 | 72.45491 | 42.0436*** | 0.0001 |
| Residual | 567 | 977.12701 | 1.72333 | - | - |
| Tukey-Kramer test for the tested Pinus LAI corrections | Avg ± STD | ||||
LAIc
|
2.26923 ± 0.758 | ||||
LAIr
|
3.10161 ± 1.366 | ||||
| Corrected LAI with the proposed methodology | 3.12245 ± 1.426 | ||||
| Corrected LAI with the Chen & Cihlar ([3]) correction for jack pine | 3.35228 ± 1.119 | ||||
| Corrected LAI with the Gower & Norman ([13]) correction | 3.40385 ± 1.136 | ||||
| Corrected LAI combining the Chen & Cihlar ([3]) red and jack pine corrections | 4.28492 ± 1.431 | ||||
| Corrected LAI with the Chen & Cihlar ([3]) correction for red pine | 5.18682 ± 1.732 | ||||
The red pine correction overestimates the LAI values for pines. The jack pine correction and that proposed by Gower & Norman ([13]) are closer, although they still tend to overestimate the LAIr (Fig. 2). The best results achieved using the jack pine correction are in agreement with the studies of Gower & Norman ([13]), who proposed that ceptometer LAI should be multiplied by a correction factor of about 1.5, whereas Chen & Cihlar ([3]) suggested a correction value of 1.48 for jack pine and 2.29 for red pine.
Fig. 2 - Pinus reference LAI vs. LAI obtained using different correction methods. (A): Chen & Cihlar ([3]) correction for red pine; (B) Chen & Cihlar ([3]) correction for jack pine; (C): combination of Chen & Cihlar ([3]) correction for red and jack pine; (D): Gower & Norman ([13]) correction; (E): the new proposed correction based on basal area.
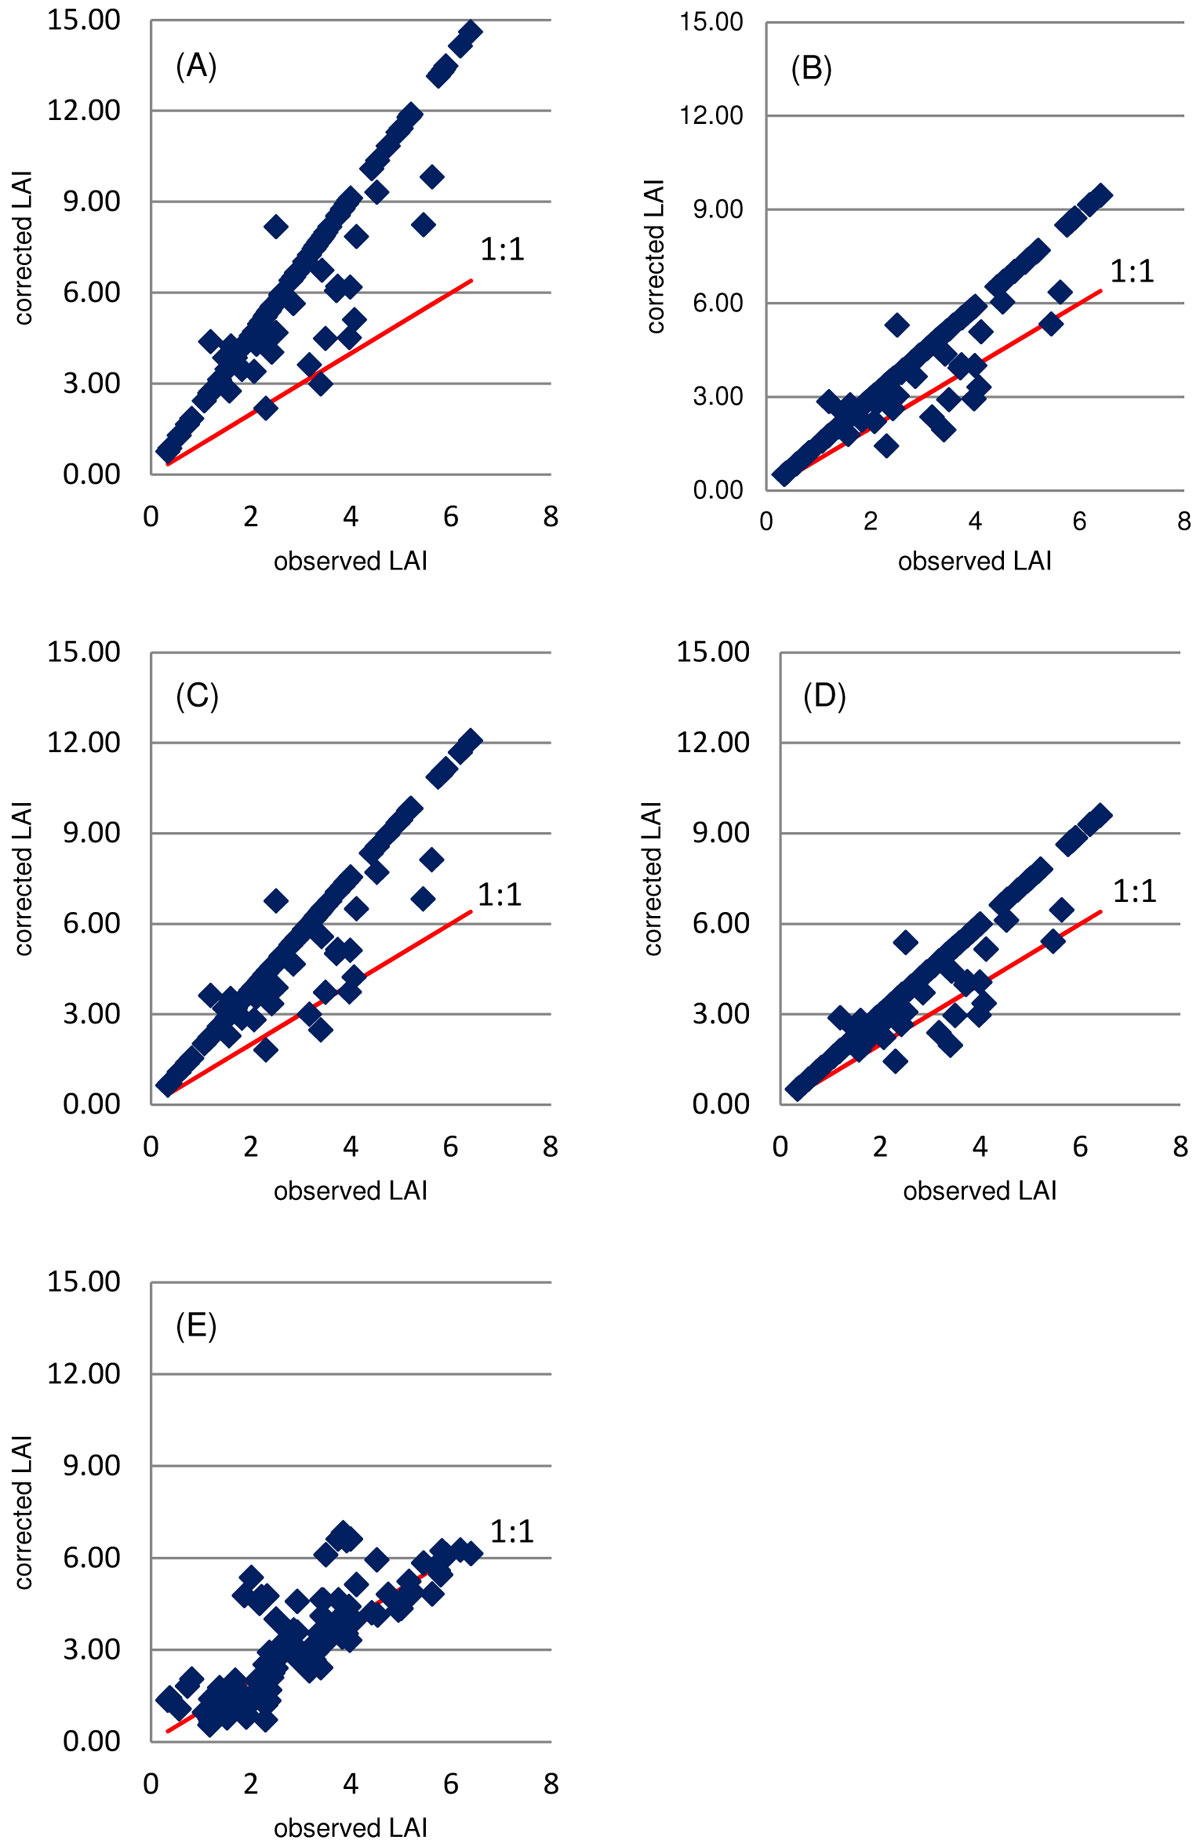
Results of the comparison among the correction methods tested are summarized in Fig. 2, where it is fairly obvious that our proposed methodology provides the best fitting to the LAIr (reference values). The statistical parameters obtained from the ANOVA and the Tukey-Kramer’s multiple-range test (Tab. 5) also support the above evidence. Based on F statistics obtained from ANOVA ([31]), differences between the LAI average values obtained by the different correction methods considered were highly significant.
Based on the regression results, the new proposed LAI correction outperformed all the other methods, as indicated by the slope closer to one and the intercept closer to zero than for any other correction method (Tab. 4). The new correction also provided the smallest RMSE.
Validation of the above correction method was carried out on a dataset including twenty additional Pinus stands (Tab. 6). Results indicates that the Chen & Cihlar ([3]) correction gave the highest LAI values. The best accuracy in LAIr prediction was obtained using our new correction, although the method reported by Gower & Norman ([13]) also gave estimates close to reference values. Despite the small number of sampling plots used in the validation process, the results obtained showed that this new methodology improves the LAI estimation by reducing the bias, and represents a reasonable basis for adjusting field measurement of LAI using ceptometers.
Tab. 6 - Results of the validation step of the bias correction model using using different correction methods. (ME): mean error; (MAE): mean absolute error.
| Applied Correction | ME | MAE |
|---|---|---|
| Corrected LAI with the proposed methodology | 0.086 | 0.679 |
| Corrected LAI with the Chen & Cihlar ([3]) correction for red pine | -1.823 | 1.979 |
| Corrected LAI with the Chen & Cihlar ([3]) correction for jack pine | -0.123 | 1.065 |
| Corrected LAI combining the Chen & Cihlar ([3]) corrections for red and jack pine | -0.987 | 1.317 |
| Corrected LAI with the Gower & Norman ([13]) correction | -0.171 | 1.066 |
Discussion
This study has proved that the ceptometer LAI tends to underestimate the reference LAI values. In order to compensate for such underestimation, a new correction method has been developed based on an allometric approach. As reported by Jonckheere et al. ([16]) this approach has some limitations in order to obtain more accurate results. The major one is that it is a site-specific method, being dependent on stand species composition. To this purpose, Ryu et al. ([30]) has reported the dependency of clumping effects on canopy cover, crown shape, and canopy height. Moreover, the correction method proposed here is also dependent on dominant species, soil fertility, site aspect and other local-dependent variables. Furthermore, future research should also address whether the results of the methodology used are also affected by tree age.
Based on the above considerations, we recommend the application of the proposed methodology for LAI bias correction only in the studied area, since the equations obtained for Pinus pinaster bias correction in this study were adjusted with trees from across northern Portugal with fairly satisfying results.
The main advantage of the proposed method for LAI bias correction relies on its simple practical use, since it is based on the basal area, which can easily be measured in the field. DBH is a key variable in traditional forest inventories, and therefore basal area is available in almost all cases. Moreover, basal area can also be easily obtained by remote sensing surveys as described by Lopes ([22]).
The new method proposed here was developed with the aim of identifying a simpler and more reliable correction for LAI measurements taken by the ceptometer. Unlike previous correction methods ([13], [3]), the methodology proposed here does not assume that bias from measurements with the ceptometer is constant. Indeed, multiplying the measured LAI by a constant only changes the scale of analysis, but not necessarily the accuracy of the measurements. Instead, we considered the LAI bias a structure-dependent variable, and inferred its relationships with stand structural parameters. For Pinus pinaster, the predicting model based on basal area showed high correlation coefficients and low standard errors, proving its efficacy in representing the relationship between the independent variables and LAI.
In general, the present research has demonstrated a significant departure of the LAI values estimated by the ceptometer from the reference LAI values. A new simplified method for bias correction has been proposed based on site-specific stand structural variables, providing a reliable tool for improving the accuracy of LAI estimates.
Acknowledgments
Authors would like to thank PTDC/AGR-CFL/68186/2006 and CITAB for their financial support.
References
Gscholar
Gscholar
Gscholar
Gscholar
CrossRef | Gscholar
Gscholar
Authors’ Info
Authors’ Affiliation
José Aranha
Departamento de Ciências Florestais e Arquitetura Paisagista, Universidade de Trás-os-Montes e Alto Douro, Quinta de Prados, 5000-801 Vila Real (Portugal)
Helder Viana
Escola Superior Agrária de Viseu, Quinta da Alagoa - Estrada de Nelas, Ranhados, 3500-606 Viseu (Portugal)
School of Earth Sciences and Geography, Kingston University, Penrhyn Road, KT1 2EE Kingston upon Thames (UK)
Agronomy School, UFG, Campus Samambaia - Rodovia Goi’nia / Nova Veneza Km 0 - Caixa Postal 131, CEP 74690-900, Goi’nia, GO (Brazil)
Facultad de Informatica UPV/EHU, Paseo de Manuel Lardizabal 1, 20018 Donostia-San Sebastián (Spain)
Corresponding author
Paper Info
Citation
Lopes D, Nunes L, Walford N, Aranha J, Sette CJ, Viana H, Hernandez C (2014). A simplified methodology for the correction of Leaf Area Index (LAI) measurements obtained by ceptometer with reference to Pinus Portuguese forests. iForest 7: 186-192. - doi: 10.3832/ifor0096-007
Academic Editor
Roberto Tognetti
Paper history
Received: May 17, 2011
Accepted: Oct 08, 2013
First online: Feb 17, 2014
Publication Date: Jun 02, 2014
Publication Time: 4.40 months
Copyright Information
© SISEF - The Italian Society of Silviculture and Forest Ecology 2014
Open Access
This article is distributed under the terms of the Creative Commons Attribution-Non Commercial 4.0 International (https://creativecommons.org/licenses/by-nc/4.0/), which permits unrestricted use, distribution, and reproduction in any medium, provided you give appropriate credit to the original author(s) and the source, provide a link to the Creative Commons license, and indicate if changes were made.

Web Metrics
Breakdown by View Type
Article Usage
Total Article Views: 64807
(from publication date up to now)
Breakdown by View Type
HTML Page Views: 52243
Abstract Page Views: 4030
PDF Downloads: 6767
Citation/Reference Downloads: 36
XML Downloads: 1731
Web Metrics
Days since publication: 4542
Overall contacts: 64807
Avg. contacts per week: 99.88
Article Citations
Article citations are based on data periodically collected from the Clarivate Web of Science web site
(last update: Mar 2025)
Total number of cites (since 2014): 11
Average cites per year: 0.92
Publication Metrics
by Dimensions ©
Articles citing this article
List of the papers citing this article based on CrossRef Cited-by.
Related Contents
iForest Similar Articles
Research Articles
Evaluation and correction of optically derived leaf area index in different temperate forests
vol. 9, pp. 55-62 (online: 11 June 2015)
Research Articles
Estimation of forest leaf area index using satellite multispectral and synthetic aperture radar data in Iran
vol. 14, pp. 278-284 (online: 29 May 2021)
Research Articles
Mapping Leaf Area Index in subtropical upland ecosystems using RapidEye imagery and the randomForest algorithm
vol. 7, pp. 1-11 (online: 07 October 2013)
Research Articles
Influence of tree density on climate-growth relationships in a Pinus pinaster Ait. forest in the northern mountains of Sardinia (Italy)
vol. 8, pp. 456-463 (online: 19 October 2014)
Research Articles
Role of serotiny on Pinus pinaster Aiton germination and its relation to mother plant age and fire severity
vol. 12, pp. 491-497 (online: 02 November 2019)
Research Articles
Successional leaf traits of monsoon evergreen broad-leaved forest, Southwest China
vol. 10, pp. 391-396 (online: 16 March 2017)
Research Articles
First vs. second rotation of a poplar short rotation coppice: leaf area development, light interception and radiation use efficiency
vol. 8, pp. 565-573 (online: 27 April 2015)
Research Articles
Effects of defoliation by the pine processionary moth Thaumetopoea pityocampa on biomass growth of young stands of Pinus pinaster in northern Portugal
vol. 3, pp. 159-162 (online: 15 November 2010)
Research Articles
Long-term implications of traditional forest regulation methods applied to Maritime pine (Pinus pinaster Ait.) forests in central Spain: a century of management plans
vol. 3, pp. 33-38 (online: 02 March 2010)
Research Articles
A comparative study of four approaches to assess phenology of Populus in a short-rotation coppice culture
vol. 9, pp. 682-689 (online: 12 May 2016)
iForest Database Search
Search By Author
Search By Keyword
Google Scholar Search
Citing Articles
Search By Author
Search By Keywords
PubMed Search
Search By Author
Search By Keyword


