
Wind contribution to yearly silver fir (Abies alba Mill.) compression wood development in the Romanian Carpathians
iForest - Biogeosciences and Forestry, Volume 9, Issue 6, Pages 927-936 (2016)
doi: https://doi.org/10.3832/ifor1742-008
Published: Oct 02, 2016 - Copyright © 2016 SISEF
Research Articles
Abstract
Since the 1950s, wind has represented one of the main disturbances to forest ecosystems in Europe, causing an increase in the frequency and amount of trees uprooted or broken by wind. Such phenomenon has also increased the incidence of compression wood in the xylem of remnant trees, thus leading to a general decrease in timber quality. In this study, we aimed to determine how wind regime affects the incidence of compression wood by reconstructing its chronology at both inter- and intra-annual scale using dendroclimatic methods. Six silver fir stands at different elevations were selected in central Romania, and compression wood time series were obtained from both increment cores from standing trees and radial discs from felled trees. Wood-structure variables were statistically analyzed as time series, while fluctuations of wind frequency and speed over the period 1921-present were reconstructed based on meteorological data. The structural response of sampled trees to wind was assessed based on the annual fluctuation in the frequency and intensity of compression wood. Results showed that the incidence of compression wood in the time series was synchronized with the intensity of the wind, rather than its duration. Wind regime in December of the preceding calendar year was significantly correlated with the frequency of compression wood, whereas its intensity was significantly correlated with wind load of previous September. The response of cambium to the wind stimulus increased with distance from the tree collar, peaking in the section at the base of the crown. At a decennial scale, only high-intensity wind stress triggered structural responses in the studied trees. Wind effects on xylogenesis in the analyzed stands increased over the last decades as a consequence of the local forest management. A better understanding of the structural response of forest trees to wind regime may explain how individual and groups of trees compete for stability and can help to improve forest management strategies in windy regions.
Keywords
Reaction Wood, Wind Regime, Dendroclimatology, Silver Fir, Carpathian Mountains
Introduction
The frequency of intermittent or episodic strong winds has increased since the 1950s ([37]), and currently represents one of the main disturbances to forest ecosystems in Europe. Short and repeated exposures to wind can modify the structure of wood by wood compression ([44]). Wind is more important than temperature in determining xylogenetic processes at the tree-line ecotone ([18]). In general, wind speed increases logarithmically with elevation ([16]), and the higher content of compression wood in high-altitude tree populations indicate their better adaptation to severe wind regimes as compared with low-altitude populations ([12]).
Plants exhibit phenotypic plasticity to wind, due to their almost continuous interaction with the moving air ([35]). Wind affects the shape and structure of tree stems ([36], [14]) by determining anisotropy in the radial growth, resulting in the oval shape of the stem cross section, whose orientation depends on the prevailing winds ([24]). It has been reported that the base trunk geometry in silver fir is affected by mountain breeze in the upper third of mountain slopes and by the valley breeze in the lower third ([9]). Compression wood formation and its positioning around the stem is influenced by the direction of prevailing winds and trunk inclination ([22], [13]), thus affecting physical, chemical, mechanical, and technological characteristics of the timber ([24], [49]).
Dendrochronological analyses have demonstrated the utility of compression wood in reconstructing the wind-load history of trees ([32], [38]) and dating geomorphological events such as snow avalanches, landslides and earthquakes ([2], [42]), as well as major windstorms and snowfall ([3]). Previous studies (e.g., [31]) analysed the incidence of compression wood as time series, but they did not detrend and did not calibrate them in relation to wind climate. Although compression wood shows a variable morpho-anatomical intensity ([40], [19], [8], [9]), this was not rendered by the compression wood chronologies drawn up until now.
Dendroclimatic studies on compression wood are quite rare, being mainly restricted to areas characterized by strong winds ([17]). In this study, we investigated how wind affects compression wood in trees of a temperate forest in the Romanian Carpathians, at the eastern limit of the beech-silver fir vegetation zone in Europe. We primarily aimed at reconstructing the wind regime at the study sites based on xylem characteristics of silver fir trees. The main objectives of this study were to: (i) identify the main wind patterns by studying the compression wood in silver fir and reconstruct the compression wood chronology at an inter- and intra-annual scale using dendroclimatic methods; (ii) identify the tree height at which trunks are most sensitive to wind stimuli; and (iii) evaluate how anthropogenic factors affect the interaction between wind and xylem structure.
Material and methods
Site description
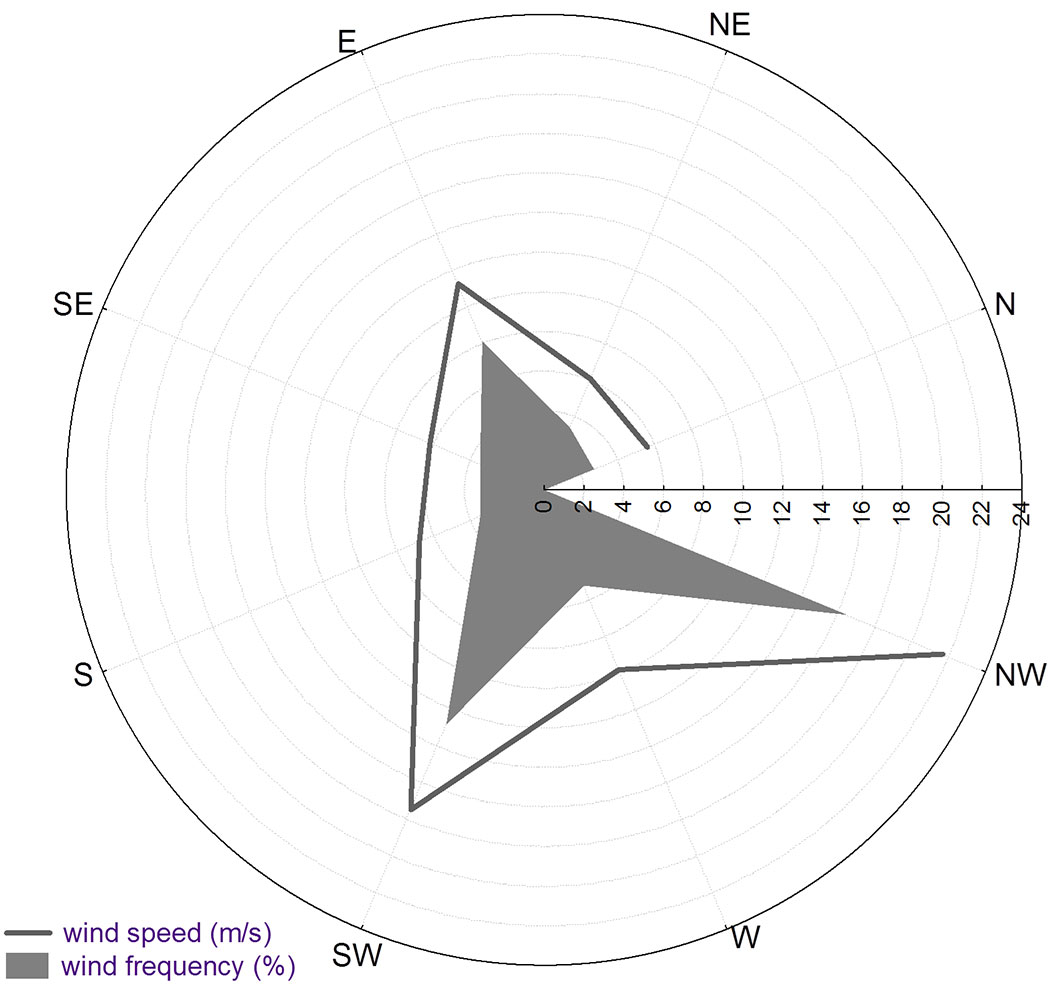
The study was carried out in the pre-mountainous region of the Postavaru Mountains, near Brasov (central Romania - Fig. 1). The area is located at the crossroads of different climatic regions (oceanic: West European, South European; continental: East European), and is characterized by a mild temperate-continental climate ([28]). The dominant wind direction in the area is north-west (Fig. 2), with a moderate influence of local reliefs ([26]). The thermic regime is influenced by frequent radiative orographic inversions, with mean annual temperature of 7.5 °C and 7.8 °C at 508 and 700 m a.s.l., respectively. The annual rainfall is 815 mm at the lowest elevations, 840 mm at 700 m a.s.l., and 940 mm at 1000 m ([25]). Snow cover lasts for 70 days at the lowest elevations and for 116 days at 1000 m a.s.l., while the growing season spans 167 days year-1 on average at the lowest elevations ([28]). The soils are fertile (with the exception of the TR5 plot, where a modest volume of soil limits the tree growth) and sometimes hydromorphic (as in the case of the TR1 and TR2 sample plots - Tab. 1).
Fig. 1 - Geographic location of the study site (upper panel) and distribution of the sample plots over the study area (lower panel).
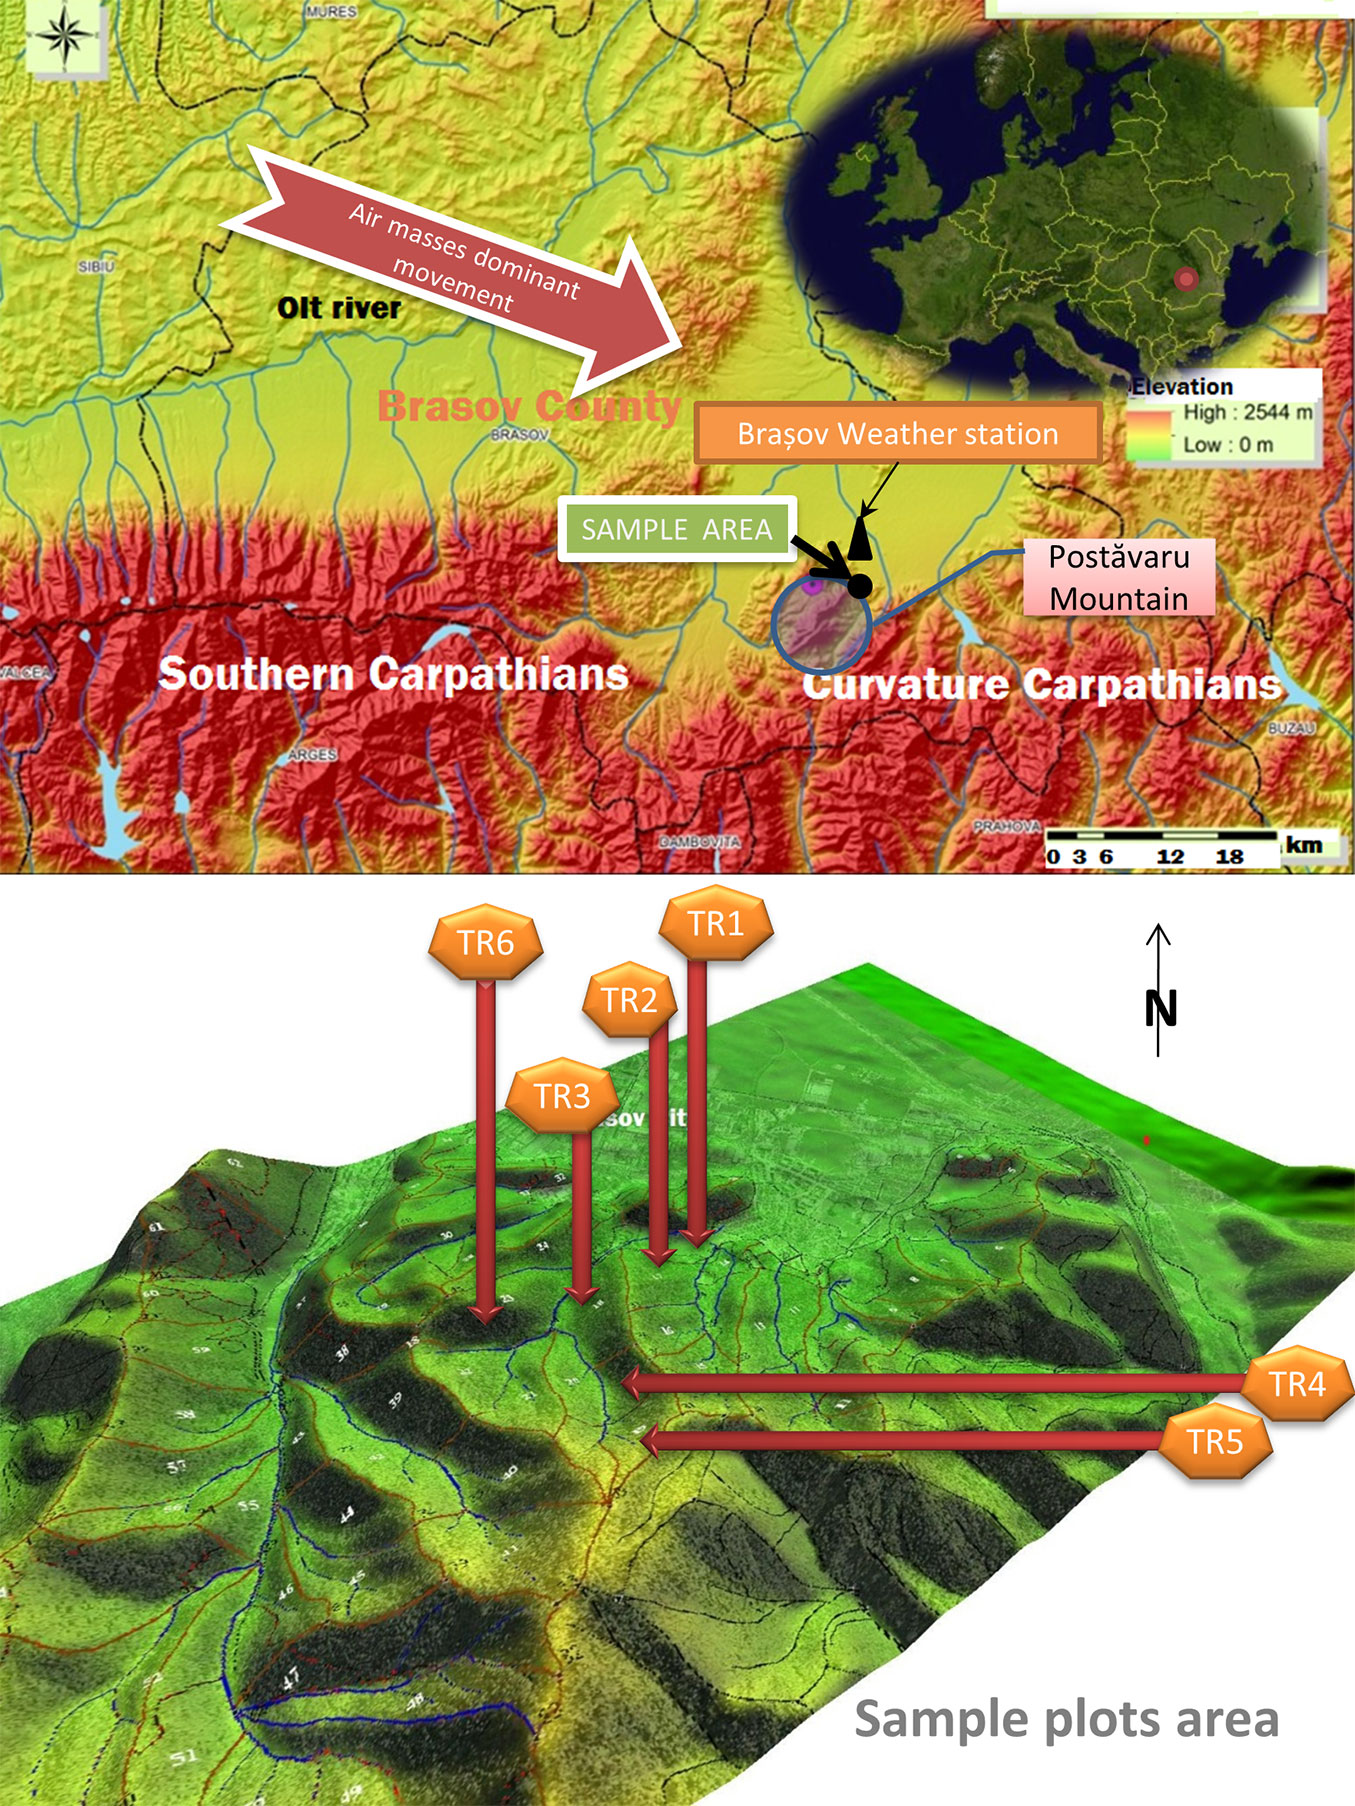
Fig. 2 - Prevalent wind directions in the study area (multiannual values over the 1964-2004 period). Data source: Brasov meteorological station, Romania (45° 40′ N, 25° 37′ E, elevation 528 m a.s.l.)
Tab. 1 - Main environmental characteristics of the sample plots. (*): Soil classification according to WRB ([51]); (APL): Anthropogenic Pressure Level, based on four level defined according to forest management plans (1950) and general silvicultural principles ([20], [30]).
| Plot | Long | Lat | Elev. (m) | Aspect | Slope (°) | Soil type* | APL |
|---|---|---|---|---|---|---|---|
| TR1 | 25°37′ E | 45°37′ N | 650.7 | - | 2 | Dystric Gleysol | Low |
| TR2 | 25°37′ E | 45°36′ N | 697.3 | SE | 27 | Stagni-albic Luvisol | Increased |
| TR3 | 25°36′ E | 45°37′ N | 765.5 | NV | 16 | Dystric Cambosol | Moderate |
| TR4 | 25°36′ E | 45°36′ N | 819.3 | V | 26 | Dystric Cambosol | Increased |
| TR5 | 25°36′ E | 45°36′ N | 948.4 | NV | 36 | Lepti-dystric Cambisol | Moderate |
| TR6 | 25°36′ E | 45°37′ N | 798.3 | S | 25 | Dystric Cambosol | High |
Silver fir (Abies alba Mill.) is widespread in the study region due to favorable soil and climatic conditions (mainly on shaded exposures) and to long-time exploitation of oak trees. Silver fir crowns in the region frequently exhibit forking, mainly at higher altitudes due to the thermic inversion ([9]).
Stand and sampling plots characteristics
The studied stands were uneven-aged or two-storey beech-silver fir mixed forests intensively managed by selective cutting, which was enforced after 1961. Harvest intensity varied in time and from one area to another.
We established six sampling plots (TR1, TR2, TR3, TR4, TR5, TR6) over a wide range of vegetation conditions (Tab. 1). Most of the chosen locations were subject to windthrows, which caused uprooting or breaking of trees and led to a recent loss of trees in the TR2 plot. Uprooting caused by wind allowed the state of the roots to be examined.
We selected a total of 66 individual trees (Tab. 2) with height above the upper quartile (top canopy layer) and straight or low-inclination (<6°) stem showing no or weak curvature, to avoid any influence of additional stimuli on annual records of compression wood in the basal trunk. Sampled trees were of 70 to 290 years old, with breast height diameter ranging between 35 and 98 cm, and height ranging between 24.5 and 44.2 m.
Tab. 2 - Tree sample size and labels of the time series analyzed in this study. (TROI): increment core series; (TROY): axial growth-ring series.
| Sampled trees |
Source plot / Height sector |
Growth-ring series label |
N trees/ discs |
N increment cores/radii |
N measured rings |
|---|---|---|---|---|---|
| Standing trees | TR1 | TROI-A | 13 | 25 | 883 |
| TR2 | TROI-B | 7 | 14 | 1361 | |
| TR3 | TROI-C | 9 | 18 | 1831 | |
| TR4 | TROI-D | 12 | 15 | 1128 | |
| TR5 | TROI-E | 12 | 17 | 1774 | |
| TR6 | TROI-F | 13 | 22 | 1962 | |
| - | TROI (full core’s dataset) | 66 | 111 | 8939 | |
| Felled trees | 0-3.9 m | TROY-1 | 6 | 24 | 3425 |
| 4-7.9 m | TROY-2 | 7 | 26 | 3623 | |
| 8-11.9 m | TROY-3 | 12 | 47 | 5286 | |
| 12-15.9 m | TROY-4 | 7 | 27 | 2354 | |
| 16-19.9 m | TROY-5 | 11 | 43 | 2982 | |
| 20-27.9 m | TROY-6 | 10 | 40 | 2703 | |
| ≥ 28 m | TROY-7 | 10 | 40 | 1479 | |
| - | TROY (full disc’s dataset) | 63 | 247 | 21852 |
Two increment cores were extracted at the breast height from each sampled tree. One core was extracted in the direction of the prevailing wind, as inferred from the trunk geometry, while the second was extracted orthogonally to the first ([9]). A total of 111 increment cores were processed after extraction (Tab. 2).
Sixty-three discs were collected in the same period from 25 trees felled in the harvested blocks near the TR2, TR3, and TR7 sample plots. Felled trees were crosscut at different distances from the collar (0, 4, 8, 12, 16, 20, 28 m - Tab. 2). On each disc, the largest diameter and its orthogonal diameter were chosen for measurements. Data from each sector (0-3.9 m; 4-7.9 m; 8-11.9 m; 12-15.9 m; 16-19.9 m; 20-27.9 m; ≥ 28 m) were pooled together, thus each height sector was represented by a mean axial series of growth rings (TROY-1 to TROY-7). To assess how anthropogenic factors interacts with the influence of wind on xylogenesis, we selected two series from sites subject to different human pressure (TROI-E and TROI-F - Tab. 2).
Compression wood indices
The frequency of occurrence and the intensity of compression wood were examined in the sampled material. Two numerical-chronological series were used for each increment core and for each disc radius. The presence/absence of defects (compression wood) in a specific year along the series was recorded as 1/0, respectively. The intensity of the compression wood was assessed based on color and thickness of latewood, using the following numerical codes: (0) normal wood (the latewood was more yellowish than earlywood); (1) mild compression wood (the latewood ranged from light orange to red-yellowish); (2) moderate compression wood (latewood color was brown-yellowish-reddish); (3) severe compression wood (latewood color ranged from brown-reddish-yellowish to dark brown, spanning more than 50% of the width of growth rings - [9]). The annual frequency of compression wood (YCWFi) was determined for each plot as the percent ratio between the number of cores presenting compression wood in the i-th calendar year and the total number of cores in which the calendar year i was represented. The annual degree of severity of compression wood (YCWDSi) was determined from the same samples as the arithmetic mean of compression wood intensity (for compression wood that was formed in the i-th year in all the cores from the sample plot in which year i was represented). As compression wood did not occur in some of the sample plots in certain seasons, YCWDS was not always represented a continuous chronological series, which raised some problems during standardization.
To generate the axial growth-ring series (TROY), data from the series obtained for individual radii on each disc were assembled in mean series over each disc, which in turn were assembled in mean series over each height sector. For quantification purposes, the four measured radii formed a unique binary series, in which value 1 indicated the annual presence of a defect on at least one of the radii. The mean series of YCWF of each sector was used to calculate the relative frequency of defects for all of the series belonging to that sector.
Building chronologies
Measurement of growth rings, the development of raw series of the growth rings, and their cross-dating were performed using the WinDENDRO® image-analysis system, the Density 2006c version ([50]). Growth rings were scanned, delineated and measured on digital images. A local master chronology was not available, therefore a reference series was created using 41 growth samples collected from dominant and codominant trees from a different stand (45° 36′ N, 25° 37′ E; elevation 719 m a.s.l.). The following wood structural indices were recorded from chronologies: TRW - total ring width; EWW - earlywood width; LWW - latewood width; EWP - earlywood percentage (of the total ring width); LWP - latewood percentage.
Because a strong intraserial dependency was observed, the AutoRegressive Integrated Moving Average (ARIMA) model was used for the standardization of raw series ([1]). The model’s parameters (autoregressive and moving average parameters, number of differencing passes) were determined using the Melard procedure ([1]). For each series, the fitting procedure yielding a reliable ARIMA process after modeling was chosen.
Time series were prepared for standardization by smoothing. Negative-exponential or natural-logarithmic smoothing were used, and the series that were resistant to smoothing models were power-transformed or smoothed using the mobile moving-average method.
Climate data
Meteorological records were obtained from the meteorological station in Brasov (45° 40′ N, 25° 37′ E, elevation 528 m a.s.l.), which is located in the vicinity of the sampled plots. Wind, temperature, and precipitation data from 1921 to present were used for the purposes of this study. Wind direction and intensity (speed) was recorded four times a day using an aerovane mounted 10 m above the ground. Wind indices were calculated from raw data and time series were constructed based on annual and monthly mean index values. Wind regime was defined using the following indices:
YCF/MCF: annual/monthly average frequency of calm periods;YWF/MWF: annual/monthly average frequency of windy periods;YWS/MWS: annual/monthly average wind speed, weighted by the frequency in the eight reference cardinal directions;SWF: average number of days with high speed winds (speed ≥ 11 m s-1, according to 6-9 classes of the Beaufort scale - [23]) classified by: (i) the minimum daily frequency (at least one case in four) of the meteorological recordings -SWF1index; and (ii) the average daily speed of the wind -SWF2index.
The values of these indices (hereafter, wind variables) were used to construct wind series. The difference in length of the series reflects the different number of observations in period considered and the improvement of recording instruments over time.
Data analysis
Structural indices (TRW, EWW, LWW, LWP, YCWDS and YCWF) and the variation of the analyzed climatic factors were organized as time series and analyzed using time series statistical procedures ([1]). First, the hypothesis of variables randomness was tested using the mean square successive difference test for serial randomness ([41]). Second, descriptive statistics were computed and interpreted for all of the variables used to test the relationship between wood structure and environmental variables. Third, we attempted to isolate the signal, i.e., to identify the co-variation of time series from a particular plot or height sector. Specific dendrochronological statistical procedures were used to quantify the signal strength and the statistical confidence of chronologies ([4]).
The fluctuation in the values of structural indices accounted for by environmental factors was verified using dendrochronological statistics of the signal strength ([4], [5]). For example, we verified the mean sensitivity of the mean chronology (MSc), ESR (Edmund Schulman’s R), and the family of inter-serial average correlation coefficients RBAR (RTOT: the mean correlation within and between trees and discs; RWT: the mean correlation within trees and discs; RBT: the mean correlation between trees and discs; REFF: the effective chronology signal REFF). The statistical confidence of chronologies was assessed using the expressed population signal (EPS). The confidence intervals for the detrended series are presented using the standard error (SE).
The relationship between wood-structure variables and climatic predictors was verified using the Pearson’s product-moment correlation coefficient (r). Wind influence on structural chronologies was assessed after removing the influence of the other environmental variables (rainfall and temperature). The contribution of the predictor to the annual oscillations in wood structure was estimated using the determination coefficient (R2).
All statistical analyses were carried out using the software package STATISTICA® v. 12.0 (StatSoft Inc, Tulsa, OK, USA).
Results
Annual variation of wood structural variables
Significant differences between consecutive growth rings belonging to average non-detrended series (TROI and TROY) were found using the t-test (p < 0.0001) for each of the five analyzed structural indices (TRW, LWW, YCWF, YCWDS, LWP). The null hypothesis of random fluctuation over time was rejected (calculated absolute Z > critical 0.05 Z value) for all indices except LWP. Moreover, most structural indices exhibited a cyclic behavior over time (calculated Z = 6.74-11.81 > critical Z = 1.65).
YCWF was the structural index with the largest contribution to data heterogeneity (CV - Tab. 3). The wide range of values detected for all structural parameters highlights the remarkable plasticity of the secondary xylem. The proximity of a multiannual maxima of YCWF and YCWDS (for the years 1907 and 1905, respectively) suggested the occurrence of a possible strong wind event, though in general the two average series were asynchronous. The TROI mean series of YCWF had no null values, i.e., the formation of compression wood was continuous over the entire length of the series. The 1847-1860 time sequence was missing in most individual series.
Tab. 3 - Descriptive statistics of the non-detrended growth-ring average series. (Avg): average; (CV): coefficient of variation.
| Structural index |
Statistics | Series | |
|---|---|---|---|
| TROI | TROY | ||
| Common interval |
1825-2007 | 1866-2006 | |
| TRW [mm] |
Avg | 1.790 | 1.977 |
| Max | 3.139 (1977) | 3.541 (1914) | |
| Min | 0.703 (1849) | 0.977 (2003) | |
| CV | 31.92 | 24.03 | |
| LWW [mm] |
Avg | 0.683 | 0.617 |
| Max | 1.134 (1998) | 1.092 (1881) | |
| Min | 0.232 (1849) | 0.286 (2003) | |
| CV | 31.93 | 26.35 | |
| LWP [%] |
Avg | 35.98 | 32.93 |
| Max | 44.30 (1899) | 43.08 (1880) | |
| Min | 24.28 (1853) | 23.55 (1928) | |
| CV | 8.98 | 9.83 | |
| YCWF [%] |
Avg | 22.58 | 11.76 |
| Max | 69.50 (1907) | 34.43 (1880) | |
| Min | 4.17 (2006) | 0 (1860, 1861, 1863-1865) | |
| CV | 52.68 | 52.43 | |
| YCWDS | Avg | 1.85 | 1.72 |
| Max | 3.00 (1902) | 2.33 (1953) | |
| Min | 1.05 (1985) | 1.17 (1986) | |
| CV | 22.14 | 14.67 | |
Statistical features of structural series
A preliminary examination of the internal variability of structural indices was performed using the dendrochronological statistics MS, ESR, and PACF (Tab. 4). The highest ACF range between consecutive growth rings was recorded in the TROI series of the YCWDS. The lowest ACF value was recorded in the last trunk sector, providing the first evidence of signal quality in the bole extremity. The ACF square indicated that the information transfer from one season to another (via YCWDS) was twice as high for TROI vs. TROY series. Similarly, the preceding growth season explained 74% of current YCWF in the lower sector (4 m above the ground), but only 31.5% in the upper sectors. After data filtering with ARIMA, signal relevance (EPS threshold value = 0.85) supported the use of TROI-A and TROY-7 series for TRW and LWW indices, respectively.
Tab. 4 - Signal properties of the examined time series. (SI): Structural index; (SS): Status of standardization; (DS): Dendrochronological statistics; (*) first-order autocorrelation.
| SI | SS | DS | Core growth-ring series (TROI) | Axial growth-ring series (TROY) | |||||||||||
|---|---|---|---|---|---|---|---|---|---|---|---|---|---|---|---|
| TROI-A | TROI-B | TROI-C | TROI-D | TROI-E | TROI-F | TROY-1 | TROY-2 | TROY-3 | TROY-4 | TROY-5 | TROY-6 | TROY-7 | |||
| TRW | Before detrending |
MS | 0.145 | 0.160 | 0.130 | 0.137 | 0.129 | 0.141 | 0.178 | 0.156 | 0.137 | 0.165 | 0.153 | 0.153 | 0.185 |
| ESR | 0.597 | 0.759 | 0.747 | 0.770 | 0.806 | 0.693 | 0.813 | 0.776 | 0.682 | 0.760 | 0.660 | 0.664 | 0.740 | ||
| ACF_1* | 0.815 | 0.921 | 0.867 | 0.838 | 0.932 | 0.767 | 0.827 | 0.823 | 0.869 | 0.877 | 0.719 | 0.774 | 0.329 | ||
| ARIMA chronologies |
MS | 0.245 | 0.269 | 0.245 | 0.307 | 0.234 | 0.236 | 0.266 | 0.241 | 0.220 | 0.213 | 0.268 | 0.221 | 0.264 | |
| REFF | 0.560 | 0.331 | 0.038 | 0.158 | 0.085 | 0.237 | 0.446 | 0.371 | 0.286 | 0.181 | 0.200 | 0.327 | 0.377 | ||
| EPS | 0.943 | 0.776 | 0.299 | 0.674 | 0.527 | 0.802 | 0.829 | 0.805 | 0.828 | 0.607 | 0.733 | 0.829 | 0.858 | ||
| SE | 0.184 | 0.309 | 0.327 | 0.277 | 0.276 | 0.242 | 0.304 | 0.300 | 0.244 | 0.342 | 0.270 | 0.259 | 0.250 | ||
| LWW | Before detrending |
MS | 0.189 | 0.230 | 0.175 | 0.192 | 0.199 | 0.187 | 0.265 | 0.225 | 0.182 | 0.247 | 0.231 | 0.266 | 0.257 |
| ESR | 0.554 | 0.785 | 0.618 | 0.660 | 0.693 | 0.581 | 0.810 | 0.740 | 0.603 | 0.729 | 0.635 | 0.684 | 0.702 | ||
| ACF_1 | 0.779 | 0.814 | 0.733 | 0.756 | 0.865 | 0.605 | 0.663 | 0.641 | 0.672 | 0.671 | 0.328 | 0.611 | 0.248 | ||
| ARIMA chronologies | MS | 0.354 | 0.419 | 0.303 | 0.331 | 0.042 | 0.352 | 0.082 | 0.064 | 0.081 | 0.078 | 0.076 | 0.109 | 0.068 | |
| REFF | 0.423 | 0.263 | 0.067 | 0.121 | 0.151 | 0.139 | 0.236 | 0.275 | 0.246 | 0.201 | 0.190 | 0.295 | 0.431 | ||
| EPS | 0.905 | 0.714 | 0.393 | 0.602 | 0.681 | 0.677 | 0.650 | 0.659 | 0.797 | 0.638 | 0.721 | 0.807 | 0.883 | ||
| SE | 0.211 | 0.324 | 0.322 | 0.283 | 0.266 | 0.257 | 0.357 | 0.348 | 0.251 | 0.338 | 0.271 | 0.266 | 0.239 | ||
| YCWF | Before detrending |
MS | 0.514 | 0.704 | 0.220 | 0.625 | 0.423 | 0.401 | 0.673 | 0.558 | 0.213 | 0.543 | 0.537 | 0.373 | 0.465 |
| ACF_1 | 0.671 | 0.718 | 0.765 | 0.728 | 0.805 | 0.692 | 0.643 | 0.718 | 0.610 | 0.628 | 0.507 | 0.752 | 0.497 | ||
| YCWDS | Before detrending |
MS | 0.174 | 0.156 | 0.164 | 0.116 | 0.142 | 0.127 | 0.118 | 0.152 | 0.182 | 0.158 | 0.176 | 0.143 | 0.261 |
| ACF_1 | 0.667 | 0.586 | 0.649 | 0.777 | 0.719 | 0.735 | 0.748 | 0.643 | 0.428 | 0.698 | 0.536 | 0.624 | 0.075 | ||
The time series of wind-related variables (SWF and YWS) showed fluctuations that were consistent with those observed for wood structural indices (YCWF and YCWDS). Moreover, the observed coefficients of inter-annual variation were higher than the inter-monthly coefficients, i.e., the fluctuation of wind regime over years is more pronounced than its monthly variation (Tab. 5).
Tab. 5 - Descriptive statistics of the non-detrended time series of wind-related variables. (Avg): average; (ME): median; (MAvg): multiannual average; (CV): Coefficient of inter-annual/ inter-monthly variation.
| Wind variable |
Common interval |
Statistics | ||||
|---|---|---|---|---|---|---|
| Avg | ME | Range | CV (%) |
|||
| Min (year/month) | Max (year/month) | |||||
| YCF | 87 (1921-2007) |
35.9 | 38.9 | 2.0 (1954, 1955) |
65.6 (1951) |
40.9 |
| MCF | 44 (1964-2007) |
43.7 | 43.8 | 34.8 (April MAvg) |
53.7 (January MAvg) |
28.9 |
| 9.2 (July 2006) |
94.9 (December 1994) |
|||||
| YWS | 67 (1941-2007) |
3.5 | 3.4 | 1.6 (1949) |
5.4 (1998) |
36.6 |
| MWS | 44 (1964-2007) |
4.3 | 4.3 | 3.5 (February MAvg) |
4.9 (March and November MAvg) |
30.5 |
| 0.3 (August 1984) |
9.2 (January 1976) |
|||||
| SWF1 | 87 (1921-2007) |
15.7 | 16.0 | 0 (1944) |
63 (1974) |
69.7 |
| SWF2 | 35 (1973-2007) |
2.8 | 2.0 | 0 (1987, 1989, 1996, 1997, 1999, 2004-2007) |
11 (1981) |
109.6 |
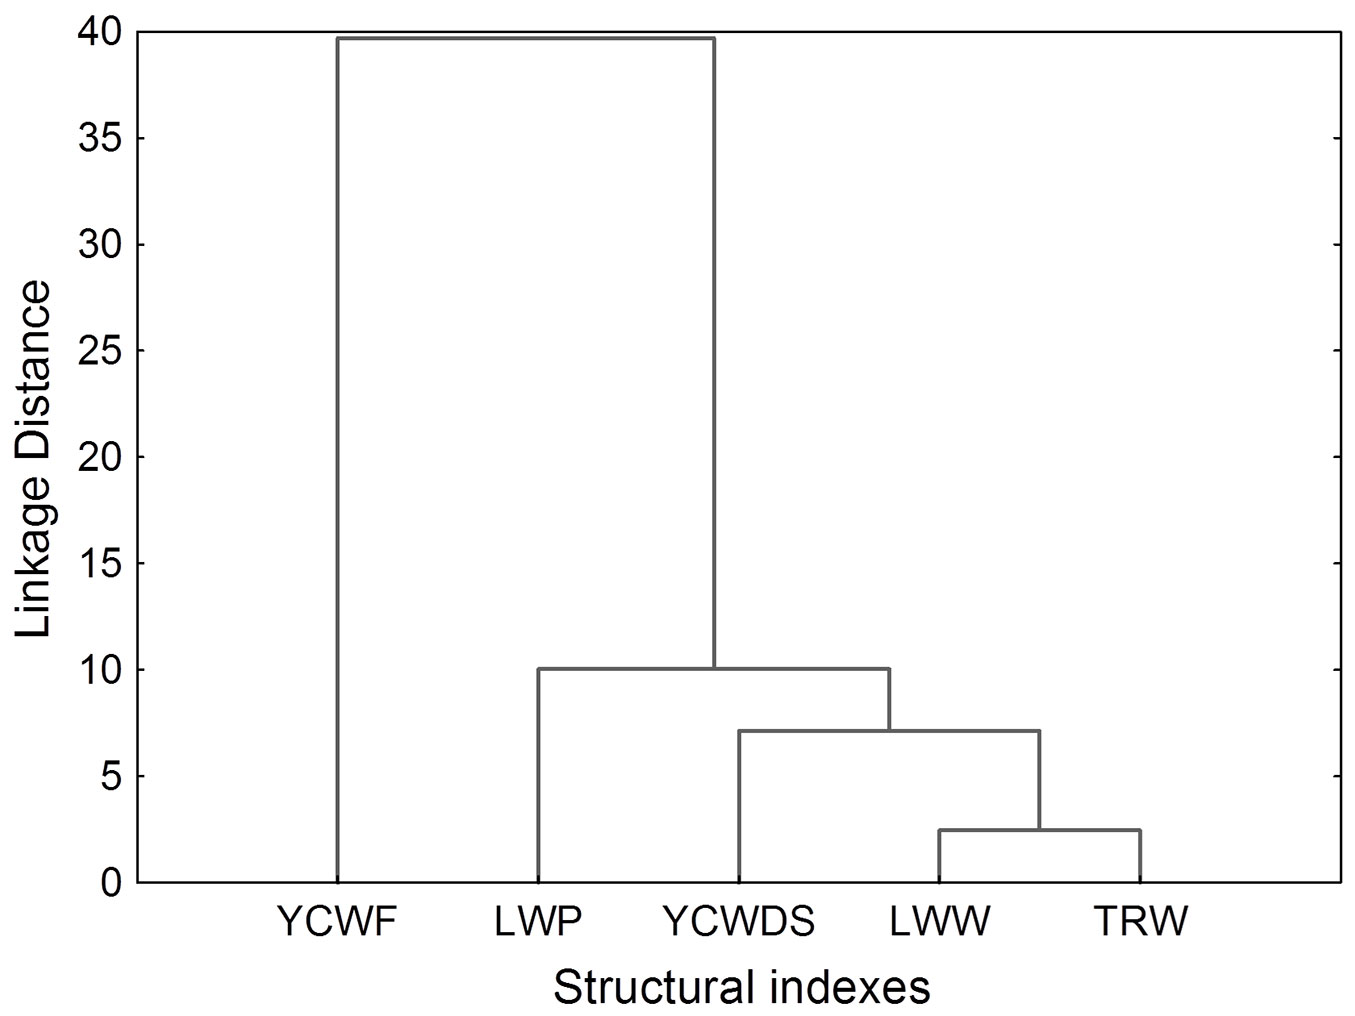
Cluster analysis of wood structural indices for the trunk base sector revealed a discrepancy between the YCWF average time series and those of the other structural indices (Fig. 3), while YCWDS fluctuations from the residual series was fairly consistent with the LWW fluctuations.
Fig. 3 - Dendrogram of mean chronologies of structural indices obtained from the base portion of the trunk.
Wind regime as predictor
The ability of the wood-structure time series to reflect fluctuations in wind-related variables is shown in Fig. 4. Correlation coefficients between detrended time series of wind-related parameters and structural indices greatly varied across samples, despite their geographical concordance. The largest range of correlation coefficients was detected for SWF1 (r range: 1.305) and for YCWDS (r range: 0.900).
Fig. 4 - Pearson’s correlation coefficients between wind-related variables and structural indices in the detrended time series analyzed. (a): yearly calm frequency (YCF); (b): yearly wind speed (YWS); (c, d): strong wind frequency (SWF1 and SWF2, respectively).
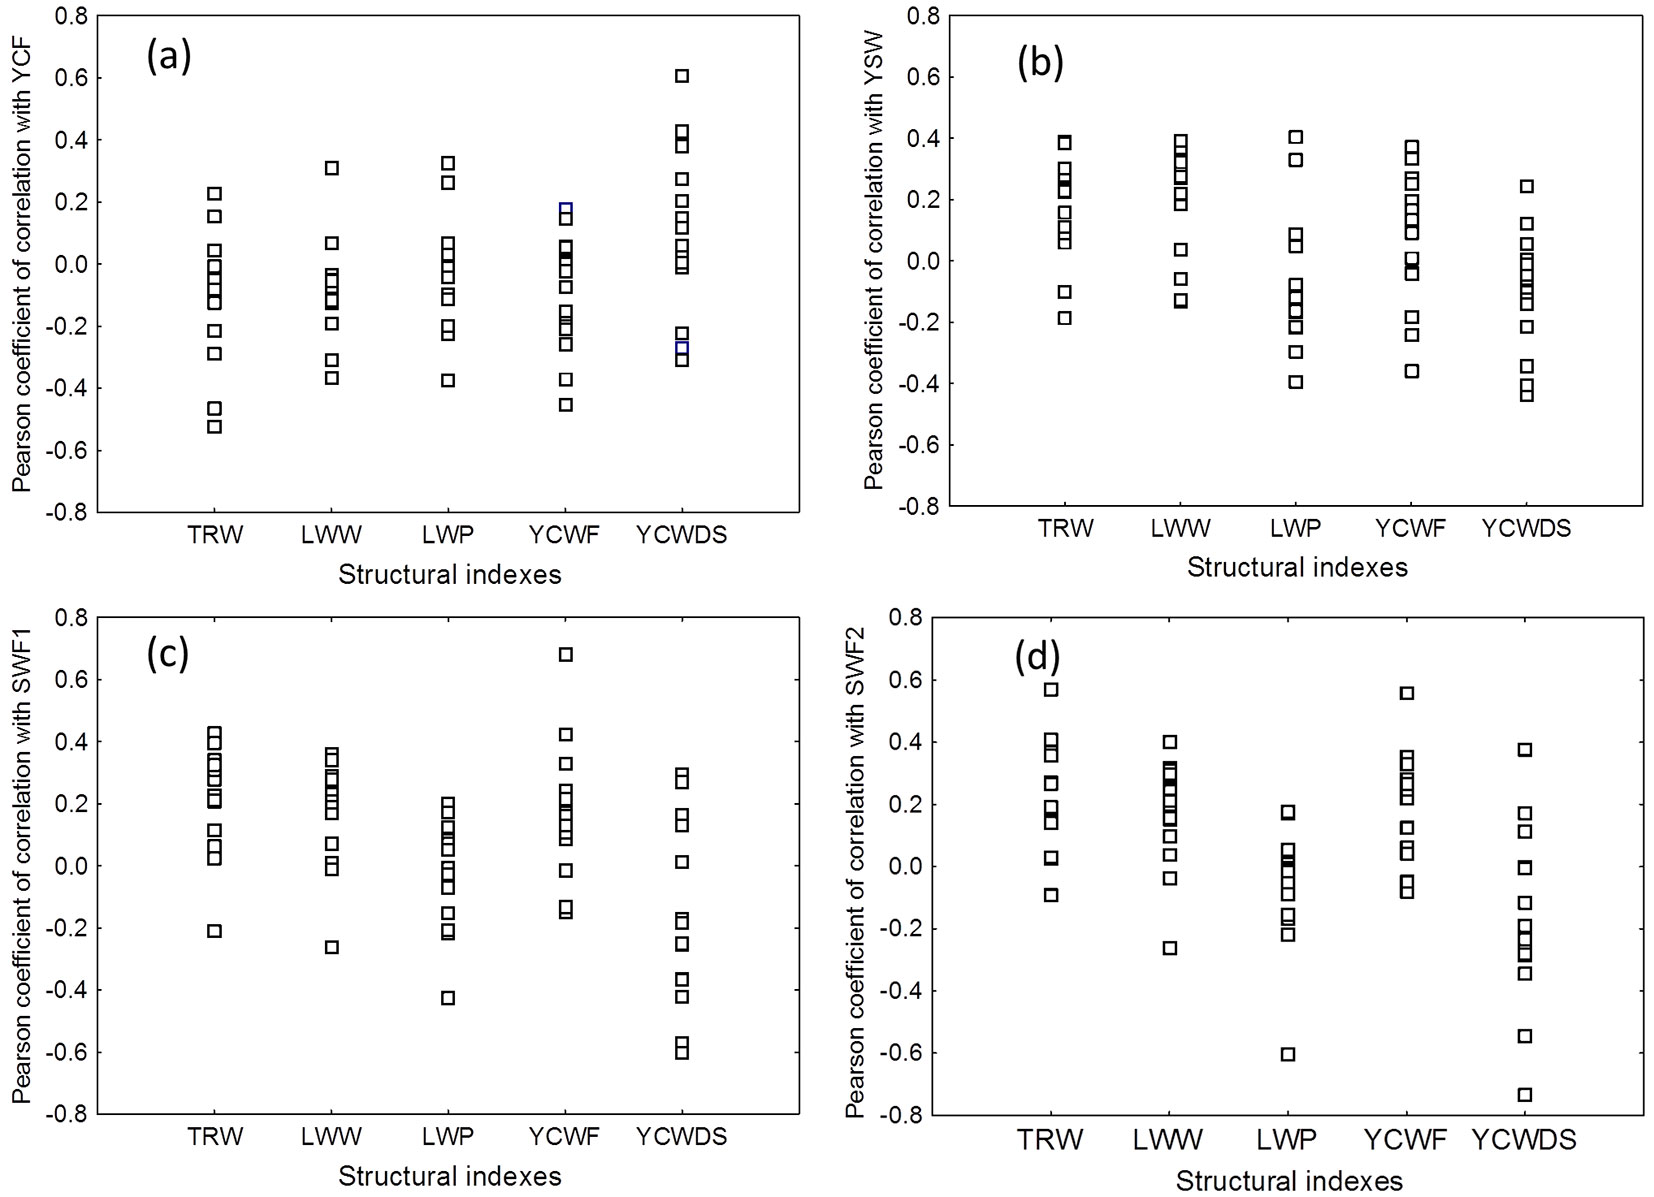
The strongest correlations with the wind explanatory variables (r = -0.734, p < 0.001) was found for YCWDS and SWF2 in the TROY-1 series. The trunk height sectors 1, 2, and 3 (up to 12 m above the ground) seems to be more sensitive to wind (for example, rYCWF_TROY,YCF = -0.453, p < 0.05). The strong correlation between the fluctuation of YCF and YCWDS (Fig. 5) suggests that wind may inhibit the differentiation of tracheids in the severest forms of compression wood (e.g., in TROI-E partial r = 0.561, p < 0.05). This also suggests that the occurrence of compression wood in the investigated trees might not be due to wind-related reasons.
Fig. 5 - Partial correlations between compression wood residual chronologies (after removing the influences of temperature and precipitation) and wind variables in (a) core series (TROI) and (b) disc series (TROY). (YCF, pYCF): current-year and previous-year annual calm frequency; (YWS, pYWS): current-year and previous-year annual wind speed; (SWF1, pSWF1): current-year and previous-year strong wind frequency.
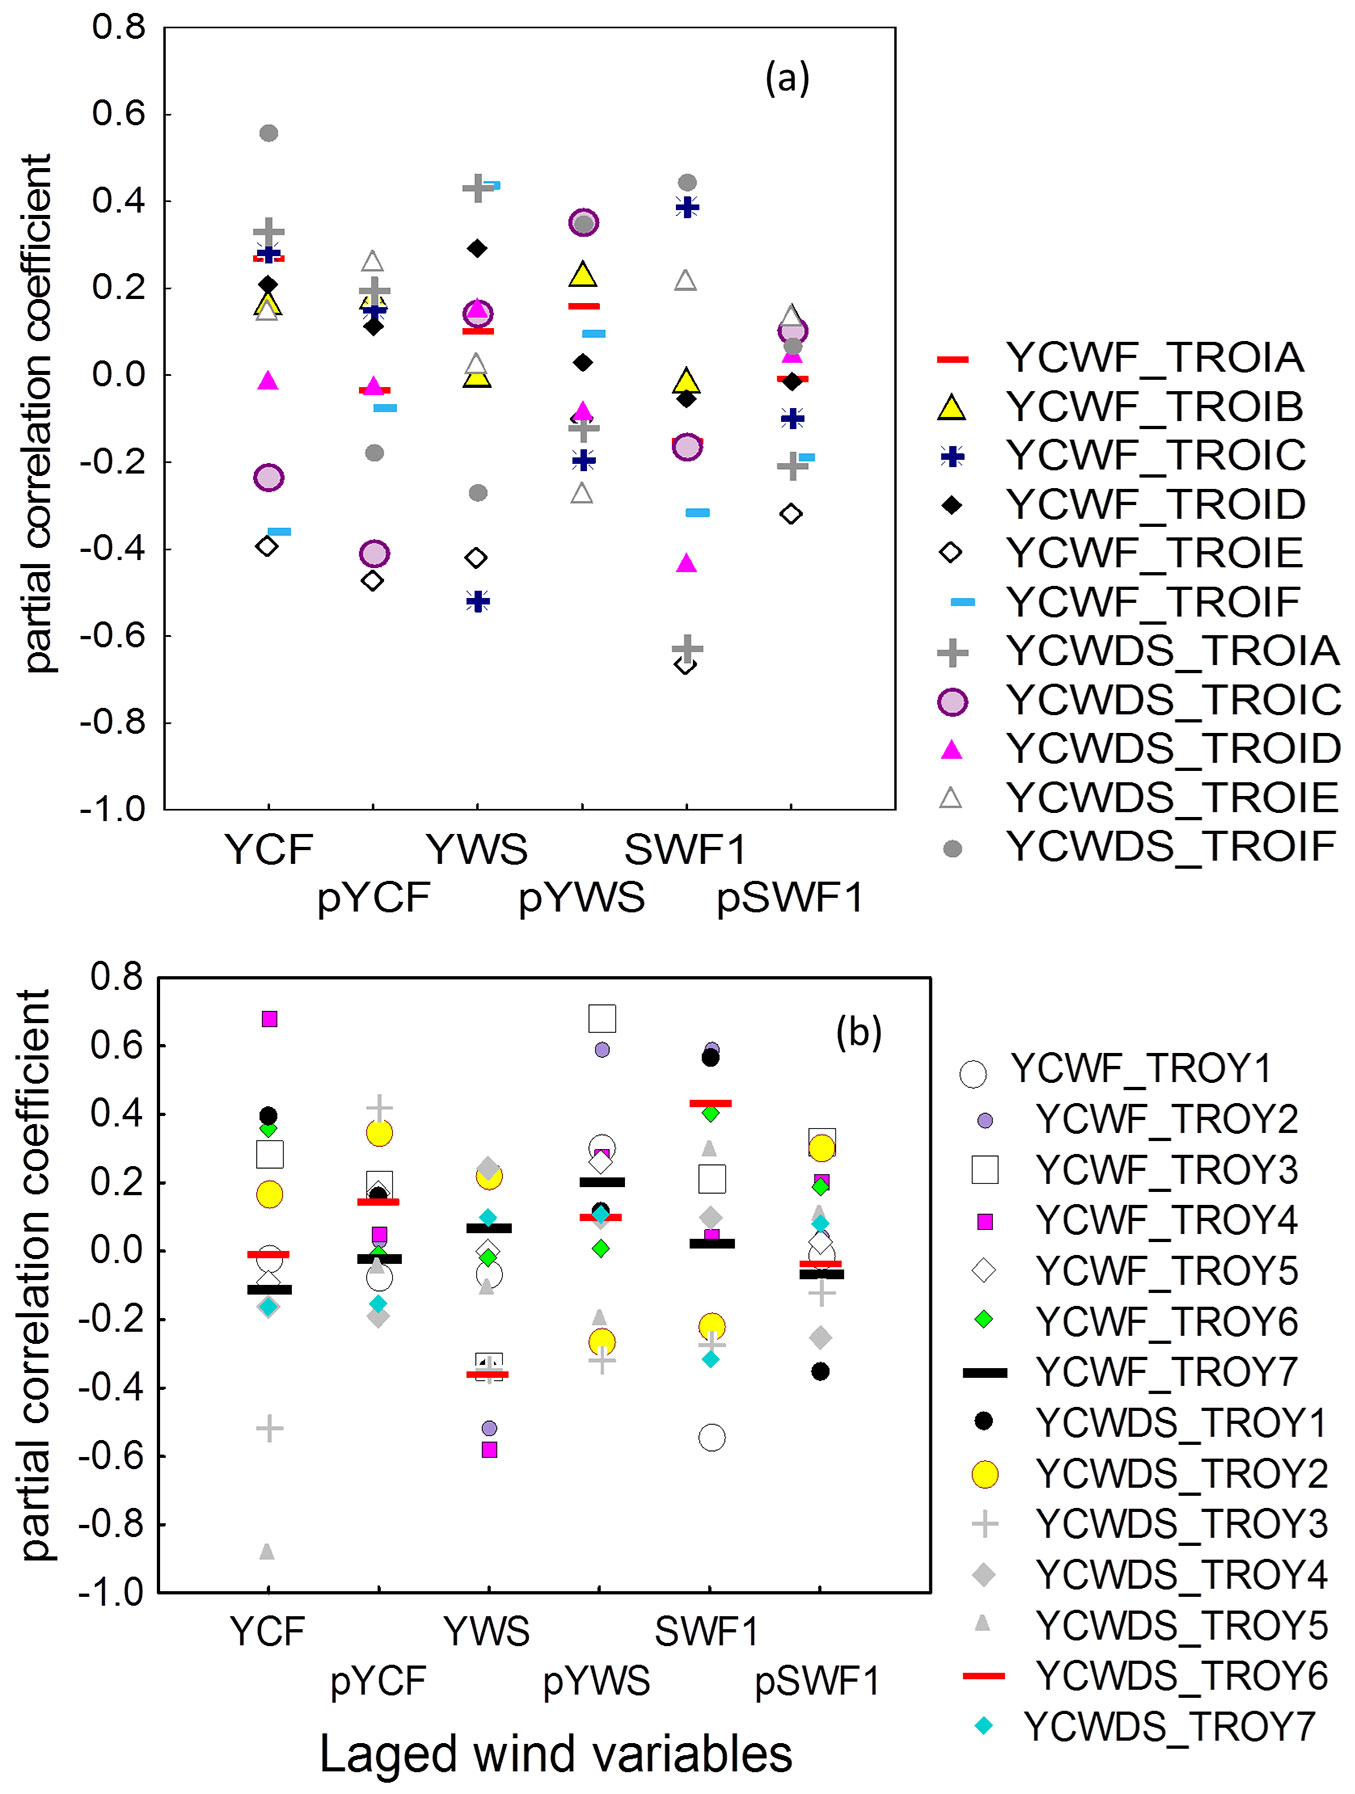
Axial series showed stronger individual correlations with wind variables, that can be summarized as follows: (i) the basal trunk sector had the highest partial correlation between YCWDS and SWF (r = 0.565; p < 0.05); (ii) the 8-12 m trunk sector showed the strongest partial correlation between YCWF and SWF: (r = 0.597; p < 0.05); (iii) the 16-20 m trunk sector exhibited the highest coefficient from all partial correlations between YCWDS and YCF (r = -0.880; p < 0.05).
Effect of previous-year wind regime
Fig. 5 summarizes the influence of wind-related parameter values of the preceding calendar years on residual chronologies obtained by removing the influences of temperature and precipitation. Weaker correlations were observed when one-year-lag series were used, especially in the case of strong wind events. A stronger partial correlation between YCWF and YCF was obtained using the TROI-E series, while the relationship between YCWF and YWS changed in the TROY-2 and TROY-3 series. The YCWF series that best reflected the annual wind fluctuations were: (i) TROI-E, whose variation strongly reflected the annual wind fluctuation (in terms of both current and previous calendar years); (ii) TROY-2 and TROY-3, whose fluctuations were consistent with the wind speed of the previous season. In addition, the annual frequency of strong wind days was fairly well reflected by the TROY-2 series. Furthermore, the presence of compression wood along the time series was significantly correlated with: (i) YWS in the TROI-A series; (ii) SWF in the TROY-1 series; (iii) YWF in TROY-2 and especially TROY-5 series.
Effect of intra-seasonal wind regime
The axial series (TROY) were found to better reflect monthly fluctuations of wind variables compared to core series (TROI - Fig. 6), except TROI-D which was significantly correlated with the wind regime (in particular YWS) of December (r = -0.510, p < 0.05).
Fig. 6 - Effect of the wind seasonal regime on the annual frequency of compression wood (YCWF - a) and the annual degree of severity of compression wood (YCWDS - b). Months of the previous calendar year are indicated by a “p” in the label. For example, (pM): previous May; (A): current August.
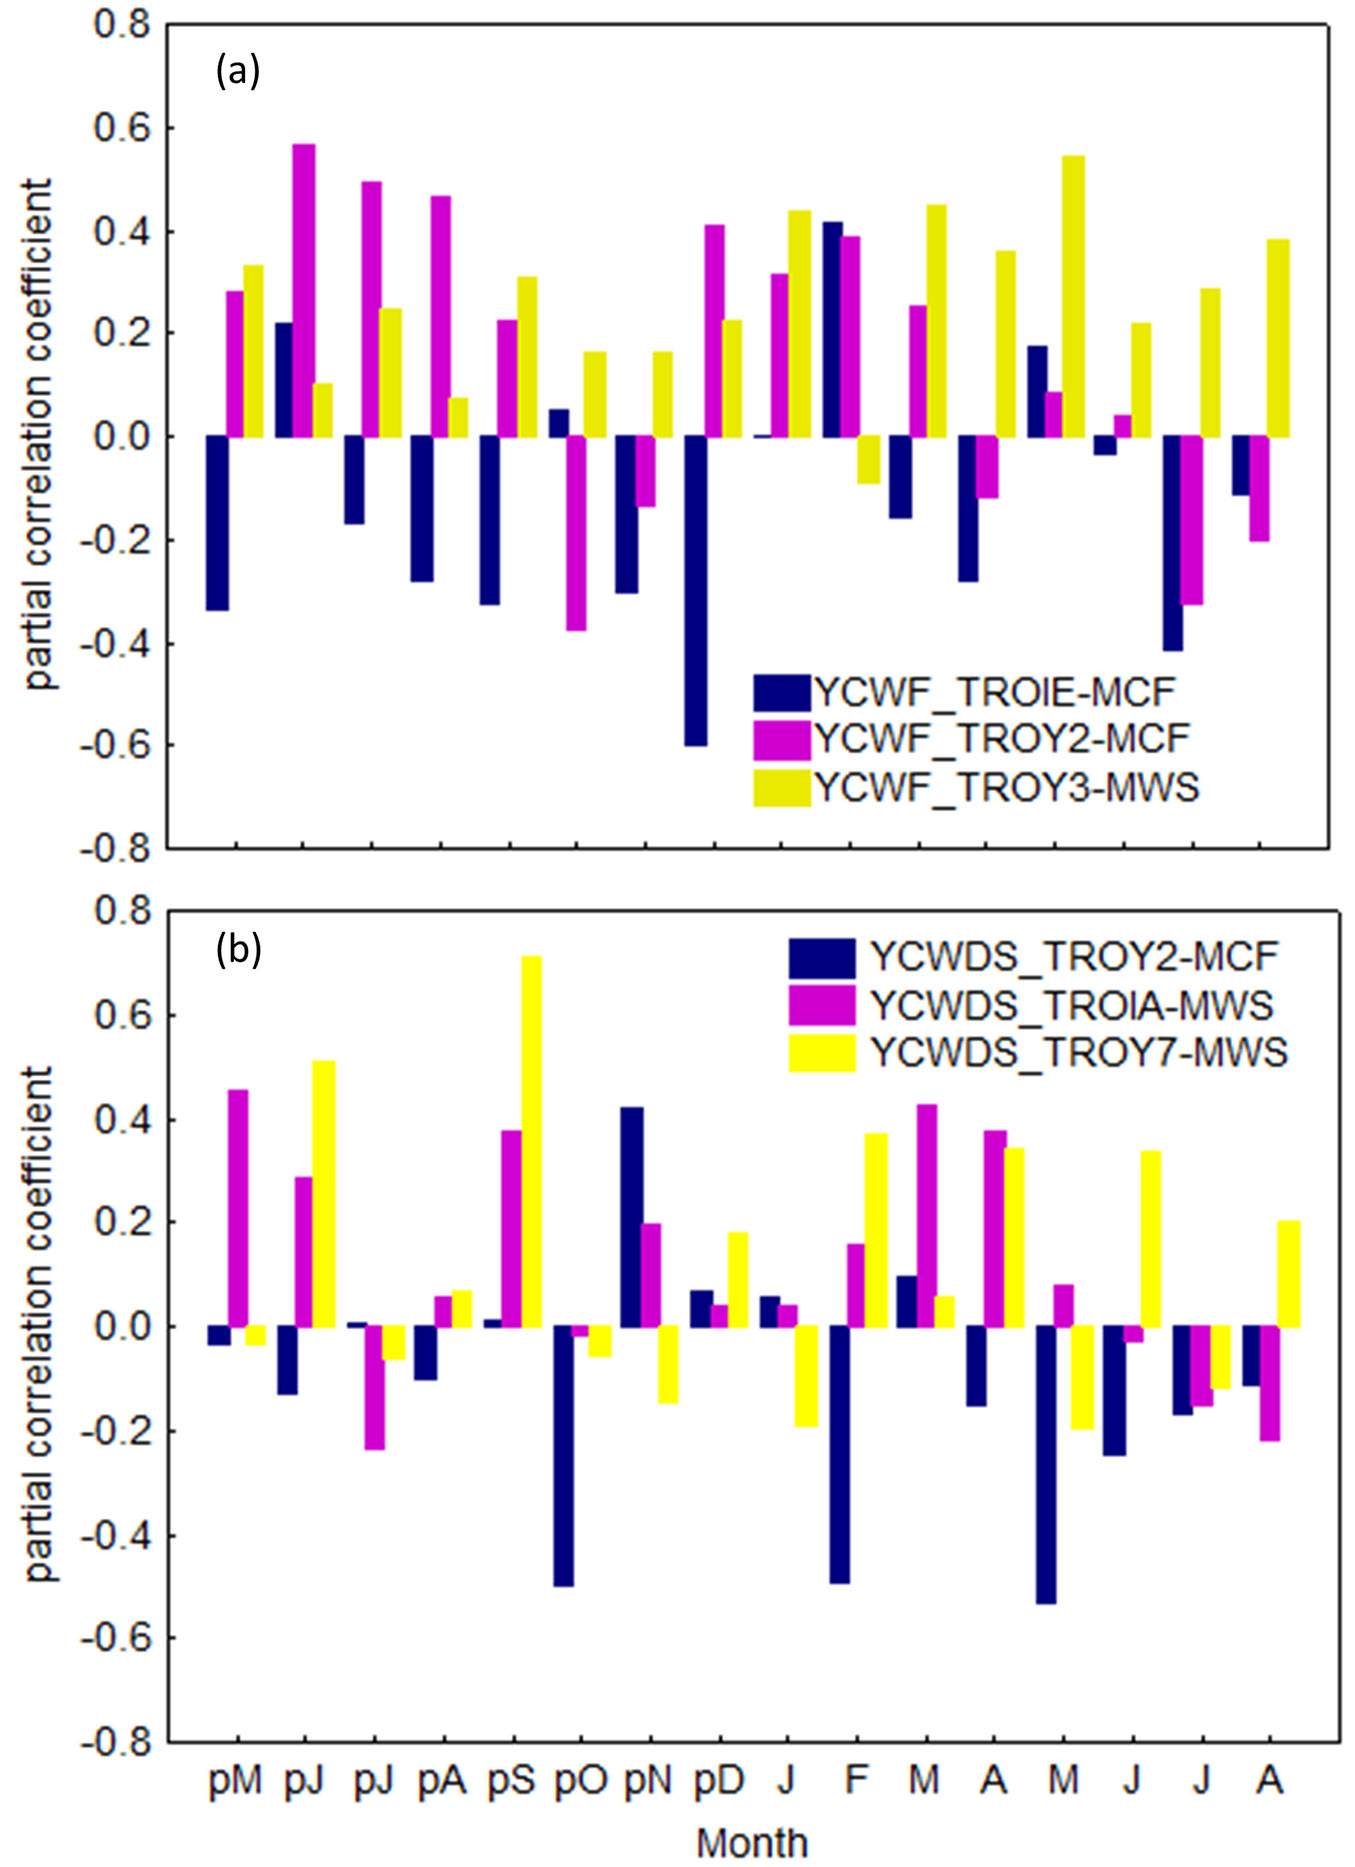
The use of the TROY-7 series increased the partial correlation coefficient between YCWDS and YWS to 0.718 (p < 0.01). Based on this time series, YCWF fluctuations were mainly correlated with the wind regime of June and September of the current year. Contrastingly, based on the time series TROI-E and TROY-3, we found that YCWF fluctuations were strongly correlated with the wind regime of the following months: (i) December of the previous year; (ii) March of the current year; (iii) May of the current year (Fig. 6). Furthermore, October, November and February of the previous year, as well as May of the current year, appeared to be mostly influencing the amount of the compression wood using the TROY-2 time series.
Regarding the different trunk sections, we noticed that the mild compression wood fractions in the extreme sectors of the bole (1 and 7) were related to the relatively mild winds of June and February. As for the intermediate height sectors (especially the second sector: 4-8 m), the intensification of wind in March and May was related to the incidence in compression wood (Fig. 6). Moreover, the TROY-2 series presented the largest number of significant correlations with the seasonal wind variables. The fourth trunk section (12-16 m) showed the earliest (May of the preceding calendar year) influence of wind on the occurrence of compression wood (partial correlation coefficient: -0.455; p < 0.05). Trunk section 7 (> 28 m) explained 51% of variation in YCWDS vs. YWS and was mainly with wind regimes in June and September of the previous calendar year.
Anthropogenic interactions
The analysis of the chosen time series at a decennial scales revealed a stronger relationship with annual fluctuations of wind regimes as compared with the full time series (Fig. 7). For example, wind-related variables accounted for 11.3% of the variation in YCWF in the TROI-E series over the whole meteorological time series; however, it increased to 99.2% in 1981-1990.
Fig. 7 - Wind signal in compression wood fluctuations at a yearly (a, c) and decennial (b, d) scales.
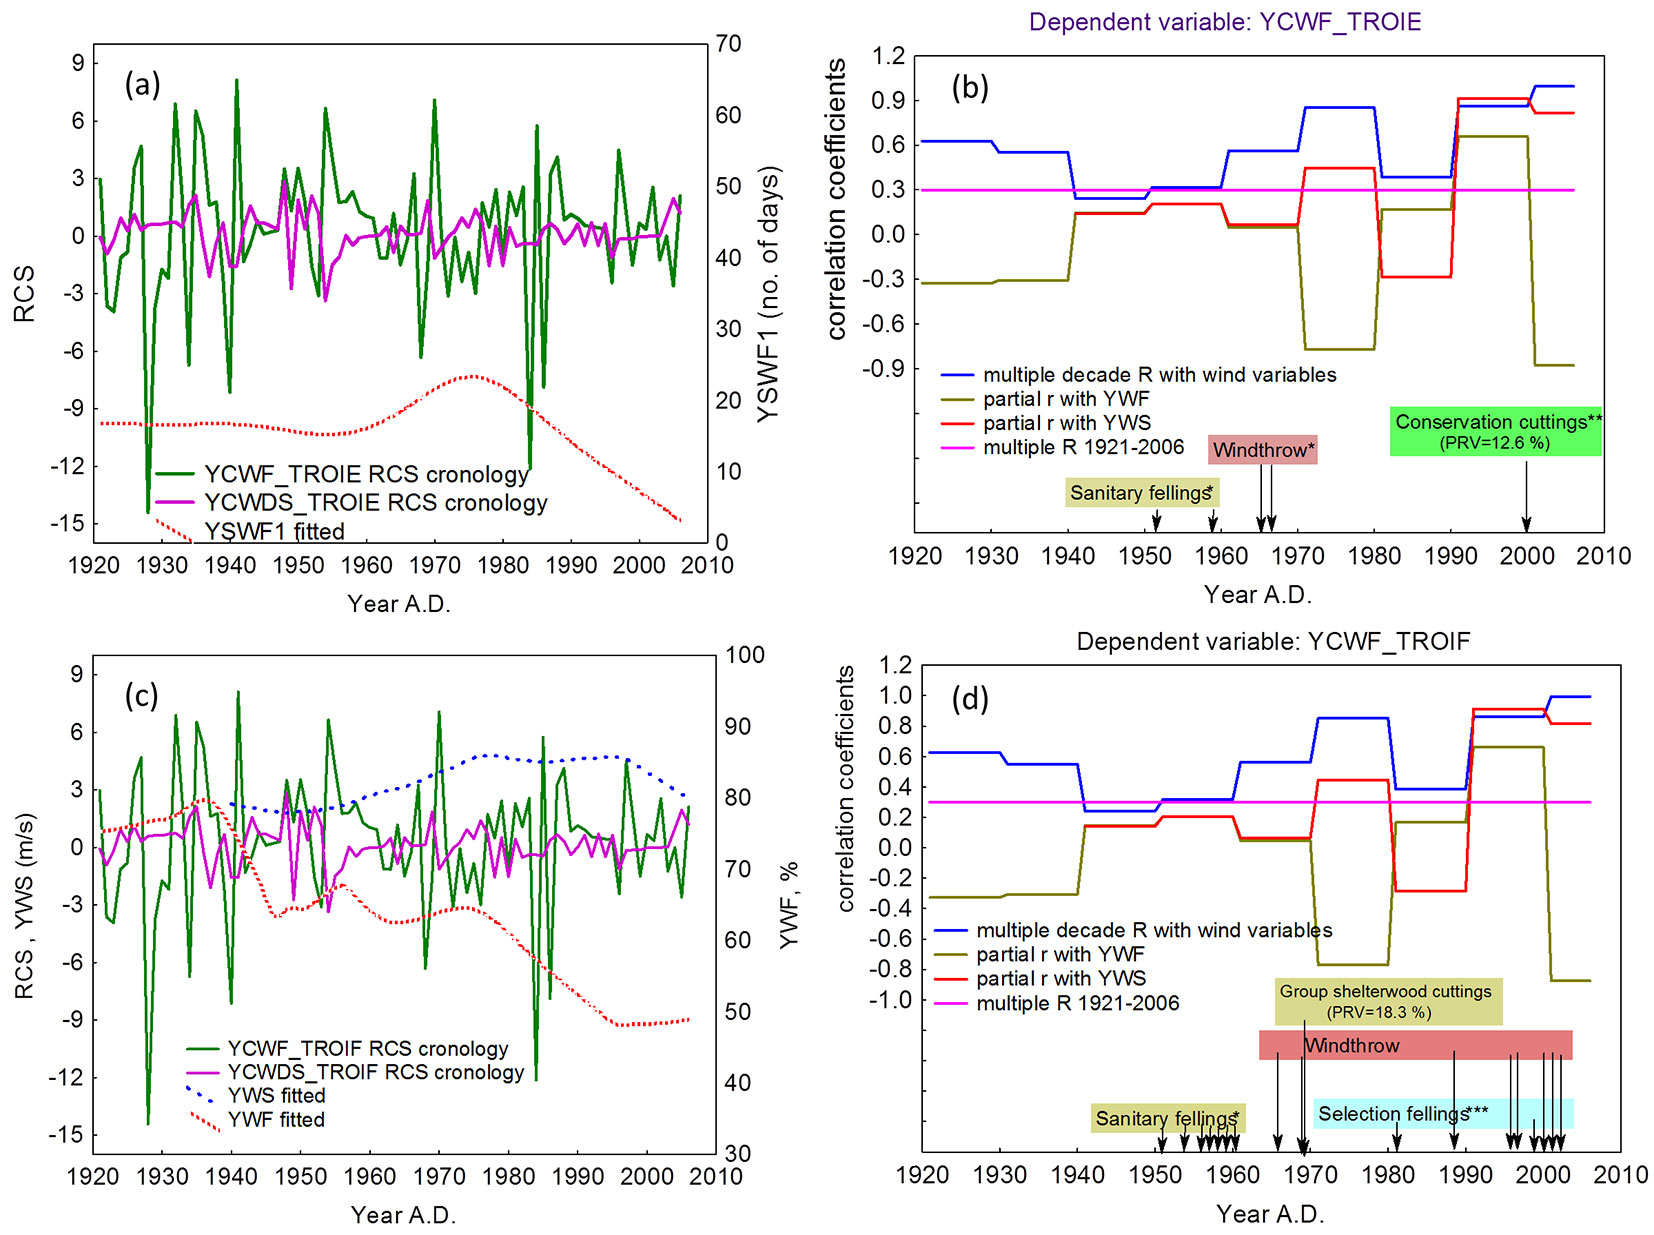
The first major reduction in stand density due to human interventions occurred in 1969 in sample plot TR6, when trees were 50-150 years old. This density reduction resulted in a larger correlation coefficient between YWS and YCWF in the next decade (r = 0.447 vs. 0.137 in the previous decades). During such decade, precipitation exceeded the multiannual average, though minimally contributed (0.3%) to the above change. A second major intervention was carried out in 1981-1982, when the TR6 stand was subject to the first cuttings aimed at transforming the selection system. During the 1990s, wind speed did not show significant departures from the average values (4.4 m s-1), and did not affect the fluctuations in compression wood. The next major intervention occurred in 1999, when the TR6 stand was designated for harvesting. The occurrence of four major storms in the same period (9 January 1998, and 6, 10, and 22 January 1999) threatened the stability of the stand, and led to major windfalls in 2000, 2001, and 2002. As a consequence, YCWF obtained from the residual trees in TR6 showed a strong variation in YWS.
Discussion
Dynamic bioaccumulation of compression wood
It has been reported that peaks in compression wood follow with a certain lag time the peaks in solid precipitation and windstorm events ([3]). In this study, the increase in YCWDS during the 1870s was related to an increase in air turbulence in Central Europe ([10]). The major peak in YCWF observed in the year 1907 in silver fir populations located in the Brasov Depression reflected their response to a windy winter ([46]). Contrastingly, a decline in the annual amount of compression wood was recorded in 1927-1932 for the same populations as a consequence of a relatively windless period. Further, the peak in YCWF during 1950 followed the windthrow events occurred in the winter of 1947-1948, which felled trees across 4.5 million m3 in the Eastern Carpathians ([33]). Also, the YCWF peak during 1956 may be explained by a major snowfall occurred in the previous winter ([28]). Finally, the strong wind recorded in the 1970s is reflected by the YCWF trend (Fig. 7).
The frequency of windthrow events noticeably increased after 1970 throughout Europe ([37]), including Romania ([33]). However, most events in recent decades were not caused by stronger winds (as displayed in Fig. 7), but by the weakening of stand resistance to wind over time, primarily due to human interventions.
Relationship between compression wood and wind regime
The exploration of historic wind regime at the annual resolution showed that wind perturbations are influenced or accompanied by a long-term intensification of air-mass movement. Our results proved that the compression wood is synchronized with the intensity of the wind, rather than with its duration. This study demonstrated that the analysis of the radial growth is an accurate tool in the study of interactions of silver fir populations with moving air masses (Fig. 5). SWF was the wind variable that showed the largest contribution to compression wood formation.
Given that tree stability is conditioned by its underground architecture ([6]), the rotting of the fulcrum above the gleyic horizon (observed after the uprooting of trees by wind in the TR2 plot) may increase the sensitivity of trees to balance, and explains the high frequency of compression wood in soils on colluvia at the base of slopes (plots TR2 and TR3) or in alluvial deposits (plot TR1). Indeed, the incidence of wood compression at the lowest elevation may be partly explained by the weakening of tree anchoring in hydromorphic soils.
The major wind events (based on fluctuations in YCWF) detected through the analysis of the highest altitude time series (e.g., TROI-E) were associated to values observed in December of the previous year (Fig. 6). The comparative examination of the structural detrended series demonstrated the importance of MCF from the previous year in the detection of inter-annual trends in compression wood incidence (YCWF), while the trends in compression wood intesity (YCWDS) were better detected by MCF of the current year. The intensity of compression wood, but not its incidence, is explained by the monthly wind regime, especially in the cambial dormancy (previous September- current March). Duncker & Spiecker ([12]) found that changes in compression wood composition occur with a lag time of one year after the wind perturbation.
The variation of the incidence in compression wood along the trunk (Fig. 4, Fig. 5, Tab. 4) may be explained either by a different sensitivity of receptors of the wind stimulus or by different intensity/duration of the mechanical stress in different parts of the stem. The cytosolic calcium ([11]), reactive oxygen species ([29]) and phosphatidylinositol ([43]) are the molecular mechanoperceptors identified so far. However, the transduction of wind strain in compression wood is mediated by growth hormones produced by the vegetative cones of trees ([21]), which act as radio-reception antennae. This is in accordance with the quality of the climatic signal (expressed by EPS) we observed in the upper section of the bole (Tab. 4). However, the strongest bond of structural features with atmospheric circulation was identified in the section 16-20 m, which corresponds to the base of the crown in most trees. Indeed, this segment is at the interface between the crown and the trunk, whereby it is likely most contrasting strains and mechanical stress would occur. In this context, the hypothesis of vertical variation of cambium sensitivity to wind stress still holds, though it requires further clarification in future studies.
The in situ molecular reaction to mechanical deformation takes minutes ([27]), while basipetal hormonal transmission of wind stimulus requires a longer time. Considering wind conditions at the monthly scale, the closer correlations with the chronologies of compression wood (Fig. 6) suggest that its induction is faster in trees exposed to a higher wind frequency rather than to a greater wind speed. Moreover, the positive and significant relationship of YCWF and YCF (Fig. 5) suggests that higher wind speed inhibits the transduction of wind stimuli in compression wood. Thus, it can be hypothesized that this process is delayed in periods of atmospheric calm, and this would support by the modest correlation with wind variables observed in March (Fig. 6), which was in fact the most turbulent month. Based on these observations, we speculate that the wind stimulus must continue for 2-4 months to exceed the excitation threshold, leading to the formation of compression wood.
Anthropogenic interferences
In this study, 61% of the explored series failed to explain the effect of climatic variables on the incidence of compression wood, suggesting the existence of different sources of variation. A continuous improvement over time of the relationship between the incidence of compression wood and wind-related variables at a decennial scale was observed in the TROI-E and TROI-F time series (Fig. 7). In the latter series this relationship may be the consequence of the exposure of remnant trees to wind action by the progressive reduction in stand density, while in the TROI-E series it might be related to the continuous intensification of wind, as reflected by YWS averages in the last eight decades (Fig. 7). This hypothesis is supported by the synchronization of the maximum magnitude of the correlation with peaks in YWS and SWF at a decennial scale (Fig. 7). Conversely, weaker relationships were found in periods of relative atmospheric stability. Thus, it may be argued that compression wood formation in trees is promoted by high-intensity wind events, while other factors drive xylogenetic processes during relative atmospheric calm periods.
Stand thinning increased the incidence of YCWF as a consequence of the increased frequency of windthrows. Sheltered trees tend to form compression wood all around the stem in the shape of circular crowns within the juvenile wood ([45]), as observed in felled trees ([9]). In addition, thinning exposes stand edges to high wind speeds ([54]), thus affecting the subsequent existence of survivors ([55]). Indeed, the sap flow performance of survivors is reduced due to the narrowing of the hydroactive section ([47]). The narrow tracheids of the compression wood ([52]) react better to their new physiological status.
The instability of the correlation between YCWF and wind variables after the 1969 intervention in the TR2 plot (Fig. 7d) suggests that the recovery time of the canopy was affected. The decrease in competition stimulates crown growth and the formation of compression wood through knots ([48]). Moreover, radial growth after thinning may be accompanied by the occurrence of compression wood ([7]), though contrasting results have been reported in the literature ([53]). Moreover, it has been reported that stand density does not affect the total content in compression wood of Sitka spruce trees, though the increased competition may increase its severe fraction ([15]). In this study, the effect of strong human interventions on wood structure of silver fir trees in the plot TR6 did not appear to exceed a decade (Fig. 7d). In maritime pine, stand thinning only affected the formation of compression wood for 18 years ([34]).
Despite the decline in the frequency of strong windstorms in the last 150 years ([39]), the precarious stability of forests to wind action calls for silvicultural practices aimed at optimizing the competition among trees, to improve individual and group resistance and minimize the incidence of compression wood.
Conclusions
This study demonstrates that wind affects radial growth of silver fir trees, even in habitats where wind is not a limiting factor for growth. Peaks of incidence in compression wood were synchronous with increases in air turbulence over the period 1921 to present.
The non-detrended time series of compression wood showed a high degree of internal dependence, which emphasized the persistence of climatic excitation in the compression wood records and led to the analysis of the previous calendar year contributions. The analysis of standardized series showed the influence of wind conditions in the preceding year on the incidence of the compression wood, while its intensity is better correlated with the wind regime in the current year.
The response of trees to fluctuations in wind conditions varied in space, even at relatively low distances. Trees growing at higher elevation showed a stronger wind effect in the time series of compression wood. At the lowest altitude, wood compression may be explained by the weakening of tree anchoring in hydromorphic soils.
Variation of the incidence of compression wood along the trunk suggests that cambium sensitivity to wind-induced mechanical stress varies or the transduction of wind load in woody tissue changes in different part of the stem. Based on our results, the trunk section at the base of the crown (16-20 m) better reflects annual wind movements, while the incidence of compression wood at height of 4-8 m reflects monthly wind circulation.
On a monthly scale, wind conditions in previous December, current March and current May stimulate the occurrence of compression wood, whereas those in previous September, current February and current May affect its intensity.
The analysis of residual chronologies of compression wood at the decennial scale showed that fluctuations in cambium capacity reflect long-term wind conditions, and revealed that wind strongly contributed to the formation of compression wood up to a decade after human interventions.
List of abbreviations
The following abbreviations have been used throughout the text:
ACF: Autocorrelation functionEPS: Expressed population signalESR: Edmund Schulman’s correlation coefficientEWP: Earlywood percentage (of the total ring width)EWW: Earlywood width (mm)LWP: Latewood percentageLWW: Latewood width (mm)MCF: Monthly average frequency of the calm periods (%)Msc: Mean sensitivity of the mean chronologyMWF: Monthly average frequency of the wind periods (%)MWS: Monthly average wind speed (m s-1)PACF: Partial AutoCorrelation FunctionREFF: Effective chronology signalSWF1: Average number of days with high speed wind (≥ 11 m s-1) classified by the minimum daily frequency (at least one case in four) of the meteorological records (n)SWF2: Average number of days with high speed wind (≥ 11 m s-1) classified by the average daily speed of the wind (n)TRW: Total ring width (mm)YCF: Yearly average frequency of the calm period (%)YCWDS: Yearly compression wood degree of severityYCWF: Yearly frequency of compression wood (%)YWF: Yearly monthly average frequency of the wind period (%)YWS: Yearly average wind speed (m s-1)
Acknowledgements
This work was supported by the Romanian Executive Agency for Higher Education, Research, Development and Innovation Funding (Project number TD-79: “Structural macroscopic features of raw wood as a means of estimating its quality”). We thank Eng. Laurentiu Puscasu for assisting with the field work. We also thank the two anonymous referees for providing constructive remarks.
References
Gscholar
Gscholar
Gscholar
Gscholar
Gscholar
Online | Gscholar
Gscholar
Gscholar
Gscholar
Gscholar
Gscholar
Gscholar
Gscholar
Gscholar
Gscholar
Online | Gscholar
Gscholar
Gscholar
Gscholar
Gscholar
Gscholar
Gscholar
Gscholar
Gscholar
Authors’ Info
Authors’ Affiliation
Viorela Marcu
Stelian Alexandru Borz
Maria-Magdalena Vasilescu
Ion Catalin Petritan
Transilvania University of Brasov, Faculty of Silviculture and Forest Engineering, Department of Forest Engineering, Forest Management and Terrestrial Measurements, Sirul Beethoven 1, 500123 Brasov (Romania)
Corresponding author
Paper Info
Citation
Dinulica F, Marcu V, Borz SA, Vasilescu M-M, Petritan IC (2016). Wind contribution to yearly silver fir (Abies alba Mill.) compression wood development in the Romanian Carpathians. iForest 9: 927-936. - doi: 10.3832/ifor1742-008
Academic Editor
Enrico Marchi
Paper history
Received: Jun 12, 2015
Accepted: Sep 14, 2016
First online: Oct 02, 2016
Publication Date: Dec 14, 2016
Publication Time: 0.60 months
Copyright Information
© SISEF - The Italian Society of Silviculture and Forest Ecology 2016
Open Access
This article is distributed under the terms of the Creative Commons Attribution-Non Commercial 4.0 International (https://creativecommons.org/licenses/by-nc/4.0/), which permits unrestricted use, distribution, and reproduction in any medium, provided you give appropriate credit to the original author(s) and the source, provide a link to the Creative Commons license, and indicate if changes were made.

Web Metrics
Breakdown by View Type
Article Usage
Total Article Views: 50782
(from publication date up to now)
Breakdown by View Type
HTML Page Views: 42176
Abstract Page Views: 3164
PDF Downloads: 3889
Citation/Reference Downloads: 69
XML Downloads: 1484
Web Metrics
Days since publication: 3586
Overall contacts: 50782
Avg. contacts per week: 99.13
Article Citations
Article citations are based on data periodically collected from the Clarivate Web of Science web site
(last update: Mar 2025)
Total number of cites (since 2016): 6
Average cites per year: 0.60
Publication Metrics
by Dimensions ©
Articles citing this article
List of the papers citing this article based on CrossRef Cited-by.
Related Contents
iForest Similar Articles
Research Articles
Effect of silver nanoparticles on hardness in medium-density fiberboard (MDF)
vol. 8, pp. 677-680 (online: 17 December 2014)
Short Communications
Climate effects on growth differ according to height and diameter along the stem in Pinus pinaster Ait.
vol. 11, pp. 237-242 (online: 12 March 2018)
Research Articles
Growth-climate relations and the enhancement of drought signals in pedunculate oak (Quercus robur L.) tree-ring chronology in Eastern Hungary
vol. 11, pp. 267-274 (online: 29 March 2018)
Research Articles
Anatomical and genetic aspects of ash dieback: a look at the wood structure
vol. 10, pp. 522-528 (online: 20 April 2017)
Research Articles
Characterization of VOC emission profile of different wood species during moisture cycles
vol. 10, pp. 576-584 (online: 08 May 2017)
Research Articles
Response to climate and influence of ocean-atmosphere phenomena on annual radial increments of Pinus oocarpa Schiede ex Schltdl. & Cham in the Lagunas de Montebello National Park, Chiapas, Mexico
vol. 16, pp. 174-181 (online: 30 June 2023)
Research Articles
The effect of provenance of historical timber on tree-ring based temperature reconstructions in the Western Central Alps
vol. 13, pp. 351-359 (online: 25 August 2020)
Research Articles
Rewilding beech-dominated temperate forest ecosystems: effects on carbon stocks and biodiversity indicators
vol. 18, pp. 1-9 (online: 02 February 2025)
Research Articles
Red wood ants shape epiphytic lichen assemblages in montane silver fir forests
vol. 15, pp. 71-76 (online: 22 February 2022)
Research Articles
Assessment of presence and distribution of Armillaria and Heterobasidion root rot fungi in the forest of Vallombrosa (Apennines Mountains, Italy) after severe windstorm damage
vol. 12, pp. 118-124 (online: 11 February 2019)
iForest Database Search
Search By Author
Search By Keyword
Google Scholar Search
Citing Articles
Search By Author
Search By Keywords
PubMed Search
Search By Author
Search By Keyword


