The effect of provenance of historical timber on tree-ring based temperature reconstructions in the Western Central Alps
iForest - Biogeosciences and Forestry, Volume 13, Issue 5, Pages 351-359 (2020)
doi: https://doi.org/10.3832/ifor3412-013
Published: Aug 25, 2020 - Copyright © 2020 SISEF
Research Articles
Abstract
Millennial-length tree-ring width chronologies are used to reconstruct temperature and place recent warming into historical context. The Simplon valley in the Western Central Alps is an ideal region for such a study as it provides historical timber back to medieval times which can be combined with temperature sensitive living larch trees. However, the exact provenance of the historical timber is unknown, but might origin from different elevations which potentially biases derived temperature reconstructions. To study the effect of elevation on tree growth and climate sensitivity, approximately 250 trees at three elevational levels (1500, 1700, and 2000 m a.s.l.) were sampled. Results indicate that the overall growth rate decreases with increasing elevation. Significant correlations between tree-ring width and summer temperature are recorded at tree sites ≥ 1700 m a.s.l. The comparison of the growth patterns between living trees and historical timber from Simplon Village (1476 m a.s.l.) reveals a most likely origin of the historical samples between 1700 and 2000 m a.s.l. When combining the data from the living trees at the different elevational levels with the historical timber, to produce three separate chronologies spanning the past 1200 years, substantial low frequency differences are recorded after RCS detrending the data. This finding demonstrates that the origin of samples in combined (living + historical) chronologies has a strong influence on long-term summer temperature reconstructions. It is thus important to analyse the growth characteristics of historical timber, and estimate their provenance in comparison to living trees, when producing millennial length chronologies.
Keywords
Elevational Transect, European Larch, Climate Response, Summer Temperature, Dendrochronology
Introduction
Annually resolved climate reconstructions spanning the last millennium are needed to relate the recent warming to warm periods in the past such as the Medieval Climate Anomaly or the Roman Warm Period ([38], [10], [24]). To reach millennial long climate reconstructions using tree-rings, living trees have to be combined with historical and/or subfossil wood ([6], [41], [16], [23]). For such a purpose, the European Alps are an ideal region to generate long tree-ring chronologies, as wood is available from historical buildings in villages built during medieval times ([6], [7], [10], [43]) as well as subfossil wood from lakes, peat bogs, and glacier forefields ([41], [16]). Furthermore, in the European Alps tree growth is controlled by summer temperature at high elevations ([2]), and two centuries of instrumental climate data ([4]) are available for calibration, which are ideal prerequisites to reconstruct millennial long past temperature variability.
In the existing millennial long climate reconstructions the living trees, used for calibration in the most recent time, originate from high elevations (> 1500 m a.s.l. - [6]; > 1800 m a.s.l. - [11]; > 1900 m a.s.l. - [7]), up to the Alpine treeline ([41]). However, for the historical timber used in such studies to extend the chronologies back in time, the elevation and ecological site factors of the original tree growing sites are frequently not known. All these studies cover wider regions within the Alps, and Büntgen et al. ([6]) and Nicolussi et al. ([41]) also combined different tree species. Due to the wide spatial distribution of the sampling sites in these studies the tree-ring data are calibrated with gridded climate data ([6], [27], [11], [41], [16]), which also cover wider regions compared to single meteorological station data. The living trees in the aforementioned studies, origin from an ecological homogeneous stand in comparison to the wider range of locations from where the historical samples likely origin. This could result in a biased reconstruction due to potentially less climate sensitivity in the historical timber in comparison to high elevation living trees. Tegel et al. ([49]) therefore concluded that the origin of recent material should mirror heterogeneity of the historical timber. This would probably not result in the strongest climate signal in the tree-ring width (TRW) but to a relatively equal signal-to-noise ratio throughout time.
Considering the above-mentioned facts, the Simplon region in the Western Central Alps is an ideal region to develop a millennial long summer temperature reconstruction because of the availability of historic larch timber dating back to medieval times. The location of the buildings is at relatively high elevations (> 1470 m a.s.l.) and the surrounding valley is covered with larch forests, representing the most probably source of the historical timber back to medieval times. It is, however, unclear whether the historical timber can be combined with the most temperature sensitive living trees from high elevational sites above 2000 m a.s.l. The effect of combining the historical timber with living trees from different elevations, to form composite living + historical tree chronologies, and how these combinations effect potential temperature reconstructions over the last millennium, is uncertain. We therefore sampled living larch trees in Simplon valley along an elevational transect including both slopes of the valley at 1500, 1700, and 2000 m a.s.l. and studied their growth characteristics and climate sensitivity. Data from historical timber were combined with these living trees from different elevations to produce different composite chronologies as well as summer temperature reconstructions. The differences among these chronologies and the effects on the summer temperature reconstructions were assessed.
Material and methods
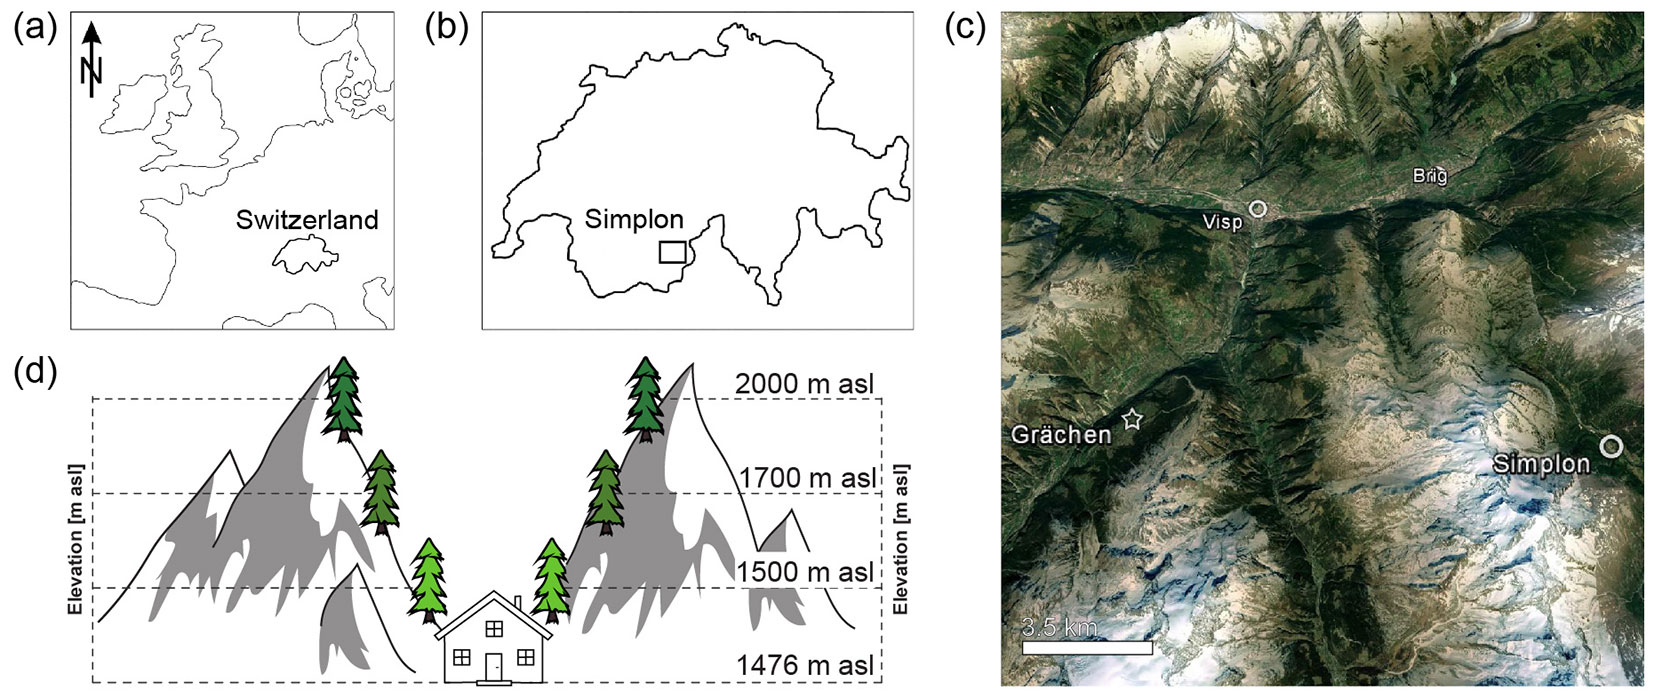
The study site is located in Simplon valley in southern Switzerland in the Western Central Alps (Fig. 1a, Fig. 1b). During several field campaigns from 2010 to 2012, approximately 250 larch trees (Larix decidua Mill.) were sampled (Tab. 1) on both valley slopes close to Simplon Village (Fig. 1c). The larch trees were sampled at three elevational levels, with the medium montane (MEDI) level at 1500 m a.s.l. representing approximately the elevation of the historical buildings. The alti montane (ALTI) level at 1700 m a.s.l., and the subalpine (SUB) level at 2000 m a.s.l. representing the local tree line (Fig. 1d). Two cores per tree were sampled at breast height perpendicular to the slope, including all tree age classes ([22], [48], [40]). However, at the MEDI and ALTI levels older age classes from 201-300 and > 300 years are underrepresented, whereas at the SUB level all age classes (≤ 100, 101-200, 201-300, > 300 years) are included (Tab. 1). Furthermore, at the MEDI and ALTI sampling levels, all trees within a radius of approximately 20 m were sampled including dominant, subdominant, and supressed individuals (Tab. 1). At the SUB level, we considered a larger radius of approximately 200 m and included more dominant trees, in response to reduced forest density near tree line. However, also at these sampling sites subdominant and suppressed trees were sampled (Tab. 1).
Fig. 1 - Investigation area and study design. Location of Switzerland in Europe (a), the Simplon region in southern Switzerland (b) and nearby meteorological station Grächen indicated by the star (c, modified from Google Earth™) and a sketch showing the sampling design along elevational transect around Simplon Village (d).
Tab. 1 - Site descriptions and chronology characteristics. Tree status and age classes are given in numbers of trees or samples in case of the historical timber. (GLK): Gleichläufigkeits values.
| Characteristics | Class / Type | Sampling site | |||
|---|---|---|---|---|---|
| Medium montane (MEDI) |
Alti montane (ALTI) |
Subalpine (SUB) |
Historic (HIS) |
||
| Number of series | - | 128 | 106 | 266 | 150 |
| Period (AD) | >5 series | 1865 - 2011 | 1684 - 2011 | 1495 - 2010 | 738 - 1922 |
| Mean segment length (yrs) | - | 100 | 127 | 203 | 176 |
| GLK | - | 0.64 | 0.64 | 0.63 | 0.59 |
| Mean Rbar | (Index chronology) | 0.36 | 0.45 | 0.35 | 0.41 |
| Mean EPS | (Index chronology) | 0.98 | 0.97 | 0.91 | 0.94 |
| Tree status | dominant | 32 | 22 | 102 | - |
| subdominant | 25 | 19 | 17 | - | |
| suppressed | 7 | 12 | 11 | - | |
| Age classes | ≤ 100 years | 35 | 17 | 27 | 40 |
| 101-200 years | 29 | 31 | 36 | 70 | |
| 201-300 years | 0 | 1 | 33 | 15 | |
| > 300 years | 0 | 5 | 34 | 25 | |
The historical timber (HIST) consist of 126 samples from several buildings in Simplon Village at 1476 m a.s.l. (see [43] for details). This data set with 126 series is updated in this study by 24 additional TRW series, which were sampled from a wooden floor taken out of one house (D. Nievergelt, personal communication), to a data set of 150 series in total. These additional 24 samples including 18 discs from deal boards and six disks of wood beams. For these samples, it is not possible to reconstruct the sampling. The age class distribution of the historical timber includes 70 series from 101-200 years, 15 series from 201-300 years, and 25 series > 300 years. Forty series of the historical timber were younger than 100 years. However, these ages are probably biased due to processing of beams and boards including bark and pith losses. The cores of the living trees were cut perpendicular to the wood fibre using a microtome ([29]) to create a plane surface for an optimal visibility of the tree-rings. The 24 additional historical samples are disks and were thus sanded. TRW was measured using a LINTABTM measuring table equipped with TSAP-WinTM software (both RINNTECH®, Heidelberg, Germany) at a precision of 0.01 mm. Cross dating of the TRW series of the different elevational sites and historical timber was performed visually and verified statistically using COFECHA software ([35]). COFECHA also provides the mean segment length in years of all four chronologies. The Gleichläufigkeits values (GLK) of the four chronologies was calculated using R ver. 3.5.3 ([42]) and the package dplR ([5]). Missing rings, which resulted most probably from larch budmoth (Zeiaphera diniana Gn.) outbreaks ([51], [45], [20], [3], [8], [34], [12]), were inserted with a value of 0.01 mm.
Three different chronologies representing different elevational levels (MEDI, ALTI, SUB) and the historical timber (HIST) were developed. Tree-ring age trends were removed by calculating residuals from (i) individually fitted 150-year splines and (ii) using RCS detrending, both after power transformation ([15]) of the data. Chronology variance was stabilised ([28]) using a 300-year spline within the software ARSTAN ([13]). Chronologies were built using the robust mean and truncated at a minimum sample replication < 5 series. ARSTAN also provides mean expressed population signal (EPS) and mean Rbar for the detrended index chronologies as well as the cambial age aligned growth curves.
For calculating the climate responses of the differently detrended elevational chronologies, monthly temperature and precipitation data of the meteorological station in Grächen were used. Grächen is located 15 km west of Simplon Village (Fig. 1c) at 1605 m a.s.l. This meteorological station was used because it is the nearest to the sampling sites providing long (AD 1864-2009) and almost continuous data sets (only the years AD 1887-1890 are missing) for temperature and precipitation. There is a meteorological station in Simplon Village, which only provides temperature data from AD 1971-1996 and precipitation data from AD 1961-2011. However, a comparison of the summer (June, July, August) temperatures between Grächen and Simplon Village shows that the absolute values are quite similar. The temperature variations and patterns are also similar with other station records from south-western Switzerland ([44] - Fig. 2). This coherency indicates that the temperature data from Grächen are likely reliable to test the climate sensitivity of trees from Simplon valley. Annual precipitation correlates significantly between Grächen and Simplon Village (r = 0.79, p < 0.001), even though annual sums are quite different (1247 mm in Simplon Village and 613 mm in Grächen, both calculated from AD 1961-2009). As precipitation sums and patterns change rapidly within this high mountain environment, e.g., towards the dry Rhône valley ~15 km north of Simplon Village, we decided to use the single station data near to the sampling site.
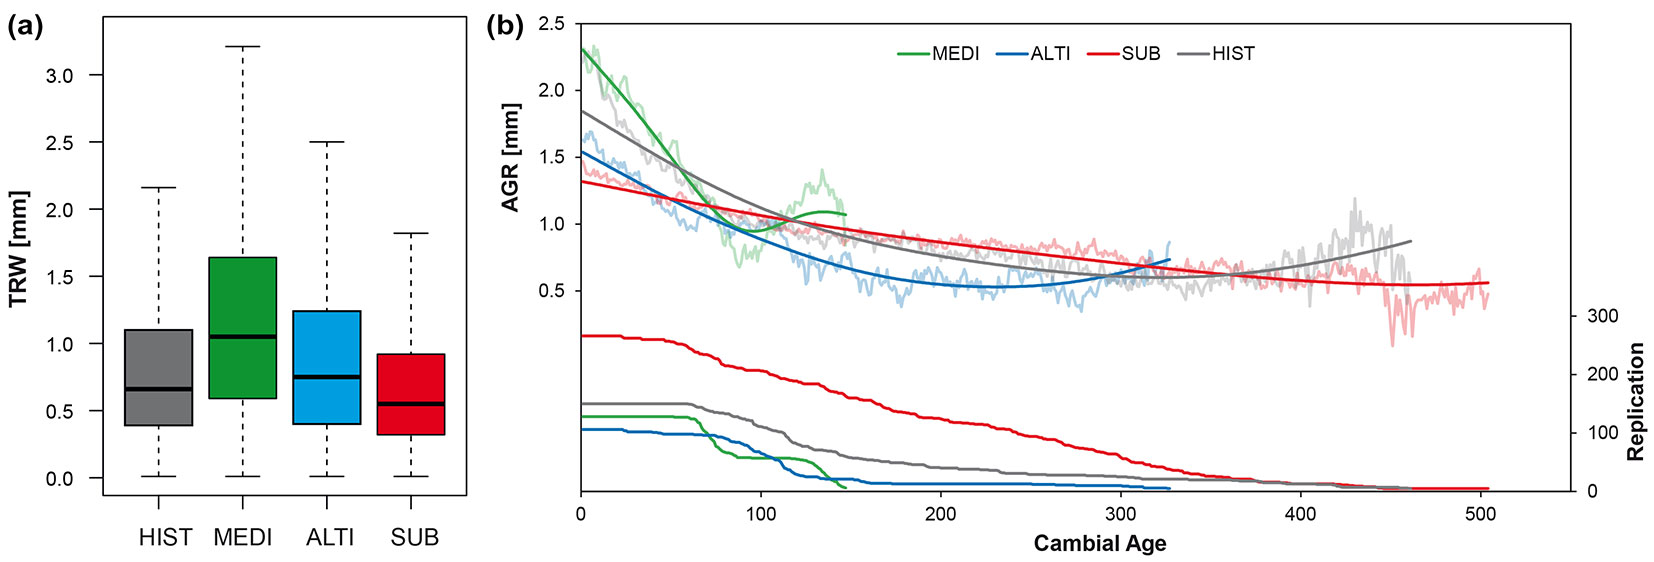
Fig. 2 - Growth characteristics of the historical timber and the three elevational chronologies. (a) Boxplots of the TRW of all measured tree-ring width and (b) average growth rates of the cambial age aligned ring width data with the respective series replication (> 5 series).
All correlations between the chronologies and instrumental climate data were calculated using Pearson correlation coefficients (r) and significance levels at p < 0.05, p < 0.01, and p < 0.001 were considered.
Summer temperature (JJA) reconstructions of the three combined (living + historic) chronologies were performed by scaling the z-transformed TRW-values to the instrumental summer (June, July, August) temperature values of the last 100 years (AD 1910-2009).
Results
Chronology characteristics
Mean EPS is lowest in the SUB chronology with 0.91 and highest in the MEDI chronology with 0.98 (Tab. 1), however, all mean EPS values are above the threshold of 0.85 ([52]). The GLK is lowest in the HIST chronology with 0.59 and highest in the MEDI and ALTI chronologies with 0.64. The mean Rbar is lowest in the SUB chronology with 0.35 and highest in the ALTI chronology with 0.45 (Tab. 1). Mean segment length increases with increasing elevation from 100 to 203 years, which is most probably due to more intense forest management in the lower elevations (M. Gerold, personal communication). This is also visible in the age class distribution, revealing that no tree > 200 years is included in the MEDI chronology, and only six trees > 200 years in the ALTI chronology. In the SUB chronology all four age classes are fairly equally distributed (Tab. 1). At the two lower levels the older trees are missing. The HIST chronology shows a mean segment length of 176 years, which lies between ALTI and SUB chronologies and an age class distribution more similar to the SUB chronology. However, due to older trees being bigger, such trees were preferred as construction wood, which results in this relatively high mean segment length and also the age class distribution with the most series being 101-200 years old of the HIST chronology.
Median TRW as well as maximum TRW decreases with increasing elevation. TRW varies between 0.1 and 2.2 mm for the HIST data, which shows a maximum TRW between the ALTI and SUB level. The median TRW of the HIST data is 0.6 mm and lies as well between the ALTI and SUB data (Fig. 2a).
The age-aligned growth curves show a decreasing juvenile growth with increasing elevation (Fig. 2b). The MEDI growth curve shows the steepest juvenile growth followed by a strong decrease around 90 years cambial age, which coincides with a lowering in the replication (Fig. 2b). This strong lowering in replication is probably due to forest management at this low elevational site related to first increasing density of the forest which results in growth reduction and suppression of the trees, and afterwards a clearing of the forest leading to an increased growth of the remaining trees, which are now the oldest at this site (M. Gerold, personal communication). The smoothest growth curve is the one of the SUB data, which also shows the most gradual decrease in age structure (Fig. 2b). However, the SUB growth curve is above the ALTI and MEDI growth curves after 50 and 70 years, respectively, which is due to the above-mentioned forest management. For the juvenile growth of the first 50 years, the HIST growth curve lies between the MEDI and ALTI growth curves (Fig. 2b).
The covariance between the four chronologies (ALTI, MEDI, SUB, HIST) for both detrending methods was analysed by Pearson correlation coefficients with the shortest common period with 58 years (AD 1922-1865) between MEDI and HIST chronologies and the longest common period of 428 years (AD 1922-1495) between SUB and HIST chronologies (Tab. 2). The RCS and 150-year spline detrended chronologies show the weakest correlations between MEDI and HIST with r = 0.36 and r = 0.42, respectively (Tab. 2). The highest correlations of the HIST chronology are observed with the SUB chronology (r = 0.53) using the RCS detrended data and with the ALTI chronology (r = 0.39) using the 150-year spline detrended data. These correlations are related to a common low frequency signal of the HIST and the SUB chronology and a common high frequency signal between the HIST and the ALTI chronology, resulting from the RCS detrending preserving low frequency variance while the 150-year spline detrending preserves higher frequency variations ([19]). Combining the results from the growth analyses and the inter-chronology correlations, suggests a probable provenancing of the historical timber between 1700 and 2000 m a.s.l.
Tab. 2 - Pearson’s correlation coefficients among the four chronologies for the two different detrendings (RCS, 150-year spline). The common period (AD) and the number of data (N) are also given. (**): p<0.01; (***): p<0.001.
| Detrending method / additional data | Series | MEDI | ALTI | SUB |
|---|---|---|---|---|
| RCS | ALTI | 0.65*** | - | - |
| SUB | 0.45*** | 0.71*** | - | |
| HIST | 0.36** | 0.40*** | 0.53*** | |
| 150-year spline | ALTI | 0.76*** | - | - |
| SUB | 0.57*** | 0.67*** | - | |
| HIST | 0.42** | 0.39*** | 0.36*** | |
| Common period (AD) | ALTI | 2011-1865 | - | - |
| SUB | 2010-1865 | 2010-1684 | - | |
| HIST | 1922-1865 | 1922-1684 | 1922-1495 | |
| Number of data (N) | ALTI | 147 | - | - |
| SUB | 146 | 327 | - | |
| HIST | 58 | 239 | 428 |
Climate response
The monthly temperature response of the three 150-year spline detrended chronologies show significant correlations (p < 0.05) with May temperatures for the MEDI chronology, with May to August temperatures for the ALTI chronology, and with June to August temperatures for the SUB chronology (Fig. 3a). The correlation coefficients are higher for RCS detrended chronologies, compared to the 150-year spline detrended chronologies, with monthly temperatures showing significant correlations with May temperatures for the MEDI chronology, with March and May to August temperatures with the ALTI chronology, and with January, March, May to August and October temperatures with the SUB chronology (Fig. 3b). These results indicate May to August and June to August as the best and most probable correlating seasons (Fig. 4a, Fig. 4b). The monthly precipitation response of the 150-year spline detrended chronologies only show significant positive correlations (p < 0.05) for the ALTI and SUB chronologies with April precipitation (Fig. 3c). For the RCS detrended chronologies, p < 0.05 is reached by the ALTI and SUB chronologies with April precipitation and by the SUB chronology with November precipitation (Fig. 3d). However, the correlations with monthly precipitation are weaker compared to the correlations with monthly temperatures. Anyway, a summer precipitation season April to August was tested (Fig. 4c) and the correlation to April precipitation was shown in relation to the elevation in Fig. 4d.
Fig. 3 - Correlation coefficients (r) between (a) 150-year spline, (b) RCS detrended chronologies and monthly temperature data, as well as between (c) 150-year spline, (d) RCS detrended chronologies and monthly precipitation data, both from the meteorological station Grächen. p-value < 0.05 is indicated in each panel.

Fig. 4 - Climate response of the RCS (circles) and 150-year spline (triangles) detrended chronologies with instrumental data from the meteorological station Grächen with May to August (MJJA) temperatures (a), June to August (JJA) temperatures (b), April to August (AMJJA) precipitation (c), and April precipitation (d). Filled symbols indicate significant correlation coefficients with p < 0.05.
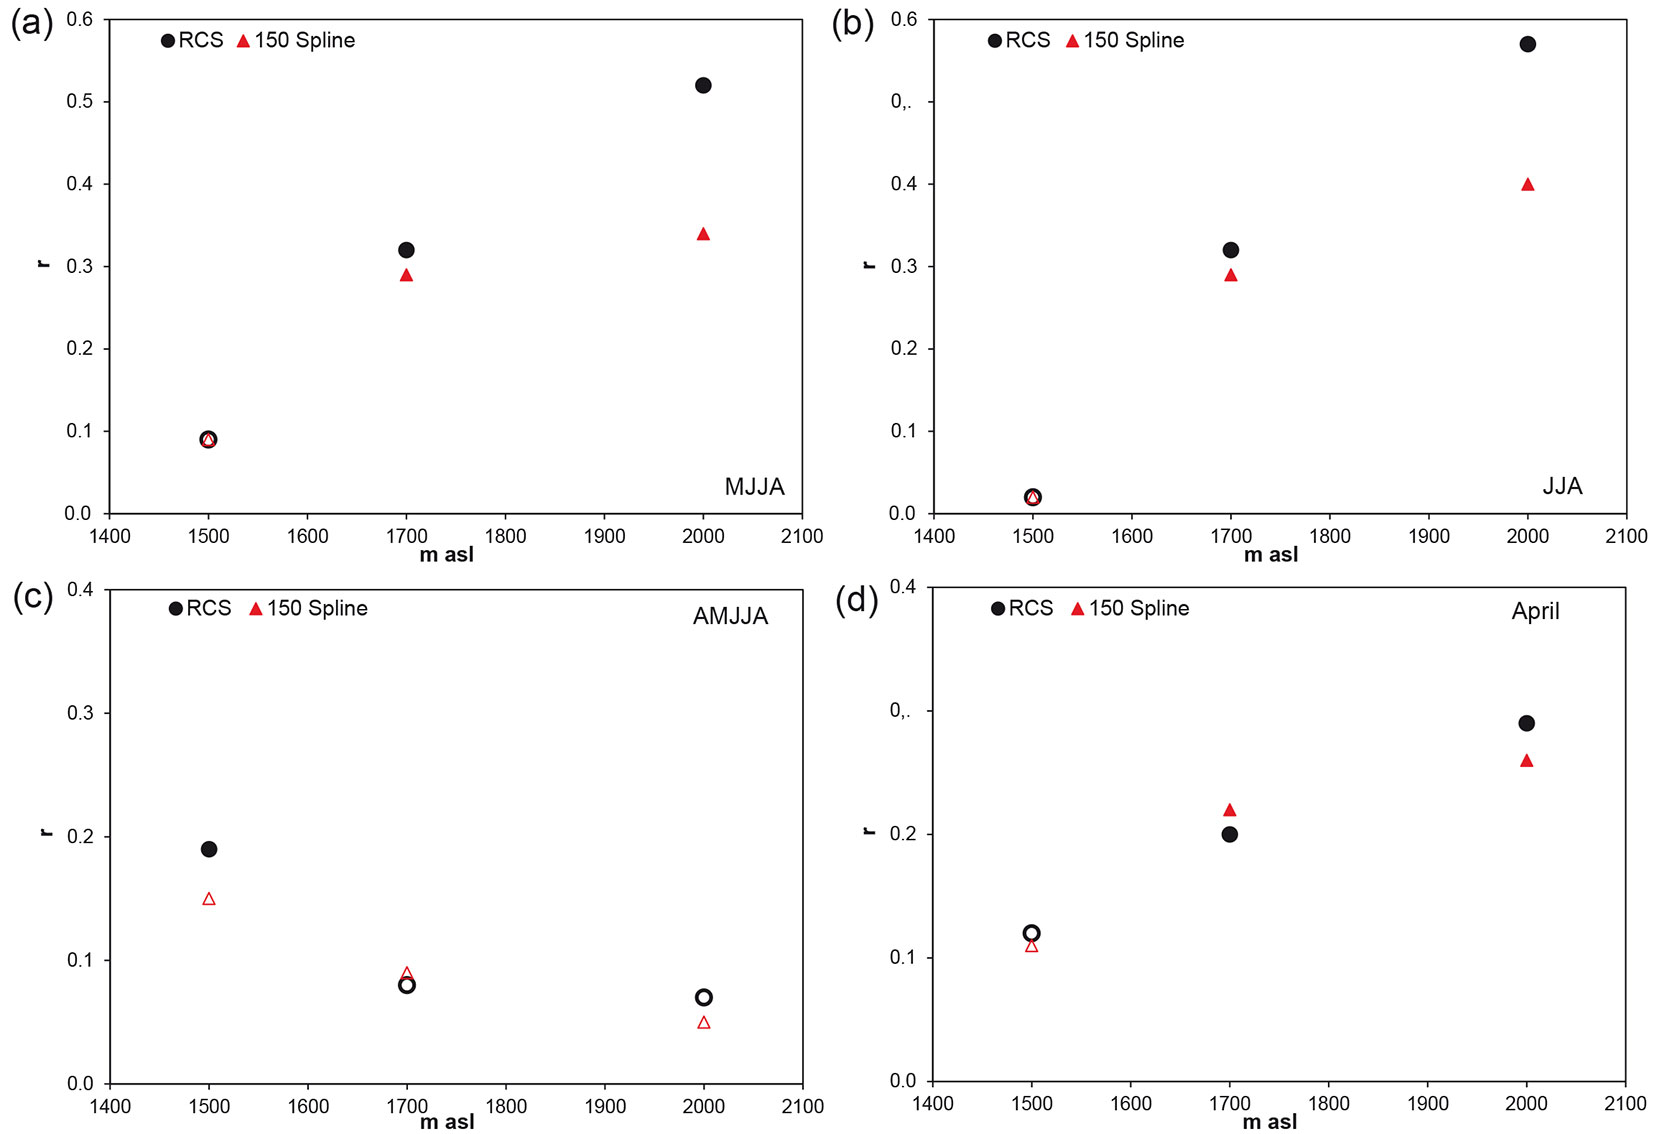
The response to summer temperatures (May to August and June to August) increases with elevation and is higher for the RCS detrended chronologies, compared to the 150-year spline detrended chronologies. There is no significant (p-value < 0.05) correlation for the MEDI chronologies to summer temperatures (Fig. 4a, Fig. 4b). The strongest climate response occurs for the RCS detrended SUB chronology with June-July-August (JJA) temperatures with r = 0.57 (Fig. 4b). The response to spring and summer precipitation (AMJJA) is decreasing with increasing elevation, however the only significant correlation (p > 0.05) appears for the RCS detrended MEDI chronology with r = 0.19 (Fig. 4c). The response to April precipitation increases with increasing elevation and is significant for the ALTI and SUB chronologies (r = 0.20 and r = 0.22, respectively for the ALTI chronology and r =0.29 and r = 0.26, respectively for the SUB chronology) without a distinct difference between the two detrending methods (Fig. 4d).
Discussion
The analyses of the growth patterns of the four different larch chronologies show that highest median and maximum TRW are observed in the MEDI chronology in 1500 m a.s.l. and these parameters decrease with increasing elevation (Fig. 2a). This change is in line with several other studies from Alpine regions analysing tree growth along elevational transects ([39], [1], [30], [31]). These studies observed the optimum growth elevation of larch trees at 1600 m a.s.l. ([39]), of several alpine conifers at 1300 m a.s.l. ([1]), and of Norway spruce at 1200 m a.s.l. ([31]). Below these elevations, tree growth is controlled by precipitation and above it is controlled by temperature, which results in an increase of correlation to summer temperature with elevation ([46], [1], [2], [30], [31], [47]), in line with the findings of this study (Fig. 4a, Fig. 4b). The optimum growth level varies among different tree species. However, the increasing summer temperature response of the larch trees at higher elevations could be biased by several factors. On the one hand, climate signal age effects ([21]) could bias the response patterns. In the MEDI and ALTI chronologies, average tree age is < 200 years, whereas in the SUB and HIST chronologies all age classes are present and mean tree age exceeds 170 years (Tab. 1). There is still an ongoing debate about climate signal age effects, and if any, which age class is best responding to climate. Some studies indicate a stronger climate sensitivity of younger trees, but other work indicated stronger signals of older trees ([36], and references therein). However, these studies are from different locations and also dealing with different tree species. Konter et al. ([37]) analysed climate signal age effects in larch trees from high elevational sites (2200 m a.s.l.) in the Zermatt region, about 30 km south-west of the Simplon valley. These trees showed slightly higher temperature signals in older trees. Transferring these results to our study site in Simplon valley translates into a stronger summer temperature response with increasing elevation as tree age increases with altitude. However, this effect is not very pronounced and does not change the results shown in Fig. 4a and Fig. 4b.
The distribution of age classes at the different elevational levels are affected by forest management, which is more intense at the lower MEDI and ALTI levels. Trees older than 200 years are therefore rare or entirely missing at these two levels. Another issue influencing the climate-growth relationship could be that supressed trees do not strongly respond to climate. Supressed trees are a minority in all three chronologies, though effects of suppression are visible in the MEDI chronology. The oldest trees at this level showed supressed growth approximately 90 years ago, which could bias the climate response during this period. These trees reveal a growth release after forest clearing (M. Gerold, personal communication). However, such potential bias does not strongly affect the overall conclusion of this study, as the MEDI chronology is located near the optimum growth level of the larch trees where climate signal has been reported to be insignificant elsewhere ([39], [1]).
Further biases of climate-growth assessments could arise from correlation TRW data from three different elevations with instrumental data from the meteorological station in Grächen at 1605 m a.s.l. Whereas temperature is decreasing systematically with increasing elevation, the changes from year-to-year should be fairly similar, as described above for the summer temperature of different meteorological stations in south-western Switzerland. For similar year-to-year variations, the correlations remain robust despite different absolute temperatures. Furthermore, larch budmoth outbreaks could have an influence on the climate growth relationships, due to a strong growth decline during and subsequent to mass outbreaks ([20], [3], [12]), which are not corresponding to low temperatures. Hartl-Meier et al. ([33], [34]) analysed larch trees from Simplon valley for the effects of mass outbreaks and showed that trees at all elevational levels analysed here are equally affected. As a consequence, the correlations reported here are likely weakened, particularly when larch budmoth mass outbreaks occurred in warm years ([20]), but these effects are likely similar among the sampling sites and elevational levels.
Despite all potential biases on the climate growth relationship, the RCS detrended SUB chronology shows a higher correlation with JJA than with MJJA (Fig. 4a, Fig. 4b), which is due to reduction of growing season length in the higher elevations ([46], [39]). The MEDI chronology does not show any distinct correlation to climate parameters, except for weaker correlation with May temperatures (Fig. 3a, Fig. 3b). AMJJA precipitation responses of the RCS detrended MEDI chronology ([47] - Fig. 4c), indicating that this site is located near the optimum conditions for larch growth ([39], [1], [31]). The positive correlations of the ALTI and SUB chronologies with April precipitation (Fig. 4d) could be explained by higher precipitation in April filling up the reservoir in the soil after snow melt and before the growing season, which has a positive influence on subsequent growth during the summer months. In conclusion, these results show that the historical timber, which was potentially provenanced between 1700 and 2000 m a.s.l. does not have the strongest response to summer temperature, as contained in the SUB chronology, but a weaker signal in the range of r ≈ 0.4 with JJA temperatures considering the RCS detrended chronology. However, the climate growth response of the historical timber could also be biased, due to the unknown position of the measured series in the tree trunk ([26]).
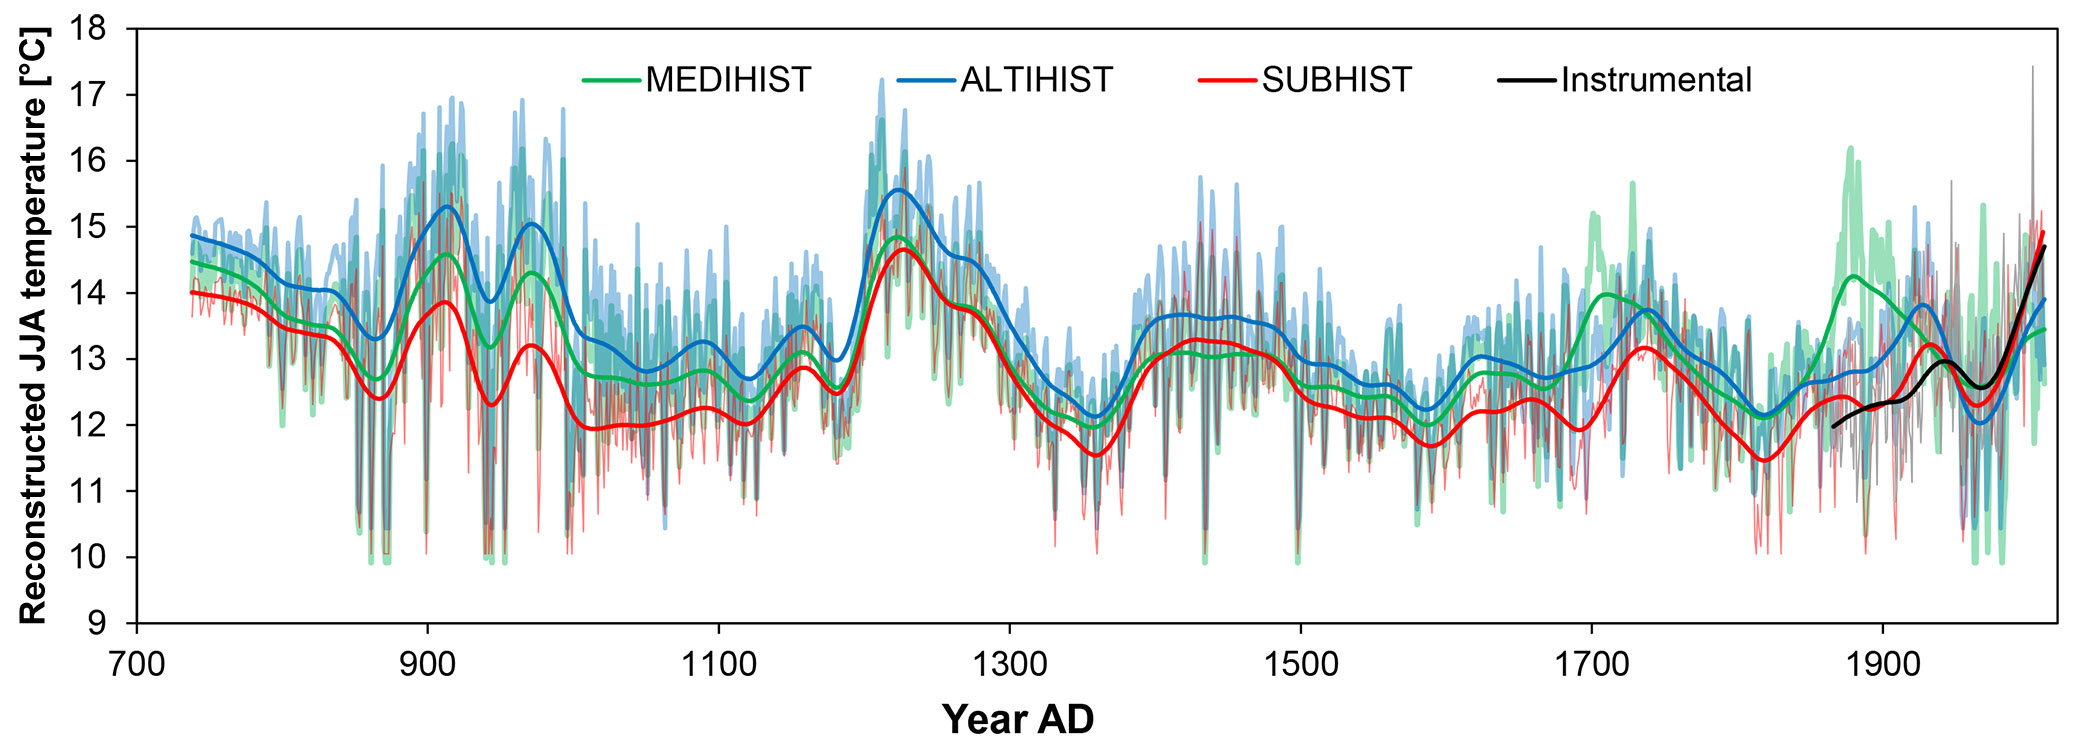
The combination of the three living-tree chronologies (MEDI, ALTI, SUB) with the HIST chronology reveals only small differences, particularly in the most recent 400 years, when considering the spline detrended data (Fig. 5a). Detrending the chronologies using RCS, however, results in quite different chronologies (Fig. 5b). In the 20th century the combined SUBHIST chronology shows a strong increase in TRW-index, whereas the two other combined chronologies show only slightly increasing values and a distinct lower TRW-index. The difference appears to be in line with the stronger summer temperature sensitivity of the SUB chronology. Furthermore, the amplitudes of chronology variance are different, e.g., between the late 13th and 14th century, even though this period is completely covered by historical timber. Reconstructing absolute temperatures from these RCS detrended chronologies it results in substantially different summer temperatures for example the maximum around AD 1250 with 14.6 °C reconstructed from the SUBHIST chronology in comparison to 15.5 °C reconstructed from the ALTIHIST chronology (Fig. 6). However, the SUBHIST chronology does not continuously show in the highest TRW-index value, as around AD 900 the ALTIHIST and around AD 1880 the MEDIHIST chronologies show highest values, respectively (Fig. 5b). The JJA temperature reconstructions show a fairly different picture. The reconstruction from the SUBHIST chronology shows most times the lowest temperatures until the 1950th. Then the SUBHIST reconstruction shows the highest temperatures after AD 1980 and follows most the instrumental data (Fig. 6). The ALTIHIST reconstruction show highest temperatures back in time from AD 1660. In the last 300 years the MEDIHIST reconstruction show higher temperatures during most time of this interval (Fig. 6). These results are very important, because such millennial long chronologies are aimed at comparing the recent warming with pre-industrial warm phases. For example, the SUBHIST reconstruction shows similar temperatures in the most recent time and the maximum around AD 1250. In comparison to this the ALTIHIST reconstruction shows higher temperatures around AD 1250 than in the most recent time (Fig. 6).
Fig. 5 - Combined chronologies (> 5 series) of the different living tree sites (MEDI, ALTI, SUB) with the historical timber detrended with 150-year splines (a) and with RCS detrending (b), 60-year smoothing is shown in bold for all chronologies. Replication of the three chronologies is shown in (c).
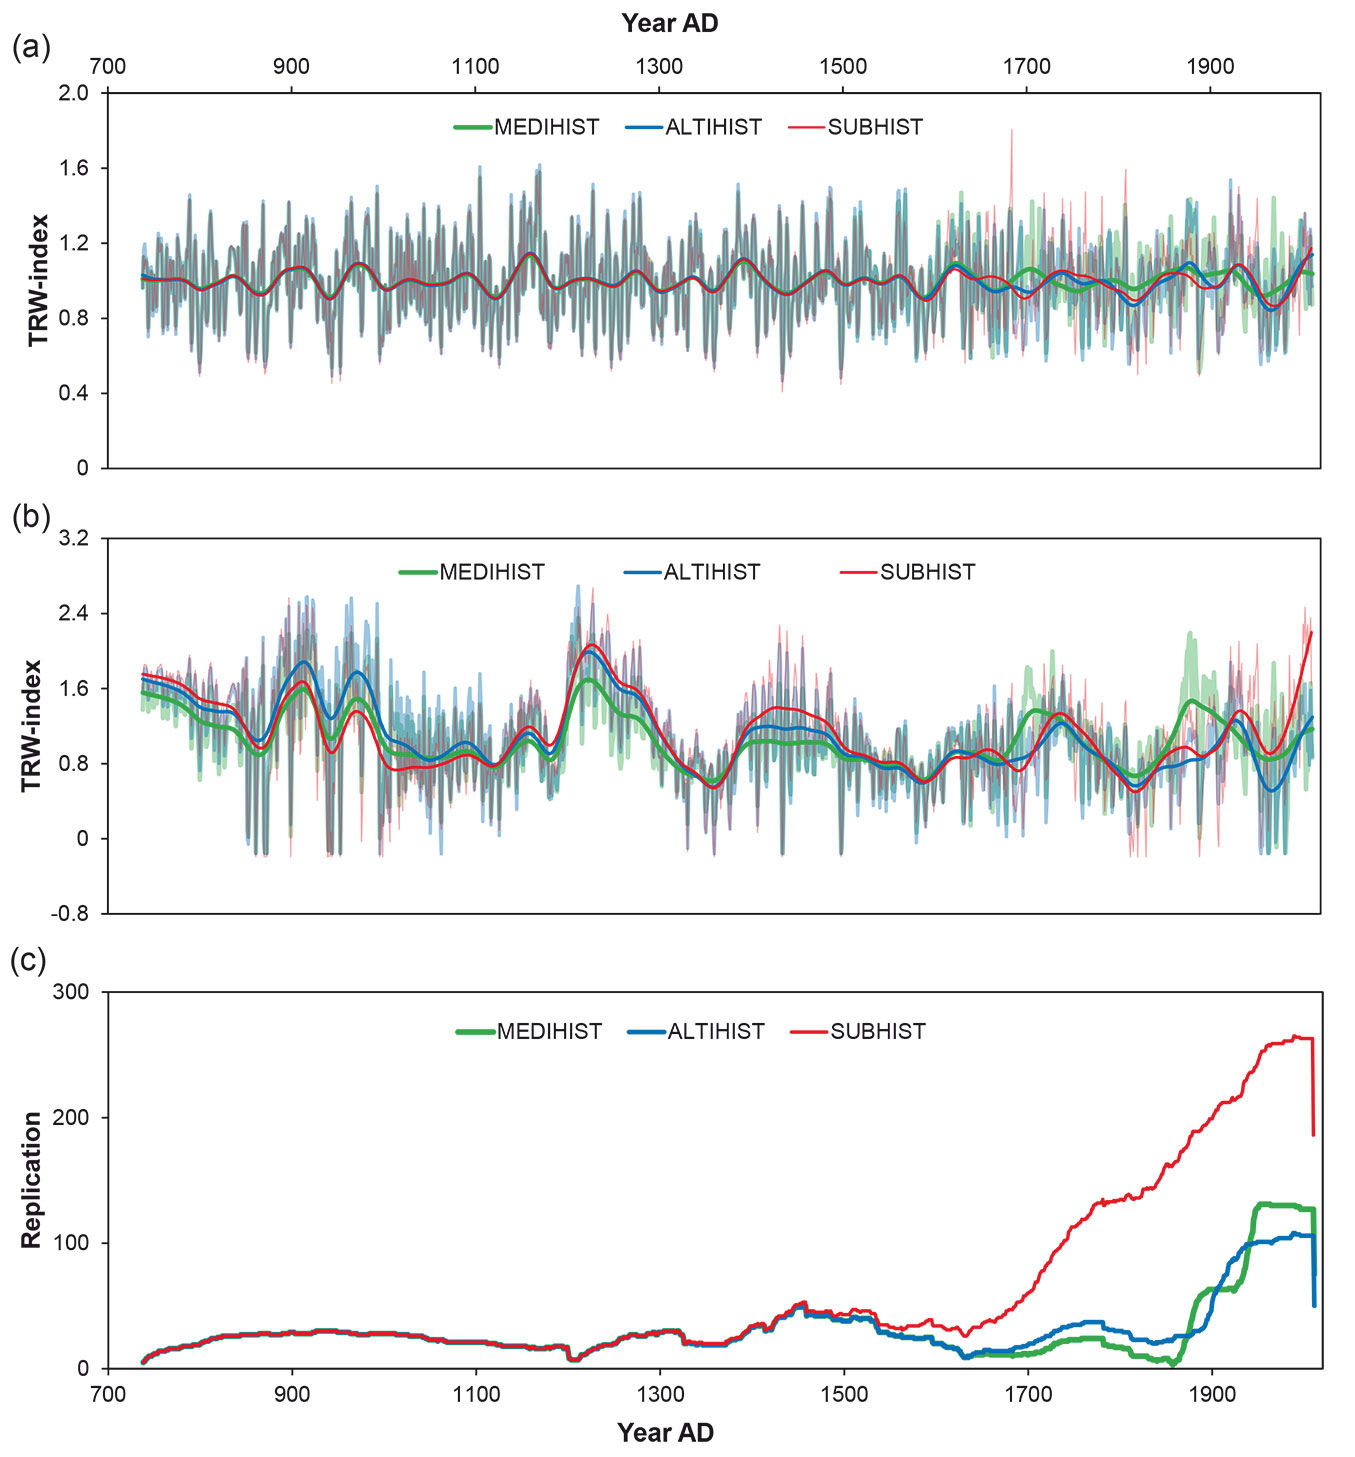
Fig. 6 - Reconstructed summer (June, July, August) temperatures for the three combined, RCS detrended chronologies (MEDIHIST, ALTIHIST, SUBHIST) and instrumental data. Sixty-year smoothing is shown in bold for all data series.
The RSC detrending preserves low-frequency variations beyond than the mean segment length ([14]), which is important for the assessment of long-term climate anomalies such as the Medieval Climate Anomaly and Little Ice Age. However, the difference between the three chronologies and reconstructions show how important the most recent part of the chronology is, and how changes in the living-tree data influence the reconstruction of absolute summer temperatures, amplitudes, and the timing of maximum and minimum temperatures (e.g., around AD 1250, in the late 17th, 19th, and 20th century - Fig. 5b, Fig. 6). Therefore, these results could be transferred to other mountainous regions where living and historic and/or subfossil wood should be combined to millennial long chronologies.
Differences in RCS detrended combined chronologies, integrating samples from living and subfossil wood, were also reported from Sweden, when assessing the effects of including living trees from lake shores or inland sites in combined chronologies ([17]). It is therefore recommended to check TRW growth patterns of the historical or relict wood in comparison to the living trees to evaluate which living-tree site best represents the growth pattern of the historical timber ([49], [17]).
Other tree-ring proxies such as Maximum Latewood Density (MXD) or stable oxygen and carbon isotopes could also be used when comparing and combining living trees with historical timber, as these parameters could be potentially less sensitive to elevational effects. For stable oxygen and carbon isotopes the effect of site conditions should generally be less important as well as showing higher climate sensitivity in comparison to TRW ([50], [32]). MXD data provide even stronger correlations with summer temperature in cold, high elevation or high latitude, environments ([27], [9], [23], [24], [25]) and are also less affected by micro-site conditions than TRW data ([18]). Büntgen et al. ([7]) did not detect a strong difference in average MXD values between recent and historic wood from the Alpine region as well as between the RCS curves of the MXD data. The results of Düthorn et al. ([18]) and Büntgen et al. ([7]) indicate less micro site effects on the MXD data, potentially supporting the development of millennial long chronologies with less effort of provenancing, compared to TRW. However, this has to be verified and more research is needed in analysing potential elevation effects on MXD and stable oxygen and carbon isotope data.
Conclusion
Changing tree growth and climate response along an elevational transect were analysed in this study from larch trees in Simplon valley (Switzerland) at 1500 m (MEDI), 1700 m (ALTI), and 2000 m (SUB) a.s.l. Our results show a decreasing median and maximum tree growth, as well as lower juvenile growth with increasing elevation. The response to summer (JJA) temperatures increases with elevation, and the weak correlations to climate of the MEDI chronology at 1500 m a.s.l. indicate near optimum tree growth. The comparison of tree growth parameters of the historical timber (HIST) with the three elevational chronologies allows a provenancing of historical timbers suggesting its origin between 1700 and 2000 m a.s.l. This conclusion is supported by the similarity of median and maximum TRW of the HIST chronology, which are between the data of the ALTI and SUB chronologies, as well as the juvenile growth which is closest to the juvenile part of the growth curve of the ALTI chronology. Therefore, the response to JJA temperature of the historical timber is most likely smaller than recorded for the high-elevation SUB chronology from 2000 m a.s.l., but more closely reflects the values obtained to the ALTI chronology at 1700 m a.s.l.
The combination of different elevational chronologies (MEDI, ALTI, SUB) with the HIST chronology does not show strong differences when detrending the data using 150-year splines. However, RCS detrending the data results in quite strong differences in amplitudes, trends and the timing of maximum and minimum TRW-index values, particularly in the 20th century and in the late 17th and 19th century. These differences in the RCS detrended chronology have a significant effect on the absolute summer temperatures reconstructed. Therefore, provenancing of historical or subfossil wood is important to generate robust chronologies, integrating and combining data from living trees and historical or subfossil wood, for the purpose of reconstructing past climate variability over the past centuries in mountainous regions.
Acknowledgments
D. R. and C. H. are grateful to the German Research Foundation (DFG; RI 2136/2-1; RI 2136/2-2; HA 8048/1-1). D. R. was also supported by funding of the Johannes Gutenberg University Mainz. J. E. was supported by the German Research Foundation projects “Inst 247/665-1 FUGG” and “ES 161/9-1”. We thank the forest district Simplon-South and especially M. Gerold for the permission to sample larch trees in Simplon valley. Thanks to F. Babst, F. Cimander, E. Düthorn, A. Görnitz, S. Holzkämper, L. Klippel, M. Kochbeck, K. Koenig, D. Nievergelt, K. Perkovic, S. Reifenberg, L. Schneider, and J. Sonnberg who helped with tree sampling, sample preparation, and TRW measurements. Further thanks go to M. Veicht for graphical editing. We thank two anonymous reviewers for their constructive comments on the manuscript.
References
CrossRef | Gscholar
CrossRef | Gscholar
Online | Gscholar
Authors’ Info
Authors’ Affiliation
Institute for Geosciences, Johannes Gutenberg University Mainz, Johann-Joachim-Becher-Weg 21, D-55128 Mainz (Germany)
Claudia Hartl 0000-0001-9492-4674
Jan Esper 0000-0003-3919-014X
Department of Geography, Johannes Gutenberg University Mainz, Johann-Joachim-Becher-Weg 21, D-55128 Mainz (Germany)
Corresponding author
Paper Info
Citation
Riechelmann DFC, Hartl C, Esper J (2020). The effect of provenance of historical timber on tree-ring based temperature reconstructions in the Western Central Alps. iForest 13: 351-359. - doi: 10.3832/ifor3412-013
Academic Editor
Giorgio Alberti
Paper history
Received: Mar 24, 2020
Accepted: Jun 29, 2020
First online: Aug 25, 2020
Publication Date: Oct 31, 2020
Publication Time: 1.90 months
Copyright Information
© SISEF - The Italian Society of Silviculture and Forest Ecology 2020
Open Access
This article is distributed under the terms of the Creative Commons Attribution-Non Commercial 4.0 International (https://creativecommons.org/licenses/by-nc/4.0/), which permits unrestricted use, distribution, and reproduction in any medium, provided you give appropriate credit to the original author(s) and the source, provide a link to the Creative Commons license, and indicate if changes were made.

Web Metrics
Breakdown by View Type
Article Usage
Total Article Views: 39605
(from publication date up to now)
Breakdown by View Type
HTML Page Views: 33405
Abstract Page Views: 3068
PDF Downloads: 2378
Citation/Reference Downloads: 0
XML Downloads: 754
Web Metrics
Days since publication: 2132
Overall contacts: 39605
Avg. contacts per week: 130.04
Article Citations
Article citations are based on data periodically collected from the Clarivate Web of Science web site
(last update: Mar 2025)
Total number of cites (since 2020): 3
Average cites per year: 0.50
Publication Metrics
by Dimensions ©
Articles citing this article
List of the papers citing this article based on CrossRef Cited-by.
Related Contents
iForest Similar Articles
Research Articles
Tree-ring-based reconstruction of larch budmoth outbreaks in the Central Italian Alps since 1774 CE
vol. 12, pp. 289-296 (online: 27 May 2019)
Research Articles
Response to climate and influence of ocean-atmosphere phenomena on annual radial increments of Pinus oocarpa Schiede ex Schltdl. & Cham in the Lagunas de Montebello National Park, Chiapas, Mexico
vol. 16, pp. 174-181 (online: 30 June 2023)
Short Communications
Climate effects on growth differ according to height and diameter along the stem in Pinus pinaster Ait.
vol. 11, pp. 237-242 (online: 12 March 2018)
Research Articles
Growth-climate relations and the enhancement of drought signals in pedunculate oak (Quercus robur L.) tree-ring chronology in Eastern Hungary
vol. 11, pp. 267-274 (online: 29 March 2018)
Research Articles
Impact of climate change on radial growth of Siberian spruce and Scots pine in North-western Russia
vol. 1, pp. 13-21 (online: 28 February 2008)
Research Articles
Individual-based approach as a useful tool to disentangle the relative importance of tree age, size and inter-tree competition in dendroclimatic studies
vol. 8, pp. 187-194 (online: 21 August 2014)
Research Articles
Influence of tree density on climate-growth relationships in a Pinus pinaster Ait. forest in the northern mountains of Sardinia (Italy)
vol. 8, pp. 456-463 (online: 19 October 2014)
Research Articles
Contrasting resin-tapped and untapped Pinus pinaster Ait. trees of central Spain in a dendroclimatic research
vol. 17, pp. 148-155 (online: 30 May 2024)
Research Articles
Role of photosynthesis and stomatal conductance on the long-term rising of intrinsic water use efficiency in dominant trees in three old-growth forests in Bosnia-Herzegovina and Montenegro
vol. 14, pp. 53-60 (online: 28 January 2021)
Research Articles
Decomposition of Norway spruce and European larch coarse woody debris (CWD) in relation to different elevation and exposure in an Alpine setting
vol. 9, pp. 154-164 (online: 28 August 2015)
iForest Database Search
Search By Author
Search By Keyword
Google Scholar Search
Citing Articles
Search By Author
Search By Keywords
PubMed Search
Search By Author
Search By Keyword


