Estimates of selective logging impacts in tropical forest canopy cover using RapidEye imagery and field data
iForest - Biogeosciences and Forestry, Volume 9, Issue 3, Pages 461-468 (2016)
doi: https://doi.org/10.3832/ifor1534-008
Published: Jan 11, 2016 - Copyright © 2016 SISEF
Research Articles
Abstract
Selective logging is one of the leading causes of forest degradation in the Brazilian Amazon region. The Brazilian Federal government has adopted a forest concession policy as a strategy to mitigate impacts of selective logging and regulate operations of the tropical timber industry in Brazil. This study used fractional forest coverage derived from satellite imagery and field data to assess forest degradation in two selectively logged study sites within the Jamari National Forest, a protected area located in the western Brazilian state of Rondônia. Initially, we estimated the fractional coverage from vegetation indices using RapidEye imagery and compared to gap fraction data derived from hemispherical photos acquired in the field. Subsequently, we estimated the impacts of different types of selective logging activities (log decks, primary and secondary roads, tree fall gaps, and skid trails) on forest cover using the fractional coverage dataset. The NDVI showed the highest R2 (0.56), indicating that 56% of the sample variation in fractional coverage derived from ground measurements can be explained by fractional coverage derived from the NDVI model. Our results also showed that the intensity of canopy impacts may vary according to the selective logging activity, ranging from skid trails to log decks which had the lightest and the heaviest canopy impacts, respectively.
Keywords
Timber Harvesting, Hemispherical Photographs, Satellite Imagery, Forest Degradation, Forest Concessions, Brazilian Amazon
Introduction
Several efforts to improve the sustainability of forest resources exploitation have been made throughout the world ([20]). In Latin America, national governments have delimited areas of public forests and granted forest rights to private landholders and communities ([23]). These governments are now in the process of clarifying rights to forest resources and promoting the adoption of reduced-impact logging practices ([20]).
In 2006, the Brazilian federal government adopted a new national forest policy to respond to a myriad of social, economic, and environmental pressures placed on forests of the Brazilian Amazon ([31]). This policy is based on public concessions to private entities, and provides that certified loggers must adopt strategies to preserve natural forest cycles and maintain ecological functions within the area under exploitation. More specifically, forest concessions have been implemented as a means to control a rampaging timber industry while providing a source of timber harvested on a long-term sustainable basis ([4]). However, for these targets to become achievable, governmental investments focused on the monitoring of impacts related to timber production chain are crucial ([30]).
Despite the ongoing conservation efforts, selective logging is one of the main drivers of the extensive forest degradation occurring in the Brazilian Amazon ([12], [21], [17]). It is also clear that most damages caused by selective logging remain underestimated by deforestation monitoring programs because of the intrinsic difficulties involved in mapping this type of land use using remote sensing technologies at a regional scale ([3]). As a result, uncertainty associated with degradation estimates is much higher than that associated solely with deforestation data. Recent estimates indicate that tropical forests degraded by selective logging and forest fires may be equal or exceed the area being deforested, resulting in even more fragmented landscapes ([37]).
As a result, a more accurate and precise way of detecting selectively logged forests is needed to understand the spatial distribution of logging activities and to estimate their overall impacts ([1]). An improvement in the ability to control selective logging activities should be possible using available remotely sensed data and geoprocessing techniques.
Remote sensing is an important data source for the improvement of command-and-control tools, mostly because of its proven capacity to provide data relating to large areas of continuous forest ([35], [19]). However, the spatial patterns of selective logging are not always easily detectable with satellite imagery, as the associated damages are often too small to be detected using the spatial resolution of most images ([1]). In addition, the detection and mapping of selectively logged forests using only remotely sensed data is a difficult task because harvested areas create a complex mosaic of undisturbed and disturbed forest comprising varying features such as tree fall gaps, skid trails, logging roads, log decks, and damaged canopy ([39], [38], [34], [35]).
Several authors have already addressed the existing technical challenges that hamper the efforts to detect and to map areas disturbed by selective logging activities. Matricardi et al. ([15]) showed that, while forests with obvious selective logging have well-defined logging roads and log decks and extensive canopy degradation, forests tracts where subtle selective logging activities are taking place show less canopy disruption or visible infrastructure. This difference in logging obviousness is related to either early logging activities or the substantial forest regrowth in previously logged forests ([35], [15]). Moreover, variations in logging intensity and the type of harvesting techniques applied to a given site can also affect the remote sensing detection capability. For example, areas with low intensity logging activities are not easily distinguished from intact forest ([2]), and the regeneration signal caused by understory vegetation growth and canopy closure usually becomes more significant in the second and third year after logging activities are ceased ([36]).
Despite these technical difficulties, remote sensing has provided some estimates of the extent and intensity of selectively logged area in the Brazilian Amazon Basin ([3]). There are, however, specific causes of uncertainty in monitoring selective logging with remote sensing: (1) the fine spatial resolution of canopy damage resulting from timber harvest activities; (2) the fast regeneration of selectively logged areas; and (3) the low frequency of satellite image acquisition caused by persistent cloud cover in the region ([2]). Regardless of these challenges, different authors have suggested that a quantitative assessment of the spatial patterns of small-scale disturbances (i.e., canopy openness caused by selective logging as reflected in satellite imagery) is important to improve the understanding of large-scale forest dynamics ([32], [1]).
This research aimed at improving the currently available analytical tools used to estimate the impacts of selective logging on tropical forests. To achieve that, we combined field data and RapidEye imagery to estimate the impact of selective logging at two study sites within the Jamari National Forest (JNF), located in the western Brazilian Amazon state of Rondônia. First, we estimated the fractional coverage ([28]) derived from RapidEye images and then validated it using a comparison with gap fraction data based on hemispherical photography acquired in the field using a fisheye lens camera. Next, we used fractional coverage to estimate the canopy openness of different selective logging activities (log decks, primary and secondary roads, tree fall gaps, and skid trails).
Material and methods
Study area
The Jamari National Forest (JNF) was selected because it was the only federal forest concession operating at the time we collected our data. Our study was designed to complement the tests related to the establishment of a monitoring system of forest concessions, which have been conducted by the Brazilian Forest Service.
The JNF was created by Federal Decree 90224/1984 as a protected area for sustainable use only. The territory of the JNF includes parts of the municipalities of Itapuã do Oeste, Cujubim, and Candeias do Jamari, which are located in the Western Brazilian Amazon state of Rondônia. The JNF encompasses a total of 220 000 ha of tropical forest. The main vegetation type found at the JNF is the dense tropical forest, but there are also patches of open tropical forest ([11]), which is characterized by high tree richness of spaced individual trees and includes clusters of palm trees and a high richness of woody lianas and epiphytes. In addition, the forest understory is mostly composed of seedlings and saplings from tall tree species ([11]).
In 2008, the Brazilian federal government allocated 96 000 hectares of the JNF for forest concession, which included three management units. Our study sites were the first Annual Forest Production Plots (AFPP) of Forest Management Units (FMU) 1 and 2 (Fig. 1).
Fig. 1 - Study site location: the Jamari National Forest, its Forest Management Units (FMU), and Annual Forest Production Plots (AFPP).
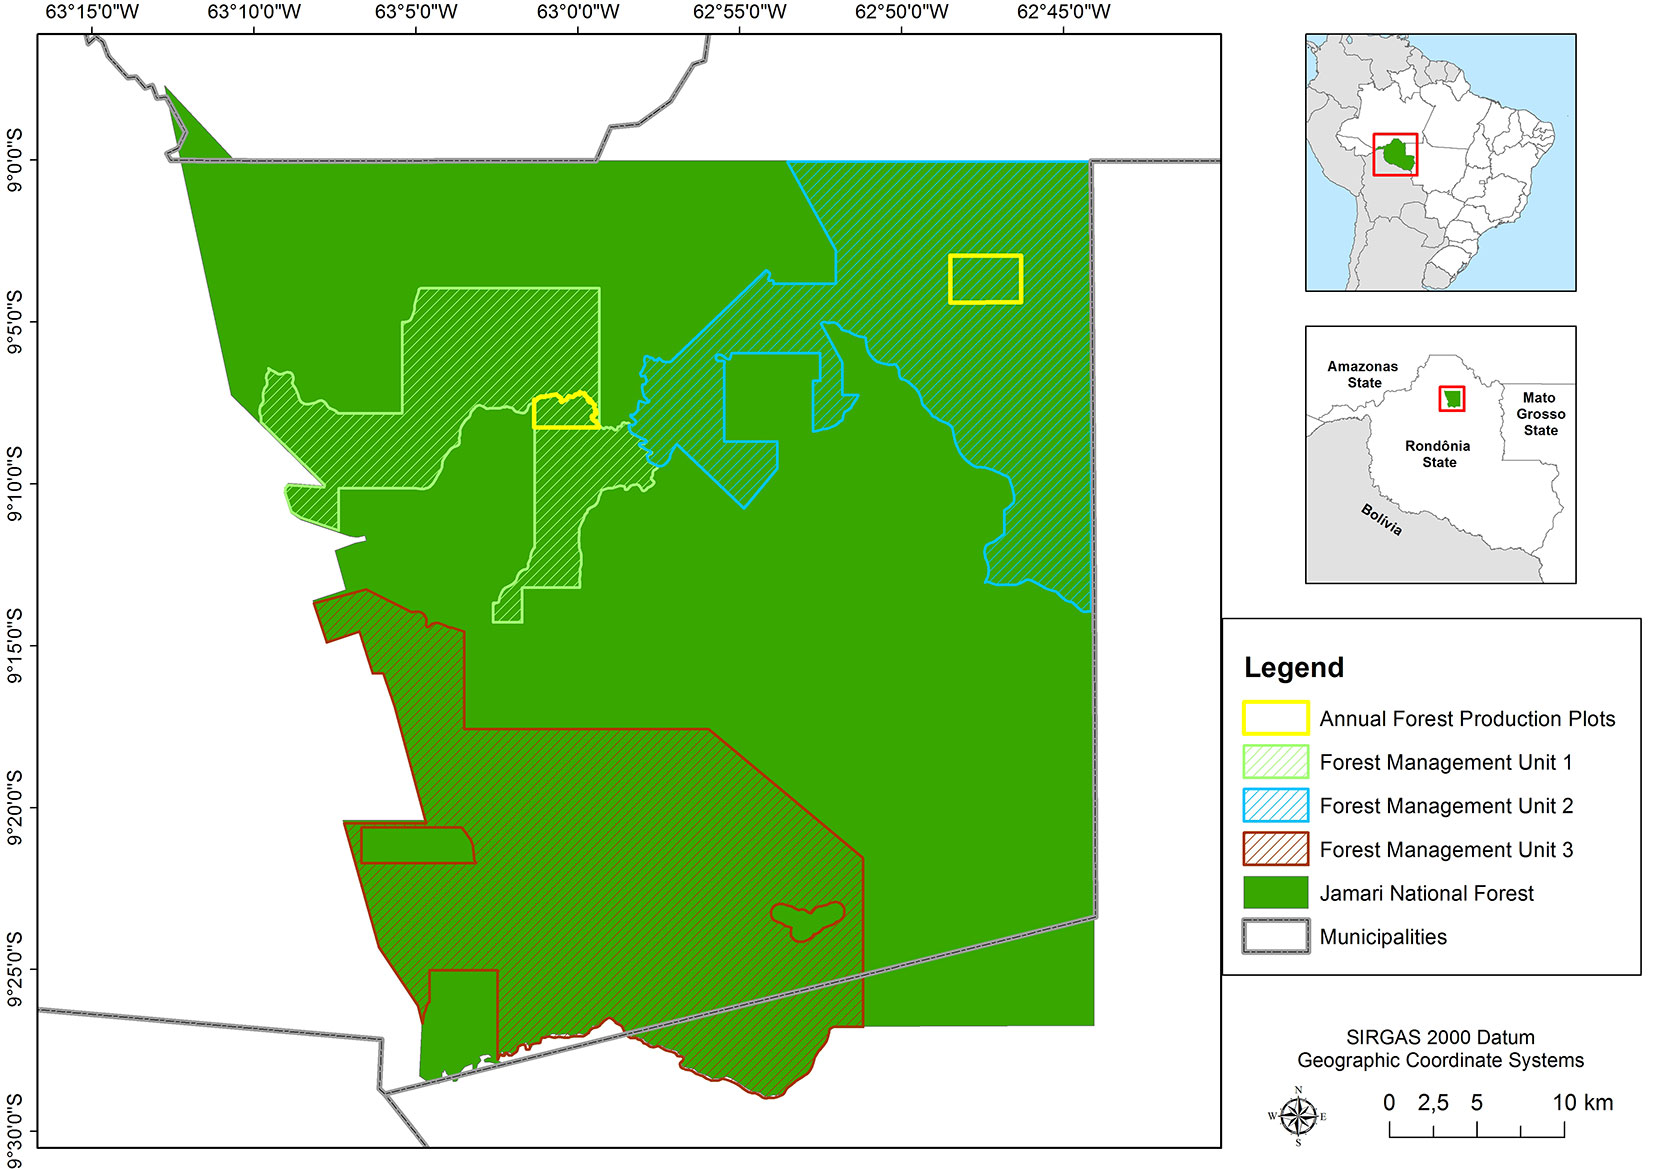
The total forest area under concession in the study sites encompasses 1662 ha (AFPP in FMU 1 encompasses a total of 594 ha, and the AFPP in FMU 2 a total of 1068 ha). According to production reports from the Brazilian Forest Service, it was harvested in 2010 and 2011 an average of 14.8 m3 ha-1 and 9.6 m3 ha-1 within the study sites (FMU 1 and FMU 2, respectively).
Field measurements
Gap fraction data was acquired during a fieldwork conducted from October 03 to 15, 2011. Sampling points included disturbed forest by selective logging activities (tree fall, skid trails, log decks, and primary and secondary roads). Additionally, gap fraction data was acquired for unlogged forests and used for control data in the analysis. These sampling techniques were previously used in gap fraction data collection by Pereira et al. ([24]), Asner et al. ([2]), and Matricardi et al. ([16]).
The sampling scheme used in the different types of selective logging disturbances included the following steps: (a) measurement of one third of log decks in both study areas; (b) measurement of patches of primary and secondary roads in each AFPP, by randomly selecting transects of 50 m length. The photos shots were taken at a 10 m interval along each transect; (c) measurement of skid trails using transects of 50 m length to avoid tree gaps and log decks; (d) forest canopy disturbances by tree fall gaps were measured using randomly selected trees (the same number as that of road patches), in the transects of 50 m length starting at the tree stumps. Two transects of 1000 m length were used to sample undisturbed forests, one at each study area. In this case, photo shots were taken at 60 m interval along each transect.
Hemispherical photographs were taken in the field using a 3.2 megapixel camera coupled with a fisheye lens and a vertical-horizontal leveler. These photographs were taken under favorable weather conditions and avoided the incidence of direct solar radiation. All sampling points were georeferenced using a handheld GPS unit (Garmin GPSMAP® 76 Cx) with locational accuracy of < 10 meters.
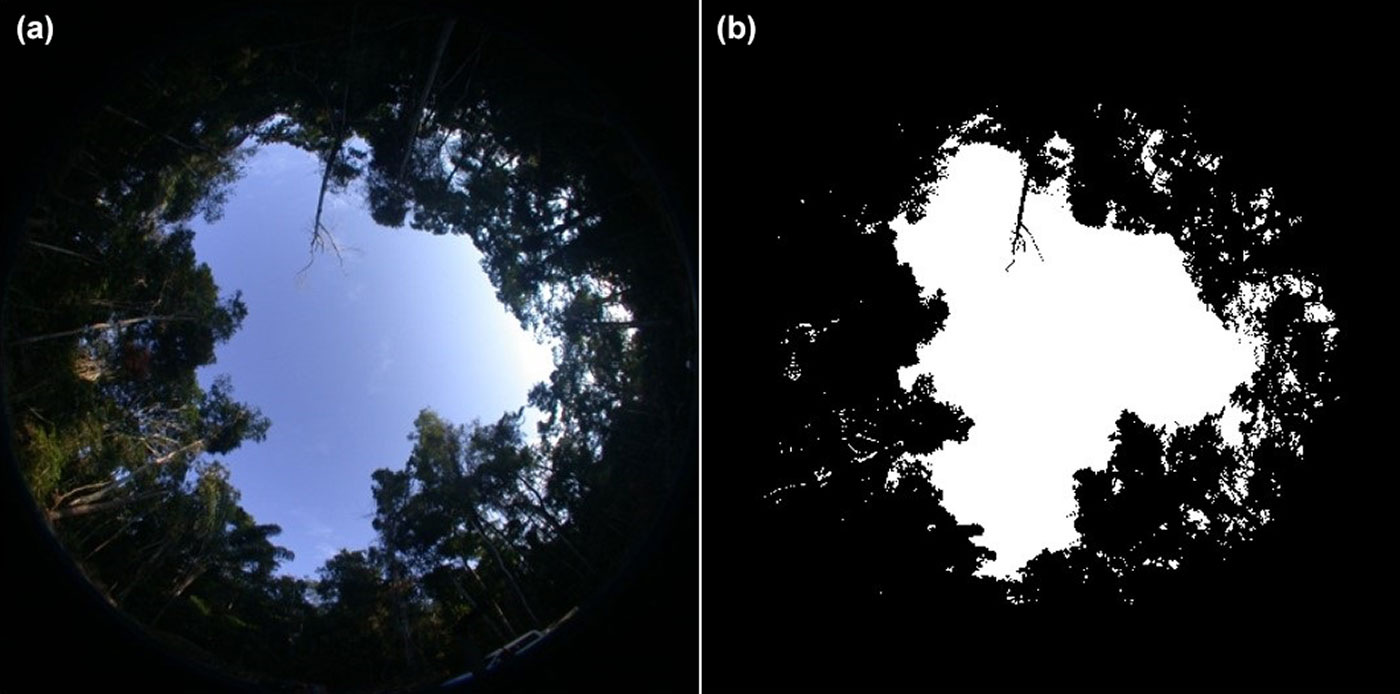
Gap fraction was estimated using the Gap Light Analyzer (GLA) software ([8]) on a semi-automated basis, as each individual photograph required a threshold empirically defined by the photo interpreter. The default threshold automatically estimated by GLA (a 128 brightness level out of 256) was mostly used and it was then eventually adjusted according to the observed sun exposure in the hemispherical photos. Subsequently, a binary image was generated for each photograph to estimate gap fraction (see Fig. 2). For strata data acquired in 50 m transects (primary and secondary roads, skid trails, and tree fall gaps), we considered just one observation per transect, by calculating the mean value of gap fraction from the six points of each one.
Fig. 2 - Example of: (a) hemispherical photograph of a log deck; and (b) binary image resulting from semi-automated image processing using the Gap Light Analyzer.
Remotely sensed data
This study used RapidEye images, orthorectified at 3A level with 5 m spatial resolution. Images were acquired on September 21, 2011; this date was selected because it was the closest to the fieldwork period. A cloud mask was applied to images with substantial cloud cover. However, images of some parts of the study area were acquired in May for two reasons: first, because at this time there was a lack of cloud cover, and second because most of the marketable trees at those parts had already been harvested in the previous year.
RapidEye imagery was radiometrically corrected using the Radiometric Scale Factor available in image metadata, then converted to top of the atmosphere reflectance using earth-sun distance and exo-atmospheric irradiance values for each band (available from RapidEye Product Specification). The ERDAS® 9.1 software was used to perform this calibration. Values of solar distance and the zenith angles applied in the reflectance conversion are shown in Tab. 1.
Tab. 1 - Acquisition date and the geometry of RapidEye images acquisitions used in this study.
| RapidEye Tile |
Acquisition date |
Solar distance (AU) |
Zenith angle |
|---|---|---|---|
| 2034916 | May 05-2011 | 1.01299 | 32.58 |
| 2034915 | September 21-2011 | 1.00402 | 11.37 |
| 2034814 | September 21-2011 | 1.00402 | 11.66 |
| 2034815 | September 21-2011 | 1.00402 | 11.54 |
Vegetation indices
Three vegetation indices were tested to estimate the fractional forest coverage, and these are summarized as follows. The NDVI ([29]), the most widely used vegetation index, and MSAVI and GEMI.
The Modified Soil Adjusted Vegetation Index (MSAVI) is a modified version of the Soil Adjusted Vegetation Index (SAVI) developed by Huete ([10]) and Qi et al. ([27]), respectively. MSAVI presents a different equation for the soil correction factor from that of SAVI, which depends on the vegetation cover of a given area. The MSAVI index is defined as follows (eqn. 1):
where ρNIR is the reflectance in the near infrared channel and ρR is the reflectance in the red channel, and L is defined as (eqn. 2):
where s is the slope of the soil line computed from reflectance of open areas in a RapidEye image.
In addition, Pinty & Verstraete ([26]) assessed the effects of atmospheric variables on vegetation indices such as the Simple Ratio (SR) and the NDVI. Given that such effects are greater in the red channel than in the near infrared band, these authors proposed a Global Environment Monitoring Index (GEMI) for the monitoring of vegetation. GEMI is defined as (eqn. 3):
where ρR is the reflectance in the red channel, and η is defined as (eqn. 4):
where ρNIR is the reflectance in the near infrared channel and ρR is the reflectance in the red channel.
Fractional forest cover
A mixture model was used to derive the fractional forest cover based on the vegetation indices. In this model, the reflectance of each pixel was defined as the sum of the individual reflectance values of all components weighted by its proportion in the total coverage ([28]). In this analysis, we applied two endmembers: forest canopy and open areas with bare soil, while intermediate values of fractional cover were assigned to pixels with intermediate vegetation cover. We did not use Spectral Mixture Analysis (SMA) due to the lack of spectral data acquired in the field to support a proper endmember selection in this remote sensing approach, which is critical to estimate fraction images ([3], [36]).
According to Maas ([13]) and Qi et al. ([28]), the green fractional percentage can be estimated by using a simple linear mixture model and two spectral endmembers (forest canopy and bare soil). Based on it, the Fractional Coverage (FC) applied to a vegetation index can be approximated as (eqn. 5):
and it can be rewritten as (eqn. 6):
where IVsoil is the vegetation index value of an open area (bare soil) and IVveg is the vegetation index value of a typical vegetation pixel.
The values of the vegetation indices for the two endmembers employed in the model were determined from histogram analysis and visual inspection of VI images. A pixel value from a deforested area and the average value of vegetation in undisturbed forests were used for bare soil and vegetation values, respectively. When a linear model with more than two components is used, eqn. 6 cannot be considered because the analytical model assumes that a pixel can only consist of soil and vegetation components.
Data processing
A fractional coverage (FC) image was estimated for each vegetation index. Along with the gap fraction data acquired in the field, the FC images were used to assess the applicability of the FC technique in estimating the rate of canopy openness within selectively logged areas and undisturbed forests.
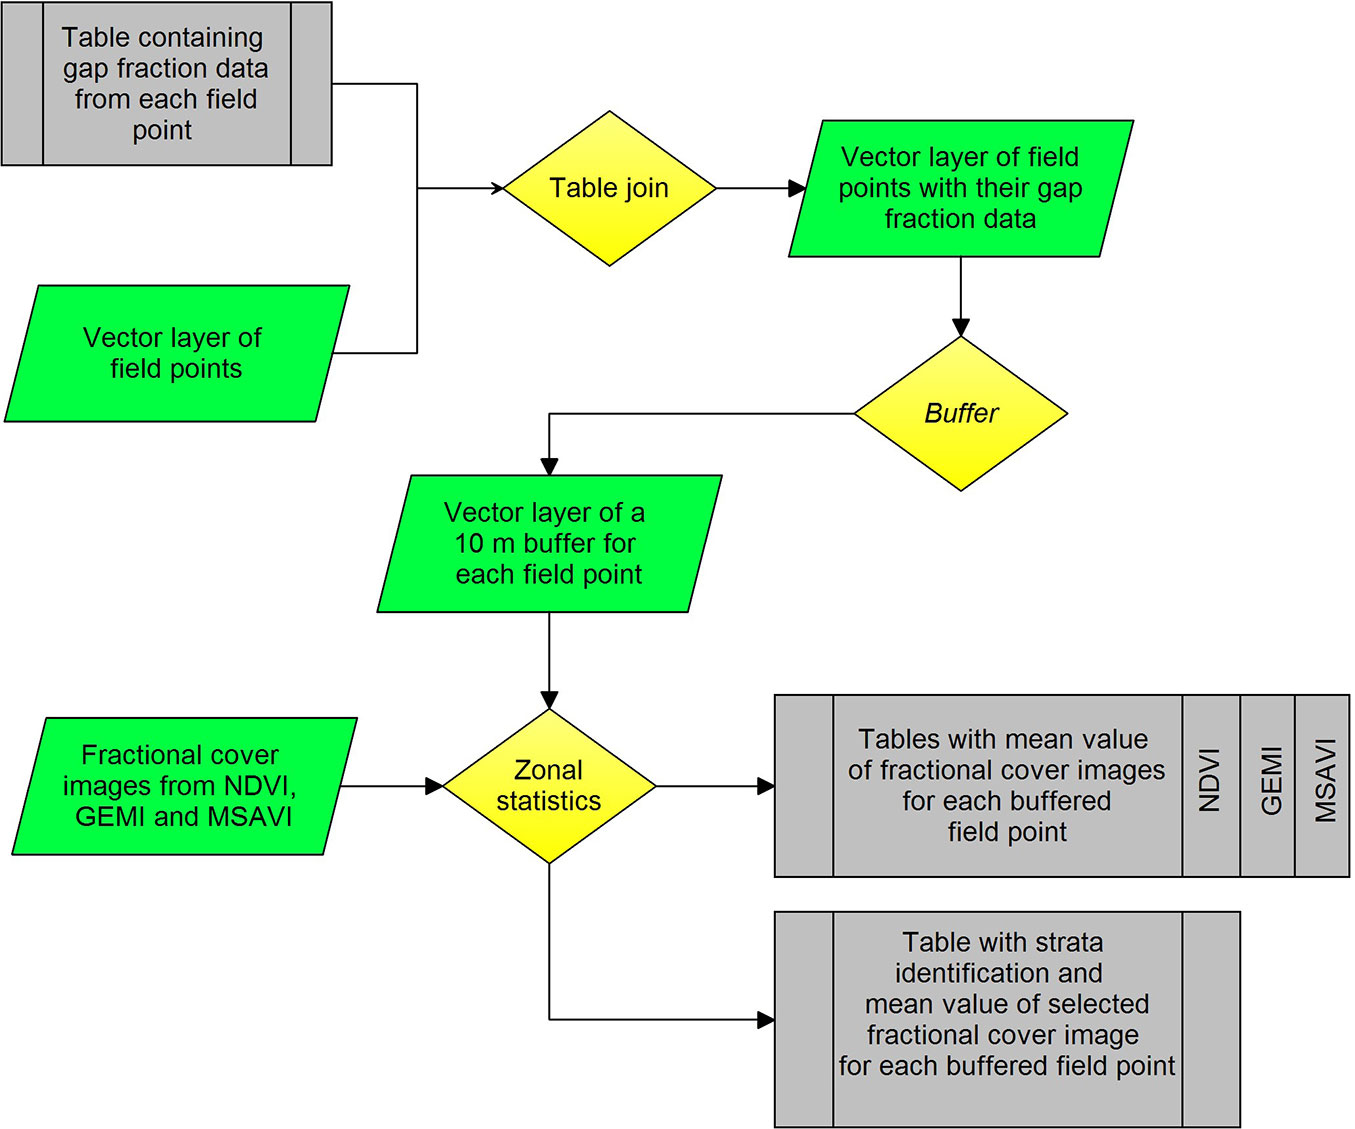
Each location point acquired in the field was associated with a specific type of selective logging environment and, the gap fraction data derived from hemispherical photos were then linked with the attribute table of each point location. One hundred and sixty four points for disturbed and undisturbed forests were used in the analysis. A 10-m buffer zone was generated around each point to estimate the arithmetic mean of pixels values from fractional coverage images within this area. These buffer zones were created to minimize the uncertainty related to the positional accuracy of the GPS field point locations and image geometric corrections.
Gap fraction measurements of 164 field sample points and their associated fractional coverage values derived from vegetation indices were used as input for the statistical analysis. As a result, the contribution of each type of forest disturbance by selective logging compared to undisturbed forests was assessed. Fig. 3 shows further details on the relationship between gap fraction data collected in the field and the FC data derived from vegetation indices.
Fig. 3 - Flow diagram of the relationship between gap fraction from field data and fractional coverage derived from vegetation indices.
Data analysis
The relationship between the fractional coverage retrieved from vegetation indices and the gap fraction measured in the field using hemispherical photos were tested using a linear equation model. The best fit equation was employed to select the optimum vegetation index. Additionally, we applied the criteria suggested by Draper & Smith ([7]) to validate the selection of the best adjusted equation as following: graphical analysis of the residuals, standard error of the estimate (Syx) and the coefficient of determination (R²). In this analysis, 33 out of 164 randomly selected observations were used to validate the previously defined regression model.
Canopy cover impacts by selective logging were assessed using multiple regression analysis. The fractional coverage estimated from the best vegetation index was used as the dependent variable, and the location of the five types of logging activities were used as the independent variables. Field measurements of undisturbed forests spatially located contiguously to disturbed forests were used as control. Multiple regression analysis is a useful technique for estimating the partial effects of independent variables because it controls other factors that could simultaneously affect the dependent variable ([22]). In our analysis, the multiple linear regression model was defined as (eqn. 7):
where DV is the dependent variable (the fractional forest coverage retrieved from the selected vegetation index), β0 is the constant of the equation or the Y-axis intercept, β1 is the coefficient associated with the independent variable X1 (log decks), β2 is the coefficient associated with the independent variable X2 (primary roads), β3 is the coefficient associated with the independent variable X3 (secondary roads), β4 is the coefficient associated with the independent variable X4 (tree fall gaps) and β5 is the coefficient associated with the independent variable X5 (skid trails). The variable υ is the associated error, which includes factors other than the independent variables considered in this model.
The null hypothesis were defined as: each independent variable (log decks, primary roads, secondary roads, tree fall gaps, and skid trails) used in the regression model has no effect on fractional forest cover. A 95% confidence level was adopted. Simple and multiple linear regression analyses were performed using the R statistical package, version 3.0.1.
Results
Fractional forest coverage
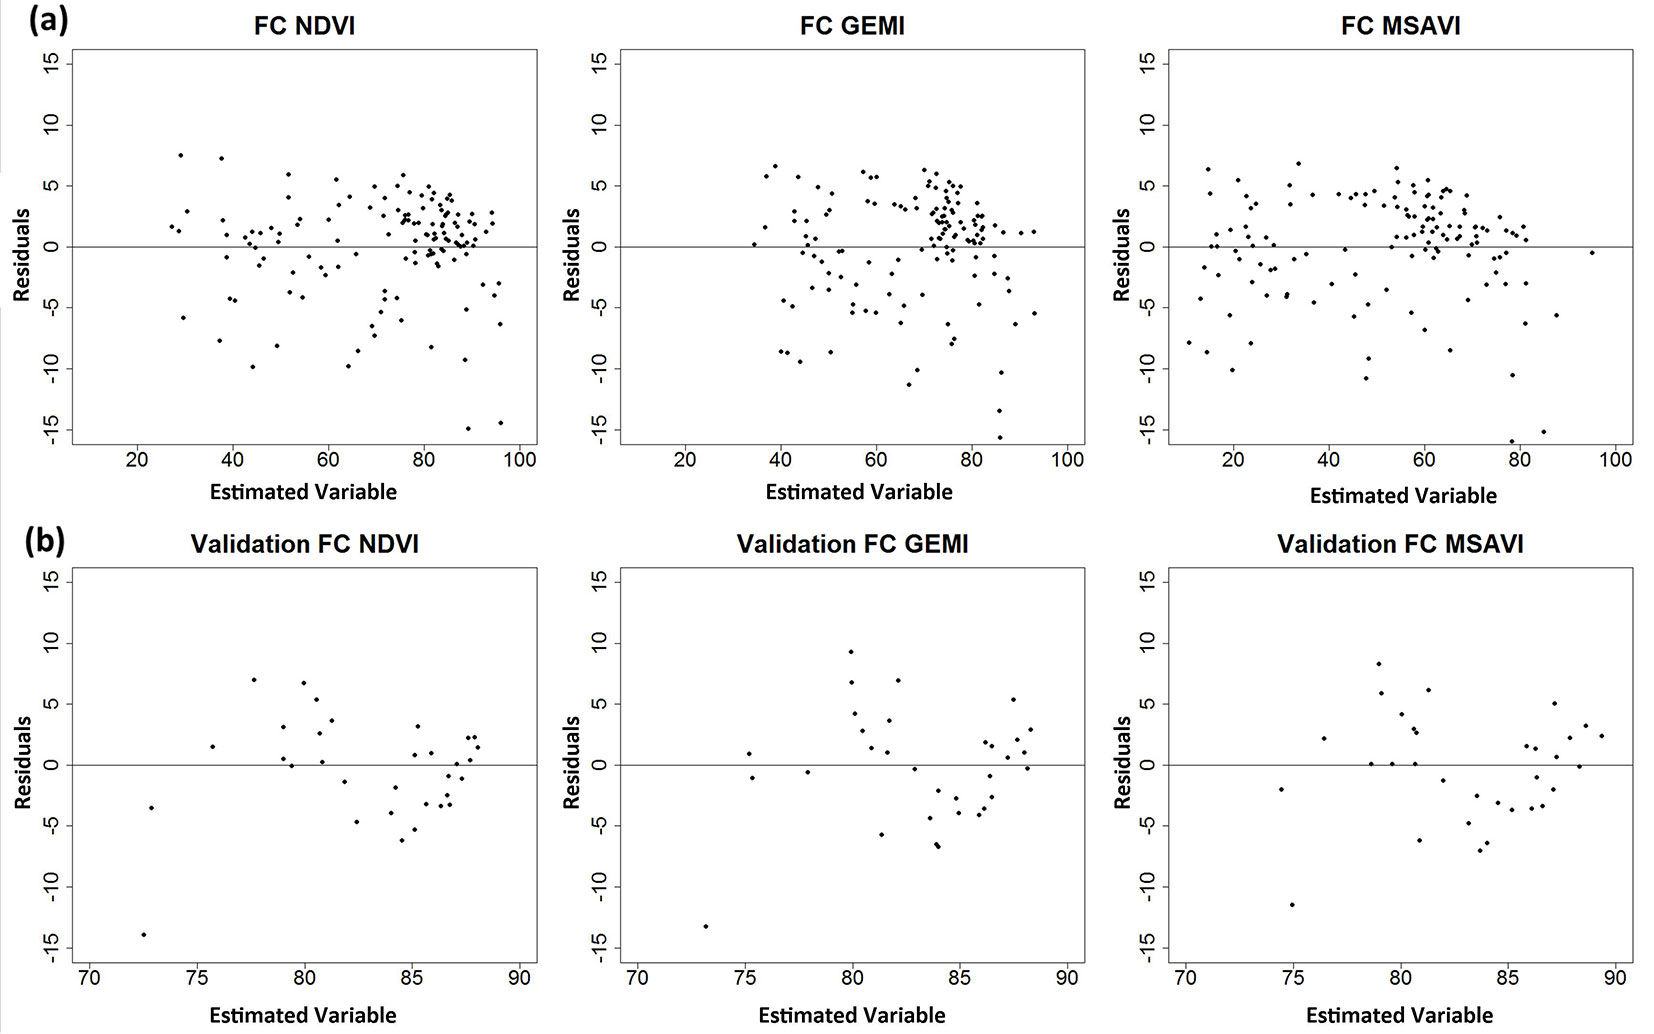
The simple linear regression analysis showed the best relationship between fractional coverage derived from NDVI and gap fraction measured using hemispherical photos. Fig. 4a shows the residuals, and Tab. 2 shows further statistical results for the adjusted and validated models of each vegetation index.
Fig. 4 - Residual dispersion of adjusted (a) and validated (b) models for estimation of fractional canopy coverage, retrieved from NDVI, GEMI , and MSAVI.
Tab. 2 - Statistics of adjusted and validated Fractional Coverage models. (β0): Regression constant; (β1): coefficient for the independent variable; (R²): adjusted coefficient of determination; (Syx): standard error of the estimate in units of the estimated variable and in %; (ryx): correlation between observed and estimated values.
| Model | β 0 |
β 1 |
R² | Syx (adj) |
Syx (%) (adj) |
ryx (adj) |
Syx (val) |
Syx (%) (val) |
ryx (val) |
|---|---|---|---|---|---|---|---|---|---|
| FC NDVI | 64.82 | 0.25 | 0.56 | 4.04 | 5.68 | 0.75 | 5.38 | 6.47 | 0.71 |
| FC GEMI | 63.12 | 0.29 | 0.48 | 4.41 | 6.52 | 0.69 | 5.57 | 6.74 | 0.68 |
| FC MSAVI | 72.25 | 0.21 | 0.51 | 4.31 | 8.37 | 0.71 | 5.55 | 6.72 | 0.68 |
NDVI’s least residual dispersion between the estimated and observed values, R² value, absolute and relative standard errors, and correlation coefficient between the observed and estimated values confirmed this index as the most accurate of the three tested. As a whole, the NDVI model outperformed to estimate forest fractional cover when compared to MSAVI and GEMI.
Complementarily, the validation analysis confirmed that NDVI was the best index as input of a linear mixing model to estimate canopy openness. Fig. 4b shows the residual dispersion based on the 33 randomly selected field observations from the original database. Tab. 2 shows the lower absolute and relative standard errors for the NDVI and the highest correlation between the estimated and observed values from this index as compared with the MSAVI and GEMI.
Based on these overall results, the NDVI was selected as the most accurate vegetation index to estimate canopy openness for our study sites.
Assessment of selective logging impacts using fractional coverage
The existing gradient among different type of selective logging environments was assessed by applying a multiple linear regression model using the fractional forest coverage estimated from the NDVI as the dependent variable. The statistical results obtained from our regression model were: R² = 0.58; standard error of the estimate in units of the estimated variable = 11.55; standard error of the estimate in percentage = 16.30; correlation between observed and estimated values = 0.77.
Forest cover was estimated as percentage values and our results are very explicit regarding the impact (estimated losses of canopy coverage) of selective logging on the forest. At a 95% confidence level, the contribution of log decks and primary roads in the decrease of forest canopy cover were significant, while the effect of secondary roads, tree fall gaps and skid trails were not (Tab. 3). The estimated coefficients for the harvested environments were: -33.2 for log decks; -20.6 for primary roads; -3.2 for secondary roads; -6.2 for tree fall gaps and -0.2 for skid trails.
Tab. 3 - Coefficients of multiple regression model for the fractional forest cover derived from the NDVI.
| Parameter | Estimate | Std. error | t value | p-value |
|---|---|---|---|---|
| Intercept | 83.9 | 2.2 | 38.4 | 0.00 |
| Log decks | -33.2 | 2.8 | -11.9 | 0.00 |
| Primary roads | -20.6 | 3.4 | -6.1 | 0.00 |
| Secondary roads | -3.2 | 2.9 | -1.1 | 0.27 |
| Tree fall gaps | -6.2 | 3.5 | -1.8 | 0.07 |
| Skid trails | -0.2 | 3.5 | -0.0 | 0.96 |
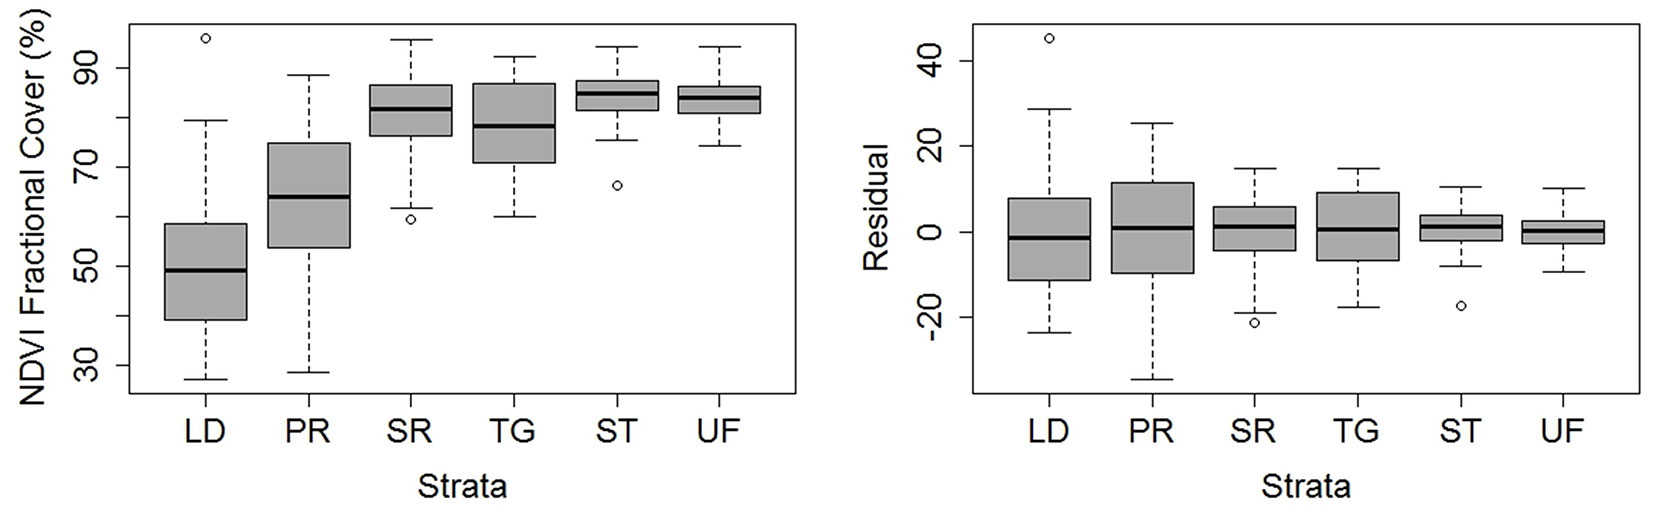
The multiple regression model showed a coefficient of determination of 0.58, attributed to the high variation present in the data. The standard error of the estimate (percentage) was approximately 16%. The forest canopy environments that sustained the most damage (i.e., log decks and primary roads) had the largest contribution to the observed variation (Fig. 5).
Fig. 5 - Distribution of fractional coverage derived from NDVI (left) and residual distribution (right) per each selective logging activity. (LD): log decks, (PR): primary roads, (SR): secondary roads, (TG): tree fall gaps, (ST): skid trails, (UF): undisturbed forests.
Discussion
Detection of selective logging impacts with optical satellite imagery
The NDVI index showed the best performance to estimate forest canopy cover compared to the MSAVI and GEMI. Despite the initial expectation that correcting the atmosphere and soil effects would benefit the performances of both GEMI and MSAVI, our results did not confirm this hypothesis. The essence of the mapped targets may partially explain these results. Roads, log decks and tree fall gaps opened during logging activities reveal small portions of bare soil beneath the dense forest canopy. It is likely that, in our case study, the soil signal coming from these features improved the performance of NDVI.
Selective logging activities cause different degrees of canopy openness ([14]). As reported by Pinagé et al. ([25]), log decks and primary roads showed the highest degree of canopy openness as they involve forest clear cutting and removal. Indeed, log decks and primary roads provide the main evidence of selective logging occurrence in optical satellite imagery.
Further selective logging activities cause less canopy damage, such as tree fall gaps, secondary roads and skid trails, as most of their impact occurs at the ground level. As a result of those intrinsic characteristics and the adoption of reduced impact logging techniques in Brazilian forest concessions, these activities caused cryptic forest degradation that could not be properly detected by our remote sensing approach. Optical remote sensing can detect selective logging based on contextual elements (network of roads and log decks and associated canopy damage), but it has limited capacity to distinguish the structural changes that occur below the canopy ([6]). Therefore, we could not reject the null hypothesis for tree fall gaps, secondary roads and skid trails at a 95% confidence level, which indicated that their impacts are not significantly affecting forest canopy, even when using the high spatial resolution RapidEye imagery.
The adjusted regression model used for selecting a vegetation index for deriving forest cover indicated that 56% of the variation in fractional canopy cover estimated with field data can be explained by variations in the fractional forest cover estimated from the NDVI. However, the coefficient of determination needs to be evaluated with great caution and whenever possible, along with other criteria, as recommended by Gujarati & Porter ([9]). It is also important to emphasize that the calculated standard error of the estimate was 5.68%. The model comprises only the variation related to selective logging activities, and other sources of variation in forest cover, including natural causes (i.e., natural canopy gaps, different forest types) were not accounted for.
The relationship between fractional forest cover estimated with field data and that obtained with remotely sensed data is not linear. With higher canopy openness, the difference between the two data sources is quite large, mainly because of the wide angle of the fisheye lens that shows vegetation pixels at the image edges even in open areas. Satellite images do not have this constraint, especially those with higher spatial resolution, which results in a reduction in the spectral mixture in the pixels.
We minimized potential autocorrelation among samples by adapting our sampling scheme. We accepted, however, some degree of spatial autocorrelation (Global Moran’s I = 0.1639, p = 0.007, inverse distance parameter) for the NDVI fractional coverage estimated at our study site, by assuming that spatial distribution of impacts from selective logging activities is not homogeneous within a logged forest.
Although a buffer zone surrounding the georeferenced field points was used to reduce uncertainties, we acknowledge that the resolution of the remote sensing data is coarser than the GPS locational accuracy. The accuracy of field data has been previously reported as negatively influencing predictions of forest attributes ([18]). However, Zald et al. ([40]) reported that improved GPS plot locations had little influence on the accuracy of predictive maps that link remote sensing and field data in their study. These authors affirmed that factors other than accuracy of field data in relation to the spatial resolution of explanatory data are more relevant in determining the overall accuracy, and that standard plot locations are sufficient for large-landscape mapping.
Applied issues for selective logging monitoring
The intensity of impacts caused by selective logging in tropical forests is usually related to the adopted harvesting techniques and intensities, with different levels of ground and canopy structural damage, as well as the subsequent losses of biomass and the forest recovery time ([2], [14]). Those impacts affect unequally forest biodiversity and other components of a forest, such as water availability, micro-climate, and carbon pools.
In this study, we estimated the specific contribution of logging operations to damages occurring to the forest structure. Our results showed that log decks and primary roads were responsible for the greatest impacts on forest canopy. Based on this result, we emphasize that an appropriate forest planning is required before the beginning of selective logging operations to minimize the impacts caused by those forest activities. Additional care should be taken during the implementation of forest management plans (secondary roads construction, tree felling and skidding).
Recent studies ([33], [5]) indicate that the mortality of large trees injured during logging activities significantly contributes to the annual losses of aboveground biomass. These authors also observed that higher biomass reduction occurs mostly in the initial years after logging operations. The mitigation of logging damages is extremely important to increase post-logging biomass because large trees play an important role in carbon dynamics and overall carbon stocks. Therefore, appropriate monitoring of the forest management would improve the role played by conservation and sustainable forestry, and it would ultimately enhance forest carbon stocks in REDD+ initiatives.
Despite the fact that our findings are derived from a single case study in the Western Brazilian Amazon, we believe that our results can be extrapolated to other tropical ecosystems that are currently experiencing selective logging activities. This assertion is supported by the accuracy of the techniques we used to assess canopy cover variations in tropical forests under timber exploitation. Nonetheless, we recommend additional research to be conducted for the improvement of the methods used to quantify selective logging impacts on tropical forest canopy. Potential areas of investigation could include the use of additional sensors and different forest types, and the assessment of alternative selective logging strategies to be used in public forest concessions and private projects.
Finally, our findings may contribute to improve the monitoring tools and policies of forest concessions conducted by governmental agencies and civil society organizations in tropical regions.
Acknowledgements
The authors are grateful to the Brazilian Forest Service for providing access to the forest concession area and logistics support for the fieldwork, and to the National Institute for Space Research for financial support for the fieldwork and image acquisition.
ERP conceived the study, carried out field work and image processing, performed data analysis and wrote the paper; EATM conceived the study and wrote the paper; FAL performed data analysis; and MAP wrote the paper.
References
Gscholar
Online | Gscholar
Gscholar
Gscholar
Gscholar
Gscholar
Gscholar
CrossRef | Gscholar
Authors’ Info
Authors’ Affiliation
Eraldo Aparecido Trondoli Matricardi
Fabrício Assis Leal
University of Brasília, Forestry Departament, Campus Universitário Darcy Ribeiro, 70910-900, Brasília, DF (Brazil)
Universidade Estadual do Norte Fluminense, Laboratório de Estudos do Espaço Antrópico (LEEA), Av. Alberto Lamego 2000, 28013, Campos dos Goytacazes, RJ (Brazil)
Corresponding author
Paper Info
Citation
Pinagé ER, Matricardi EAT, Leal FA, Pedlowski MA (2016). Estimates of selective logging impacts in tropical forest canopy cover using RapidEye imagery and field data. iForest 9: 461-468. - doi: 10.3832/ifor1534-008
Academic Editor
Matteo Garbarino
Paper history
Received: Dec 16, 2014
Accepted: Sep 19, 2015
First online: Jan 11, 2016
Publication Date: Jun 01, 2016
Publication Time: 3.80 months
Copyright Information
© SISEF - The Italian Society of Silviculture and Forest Ecology 2016
Open Access
This article is distributed under the terms of the Creative Commons Attribution-Non Commercial 4.0 International (https://creativecommons.org/licenses/by-nc/4.0/), which permits unrestricted use, distribution, and reproduction in any medium, provided you give appropriate credit to the original author(s) and the source, provide a link to the Creative Commons license, and indicate if changes were made.

Web Metrics
Breakdown by View Type
Article Usage
Total Article Views: 55153
(from publication date up to now)
Breakdown by View Type
HTML Page Views: 45376
Abstract Page Views: 3916
PDF Downloads: 4391
Citation/Reference Downloads: 30
XML Downloads: 1440
Web Metrics
Days since publication: 3836
Overall contacts: 55153
Avg. contacts per week: 100.64
Article Citations
Article citations are based on data periodically collected from the Clarivate Web of Science web site
(last update: Mar 2025)
Total number of cites (since 2016): 8
Average cites per year: 0.80
Publication Metrics
by Dimensions ©
Articles citing this article
List of the papers citing this article based on CrossRef Cited-by.
Related Contents
iForest Similar Articles
Review Papers
Accuracy of determining specific parameters of the urban forest using remote sensing
vol. 12, pp. 498-510 (online: 02 December 2019)
Review Papers
Remote sensing support for post fire forest management
vol. 1, pp. 6-12 (online: 28 February 2008)
Review Papers
Remote sensing of selective logging in tropical forests: current state and future directions
vol. 13, pp. 286-300 (online: 10 July 2020)
Review Papers
Remote sensing-supported vegetation parameters for regional climate models: a brief review
vol. 3, pp. 98-101 (online: 15 July 2010)
Research Articles
Identification and characterization of gaps and roads in the Amazon rainforest with LiDAR data
vol. 17, pp. 229-235 (online: 03 August 2024)
Research Articles
Mapping the vegetation and spatial dynamics of Sinharaja tropical rain forest incorporating NASA’s GEDI spaceborne LiDAR data and multispectral satellite images
vol. 18, pp. 45-53 (online: 01 April 2025)
Technical Reports
Detecting tree water deficit by very low altitude remote sensing
vol. 10, pp. 215-219 (online: 11 February 2017)
Research Articles
Estimation of forest cover change using Sentinel-2 multi-spectral imagery in Georgia (the Caucasus)
vol. 13, pp. 329-335 (online: 07 August 2020)
Research Articles
Estimating biomass and carbon sequestration of plantations around industrial areas using very high resolution stereo satellite imagery
vol. 12, pp. 533-541 (online: 12 December 2019)
Technical Reports
Remote sensing of american maple in alluvial forests: a case study in an island complex of the Loire valley (France)
vol. 13, pp. 409-416 (online: 16 September 2020)
iForest Database Search
Search By Author
Search By Keyword
Google Scholar Search
Citing Articles
Search By Author
Search By Keywords
PubMed Search
Search By Author
Search By Keyword


