Estimating biomass and carbon sequestration of plantations around industrial areas using very high resolution stereo satellite imagery
iForest - Biogeosciences and Forestry, Volume 12, Issue 6, Pages 533-541 (2019)
doi: https://doi.org/10.3832/ifor3155-012
Published: Dec 12, 2019 - Copyright © 2019 SISEF
Research Articles
Abstract
Plantations established in highly-pollutant industrial areas have a crucial role to absorb greenhouse gases, particularly CO2. A thorough monitoring of their aboveground biomass and carbon balance is essential to ensure their beneficial effects. This can be operationally supported by using a combination of field and multispectral stereo remote sensing data to provide surface height information with high resolution and wide coverage. We estimated the fresh and dry aboveground biomass and the carbon sequestration from pairs of Pléiades satellite imagery of 25-year-old monoculture plantations of Pinus eldarica Medw., Cupressus arizonica Greene, Morus alba L. and Robinia pseudoacacia L., around the Mobarakeh Steel Complex near the megacity Isfahan. This complex is the largest-scale of its kind in semi-arid Iran. Tree heights were derived from a Canopy height model (CHM) at plantation management unit level. Parsimonious regression models were developed, and the accuracy was assessed by the coefficient of determination, bias and root mean square errors (RMSEs) at plot level. This resulted in R2 of total biomass, dry biomass, carbon sequestration, tree height and tree count of 0.90, 0.90, 0.91, 0.89, and 0.88, respectively. Moreover, mixed bias (with lowest value of -0.12 m for tree height) and NRMSE% (with lowest value of 5.93 % for tree carbon sequestration) values were obtained. The results demonstrated that pairs of stereo imageries can be effectively used for predicting forest biomass and carbon sequestration across semi-arid plantations, hence enabling a continuous monitoring of vegetation established around pollutant industrial areas.
Keywords
Carbon Sequestration, Biomass, Plantation, Industrial Areas, VHR Stereo Images
Introduction
Air, soil and water pollution often increases at regional scale as a result of expansion of industrial areas ([26]). To reduce the level of pollution, different methods are currently used; some of these methods go beyond the sole removal of pollutant factors. For example, a feasible way to mitigate pollution is to establish and maintain plantations within and around industrial areas ([2]). Due to their ability of reducing greenhouse gas emissions to the atmosphere, plantations have been given particular attention to in multilateral climate change treaties such as the Kyoto Protocol. They are often considered “carbon sinks” and many studies emphasized their vital roles to provide ecosystem services and absorb carbon ([14]). Furthermore, tree planting using fast growing species, as a part of strategic plans of governments to reduce atmosphere carbon dioxide, is in line with the international treaties on climate change ([48]).
Sustainable planning for industrial plantations requires accurate, continuous, and high-quality information from current and future status at the level of plantation stands ([42]). Therefore, accurate and up-to-date information on quantitative and qualitative status of plantations can be useful in their future planning and management ([6]). Typically, quantitative inventory data such as diameter at breast height (DBH), height, basal area, volume, aboveground biomass and carbon sequestration are precisely collected (and partially modelled) through field surveys. Furthermore, numerous research works on estimating biomass and carbon content on plantation level were entirely based on destructive ground-based surveys ([16]). However, such field data collection entails a great deal of time and cost ([18]). Thus, it is necessary to use alternative and cost-effective methods that simultaneously maintain high accuracy and practical applications ([45]).
Alternative solutions are commonly those involving remote sensing data from active (LiDAR, RADAR) or multi angular (stereo) very high-resolution passive remote sensing combined with ground-based data. Use of very high-resolution, stereo satellite imageries (VHR) for forest monitoring is associated with numerous advantages such as wide spatial coverage, reproducibility of the analysis, and the ability to provide three-dimensional information on trees and stand heights. In addition, these imageries allow to increase the accuracy of biomass and carbon estimations when combined with field data and statistical prediction methods ([10]). Stereo imagery consists of a pair of optical images with two different views of the same region on the ground acquired in a short time span. These images provide a 3D perspective that enables extracting digital surface models (DSM - [19]). In the recent decade, their comparatively lower costs and higher coverage have been appealing for conducting a number of studies using stereo imagery to estimate quantitative forest attributes such as DBH, height, basal area, volume, aboveground biomass and carbon sequestration ([29], [21], [47], [19], [9]).
In addition, tree crown detection is an important field of study in remote sensing assisted forest analysis, since it provides a means for multiple related tasks such as vegetation distribution mapping, vegetation density estimation, vegetation change monitoring and species classification ([24]). The use of state-of-the-art data such as high-resolution stereo imagery and development of efficient algorithms can be adapted to detect individual trees and estimate their attributes. Within the existing methods, template matching algorithm is an essential method to delineate and detect trees. This algorithm was applied to different layers derived from point cloud data and high resolution imagery ([20]). The applied algorithm is founded on the “template matching” approach, with the template being based on a geometrical optical model consisting of parameters such as illumination angles, maximum and ambient radiance, and tree size specifications. In addition, the applied approach includes a search-by-rank based on similarity values, where marks are distributed in a way to preserve the spatial distribution of trees ([22]). The results of a recent study demonstrated that this algorithm can detect orchard tree crowns with correlation coefficient reaching 0.88 ([24])
This study uses VHR stereo-imagery to estimate a range of forest attributes including aboveground biomass and carbon sequestration across a representative plantation site located close to the Mobarakeh Steel Complex. This area embraces the largest plantation area among the entire industrial centers of Iran ([40]) and is located close to the historical city of Isfahan, Iran’s second largest and third most populated city and home to 5 monuments listed as UNESCO Cultural Heritages. However, Isfahan is currently facing a continuous thread raised by problems such as drought, air and water pollution that deeply affect its landscape, touristic attractions and livelihoods ([34]). Therefore, tree plantations play an important role to mitigate pollutions originating from the Steel complex and threatening this regionally (and nationally) important industrial and cultural region. Due to the high significance of tree height to build allometric equations with biomass for the majority of tree species, we parametrized species-specific allometric equations using the tree heights extracted from photogrammetric DSM, followed by their further use for estimating carbon sequestration. The results of the study are expected to provide innovative and thorough insights into monitoring plantation projects around large-scale industrial areas in semi-arid zones.
Materials and methods
Study area
The test site is located in the plantation forests around of the Mobarakeh Steel Complex (32° 13′ 8″ to 32° 17′ 41″ N and 51° 23′ 19″ to 51° 27′ 5″ E) in south-west of Isfahan, central Iran (Fig. 1). Besides its outstanding cultural values, Isfahan embraces two of the largest industrial areas of Iran, including the Iron Melting and Mobarakeh Steel Complexes. In order to decrease pollution of industrial areas, establishing tree plantations in the vicinity of these areas has been made imperative by the national environmental regulations ([40]).
Fig. 1 - Geographical location of the study area shown on the VHR stereo image-based DSM and overlaid with the sample plots in the Mobarakeh Steel Complex (C), Isfahan province, Iran (B). Source of world map (A): ⇒ https://www.wikipedia.com/.
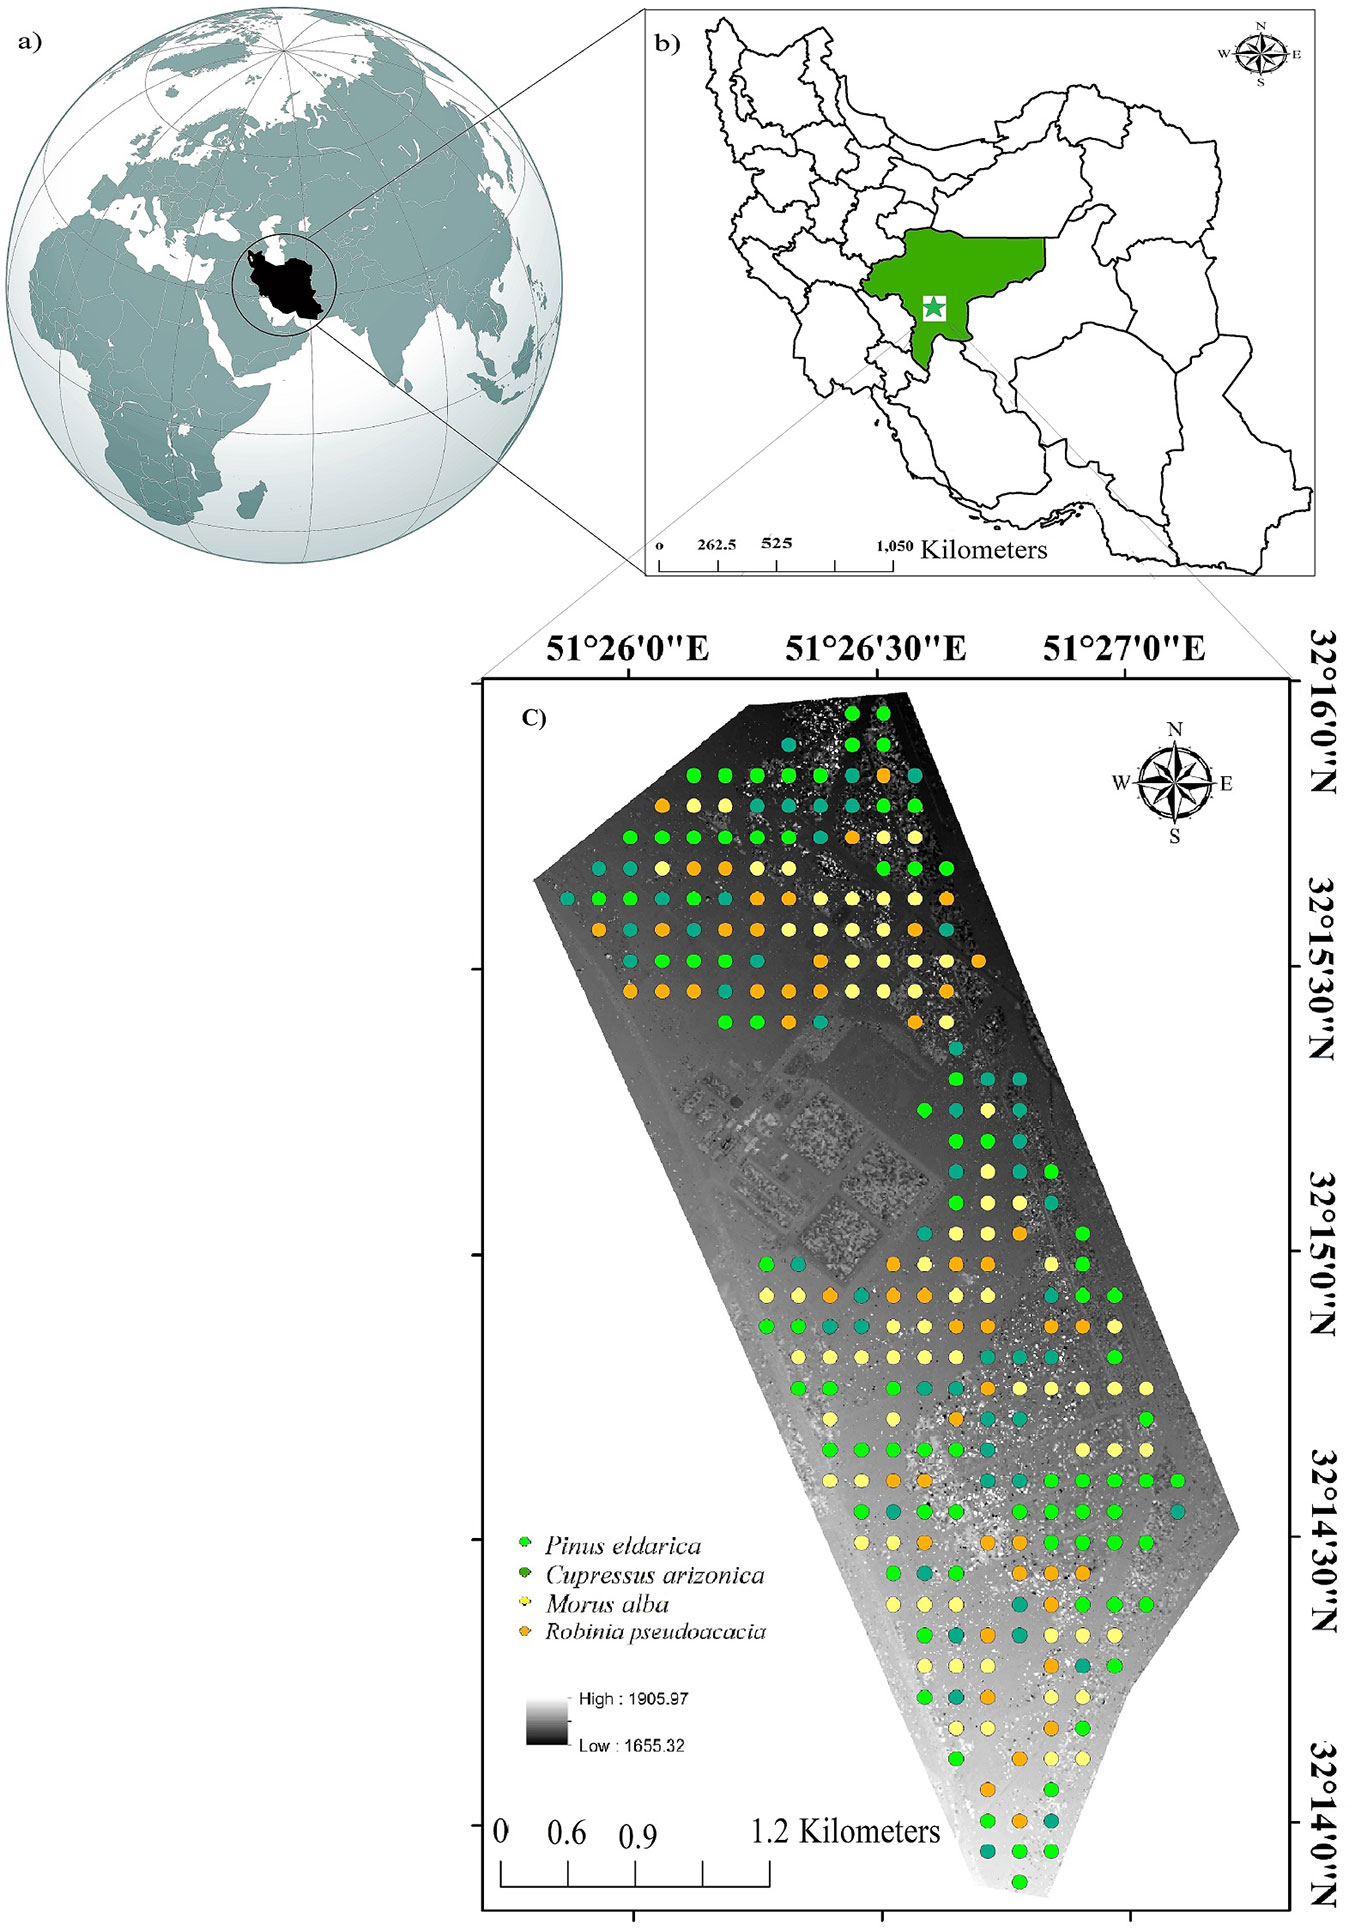
The study site is located at an elevation of 1960 m a.s.l. and has an average annual precipitation of 150 mm with a dry and cold climate. It has a mean growth period of 155 days and a 30-year annual mean temperature of 15 °C. This study size encompasses 1500 hectares of 25-year-old monoculture plantations that contain coniferous and deciduous tree species such as Eldar pine (Pinus eldarica Medw.), Arizona cypress (Cupressus arizonica Greene), Mulberry (Morus alba L.), and Black locust (Robinia pseudoacacia L.) established in pure and even-aged stands ([2])
Ground sampling
To enable modeling the aboveground biomass and carbon, ground data were collected using a systematic 100 × 100 m sampling grid. Quantitative characteristics (species, diameter at breast height - DBH, height, crown diameter and crown height) of all trees were measured and recorded in 281 circular samples of 100 m2 area each. The height and crown height of the trees were measured with a TruPulse® 200 Laser Rangefinder (Laser Technology, Inc., Centennial, CO, USA) with ± 0.2 m accuracy (Tab. 1). The crown diameters were measured by the Leica DISTO™ D8 laser measure (Leica Geosystems, St. Gallen, Switzerland). In addition, positions of plot centers were recorded by the Global Positioning System (GPS).
Tab. 1 - Descriptive statistics for tree height from field measurement in the analyzed plantations. (SD) standard deviation; (Var): variance.
| Species | N | Mean (m) |
Min (m) |
Max (m) |
SD (m) |
Var (m) |
|---|---|---|---|---|---|---|
| Pinus eldarica | 85 | 10.1566 | 7.14 | 11.93 | 1.04586 | 1.094 |
| Cupressus arizonica | 77 | 6.2204 | 3.20 | 9.38 | 1.19472 | 1.427 |
| Morus alba | 70 | 5.4370 | 2.70 | 9.98 | 1.15053 | 1.324 |
| Robinia pseudoacacia | 49 | 4.3692 | 2.92 | 5.64 | 0.58650 | 0.344 |
| Total | 281 | 6.8931 | 2.70 | 11.93 | 2.47046 | 6.103 |
Tree biomass and carbon content measurement
Measuring the reference species-specific aboveground biomass followed a destructive sampling methodology presented by Bakhtiarvand Bakhtiari ([2]) and Sohrabi et al. ([40]) , which led to the final values that were applied in our study. In the above-mentioned approach, 12 plots were randomly selected in each species/stand (48 plots in total). Then the standing tree DBH, total height and canopy width were measured for each species, except for M. alba and R. pseudoacacia, for which no DBH was feasible to be measured due to their multi-stem structure under the breast height. The trees were classified into 5 classes based on their DBH and total height ranges. In each class, 3 trees were randomly selected and cut down (15 individuals for each species). To derive the aboveground biomass, these trees were separated into stem, stem bark, branch, twig (diameter at the base <1 cm) and foliage, and total fresh weight of each part was measured in situ. From each part of trees, the entire tissue samples were collected and subsamples were taken by chainsaw and branch clipper to measure water content. All tissues were dried at 80 °C to constant weight. Finally, the percentages of carbon in all samples were measured by using the combustion method ([3], [40]).
The aboveground biomass, dry biomass and carbon content for P. eldarica, C. arizonica, M. alba, and R. pseudoacacia were calculated using eqn. 1, eqn. 3 and eqn. 5 ([2]) across the entire plantation as follows (eqn. 1):
where Bt is the total aboveground biomass, Bs is the stem, Bsb is the stem bark, Bb is the branch, and Bt is the twig, Bf is the foliage biomass. All parts of trees were separated, followed by in situ measurement of total fresh weight of each part.
In the next step, samples of different tree parts were taken to the laboratory to determine the dry weight and carbon content. After determining the dry weight of each sample, the dry weight of each part (WDc) was calculated as (eqn. 2):
where WFc is the wet weight of each part, WDs is the dry weight of each sample, WFs is the wet weight of each sample.
The total dry weight (DWt) was calculated as (eqn. 3):
where DWs is the dry stem weight, DWsb is the dry stem bark weight, DWb is the dry branch weight, DWl is the dry twig weight, DWf is the dry foliage weight. All tissue samples were collected from each part of the trees, and all tissues were dried to constant weight at 80 °C.
The carbon percentage of the dry matter in each sample was calculated using the combustion method and weighing the residual ash. After determining the percentage of carbon and dry weight of each part, the carbon content from each part of the trees (Wc) was calculated as (eqn. 4):
where Wdc is the dry weight of each part, Cc% is the percentage of carbon of dry matter in each part. The total dry weight was calculated as follows (eqn. 5):
where Ct is the total carbon content, Cs is the carbon stem, Csb is the carbon stem bark, Cb is the carbon branch, Ct is the carbon twig, Cf is the carbon foliage. The percentage of carbon in all samples was determined by the combustion method ([3], [40]).
The relationships between the independent variables and aboveground biomass, dry biomass and carbon content values were estimated using regression models. In general, higher correlations were obtained using the power function compared with other models ([27]). Therefore, regressions based on power function were used to build the allometric equations of biomass for the different tree species ([43]). The independent variable used for P. eldarica was DBH, while total tree height was used for C. arizonica, M. alba. and R. pseudoacacia. Then, we applied the derived allometric equations to estimate biomass, dry biomass and carbon content of trees.
Image processing
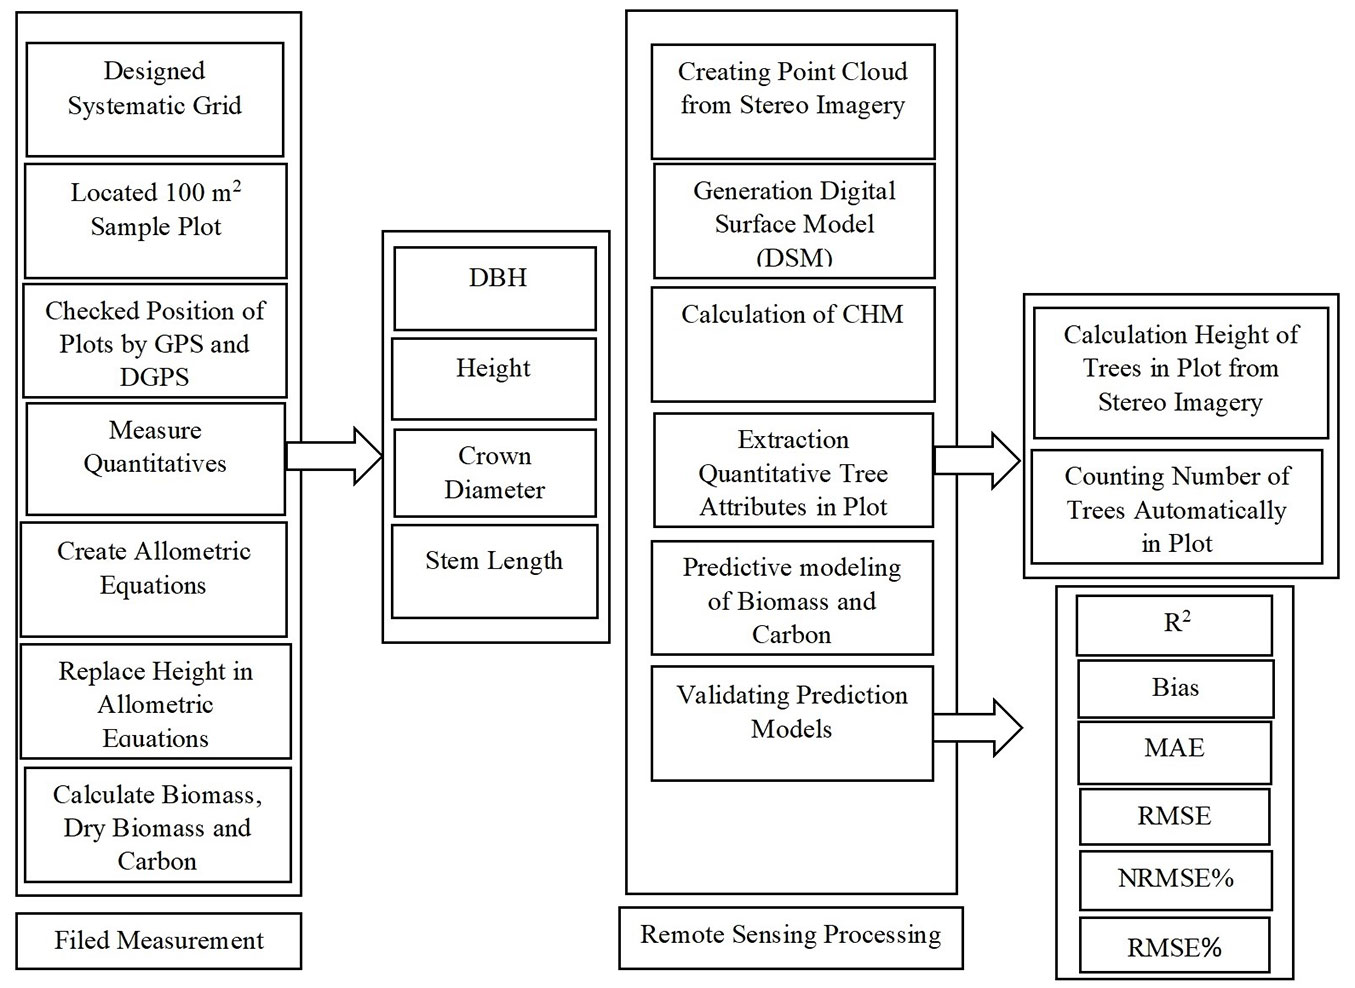
We applied a pair of very high spatial resolution stereo images from the Pléiades sensor due to their previously stated potentials to estimate tree biomass and carbon ([21], [10]). The data was initially checked for atmospheric, radiometric, and geometric distortions to ensure that the data were error-free. The following tasks were accomplished: (i) creation of a point cloud from stereo pairs of Pléiades imagery; (ii) generation of digital surface models (DSM); (iii) calculation of canopy height model (CHM); (iv) plot-level extraction of quantitative tree attributes (height and count) on the stereo imagery; (v) predictive modeling of plot-based plantation biomass, dry biomass and carbon sequestration; (vi) validating prediction models by means of R2, bias, root mean square error (RMSE), the normalized root mean square error (NRMSE), relative RMSE and NRMSE.
The CHM was calculated based on two Pléiades -1B scenes, acquired on 18th of June 2016 (Tab. 2). In this process, point clouds were first generated from the stereo imagery using the eATE algorithm in ERDAS IMAGINE 2014. Initially, all urban areas such as buildings and artificial structures were masked out from the imagery, since corridors of tall buildings prevent the plantation to be properly modelled. In the next step, we added sufficient number of well distributed tie points on the surface of the pair images. Tie points in two or more images were measured in order to ensure the relative orientation between the two images of the same stereo pair that overlaps along or across the flight direction ([30]). The aim of using tie points was to join the images in a project so that they were correctly positioned each other. We noticed that the general rule for tie point measurement was to select points on well-defined features on the surface of the study area, thus the trees with large crowns in the plantation or the trees planted next to the roads were selected as tie points in the stereo imagery. In addition, care was taken to homogeneously distribute the tie points in the scenes. This process guarantees the relative orientation between images and increased the quality of DSM. Then a DSM with 1 m pixel size was derived following Khare et al. ([15]).
Tab. 2 - Specifications of the sensor used.
| Sensor | Pléiades |
|---|---|
| Acquisition date | 18-06-2016 |
| Spatial resolution | Pan. 50 cm, Multi. 200 cm |
| Spectral resolution | 4 bands (430-950nm) |
| Incidence angle | 24.61, 21.35 |
| Cloud cover | 0% |
In this study, the height of surface features was estimated using an algorithm for slope-based DTM implemented in the open-source SAGA. Surface features such as trees were removed as much as possible and the DTM was derived with a 1 m pixel size. Search radius (2 m) and terrain slope (5%) were adjusted to generate a DTM from the DSM. This algorithm classifies DSM’s cells into bare earth and object cells (ground and non-ground cells - [37]). It is based on the assumption that the steep slope in the terrain is unlikely to cause a large height difference between two nearby cells. If the distance between the two cells decreases, the probability that the higher cell could be a ground point also decreases. Thus, the feasible height difference between two cells is considered as a function of the distance between the cells. A cell is classified as terrain if there is no other cell within the kernel search radius so that the height difference between these cells is larger than the allowed maximum height difference at the distance between these cells ([44], [46]). DTM slope-based filter allows recognizing object such as trees and buildings according to input data of search radius and terrain slope. After several attempts, the best combination of values were adjusted due to the characteristics of the surface of our plantations (flat with gentle topography). Finally, DTM was subtracted from the DSM to obtain the height of trees.
By using the extracted tree heights in species-specific allometric equations, the aboveground biomass, dry biomass and amount of carbon sequestrations were estimated for each tree. It should be noted that in P. eldarica plantation the highest R2 was observed between biomass and diameter at breast height (DBH), thus its allometric equation was parametrized using DBH. This way, at the first step the linear regression between DBH and height (measured from field data) resulted in R2 = 0.85. In the second step, the tree heights derived from Pléiades -1B stereo imagery were located in this linear regression and resulted in calculating the DBH; Fig. S1 in Supplementary material shows the relation between DBH measured from field data and DBH derived from Pléiades -1B stereo imagery. Finally, these DBH values were replaced in allometric equations and the aboveground biomass, dry biomass and amount of carbon sequestrations were estimated for P. eldarica. For all other species/ plantations (C. arizonica, M. alba and R. pseudoacacia), the allometric equations were based on tree height. In addition, information on the number of trees per plot was necessary to aggregate biomass and carbon sequestration on plot level, thus a two-step process was followed to automatically count the number of trees. First, we delineated tree species using the shape of their crown, followed by marking the entire trees and their aggregation on plot level. Therefore, we selected 40 trees as samples and the sample correlation (r = 0.699) was calculated. We changed the samples to reach the highest sample correlation. Then samples were located in template matching algorithm, which can detect all trees based on samples. Template matching algorithm is one of the most popular algorithms to detect and delineate individual trees ([5]). It is an algorithm used for finding an object of a reference image that matches the samples ([4]). The best results for detection of individual trees, which are often (but not always) related to use of this algorithm in plantation and trees have distinct distances from each other ([17]). The value of each pixel in the samples and the reference images were extracted, after which the histogram of the samples and the target image were created. This algorithm initially compares this histogram to each other and uses measure of the similarity between the samples and the image histogram to estimate the probability of being a tree. It then places a mark for that tree that led to delineating all trees as points ([22]).
Finally, the points (trees) were exported to a shapefile, based on which the trees in each plot were counted. Biomass was calculated at plot level from stereo images using the following equation (eqn. 6):
where n is the number of trees in each plot (100 m2), W is the weight of biomass calculated from allometric equation for the individual trees.
Modeling
Considering the ability of the Pléiades -1B stereo imagery to calculate the height of trees with high precision, we used the heights extracted from stereo imageries to enable modeling of biomass, dry biomass and carbon content. Therefore, the average tree heights derived from Pléiades -1B stereo imagery were used to replace those measured on the ground in allometric equation. Therefore, the amount of aboveground biomass, dry biomass and carbon sequestrations were estimated for each tree and these amounts were calculated in the existing 100 m2 plots. Linear models were used to quantify relations between Pléiades -1B stereo imagery and field measurements for deriving aboveground biomass, dry biomass and carbon sequestration on plot level. We assessed the correlation between predicted and observed values by calculating R2 for each plantation and total in plot level ([33]). Performance measures included R2 for each model, Bias, Mean Absolute Error (MAE) and Root Mean Square Error (RMSE) for the final model. We calculated the normalized RMSE (NRMSE = RMSE / [emax - emin]) and relative RMSE to allow for a comparison between model results ([21]), where emax and emin represent the maximum and minimum observed biomass values, respectively. Fig. 2 illustrates the whole methodology followed in this study.
Fig. 2 - The steps carried out for biomass, dry biomass and carbon sequestration estimation by pairs of Pléiades -1B stereo imagery.
Results
The results of linear regression models for tree count (R2 = 0.88, RMSE% = 11.16) using the template matching algorithm are shown in Tab. 3. Tree count estimation for the 4 species were compared by R2 at the plots level. In general, P. eldarica and C. arizonica had higher R2 (0.90 and 0.91, respectively) than M. alba and R. pseudoacacia (R2 = 0.85).
Tab. 3 - Validation reults for the tree count estimation in plots.
| Species | R 2 | Adj-R2 | Bias (n ha-1) |
MAE (n ha-1) |
RMSE (n ha-1) |
NRMSE% | RMSE% |
|---|---|---|---|---|---|---|---|
| Pinus eldarica | 0.90 | 0.89 | 35.29 | 49.41 | 84.01 | 8.40 | 11.67 |
| Cupressus arizonica | 0.91 | 0.91 | 9.09 | 32.46 | 65.46 | 7.27 | 9.69 |
| Morus alba | 0.85 | 0.85 | -21.42 | 44.28 | 81.94 | 10.24 | 12.83 |
| Robinia pseudoacacia | 0.85 | 0.85 | -8.16 | 36.73 | 63.88 | 10.64 | 9.07 |
| Total | 0.88 | 0.88 | 19.92 | 41.28 | 75.45 | 6.85 | 11.16 |
The linear regression models showed a good performance in the total height estimation (R2 = 0.89, RMSE% = 12.45). As shown in Tab. 4, P. eldarica and C. arizonica showed higher R2 than M.alba and R. pseudoacacia. The RMSE% calculated for P. eldarica and C. arizonica, M.alba and R. pseudoacacia was 7.76, 15.45, 15.89 and 17.79, respectively (Tab. 4). The scatter plot (see Fig. S2 in Supplementary Material for Observed vs. predicted values for species-specific heights) suggests a slight overestimation for trees with lower heigh.
Tab. 4 - Validation of species-specific regression models. Results of the comparison between field measurement data (observed) and Pléiades -1B stereo imagery derived data (predicted) for height, aboveground biomass, dry biomass and carbon sequestration.
| Parameter | Species | R 2 | Adj-R2 | Bias (t ha-1) |
MAE (t ha-1) |
RMSE (t ha-1) |
NRMSE% | RMSE% |
|---|---|---|---|---|---|---|---|---|
| Height | Pinus eldarica | 0.7 | 0.7 | -0.19 | 0.57 | 0.79 | 12.57 | 7.76 |
| Cupressus arizonica | 0.7 | 0.7 | -0.2 | 0.75 | 0.96 | 14.71 | 15.45 | |
| Morus alba | 0.58 | 0.58 | -0.06 | 0.73 | 0.87 | 13.92 | 15.89 | |
| Robinia pseudoacacia | 0.47 | 0.47 | 0.06 | 0.63 | 0.8 | 18.11 | 17.79 | |
| Total | 0.89 | 0.89 | -0.12 | 0.67 | 0.86 | 8.51 | 12.45 | |
| Biomass | Pinus eldarica | 0.8 | 0.8 | 8.92 | 26.88 | 35.38 | 9.42 | 20.23 |
| Cupressus arizonica | 0.86 | 0.86 | 1.36 | 11.02 | 17.8 | 8.49 | 30.14 | |
| Morus alba | 0.76 | 0.76 | -2.01 | 15.89 | 22.97 | 8.08 | 49.5 | |
| Robinia pseudoacacia | 0.58 | 0.58 | -0.76 | 6.73 | 8.71 | 17.71 | 38.69 | |
| Total | 0.9 | 0.9 | 2.51 | 16.47 | 24.92 | 5.97 | 29.04 | |
| Dry Biomass | Pinus eldarica | 0.8 | 0.8 | 4.26 | 13.03 | 17.19 | 9.26 | 19.38 |
| Cupressus arizonica | 0.86 | 0.86 | 0.65 | 5.51 | 8.95 | 8.62 | 30.97 | |
| Morus alba | 0.76 | 0.76 | -1.13 | 8.99 | 12.97 | 8.06 | 49.16 | |
| Robinia pseudoacacia | 0.59 | 0.59 | -0.52 | 4.75 | 6.16 | 17.63 | 38.49 | |
| Total | 0.9 | 0.9 | 1.12 | 8.61 | 12.74 | 6.14 | 28.49 | |
| Carbon Sequestration | Pinus eldarica | 0.8 | 0.8 | 2.37 | 7.24 | 9.56 | 9.27 | 19.43 |
| Cupressus arizonica | 0.86 | 0.86 | 0.34 | 2.99 | 14.88 | 8.76 | 31.87 | |
| Morus alba | 0.76 | 0.76 | -0.56 | 4.42 | 6.38 | 8.08 | 49.47 | |
| Robinia pseudoacacia | 0.59 | 0.59 | -0.25 | 2.32 | 3 | 17.6 | 38.42 | |
| Total | 0.91 | 0.91 | 0.64 | 4.56 | 6.83 | 5.93 | 28.44 |
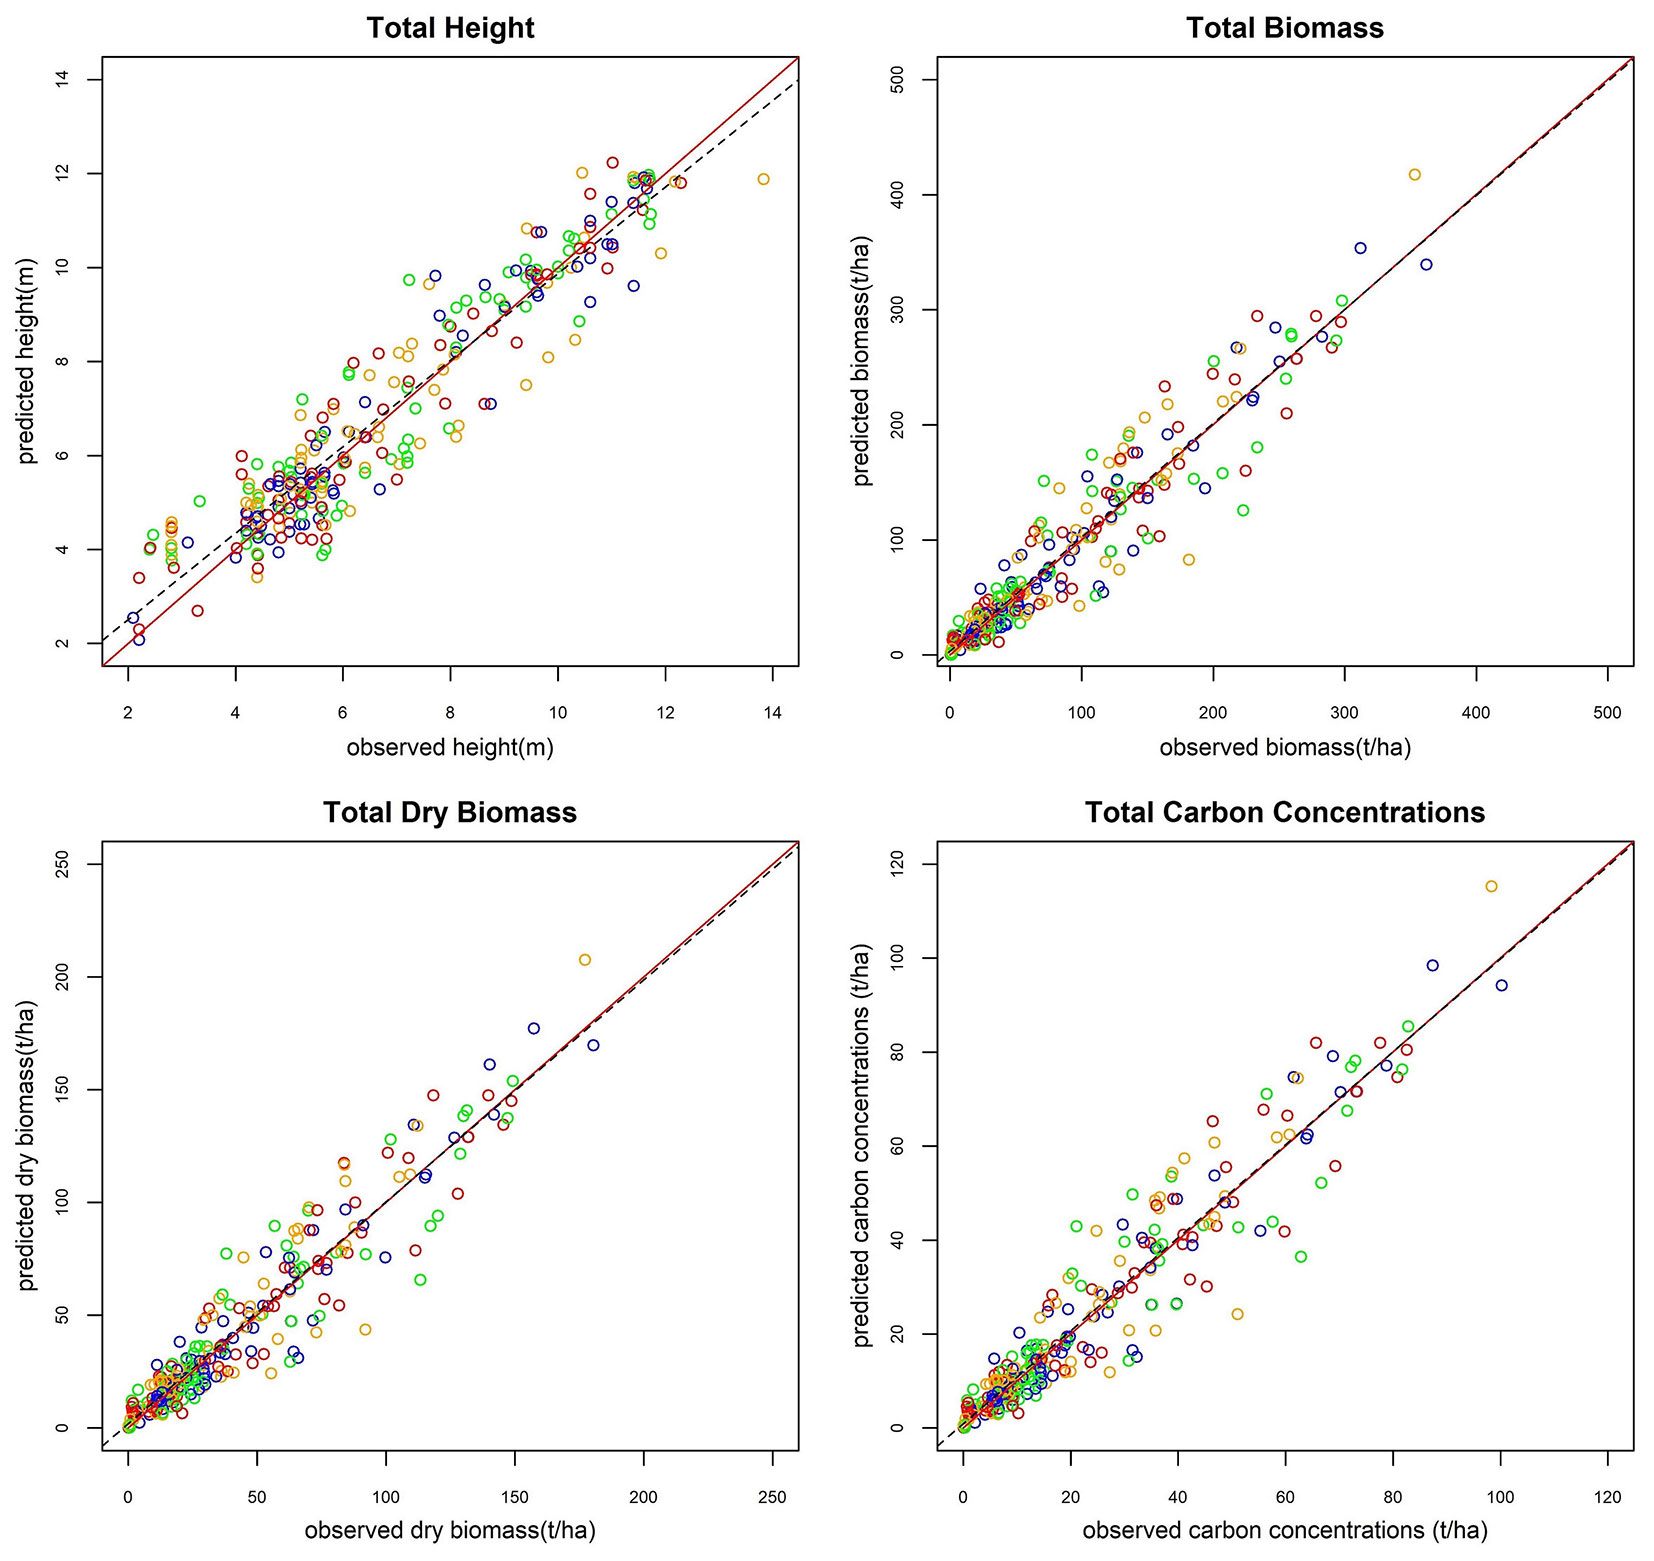
The model estimates for height, biomass, dry biomass and carbon content from stereo imagery are summarized in Tab. 4. The model result calculated for biomass, dry biomass and carbon content showed a R2 of 0.90, 0.90 and 0.91, respectively (Fig. 3). Also, the lowest errors (RMSE %) was observed for biomass, dry biomass and carbon content for two coniferous species, i.e., P. eldarica (20.23, 19.38 and 19.43, respectively) and C. arizonica (30.14, 30.97 and 31.87, respectively).
Fig. 3 - Regression models for total height, biomass, dry biomass and carbon sequestration. Observed (x-axis) vs. predicted (y-axis) values for the 4 species considered (represented by different point colors) are shown. (Orange circles): P. eldarica; (blue): C. arizonica; (green): M. alba; (red): R. pseudoacacia. Bold red line is the 1:1 line. Dashed black line is the fitted line.
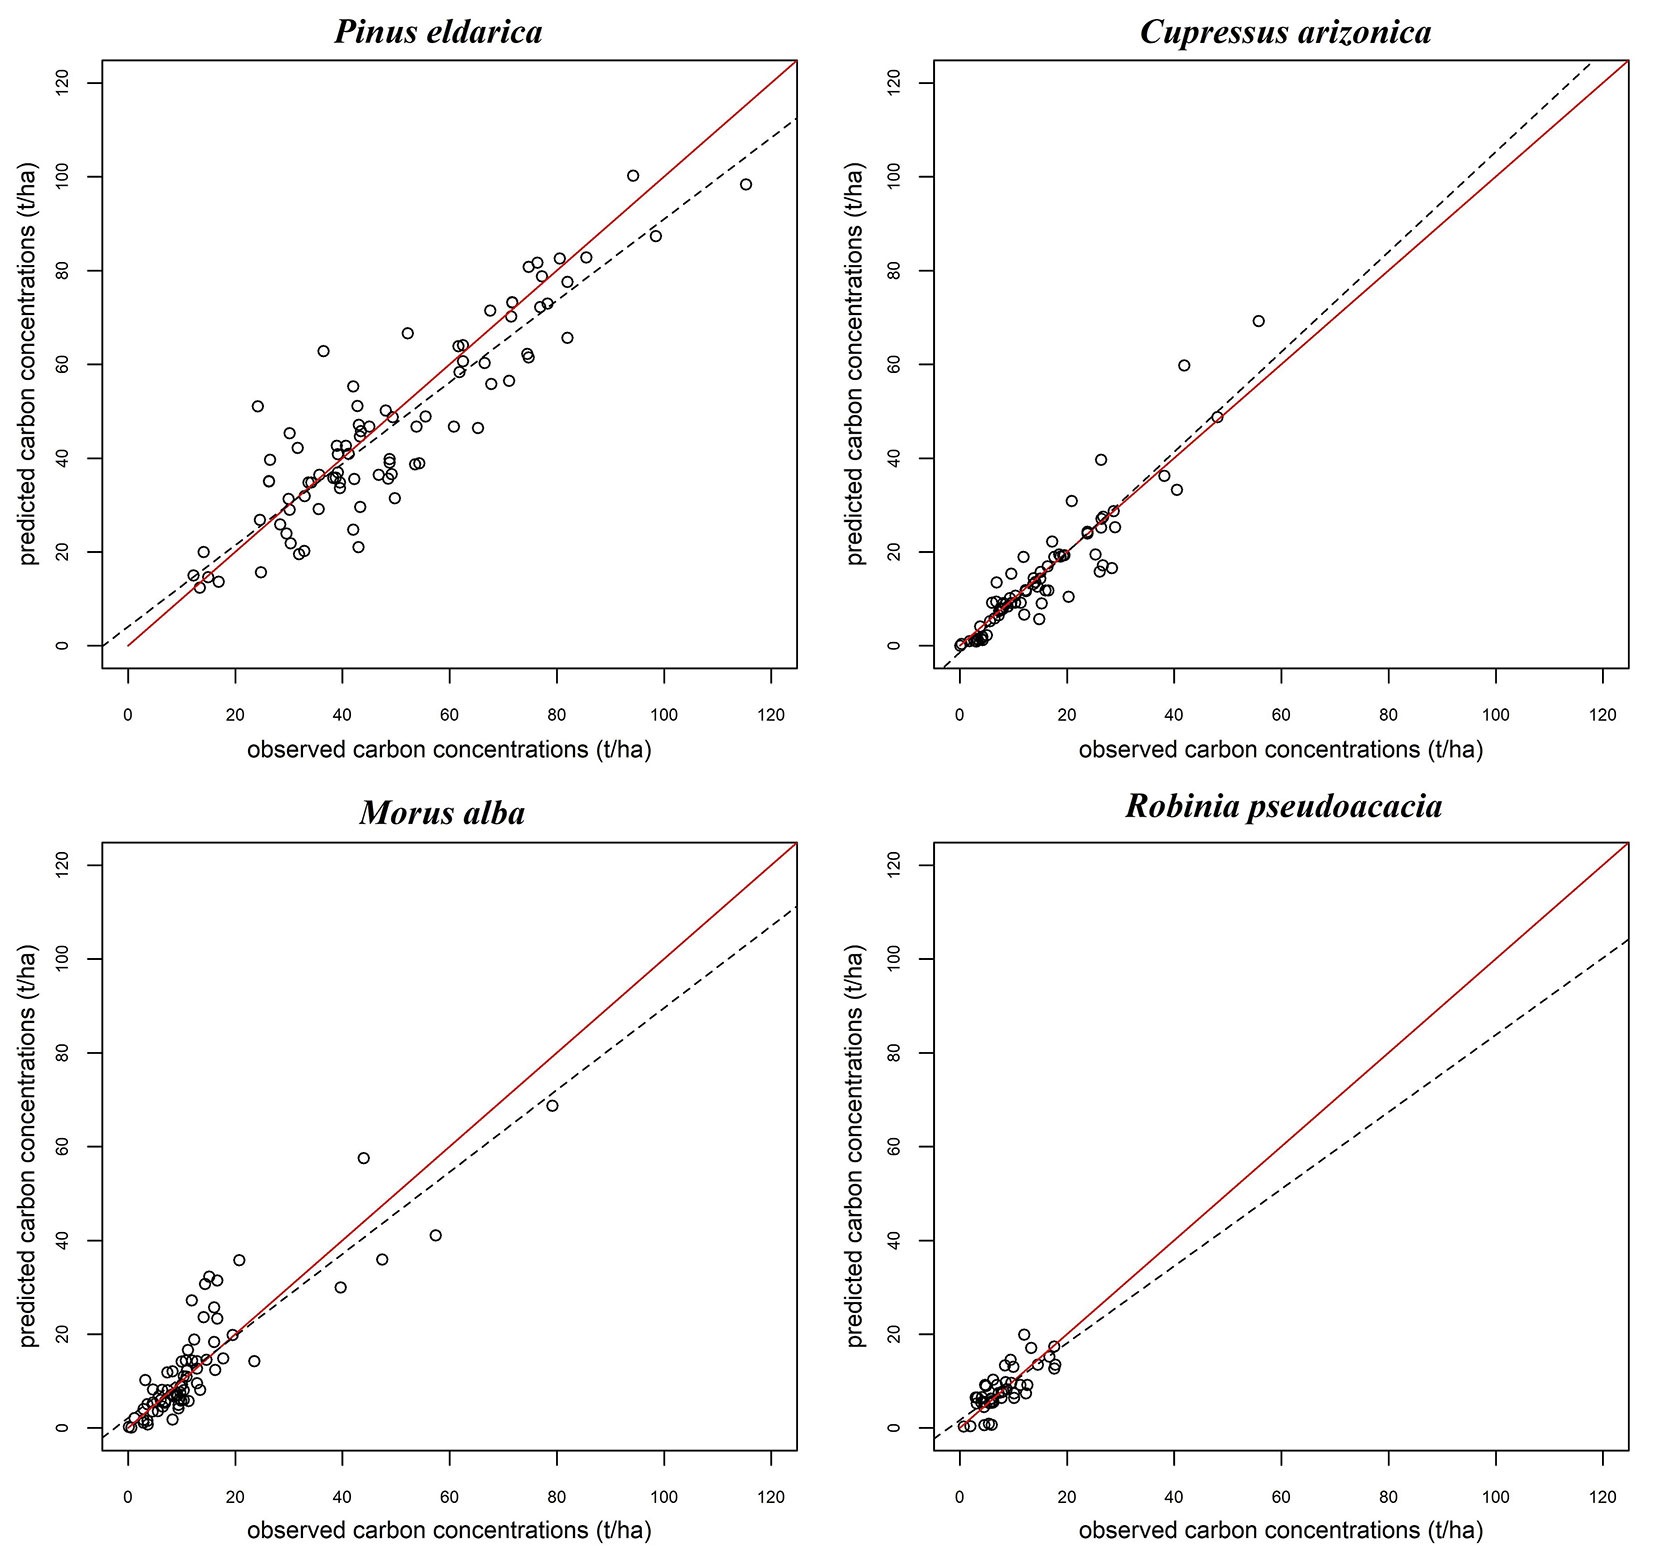
The scatter plots (see Fig. S3 and Fig. 4 in Supplementary material) showed the linear regression models for aboveground biomass, dry biomass and carbon content for each of the four plantations in this study. Fig. S4 shows that the P. eldarica and C. arizonica plantation produced higher amount of dry biomass compared with M. alba and R. pseudoacacia plantations. In addition, the linear regression models of the carbon sequestration showed the lowest amount of carbon content for R. pseudoacacia and highest amount of carbon for P. eldarica (Fig. 4).
Fig. 4 - Regression models of carbon sequestration for the four species considered. Observed (x-axis) vs. predicted (y-axis) values are shown. Bold red line is the 1:1 line. Dashed black line is the fitted line.
Discussion
Plantations in and around industrial areas play a crucial role in enhancing the sequestration of CO2 and reducing air, soil, water and acoustic pollutions as well as moderating temperature around megacities ([13]). Based on long-term data recorded in Mobarakeh Steel Complex, it was estimated that during the 17 years (1994-2011) 63.720.000 tons of CO2 from the process of steel production have been released to the atmosphere. During the same period, plantations contributed to the absoption of 385.430 tons of CO2 from the atmosphere ([1]). Each ton of carbon sequestered by trees removes 3.67 tons of atmosphere carbon dioxide ([11]). During the above period, each ha of P. eldarica, C. arizonica, M. alba and R. pseudoacacia has sequestered 67.22, 46.56, 16.26 and 14.91 tons of carbon, respectively. In the study area, there are 400, 200, 200 and 100 ha plantation of P. eldarica, C. arizonica, M. alba and R. pseudoacacia, respectively. Therefore, 26.888, 93.123, 3252 and 1491 tons of carbon were sequestered, respectively, which is equivalently to 98.679, 34.176, 11.935 and 5471 tons of atmospheric CO2 absorbed, respectively ([3]). Similar research was performed in plantations with two coniferous species (C. arizonica and P. eldarica) around the Iron Melting Company, a similar industrial complex in Isfahan. The results of this study showed that this plantation sequestered 188.321.86 tons of carbon per ha and absorbed 691.141.22 tons of atmospheric CO2 over 17 years ([25]). Another relevant study conducted around an oil refinery in Bahrain estimated an annual removal of 9175 tons of atmospheric CO2 by plantations of four tree species (Azadirachta indica, Nerium oleander, Phoenix dactylifera and Conocarpus erectus - [36]). Finally, a reduction of 1.304 tons of atmosphere CO2 per year was reported for a 66 ha palm plantation near oil refinery in Thailand ([28]).
We followed an approach to parametrize parsimonious and species-specific allometric models for biomass, dry biomass and carbon for four tree species plantations within the Mobarakeh Steel Complex in semi-arid central Iran using information from Pléiades -1B stereo imagery. In this study we investigated 85, 77, 70 and 49 ha plantations of P. eldarica, C. arizonica, M. alba and R. pseudoacacia, respectively. Our results showed that 4075.61, 1093.72, 943.04 and 387.76 tons of carbon were sequestered in each plantation. Overall, the 281 ha considered in the study area have sequesterd 6500.15 tons of carbon, equivalent to 23.855.55 tons of atmospheric CO2.
For coniferous plantations (P. eldarica and C. arizonica), the predicted number of trees based on Pléiades -1B stereo imagery was more accurate (higher R2) compared to deciduous plantations (M. alba and R. pseudoacacia), according to Malabanan et al. ([23]). The lower R2 obtained for the deciduous plantations was related to the younger age and smaller size of deciduous trees compared with coniferous plantations. Further, most broadleaved individual trees across the study site are characterized by two or more crowns, which leads to partially erroneous estimation of tree count by optical remote sensing, whereas accurate tree counting could be obtained for conifers due to their single conic crowns ([32]).
Results of plantation height estimated by pairs of Pléiades -1B imagery were comparable to those reported in the literature. Li et al. ([19]) showed that high-resolution stereo imagery enable estimating height with accuracies similar to those achieved in this study. Our results also showed that another effective factor for accurately estimating tree height is the spatial resolution of the underlying stereo imagery. This result was also confirmed by Persson et al. ([29]) who showed that height estimation accuracy could be further improved when high spatial resolution stereo imagery are used. Such imagery have also been reported to allow for an easier image matching, which in turn affects the precision of the DSM generation ([47]).
The high accuracy of estimations of the aboveground biomass, dry biomass and carbon storage for the entire plantation can be attributed to the high-resolution CHM derived from Pléiades -1B stereo imagery (0.5 m panchromatic and 2 m multispectral bands). Although we did not perform any comparison amongst multiple resolutions, the advantage of high spatial resolution for CHM creation has been previously reported by Straub et al. ([41]), in which the CHM generated from the WorldView-2 data (1.5 m spatial resolution) compared with Cartosat-1data (2.5 m spatial resolution) resulted in a lower plot-level RMSE for former dataset, suggesting that estimation accuracy depends on the spatial resolution of image data.
In this study, the highest amount of carbon sequestration was estimated for P. eldarica (4462.18 t ha-1), followed by C. arizonica (2103.37 t ha-1) plantations, whereas the lowest amount was estimated for M. alba (1009.09 t ha-1) and R. pseudoacacia (365.38 t ha-1) plantations. Similarly, Coyle et al. ([7]) showed that annual carbon storage in coniferous stands is higher than in deciduous plantations. As the climate conditions and site properties of our studied plantations were similar, the difference in carbon sequestrations can be attributed to the ability of coniferous species to produce more biomass than deciduous trees ([40]). Indeed, coniferous trees established in warmer climate (similar to our test site) grow generally faster than deciduous species ([38]). Furthermore, coniferous trees show another important advantage, as their aboveground organs are only partially renewed annually and most of their needles remain in place ([31]).
A similar study was conducted for allometric modeling the biomass of P. sylvestris in southern Poland. The R2 of this models between aboveground biomass and DBH was 85% ([39]), confirming our results for P. eldarica. As for biomass prediction, various allometric models have been developed for multi- species plantations ([8]). Our results showed that total biomass allometric models using tree height as unique predictor can yield fairly high coefficients of determination ([35]) for all tree types except for P. eldarica, for which better result was achieved using DBH ([12]). This is promising in the context of developing automatic procedures based on stereoscopic optical data. Height parameters can be conveniently derived from such data, thus enabling an accurate parametrization of the available allometric models using either directly-derived tree height or DBH extracted from the height-DBH relationship.
Regression models of biomass from Pléiades -1B stereo imagery showd a RMSE% = 29.04, which was in line with Yu et al. ([47] - RMSE% = 27.5), thereby showing performances comparable to (or only slightly worse than) those achieved using airborne laser scanner data. However, it is worth noting that stereo imageries have been formerly considered unsuitable for height and aboveground biomass estimation across natural and heterogeneously structured forests, due to their limitation in presence of complex forest structure, closed canopy and cloud ([19]). However, we firmly promote the further use of more cost effective and operational stereo satellite imagery for biomass and carbon modeling (and mapping) across our (and similar) even-aged, monoculture plantations with regular plantation pattern.
Conclusion
This study demonstrated the potential of simple structural metrics derived from Pléiades -1B stereo imagery for accurate allometric modeling of four monoculture plantations of P. eldarica, C. arizonica, M.alba and R. pseudoacacia in an industrial landscape at plot level. These species are able to absorb notable amount of carbon from the atmosphere. Besides, they are considered as fast growing and water-parsimonious species, which altogether is advantageous for rapidly reducing atmosphere carbon dioxide compared to other species. The results of this study demonstrated that by combining Pléiades -1B stereo imagery and simple allometric regression models aboveground biomass, dry biomass and carbon content can be accurately predicted. The presented approach is potentially useful for further mapping and monitoring of these variables, and may replace or at least supplement exhaustive and destructive field survey. The use of more detailed allometric equations with more structural metrics from stereo data could likely improve the estimations, though at the same time it might reduce the practicability and simplicity of the approach. The presented approach could be applied in other study areas with similar conditions, providing insights into the carbon balance of similar industrial areas. This information can be used by forest managers, industrial and landscape planners to better manage plantations in the industrial zones close to megacities, and to establish mechanisms to mitigate pollution and climate change at the regional level.
Acknowledgements
The authors are grateful to the Mobarakeh Steel Company for their support and cooperation in field data collection, and to the European Space Agency and Airbus Defence and Space for providing Pléiades 1B-stereo imagery for scientific research and application development.
References
Gscholar
Gscholar
Gscholar
Gscholar
CrossRef | Gscholar
Gscholar
Gscholar
Gscholar
CrossRef | Gscholar
Authors’ Info
Authors’ Affiliation
Hamed Naghavi 0000-0002-2734-2831
Department of Forestry, Faculty of Agricultural and Natural Resources, Lorestan University, Khorramabad (Iran)
Department of Photogrammetry and Remote Sensing, K.N. Toosi University of Technology, No. 1346, Valiasr Str., Mirdamad crossing, Postal Code: 19967-15433 Tehran (Iran)
Dept. of Remote Sensing, University of Wuerzburg, Campus Hubland Nord.86, D-97074 Wuerzburg (Germany)
Department of Forestry, Faculty of Natural Resources and Earth Science, University of Shahrekord (Iran)
Corresponding author
Paper Info
Citation
Hosseini Z, Naghavi H, Latifi H, Bakhtiari Bakhtiarvand S (2019). Estimating biomass and carbon sequestration of plantations around industrial areas using very high resolution stereo satellite imagery. iForest 12: 533-541. - doi: 10.3832/ifor3155-012
Academic Editor
Alessio Collalti
Paper history
Received: May 26, 2019
Accepted: Sep 17, 2019
First online: Dec 12, 2019
Publication Date: Dec 31, 2019
Publication Time: 2.87 months
Copyright Information
© SISEF - The Italian Society of Silviculture and Forest Ecology 2019
Open Access
This article is distributed under the terms of the Creative Commons Attribution-Non Commercial 4.0 International (https://creativecommons.org/licenses/by-nc/4.0/), which permits unrestricted use, distribution, and reproduction in any medium, provided you give appropriate credit to the original author(s) and the source, provide a link to the Creative Commons license, and indicate if changes were made.

Web Metrics
Breakdown by View Type
Article Usage
Total Article Views: 45384
(from publication date up to now)
Breakdown by View Type
HTML Page Views: 37171
Abstract Page Views: 4106
PDF Downloads: 3299
Citation/Reference Downloads: 9
XML Downloads: 799
Web Metrics
Days since publication: 2402
Overall contacts: 45384
Avg. contacts per week: 132.26
Article Citations
Article citations are based on data periodically collected from the Clarivate Web of Science web site
(last update: Mar 2025)
Total number of cites (since 2019): 5
Average cites per year: 0.71
Publication Metrics
by Dimensions ©
Articles citing this article
List of the papers citing this article based on CrossRef Cited-by.
Related Contents
iForest Similar Articles
Review Papers
Remote sensing-supported vegetation parameters for regional climate models: a brief review
vol. 3, pp. 98-101 (online: 15 July 2010)
Review Papers
Accuracy of determining specific parameters of the urban forest using remote sensing
vol. 12, pp. 498-510 (online: 02 December 2019)
Research Articles
Geostatistical techniques for estimating aboveground biomass in eastern Amazonia
vol. 19, pp. 85-93 (online: 13 March 2026)
Research Articles
Above ground biomass estimation from UAV high resolution RGB images and LiDAR data in a pine forest in Southern Italy
vol. 15, pp. 451-457 (online: 03 November 2022)
Review Papers
Remote sensing of selective logging in tropical forests: current state and future directions
vol. 13, pp. 286-300 (online: 10 July 2020)
Technical Reports
Detecting tree water deficit by very low altitude remote sensing
vol. 10, pp. 215-219 (online: 11 February 2017)
Research Articles
Afforestation monitoring through automatic analysis of 36-years Landsat Best Available Composites
vol. 15, pp. 220-228 (online: 12 July 2022)
Technical Advances
Detecting mistletoe infestation on Silver fir using hyperspectral images
vol. 7, pp. 85-91 (online: 18 December 2013)
Research Articles
High resolution biomass mapping in tropical forests with LiDAR-derived Digital Models: Poás Volcano National Park (Costa Rica)
vol. 10, pp. 259-266 (online: 23 February 2017)
Research Articles
Classification of xeric scrub forest species using machine learning and optical and LiDAR drone data capture
vol. 18, pp. 357-365 (online: 07 December 2025)
iForest Database Search
Search By Author
Search By Keyword
Google Scholar Search
Citing Articles
Search By Author
Search By Keywords
PubMed Search
Search By Author
Search By Keyword


