Modeling of early stage litter decomposition in Mediterranean mixed forests: functional aspects affected by local climate
iForest - Biogeosciences and Forestry, Volume 8, Issue 4, Pages 517-525 (2014)
doi: https://doi.org/10.3832/ifor1202-007
Published: Nov 18, 2014 - Copyright © 2014 SISEF
Research Articles
Abstract
Litter decomposition is an important process occurring in forest ecosystems, where it affects the carbon balance as a whole. In Mediterranean area, seasonal changes and climate variations associated to latitude and structural characteristics of forest stands have a real effect on decomposition rates. Current leaf litter decomposition models are frequently too general to represent local climate variations in Mediterranean forests. We developed a new dynamic semi-empirical-based model, which simulated the early stage of decomposition of leaf litter based on local climate conditions and few operational parameters. Leaf litter was divided in two components, settled on different carbon compound concentrations. The effects of temperature and moisture were characterized by specific equations and the decomposition rates were time-depending functions. Equations were calibrated by the best fitting procedure performed on field data obtained by the litterbag method followed in mixed deciduous forests in central Apennines (Italy). Model validation showed an excellent correlation between observed and predicted values (R2 between 0.89 and 0.95), predicting thus differences in decomposition rates among different local climates. The simple structure of the model and the satisfactory reliability of outputs are important features for a practical alternative to other CO2 release evaluation methods applied to forest ecosystems.
Keywords
Decomposition Rate, Litterbags, Mediterranean Climate, Semi-empirical Models
Introduction
Litter decomposition is a central feature of the ecosystem dynamics, being involved in the carbon and nutrient cycling through the active transformation of organic to inorganic matter ([6]). Decomposition entails a combination of physic-chemical and biological processes. Substrate quality and climate are among the most important factors affecting litter decay ([33], [23]). For instance, the overall chemical and structural characteristics of the leaf litter affect the length of decomposition phases, which are characterized by different degradation rates ([3]). The role of climatic parameters in the decomposition process is still a matter of debate, though temperature and moisture seem to influence decomposition by altering the activity of decomposers ([3]). The response of decomposition rates to such parameters is a key issue that scientists have been investigating by modeling. Jenny et al. ([25]) first proposed a negative exponential function to quantify the time-based reduction of dead mass in the soil. This first model was further developed by Olson ([36]). In this frame, numerous models have been developed in order to predict carbon storage and fluxes in many terrestrial ecosystems. Such models are mainly based on two assumptions: (i) the decomposition process gradually alters the chemical composition of dead mass (i.e., fresh litter to humus); (ii) organic matter is made of a mixture of chemical compounds decaying at different rates. Models like CENTURY ([37]) and ROMUL ([8]) are based on the first assumption, whereas others such as MBL GEN ([38]), DOCMOD ([10]), and FLDM ([49]) are based on the second. Generally, these models consider the decomposition rate as a constant value, corrected by specific algorithms to take into account the climate variability. Under this assumption, however, the litter quality does not appreciably change with time. Instead, biochemical changes are known to affect the decomposition rates of organic matter along the process: more labile components are degraded first, while recalcitrants have a tendency to accumulate ([34]). Rovira & Rovira ([41]) overcame this contradiction by developing equations describing the substrate-based fluctuations of decomposition rates occurring over time. Previous reports assumed that the decomposition rates decrease over time ([7], [15], [48]). This is not always true in natural environments, where litter decay can fluctuate either for seasonal cycles or different patterns of microbial colonization ([41]). However, the equations proposed by Rovira & Rovira ([41]) are too general to grasp the difference among local climates.
The decomposition dynamics have frequently been modeled for temperate ecosystems ([37], [29]). On the other hand, studies concerning this fundamental process in the Mediterranean basin are scarce, despite the importance of this region within the global change context. Indeed, Mediterranean area is considered one of the main hot spots in future climate change projections ([20]). Moreover, the climate of the Mediterranean area is srongly affected by local features, such as topography, presence of water bodies and different vegetation cover, resulting in a great spatial variability ([19]). To successfully simulate the decomposition dynamics in these environments, adequate time-depending functions describing the fluctuations of the decomposition rates have to be developed and combined with suitable algorithms for local climate effects.
In this study, we developed a semi-empirical model for assessing the early-stage litter degradation dynamics over two years (2011-2012) in three sites located along a north-to-south transect in central Italy (Umbria, Lazio and Campania) and covered by sub-Mediterranean mixed woods. Two litter compartments showing different litter qualities and decomposing at different rates were considered. The role of different local climates has been taken into consideration by applying multiplicative functions that influenced the simulated decomposition process. The decomposition model has been parametrized using field data collected in the Lazio test site, and then applied to the other test sites (Umbria and Campania) for cross-validation. The use of leaf litter collected from a single site (Monti Lucretili) also in the other sites avoided possible influences resulting from using different leaf material and allowed to better test the temperature-based heterotrophic respiration for the carbon balance
Material and Methods
Study areas and climatic data
The study has been carried out in three sites from central Italy located along a north-south transect (Tab. 1): (i) the Boschi di Pietralunga (Umbria), a site of community importance; (ii) the Regional Park of Monti Lucretili (Lazio); and (iii) the Regional Park of Monti Picentini (Campania). These areas were characterized by mixed woods where the most represented species were Quercus cerris (Turkey oak), Acer obtusatum (Italian maple), Carpinus betulus (European hornbeam), Acer campestre (field maple), Cornus mas (European cornel), Fraxinus ornus (manna ash) and Sorbus aria (common whitebeam). Canopies at the study sites were as much dense as the sunlight barely penetrated during the vegetative season. The physical texture of soil was silt-loam for the three test sites, and the substrate was calcareous. Some climatic data of the test sites are reported in Tab. 1 for the years 2008-2011. The climate was typical Mediterranean: precipitation occurred mainly in autumn and winter, whereas summers were hot and dry. Climatic data were provided by: the automatic monitoring station located at Colle Badia Petroia, Città di Castello (Perugia) for the Boschi di Pietralunga; the Integrated Agricultural and meteorological Service of the Lazio Region (ARSIAL, monitoring station of Licenza - Rome) for the Regional Park of Monti Lucretili; the National Service of Civil Protection, section of Montecorvino Rovella (Salerno) for the regional Park of Monti Picentini.
Tab. 1 - Main characteristics of the three test sites analyzed for model calibration. (FC): field capacity (mm/m2) of the upper 30-cm soil layer (measured value); (WP): wilting point (mm/m2) of the upper 30-cm soil layer (measured value); (Tmean): mean annual temperature (°C); (Tjan): average of January minimum temperature (°C); (SDS): Mitrakos’ index of summer drought stress; (WCS): Mitrakos’ index of winter cold stress ([35]).
| Site | Coordinates | Elevation (m a.s.l.) |
Aspect | FC (mm/m2) |
WP (mm/m2) |
Year | Tmean (°C) |
TJan (°C) |
Rainfall (mm) |
SDS | WCS |
|---|---|---|---|---|---|---|---|---|---|---|---|
| Boschi di Pietralunga | 12° 25′ 27.48″ E 43° 25′ 47.64″ N |
643 | N | 95.4 | 27 | 2008 | 14.2 | 3 | 969.2 | 56.3 | 64.3 |
| 2009 | 13.5 | 1 | 897.6 | 42.3 | 71.6 | ||||||
| 2010 | 12.8 | -0.1 | 1254.4 | 33.7 | 72 | ||||||
| 2011 | 13.9 | 1.4 | 638.4 | 32.9 | 66.1 | ||||||
| average | 13.6 | 1.3 | 939.9 | 41.3 | 68.5 | ||||||
| Monti Lucretili |
12° 51′ 51.12″ E 42° 02′ 56.40″ N |
843 | N | 94.2 | 29.1 | 2008 | 14.5 | 2.8 | 1449.8 | 42.1 | 61.9 |
| 2009 | 13.8 | 2.2 | 1598.2 | 9.5 | 61.6 | ||||||
| 2010 | 13.1 | 0.7 | 1569.4 | 3.2 | 69.1 | ||||||
| 2011 | 14.4 | 2.1 | 908.8 | 22.9 | 58.9 | ||||||
| average | 14 | 2 | 1381.6 | 19.4 | 62.9 | ||||||
| Monti Picentini |
15° 00′ 36.72″ E 40° 42′ 03.60″ N |
612 | N | 100.5 | 36.1 | 2008 | 16.3 | 6.2 | 1322.6 | 58.9 | 33.1 |
| 2009 | 16.4 | 6.8 | 1119 | 48.2 | 32.5 | ||||||
| 2010 | 15.4 | 4.8 | 1819.2 | 33.3 | 40.3 | ||||||
| 2011 | 15.9 | 5.3 | 1014.4 | 55.1 | 35.7 | ||||||
| average | 16 | 5.78 | 1318.8 | 48.9 | 35.4 |
The leaf litter decomposition experiment conducted in Monte la Sauceda, southwest Spain (36° 30′ N, 5° 35′ W, 432 m a.s.l. - [17]) was used for a further validation of the model. The vegetation at this test site was dominated by cork oak (Quercus suber) forests, mixed with winter deciduous oaks (Quercus canariensis). The soil was sandy, with small inclusions of loam and clay. This area showed the typical winter-wet and summer-dry pattern of the Mediterranean climate. Mean annual temperature was 16.2 °C and the average annual precipitation about 1600 mm. Further information on the experimental site in Monte la Sauceda are reported by Gallardo & Merino ([17]).
Field data collection
The litterbag approach ([47]) is widely used to study the decomposition process at the soil surface. Two kinds of 20×15 cm nylon bags with different meshes (3 and 10 mm) have been arranged. The first bag type (3 mm - fine mesh, FM) was chosen to exclude the meso-fauna, and to minimize particle inputs and biomass loss as well. The second type (10 mm - coarse mesh, CM) was used to allow the soil micro- and meso-fauna to reach the litter contained in the bags.
During October 2010, leaves from branches of Italian maple, field maple and European hornbeam have been collected from trees growing in the Regional Park of Monti Lucretili. Such unique sampling site has been chosen in order to exclude differences in the physical and chemical properties of leaves due to differences at growing sites. In this way, the decomposition rates were only dependent on local climate, local micro- and meso-fauna and soil properties of the test sites. Sampled leaves were pooled and air-dried at room temperature until reaching a constant weight. Three grams of leaf biomass were enclosed in each bag, according to the percentage of presence of species in the forest stand: 40% Italian maple, 40% field maple and 20% European hornbeam. Sixty fine mesh litterbags and sixty coarse mesh litterbags have been placed at the soil surface in each site in January 2011, and periodically collected (six items for each bag type) until June 2012. Moreover, six items of each bag-type have been used to determine the weight losses due to manipulation, i.e., items have been chemically processed after oven-drying at 50 °C for 72 hours, in order to determine their initial content of lignin, nitrogen (N) and carbon (C). One mm mesh size litterbags have been used to enclose separately two grams of Quercus suber and Q. canariensis leaves in the experiment at Monte la Sauceda test site. Details on litter quality, field and analytical methods performed in the experiment of Monte la Sauceda were reported by Gallardo & Merino ([17]).
Mass loss and determination of lignin, nitrogen and carbon content
Leaves from litter bags were carefully cleaned with ultra-pure distilled water to eliminate soil particles and meso-fauna at each sampling. After cleaning, leaves were oven-dried at 50 °C for 72 hours and then weighted. The litter mass loss was calculated as percentage of variation from the initial weight. Since small amounts of soil mineral elements could contaminate leaf samples in the bags, the remaining mass of each sample was calculated by detracting its ash content from the dry mass. The ash content was determined by burning 0.3 g of each sample at 550 °C for 2 hours in a high temperature electric oven (GenLab, UK). Leaves were pulverized in a planetary ball mill (PM400, Retsch - Germany). Lignin content of the mixed species litter was determined using the method by Van Soest & Wine ([44]), modified as described by Fioretto et al. ([16]). N and C were measured by a CHNS-O Analyzer (Thermo FlashEA1112, Thermo Fisher Scientific Inc. - USA).
Model description
Theory and basic assumptions
Time-dependent simulation of leaf litter decay has been performed on a dynamic semi-empirical model based on the Olson’s model ([36]). It was assumed that the decaying litter lost a proportion of its mass per unit of time ([36]). In this study, litter was considered to be composed of two main components constituted by lignin in the first component (recalcitrant litter) and by cellulose, hemicelluloses and soluble compounds in the second component (labile litter). Furthermore, these components were characterized by different decomposition rates ([32]), though neither group of compounds decays independently, as lignin physically can protect great part of the cellulose and hemicelluloses from decomposition ([9]). Decomposition rates of these groups change over time, in relation to the progressive variation in the proportions of different compounds. Finally, it was also assumed that microbial activity depended on optimal temperature and moisture conditions ([36], [33], [4], [28]), though the relationship between temperature and decomposition rate is still debated ([18], [14]).
Model structure and equations
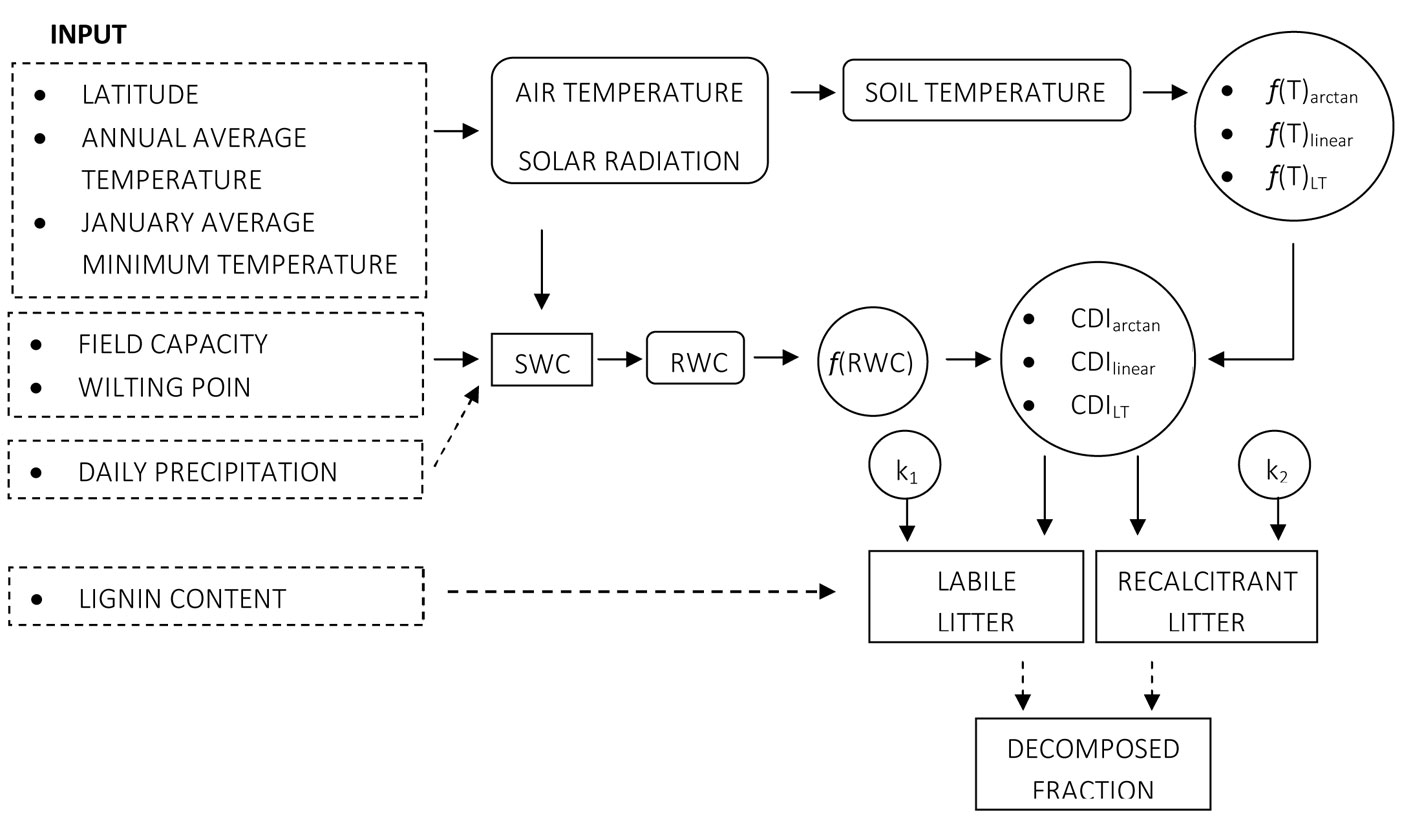
The semi-empirical model of litter decomposition (Fig. 1) has been developed using the software platform STELLA® v. 7.0.3 (Isee Systems Inc., USA), an object-oriented program (OOP), comprising several interrelated modules. The organization into small autonomous units (modules) allows much more flexibility in modeling complex processes such as litter decomposition, being affected by several environmental and biological components. Furthermore, a single specific function performed in a module can be replaced by a similar one with no need of rearranging the whole model. Also, different models can be linked each other in order to explore more processes mutually interacting at the same time.
Fig. 1 - Conceptual diagram of the decomposition model. Dashed boxes refer to input variables, squares are stocks, rounded square are driver variables, circles represent specific information dealing with model control, dashed arrows denote fluxes and solid arrows represent impacts.
Sub models and their equations to simulate the parameters are described below (see also Tab. 2).
Tab. 2 - Parameter and equations used for litter decomposition modeling. (Tsoil): soil temperature at depth 10 cm; (Tair): air temperature; f(T)arctan, f(T)LT, f(T)linear: temperature effect on decomposition rates; (meltsnow): water from the snow pack; (SWC): soil water content; (RWC): relative water content; (WP) wilting point; (FC): field capacity; (intloss): interception per rain events; (KC): crop coefficient; (EtrA): annual real evapotranspiration; (ET0A): annual potential evapotranspiration; (ET0): potential evapotranspiration; (S): maximum quantity of water absorbed after run-off start; (LAI): leaf area index; (CN): run-off curve number; f(RWC): moisture effect on decomposition rates; (w): lignin percentage of leaf litter; (k1): decomposition rate of labile compounds; (k2): decomposition rate of recalcitrant compounds.
| Parameter | Units | Equations and values | Source |
|---|---|---|---|
T soil |
°C | 0.769 + 0.826 · Tair |
This work |
f(T)arctan |
dimensionless | 0.56 + (1.46 · arctan(π · 0.0309 · (Tsoil - 15.7))) / π |
[11] |
f(T)LT |
dimensionless | 0.57658 · exp(308.56 · ((1 / 56.02) - (1 / (273 - Tsoil - 227.13)))) | [30] |
f(T)linear |
dimensionless | 0.198306 + Tsoil · 0.036377 |
[1] |
m eltsnow |
mm day-1 | 0.66 · Tair |
[37] |
SWC
|
mm day-1 | (rainfall + meltsnow) - (intloss + runoff + ET0) |
This work |
RWC
|
unitless | (SWC - WP) / (FC - WP) |
[11] |
intloss
|
mm day-1 | rain · (1 - exp(- KC · LAI)) | [40] |
KC
|
dimensionless | ETrA / ET0A |
[2] |
ET rA |
mm year-1 | PA / (√ (0.9 + (PA2 / (300 + 25 · TA3)2))) |
[43] |
ET 0 |
mm day-1 | 0.408 (Rn - G) + γ · (900 / (Tair + 273) · u2 · (e°(T) - ea)) / (Δ + γ · (1 + 0.34 · u2)) |
[2] |
runoff
|
mm day-1 | (((rainfall - intloss) - (0.2 · S))2) / ((rainfall - intloss) + (0.8 · S)) |
[42] |
S
|
mm | 254 · [(100 / CN) - 1] |
[42] |
LAI
|
dimensionless | 2.56 / [1 + 1430 · exp(-0.0471 · t)] | Calibration |
CN
|
dimensionless | 55 | [42] |
f(RWC) |
dimensionless | 5 · (0.287 + (arctan(π · 0.009 · (RWC · 10 - 17.47))) / π) |
[11] |
w
|
% | 38 | This work |
k 1 |
% day-1 | 1 / (-2.04 · 103 + 1.99 · 103 · t 0.0482) |
This work |
k 2 |
% day-1 | 9.09 · 10-4 + 2.06 · 10-5 · t - 4.31 · 10-8 · t 2 |
This work |
Climatic module
Data concerning latitude, annual average air temperature (TA, °C) and January minimum average air temperature (TJan, °C) calculated over four years (2008-2011) have been included in the model (climatic static database) as input parameters for simulating solar radiation (W m-2) and daily average air temperature (Tair, °C) using the climate algorithm reported by Vitale et al. ([45]). Soil temperature (Tsoil, °C) has been calculated by using an empirical equation (eqn. 1 - r2 = 0.99) derived by fitting air and soil temperature database (2007-2011) supplied by climatic monitoring station of Licenza, located in the Regional Park of Monti Lucretili (Lazio, central Italy - eqn. 1):
where t is the day of the year.
Hydrological module
This module has been developed to simulate the soil water content (SWC(t), mm day-1) in the first 30-cm depth of soil. Air temperature (°C), precipitation (mm) and water holding capacity (FC(t), mm day-1) have been included as input parameters. When the SWC was below the water holding capacity it was calculated from the in-coming and out-coming water balance as follows (eqn. 2):
where meltsnow (mm day-1) was the in-coming water supply from melting snow, calculated by a temperature-dependent linear equation according to Parton et al. ([37]); intloss (mm day-1) was the water interception by the canopy ([40]), which, in turn, is a function of the leaf area index (LAI, m2leaf m-2ground). The LAI(t) (eqn. 3) has been simulated by a logistic equation, parametrized using empirical data derived by Gratani & Foti ([21]) for a mixed deciduous forest located in Abruzzi (central Italy), similar to the woody stands considered in this study (eqn. 3):
The time period considered for the intloss modeling was from the 100th to the 281th day of the year. The runoff (runoff(t), mm day-1) was simulated according to Steward et al. ([42]). In this module, we used the runoff model calibrated for woods protected from grazing, and soil adequately covered by litter and brush ([42]). The potential evapotranspiration (ETo(t), mm day-1) was calculated by a modified Penman-Monteith equation, as reported by Allen et al. ([2]). SWC(t) was considered equal to FC(t) and the excess water was assumed to percolate to the bottom layer when the hydrological balance exceeded the FC(t). Water holding capacity FC(t) and wilting point were calculated using the soil calculator algorithm of the CENTURY model ([37]) based on equations developed by Gupta & Larson ([22]) and Rawls et al. ([39]). Soil calculator algorithm needed of sand, clay and silt fractions as input.
Decomposition module
Litter decomposition followed two exponential dynamics made as function of time and climatic conditions (eqn. 4):
where M(t) was the amount of litter at time t, M1 and M2 were the initial amounts of the labile and recalcitrant components (determined by the fraction of initial litter lignin content) and k1 and k2 their decomposition rates, respectively. CDIi,j were the climatic decomposition indexes ([1]), specific for each pool and accounting for local climate conditions. Decomposition rates related to labile and recalcitrant components [k1(t) and k2(t)] were not constant but varying over time. The equations describing the decomposition rates for the two compartments M1 and M2 were obtained by interpolation of decomposition rates of non-lignin and lignin fractions, respectively, and estimated by biomass losses data obtained in the Lucretili Regional Park (Lazio, central Italy) test site during the entire experimental time period (eqn. 5):
where k(t) is the decomposition rate (day-1), M0 was the initial mass (%) and Mt was the mass (%) at time t (days).
Then, the time-based equations of k1 and k2 have been chosen by a best fitting procedure performed by CURVE EXPERT BASIC 1.4 shareware software ([24] - eqn. 6, eqn. 7):
where t is the day of the year.
The decomposition rates have been corrected by incorporating the climatic decomposition index (CDI) to account for climatic variability. CDI simulated the soil moisture [f(RWC)] and temperature [f(T)i] effects as follows (eqn. 8 - [1]):
Fig. 2 - Trends of the three soil temperature-based functions f(T) included in the model.
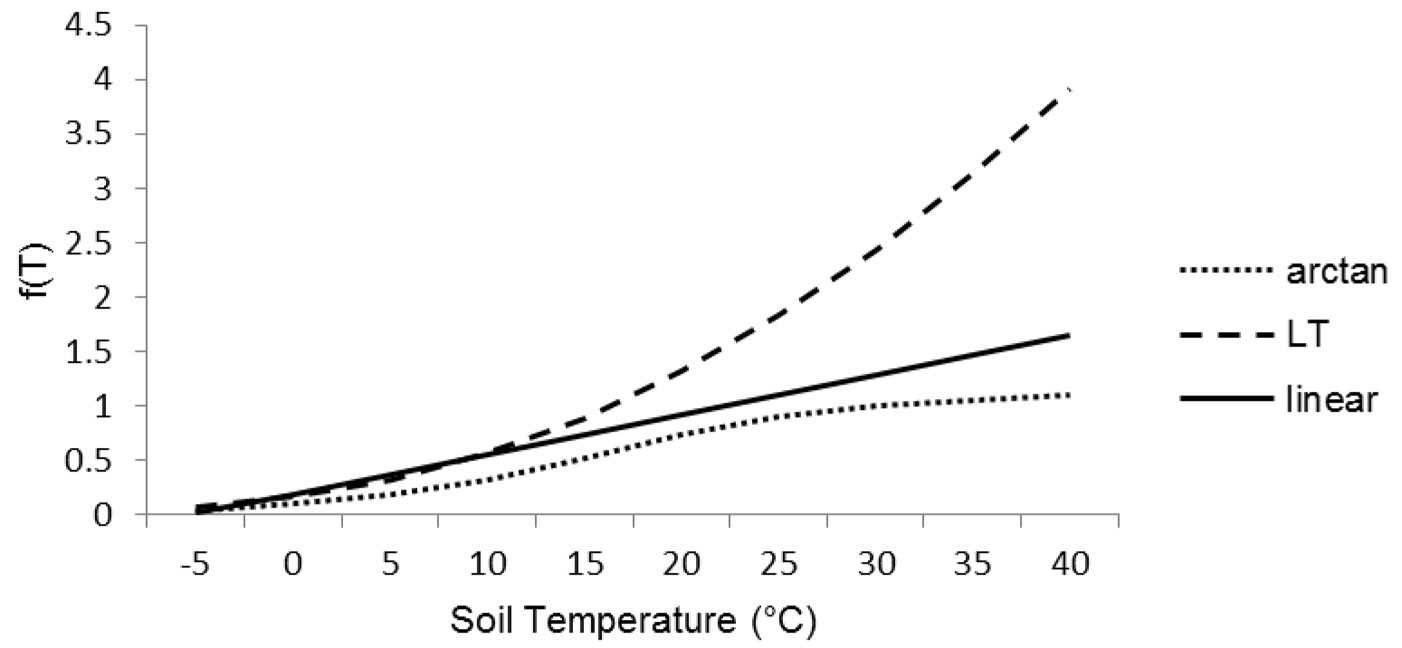
The effect of temperature has been simulated taking into account three functions from the literature, suited for Mediterranean conditions (Fig. 2). Indeed, the majority of litter decomposition models were realized for temperate climates and their equations implied a marked sensitivity to temperature already above 10 °C ([1]). The equations were f(T)arctan ([11]), f(T)LT ([30]) and f(T)linear ([1]). In details (eqn. 9, eqn. 10, eqn. 11):
The decomposition rates were strongly affected by temperature functions by slowing down of decomposition process of about 85-75% at low winter temperature. The three functions were affecting decomposition rates in different ways during summer period. The arctan function (eqn. 9) was normalized to 1 at 30 °C, whereas the linear function (eqn. 11) was not normalized, although its slope (0.036) did not allow reaching values > 1.07 for the range of latitudes considered in this study. The Lloyd & Taylor’s function (eqn. 10) had an exponential trend that reached 1 at the soil temperature of 16 °C, after that the function increased rapidly its values doubling the decomposition rates at 27 °C and triplicating them at 34 °C. The soil moisture effect [f(RWC)] has been simulated according to Del Grosso et al. ([11]) as follows (eqn. 12):
The relative water content [RWC(t)] allowed to quantify the water content in the soil by water balance with respect to the previous day. It was calculated by SWC according to Del Grosso et al. ([11]). f(RWC) took values ranging from 0.7 to 1.1 when soil RWC was 0 and 1, respectively. Different CDIs were applied to M1 and M2 components according to the following conditions (eqn. 13):
where TJan is the minimum average air temperature (°C) in January and TID is the maximum deviation of TJan from annual average temperature (°C).
Further information about decomposition model are reported in Appendix 1.
Statistics
Multivariate analysis of variance (MANOVA) and principal component analysis (PCA) were performed to test for differences among test sites in the climatic parameters (precipitation, average, minimum and maximum temperature), and to classify all the variables considered in order of importance. Post-hoc comparison analysis (Tukey’s HSD test) was carried out in order to quantify significant differences among the test sites. To verify the goodness-of-fit of predictions obtained from the decomposition model, ANOVA and linear regression analysis were carried out to test the relationship between simulated and measured data. All statistical analyses were performed using the software package STATISTICA® 8.0 (Stat Soft Inc., Tulsa, OK, USA).
Results
Climatic differences between test sites
The MANOVA analysis of climatic variables (precipitation, average, minimum and maximum temperature) carried out over the whole experimental period (January 2011 to June 2012) revealed significant differences among test sites (F = 106.76, p < 0.01). However, the post hoc analysis highlighted that these differences were due to the different homogeneous groups (test sites) with respect to some variables, such as mean temperature or rainfall (Tab. 3)
Tab. 3 - Analysis of homogeneity of temperature and precipitation among the studied stands after Tukey’s HSD test (α=0.05). (Tmean): average temperature (°C); (Tmin): minimum temperature (°C); (Tmax): maximum temperature (°C); (****): significant homogeneity between site pairs for the parameter considered.
| Parameter | Boschi di Pietralunga | Monti Lucretili | Monti Picentini |
|---|---|---|---|
| Tmean (°C) | **** | **** | - |
| Tmin (°C) | **** | **** | - |
| Tmax (°C) | - | - | - |
| Rainfall (mm) | - | **** | **** |
According to the Kaiser’s criterion ([27]), PCA results revealed that average and maximum temperature had the largest weight on the PC model, which accounted for 95.8% of the total variation (eigenvalues: 2.83 and 1.00, respectively), while precipitation appeared to have not significant effects (eigenvalue < 0.01). As a consequence, a greater weight has been assigned to temperature than to precipitation, and temperature has been used as an important variable to discriminate different climatic decomposition indexes (CDIs).
Evaluation of decay dynamics at the test sites and litter quality
The litterbag method has been widely utilized to quantify the litter mass decay over time. However, we observed that decomposition rates were overestimated both in early and late phases of the process when the coarse-mesh (10 mm) litterbags were utilized. This was likely due to losses of organic matter not related to the decomposers’ activity. Although the use of fine-mesh (3 mm) bags could reduce the decay rates by excluding some invertebrates, errors in the estimation of decomposition rates resulted higher when coarse-mesh bags were used. Therefore, the decomposition model has been parametrized using only data from fine-mesh litterbags. The litter mass decay over time is displayed in Fig. 3, where a marked reduction of leaf litter mass (10-14%) was evident just after one month of permanence to the ground, likely due mainly to the leaching of soluble compounds from litter. In this early phase, no significant differences among sites were observed (F = 1.610, p = 0.200). In winter, the decomposition rate of the site Boschi di Pietralunga (the northern site) was slower than those of the other sites, losing about 10% less of biomass (F = 6.948, p < 0.01) after 100 days since the beginning of the experiment. Biomass differences between the site Boschi di Pietralunga and the others became more evident after 140 days (F = 11.499, p < 0.01; Tukey’s HSD test: Boschi di Pietralunga vs. Monti Picentini, p = 0.046; and Boschi di Pietralunga vs. Monti Lucretili, p = 0.030). Finally, no significant differences (F = 1.99, p = 0.137) were observed among test-sites at the end of the experiment (after 520 days). Data concerning the leaf litter weight decay at the three sites are presented in Appendix 1. Initial content of lignin, N and C concentrations of the leaf litter were 38 ± 2.6%, 2.37 ± 0.05 mg gDW-1 and 50.04 ± 0.14 mg gDW-1, respectively.
Fig. 3 - Values of k1(t) and k2(t) measured and interpolated by: (a) the Harris’ model; (b) the quadratic curve.
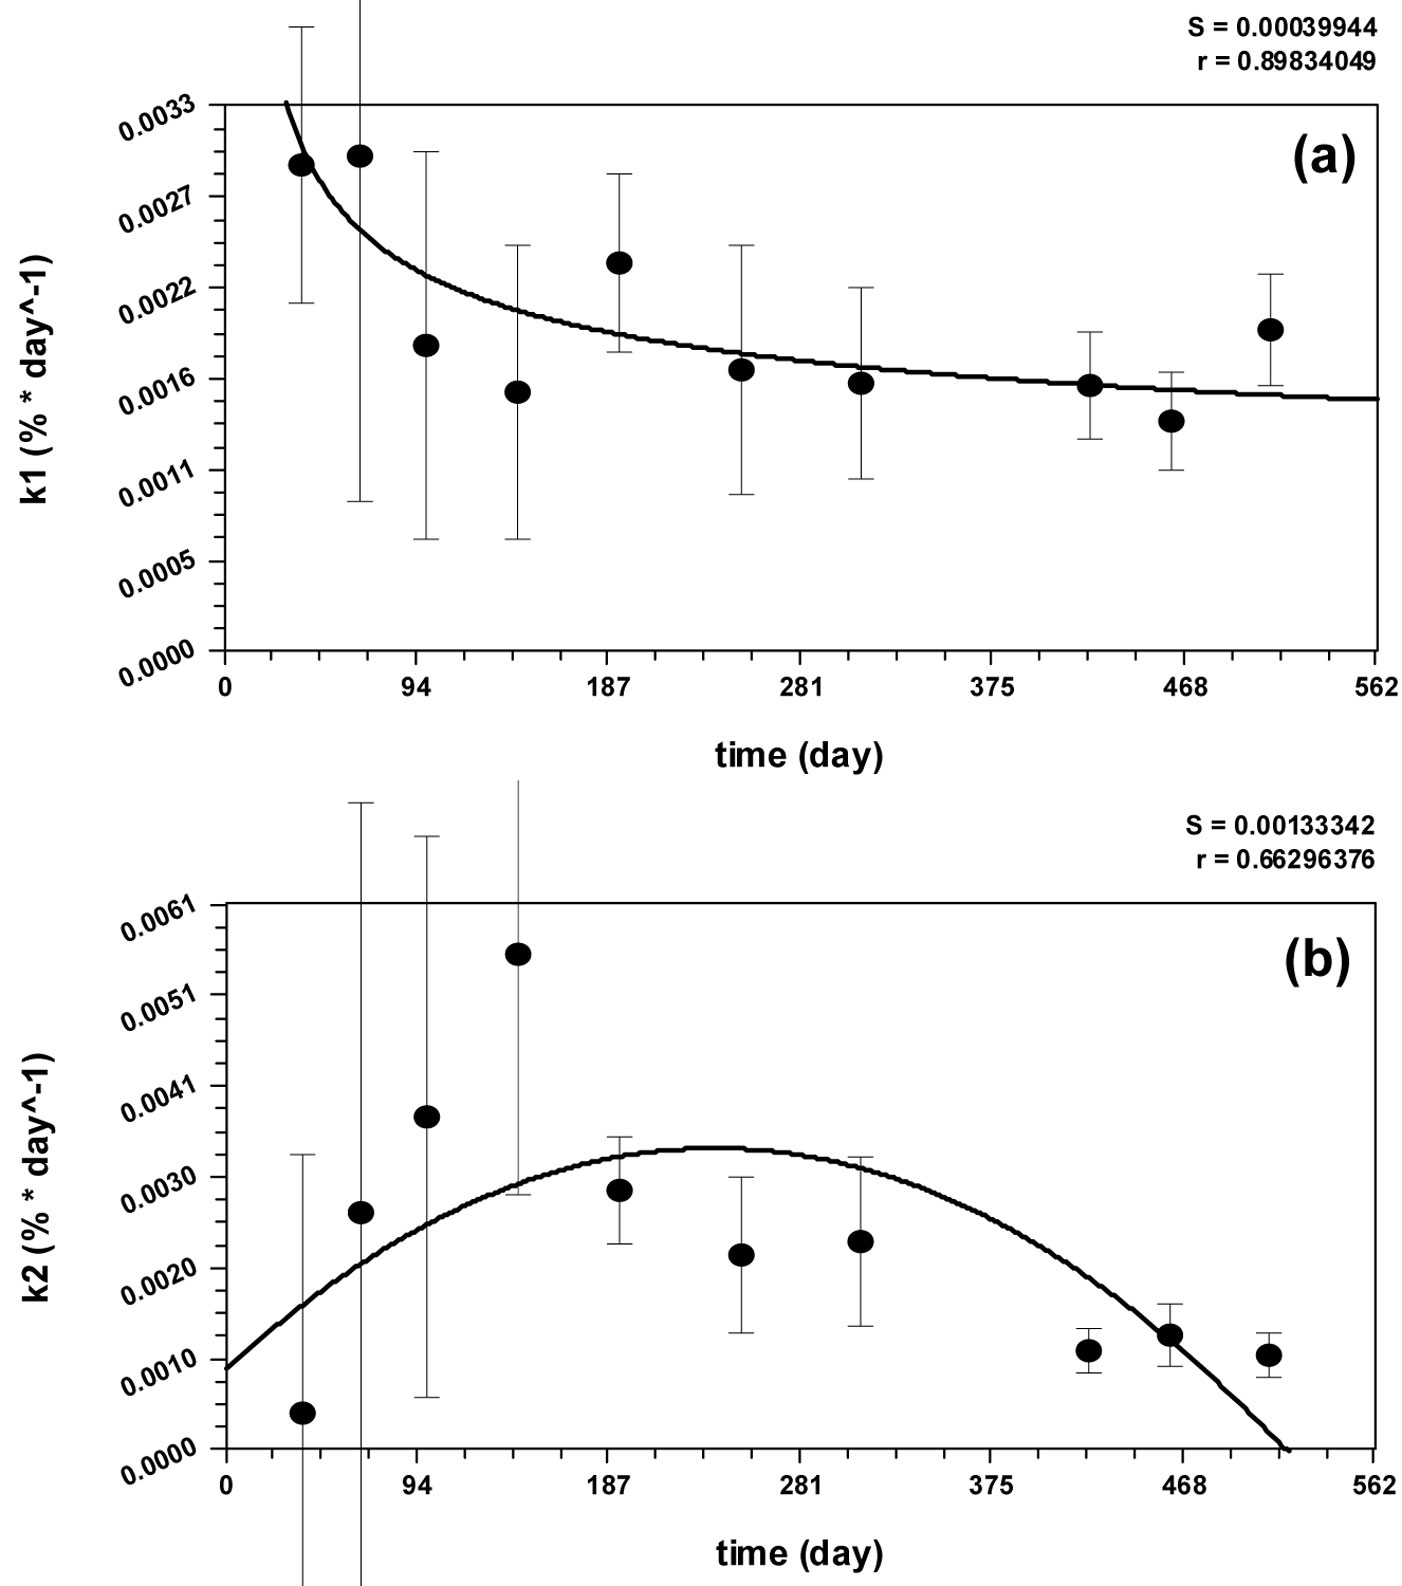
ssessment of time-depending equations for decomposition rates
Equations describing the decomposition rates [k1(t) and k2(t), eqn. 6 and eqn. 7] have been obtained by fitting the data obtained from the Regional Park of Monti Lucretili (Fig. 3). The Harris’ model and the quadratic curve were the best fitting models for k1(t) (r = 0.90) and k2(t) (r = 0.66) decomposition rates, respectively. The processes modeled by eqn. 6 and eqn. 7 were coherent and biologically meaningful, since k1(t) had high decomposition rate (10-2 day-1) in the first month due to the leaching, then rapidly falling to a stable rate of 10-3 day-1. Contrarily, k2(t) showed low rate values (10-4 day-1) in the early stage (when most decomposable compounds were still present), reached its maximum rate (10-2 day-1) after the 301st day of the year (due to the progressive reduction of labile compounds), and then slowed down to a rate value of 10-3 day-1.
Estimation of leaf litter decomposition depending on local climate
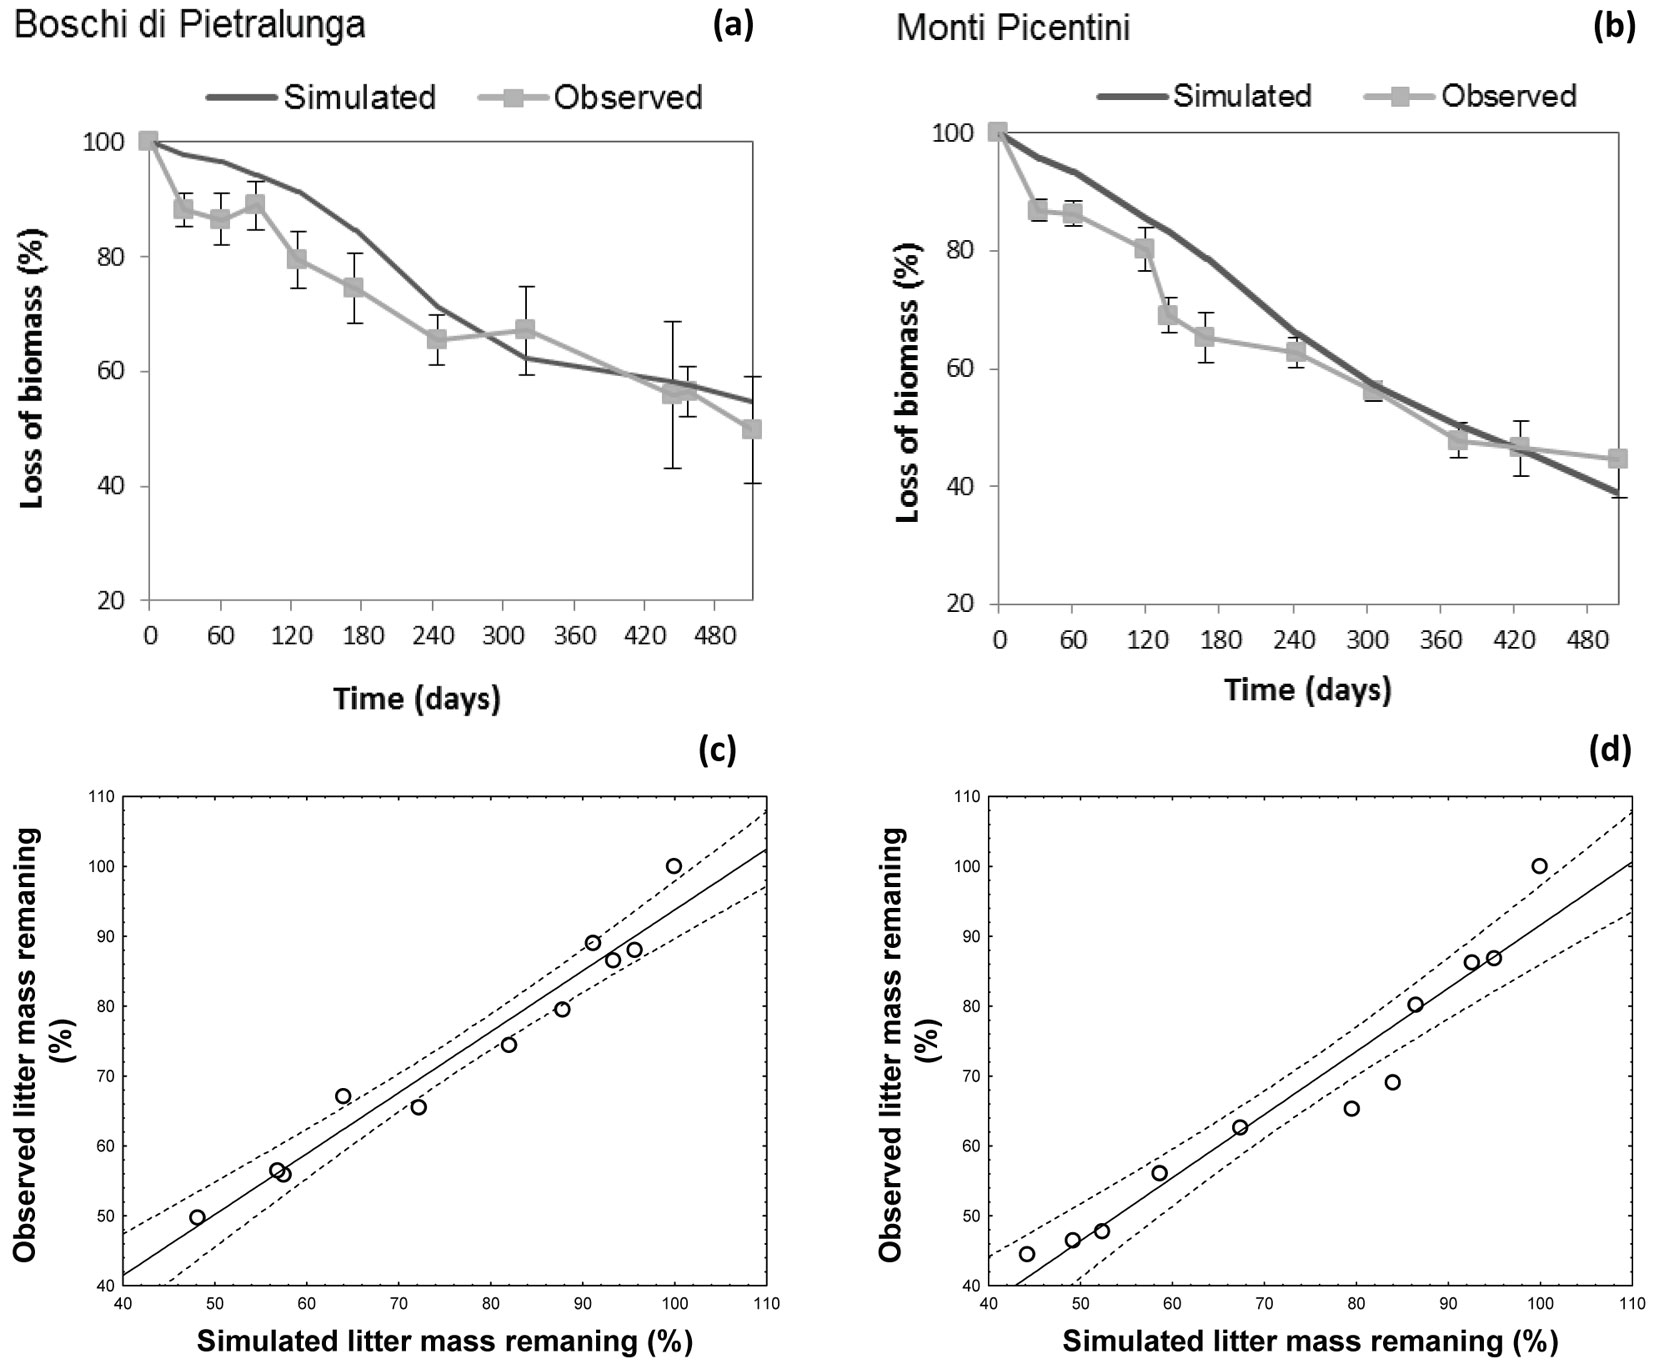
The climatic dependence indexes (CDIs) were calculated for all test sites taking into account their time-based dynamics for the f(RWC) and f(T) functions. The model optimized for the site at the Regional Park of Monti Lucretili proved to simulate quite accurately the non-linear dynamics of the decomposition process (observed vs. predicted: r2 = 0.74 - Fig. 4a), though a systematic underestimation was detected in the summer period (Fig. 4b). Also, model predictions of mass loss well fitted to the observed data from sites Boschi di Pietralunga and Monti Picentini (Fig. 5a, Fig. 5b), as confirmed by the results of the ANOVA test (Boschi di Pietralunga: F = 3.385, p = 0.068; Monti Picentini: F = 2.654, p = 0.106). The strong relationship between observed and simulated values was further confirmed by the slope of the regression when imposing the intercept to zero, being 0.995 ± 0.012 (R2=0.79) for the site Boschi di Pietralunga (Fig. 5c) and 0.996 ± 0.011 (R2=0.90) for the site Monti Picentini (Fig. 5d).
Fig. 4 - Scatter plots (a) and decay curves (b) showing the comparison between observed and simulated data for the site located at Monti Lucretili.
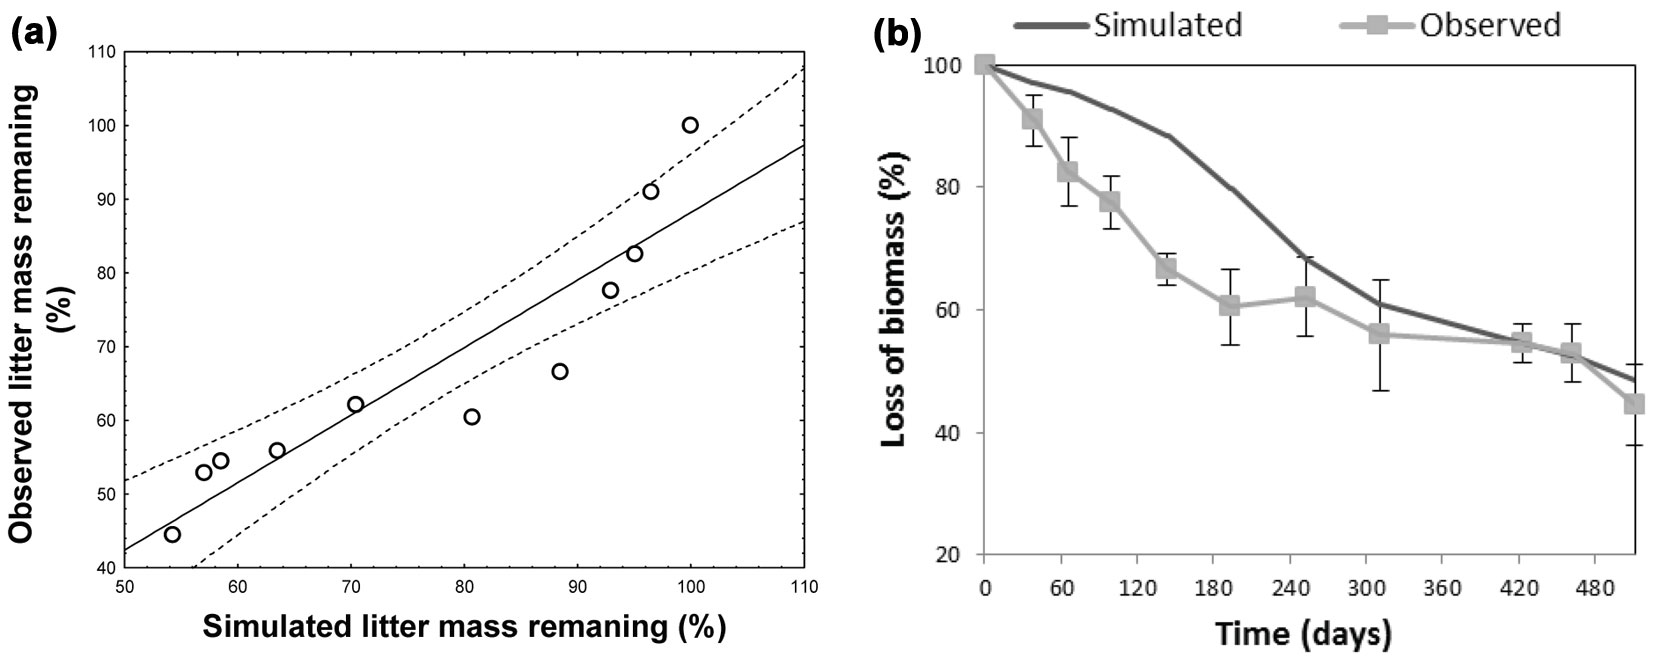
Fig. 5 - (Upper panels): observed and simulated values of mass loss with time at two study sites: (a) Boschi di Pietralunga; (b) Monti Picentini. (Lower panels): comparisons between observed and simulated data obtained at two study sites: (c) Boschi di Pietralunga; (d) Monti Picentini.
Model validation
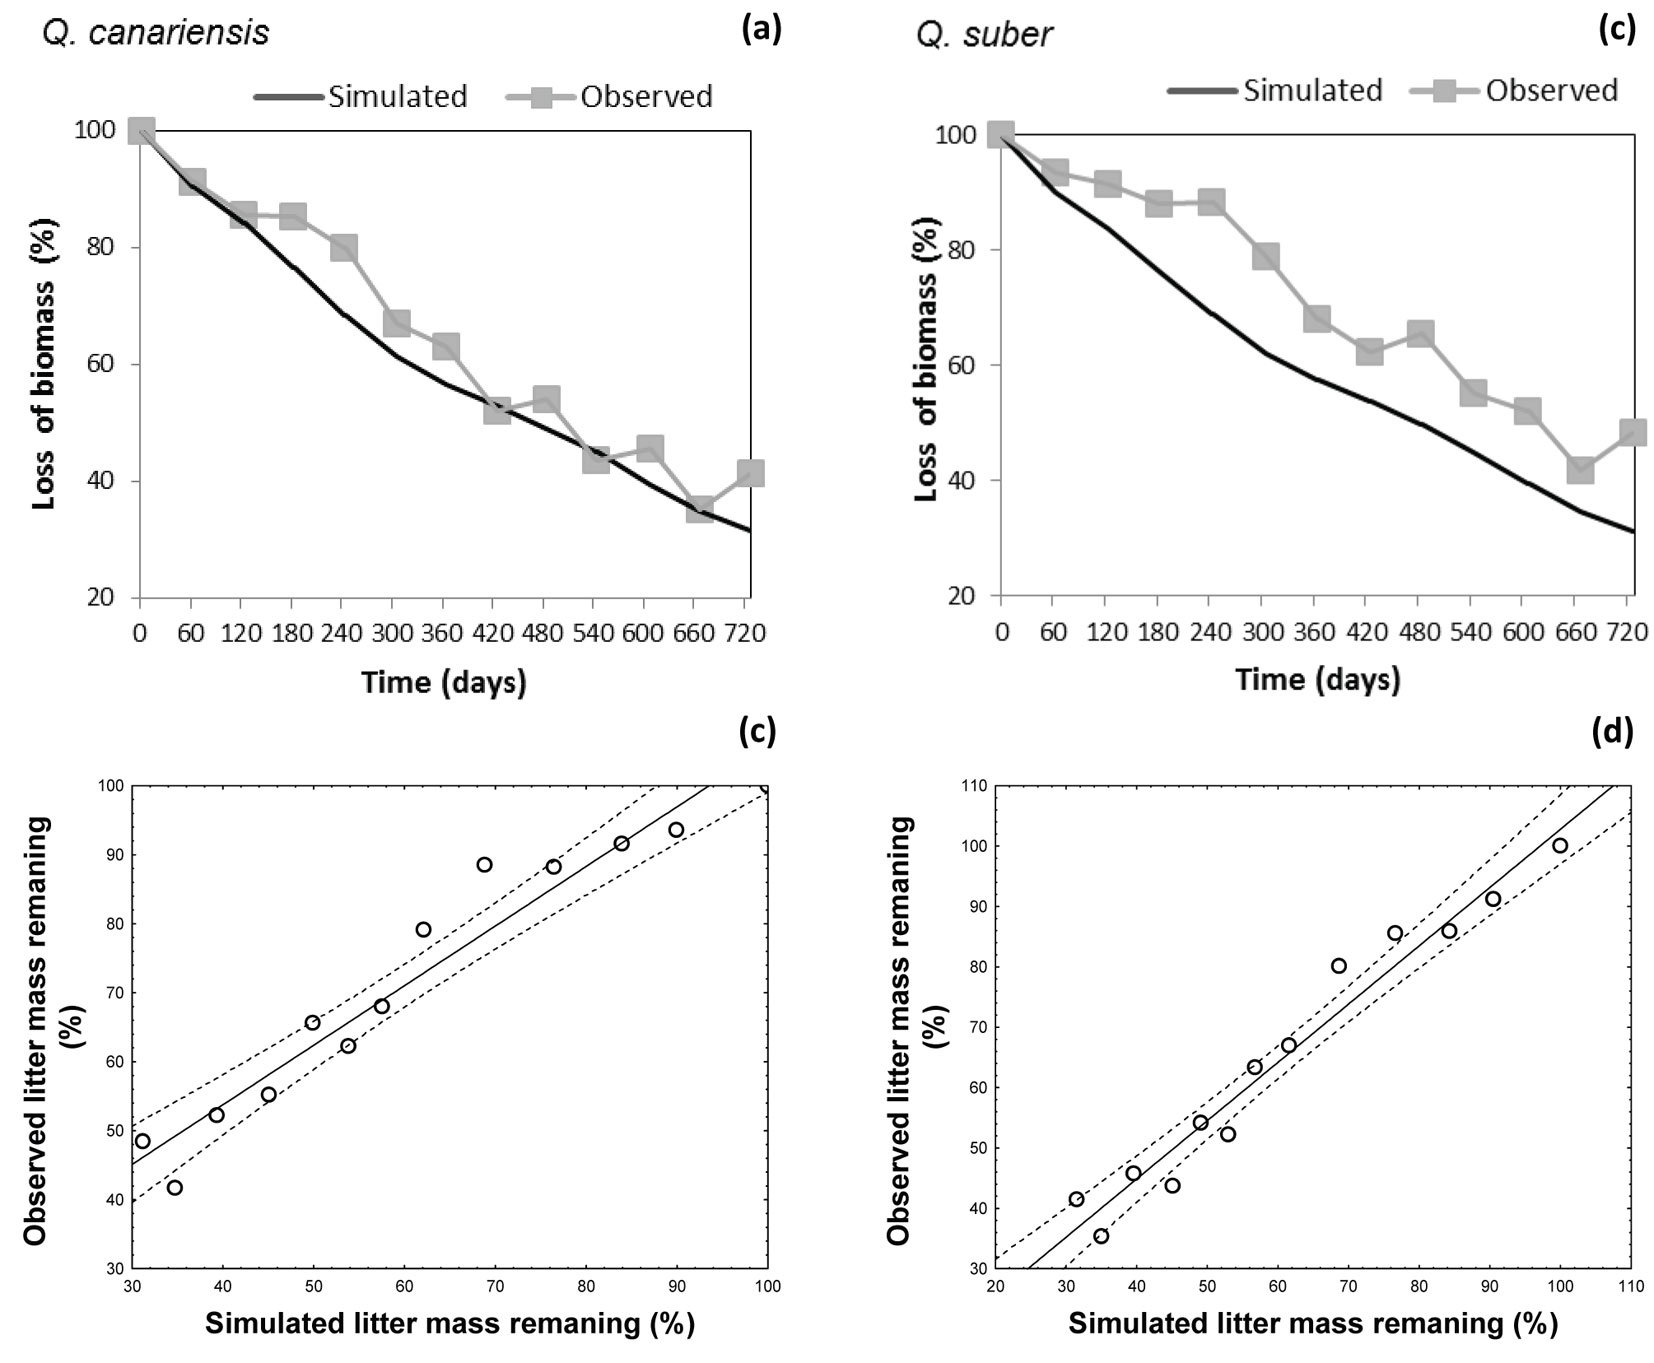
Model validation was carried out using the dataset obtained from the leaf litter experiment at Monte la Sauceda, southwest Spain. Simulations carried out adequately reflect the litter decay dynamics of two litter species at the test site (Fig. 6a, Fig. 6b). However, some systematic differences were found between observed values and model predictions concerning the decomposition dynamics of Q. suber. The model proved to over-estimate the litter mass remaining during the whole decomposition period, with an average deviation of 10% (Fig. 6a, Fig. 6b). The regression slope obtained by imposing the intercept to zero was 0.99 ± 0.3 (R2 = 0.89) for Q. suber leaves (Fig. 6c) and 0.99 ± 0.02 (R2 = 0.95) for Q. canariensis leaves (Fig. 6d).
Fig. 6 - (Upper panels): observed and simulated values of mass loss with time at the validation site: (a) Quercus suber; (b) Q. canariensis. (Lower panels): comparisons between observed and simulated values obtained at the validation site: (c) Quercus suber; (d) Q. canariensis.
Discussion
Our results showed a pronounced dependence of leaf litter decomposition upon local climatic conditions. Decomposition was affected by low temperature that strongly reduced the decay rate of labile compounds of the litter during winter months (i.e., Boschi di Pietralunga), in agreement with Johansson et al. ([26]) and Berg & McClaugherty ([3]). On the other hand, sites characterized by cold winter and hot summer (such as the regional Park of Monti Lucretili) exhibited a decay rate strongly affected by temperature extremes. In such locations, decomposition rates were reduced by cold winter and increased by warm summer, providing thus favorable conditions for the decomposers’ activity. Finally, sites characterized by mild winter, such as the Regional Park of Monti Picentini, were less affected by temperature, likely due to the rapid acclimation of soil microorganisms to temperature fluctuations along the season ([31]). Furthermore, mild winter temperature may lead to a rapid consumption of easy-decomposable resources before spring and, as a consequence, a deficiency of substrate suitable for decomposers ([13]). Indeed, in this study a high variability of the remaining mass in the litter bags was observed at the end of the experimental period. This was likely due to different local climatic conditions, which were caused by site-specific characteristics, thus affecting the decomposition rate of each litter bag.
The model proposed in this study proved to simulated quite accurately the early stage decomposition dynamic for Mediterranean mixed woods. Although the model was based on a consolidated approach, the time-based decomposition rates are a novel mathematical implementation. Notably, these equations were not site-specific and were applied indiscriminately to the all study sites.
Different local climates required different approaches for modeling the litter decomposition process, which is highly dependent on temperature in Mediterranean ecosystems. Moreover, by comparing the experimental litter mass loss to its model predictions (data not shown), we noticed that labile and recalcitrant litter components did respond differently to changes in the climatic conditions. Furthermore, the application of the decomposition model optimized for mixed woods of central Italy to the hot and dry site in Monte la Sauceda (Spain), allowed us to better focus on the most important aspects of the model in order to improve its performances under different environmental conditions. Despite the model overestimation of mass losses in the Q. suber litter at the validation site, simulated values did not exceed 10% of deviation from experimental data. Such discrepancy was likely stemming from unwanted physicochemical processes occurring in the litterbags, such as photodegradation, fragmentation induced by raindrop splash, soil erosion and runoff ([46], [12], [5]).
Conclusion
The decomposition model developed in this study is able to describe the early stages of leaf litter decomposition along a climatic gradient in the Mediterranean mixed woods using few important geo-climatic parameters. Despite some systematic deviations of predictions from observed data were detected, the model may represent an operational compromise between formal simplicity and satisfactory reliability of simulations, as demonstrated by the strong correlations between observed and predicted values. Although different local microclimates required different approaches for modeling the litter decomposition process, the model achieved can take into account the heterogeneity of the Mediterranean environment. Notably, the general time-based equations for modeling the decomposition rates resulted not site-specific, though derived from experimental data.
The litter decomposition model presented here will be next embedded in a process-based model for the quantification of carbon assimilation (photosynthesis) and autotrophic respiration, thereby allowing an assessment of the carbon balance for the considered forest ecosystem under different microclimates. The final aim is to provide forest managers with an important tool for assessing the effect of different managing activities on the carbon balance of forest ecosystems.
Acknowledgements
The authors wish to thank the Regional Agency for Development and Innovation of Agriculture of Lazio (ARSIAL) and the Campania Regional Council (A.G.C. Ecologia, Tutela Ambiente, C.I.A. Protezione Civile; Settore Programmazione interventi di Protezione Civile sul Territorio; Servizio 04) for providing climatic data. Furthermore, we are grateful to the staff of the Regional Parks of Monti Lucretili, Monti Picentini and Boschi di Pietralunga, and Dr G. Galante for their logistic support.
References
Gscholar
Gscholar
CrossRef | Gscholar
Online | Gscholar
Gscholar
Gscholar
Gscholar
Gscholar
Supplementary Material
Authors’ Info
Authors’ Affiliation
Flavia Savi
Fabio Attorre
Department of Environmental Biology, “Sapienza” University of Rome, p.le Aldo Moro 5, I-00185 Rome (Italy)
Department of Chemistry and Biology, University of Salerno, v. Giovanni Paolo II 132, I-84084 Fisciano (SA, Italy)
Corresponding author
Paper Info
Citation
Vitale M, Savi F, Baldantoni D, Attorre F (2014). Modeling of early stage litter decomposition in Mediterranean mixed forests: functional aspects affected by local climate. iForest 8: 517-525. - doi: 10.3832/ifor1202-007
Academic Editor
Giorgio Matteucci
Paper history
Received: Dec 13, 2013
Accepted: Aug 27, 2014
First online: Nov 18, 2014
Publication Date: Aug 02, 2015
Publication Time: 2.77 months
Copyright Information
© SISEF - The Italian Society of Silviculture and Forest Ecology 2014
Open Access
This article is distributed under the terms of the Creative Commons Attribution-Non Commercial 4.0 International (https://creativecommons.org/licenses/by-nc/4.0/), which permits unrestricted use, distribution, and reproduction in any medium, provided you give appropriate credit to the original author(s) and the source, provide a link to the Creative Commons license, and indicate if changes were made.

Web Metrics
Breakdown by View Type
Article Usage
Total Article Views: 58204
(from publication date up to now)
Breakdown by View Type
HTML Page Views: 47912
Abstract Page Views: 4001
PDF Downloads: 4726
Citation/Reference Downloads: 18
XML Downloads: 1547
Web Metrics
Days since publication: 4248
Overall contacts: 58204
Avg. contacts per week: 95.91
Article Citations
Article citations are based on data periodically collected from the Clarivate Web of Science web site
(last update: Mar 2025)
Total number of cites (since 2015): 2
Average cites per year: 0.18
Publication Metrics
by Dimensions ©
Articles citing this article
List of the papers citing this article based on CrossRef Cited-by.
Related Contents
iForest Similar Articles
Research Articles
Effects of stand age on litter quality, decomposition rate and nutrient release of Kazdagi fir (Abies nordmanniana subsp. equi-trojani)
vol. 13, pp. 396-403 (online: 03 September 2020)
Research Articles
Model-based assessment of ecological adaptations of three forest tree species growing in Italy and impact on carbon and water balance at national scale under current and future climate scenarios
vol. 5, pp. 235-246 (online: 24 October 2012)
Short Communications
Upscaling the estimation of surface-fire rate of spread in maritime pine (Pinus pinaster Ait.) forest
vol. 7, pp. 123-125 (online: 13 January 2014)
Research Articles
Tree biomass models for the entire production cycle of Quercus suber
vol. 18, pp. 38-44 (online: 28 February 2025)
Research Articles
Establishment of a planted field with Mediterranean shrubs in Sardinia and its evaluation for climate mitigation and to combat desertification in semi-arid regions
vol. 2, pp. 77-84 (online: 10 June 2009)
Research Articles
Distribution factors of the epiphytic lichen Lobaria pulmonaria (L.) Hoffm. at local and regional spatial scales in the Caucasus: combining species distribution modelling and ecological niche theory
vol. 17, pp. 120-131 (online: 30 April 2024)
Research Articles
Assessing the relative role of climate on litterfall in Mediterranean cork oak forests
vol. 11, pp. 786-793 (online: 14 December 2018)
Research Articles
Local ecological niche modelling to provide suitability maps for 27 forest tree species in edge conditions
vol. 13, pp. 230-237 (online: 19 June 2020)
Research Articles
Impact of the four-eyed fir bark beetle (Polygraphus proximus Blandf.) on coarse woody debris stock and carbon budget of fir forests in Central Siberia
vol. 19, pp. 209-218 (online: 08 June 2026)
Research Articles
No home-field advantage in upper Andean tropical forests despite strong differences in site environmental characteristics
vol. 17, pp. 286-294 (online: 27 September 2024)
iForest Database Search
Search By Author
Search By Keyword
Google Scholar Search
Citing Articles
Search By Author
Search By Keywords
PubMed Search
Search By Author
Search By Keyword


