Impact of the four-eyed fir bark beetle (Polygraphus proximus Blandf.) on coarse woody debris stock and carbon budget of fir forests in Central Siberia
iForest - Biogeosciences and Forestry, Volume 19, Issue 3, Pages 209-218 (2026)
doi: https://doi.org/10.3832/ifor4882-018
Published: Jun 08, 2026 - Copyright © 2026 SISEF
Research Articles
Abstract
In the boreal forests of Central Siberia, a marked increase in tree mortality caused by the invasive four-eyed fir bark beetle (Polygraphus proximus Blandf.) has raised concerns about its impact on forest carbon dynamics. This study aims to quantify changes in coarse woody debris (CWD) stocks and their associated carbon fluxes under different levels of beetle infestation. Using systematic field surveys across infestation gradients, we measured CWD accumulation and decomposition by component (snags, logs, and stumps). Our results show that CWD stocks varied significantly, ranging from 68.1 to 179.9 Mg ha-1, with the highest amounts observed in the most heavily infested areas. In particular, the proportion of carbon stored in snags increased with infestation severity. Furthermore, our analysis of decomposition rates based on empirical data indicates accelerated carbon dioxide emissions from CWD in severely damaged stands. These findings underline the substantial impact of bark beetle outbreaks on the carbon storage capacity of fir forests and highlight the need for management strategies that account for pest effects on forest carbon budgets. This study contributes to a better understanding of pest-induced changes in forest ecosystems and supports the refinement of carbon dynamics models for boreal forests.
Keywords
Forest Carbon Dynamics, Bark Beetle Impact, Boreal Forest Ecology, Coarse Woody Debris Dynamics, Decomposition Rate, Siberian Fir Ecosystems
Introduction
The boreal forests of Siberia are recognized as an important sink for atmospheric carbon ([45]). However, in recent decades, these forests have undergone substantial changes due to both direct forest management and increased natural disturbances, including forest fires and pest outbreaks ([34]).
A large proportion of the carbon stored in these forests is contained in tree stem biomass. Following tree mortality, stems are transferred to the coarse woody debris (CWD) pool, which includes standing dead trees (snags), fallen dead trees (logs), stumps, and coarse skeletal roots. Recently, the CWD pool and its associated carbon fluxes have been identified as among the least understood components of the forest carbon cycle. It has often been assumed that the low decomposition rate of dead wood does not contribute substantially to the atmospheric carbon dioxide flux. However, under conditions of high tree mortality due to forest disturbance, the CO2 flux from the biogenic decomposition of dead wood can become significant ([49]).
Investigating the dynamics of CWD stocks and associated carbon fluxes is therefore critical for assessing the carbon balance of pest-damaged forests. Mass tree mortality alters carbon-stock structure, and the combination of reduced photosynthetic activity and increased CO2 fluxes from CWD decomposition can significantly reduce carbon sequestration ([22]). While at global and regional scales, insect outbreaks may not play a critical role in the carbon budget ([38]) because affected areas represent a relatively small fraction of the total forest area, at local scales, pest-induced tree mortality can significantly increase carbon emissions to the atmosphere ([5]).
At the regional scale, the impact of an outbreak depends on the affected area and the amount of biomass mortality. The regional effect on the carbon budget is influenced by forest type, pest species, regional characteristics (e.g., forest area), disturbance severity, and stand age ([18]).
The four-eyed fir bark beetle (FFBB), Polygraphus proximus Blandf., a relatively new bark beetle of Far Eastern origin, has emerged as a dangerous pest of Siberian fir (Abies sibirica Ledeb. - [23]). Since its first detection outside its natural range 17 years ago, the beetle has spread widely across Siberia (including Krasnoyarsk and Altai Territories, Tomsk, Kemerovo and Novosibirsk Regions, the Republics of Altai and Khakassia, and the south-eastern Irkutsk Region). It is currently recorded in 18 administrative regions of the Russian Federation, from the Irkutsk Region and the Republic of Buryatia in the east ([10]) to the Ural regions (Udmurt Republic, Republic of Tatarstan, Sverdlovsk and Chelyabinsk Oblast, Perm Kray - [14], [28], [35]) and the Moscow Region ([11]). The pest has also spread into Kazakhstan ([25]).
Siberian fir (Abies sibirica Ledeb.), which is widespread in these regions, is highly susceptible to FFBB attack ([4]). The high aggressiveness of P. proximus and its association with phytopathogenic fungi allow populations to increase rapidly on weakened trees and subsequently attack healthy ones ([32], [43]). Previous studies have shown that when fir trees are densely infested, mortality occurs within the third or fourth year, with an annual mortality rate reaching up to 14%. As a result, entire Siberian fir stands could be converted into deadwood-dominated areas within just a few years.
In Russia, fir forests cover about 15 million hectares ([19]b), with a total timber volume of 2.26 billion m3 ([2]). Most of these forests lie outside the natural range of FFBB and are composed primarily of Siberian fir (A. sibirica), one of the most vulnerable species ([8]). These forests face a high risk of partial or total destruction by the pest in the coming years ([19]b). Observations at the Main Botanical Garden of the Russian Academy of Sciences in Moscow showed that the beetle is particularly attracted to fir species in the Balsamea section, including Palearctic species, such as A. sibirica, A. nephrolepis (Trautv.) Maxim., A. sachalinensis (F.Schmidt) Mast., etc., and North American species, such as A. balsamea (L.) Mill., A. lasiocarpa (Hook.) Nutt., A. fraseri (Pursh) Poir., etc. ([8], [4]). This suggests that forests dominated by these species are also at risk.
P. proximus is listed by the European and Mediterranean Plant Protection Organization (EPPO) as an A2 quarantine pest - species locally present in the EPPO region (EPPO A2 List). Although experimental assessments suggest a low infestation risk for European fir species, recent findings ([43]) indicate a discrepancy between host preference and colonization success of FFBB on Far Eastern firs and demonstrate its ability to develop on other coniferous species (spruce, pine, larch) common in Europe. This highlights the pest’s unpredictable host behavior and its potential phytosanitary risk ([17]). Moreover, there are currently no registered chemical or biological tools for controlling this pest’s populations (EFSA - [46]).
The objective of this study was to evaluate the dynamics of the CWD pool in fir forests infested by FFBB and to estimate its impact on the carbon balance of these ecosystems.
Materials and methods
Site description
The study was conducted in the Kemchug Uplands, in the Emelyanovsky and Kozulsky districts of Krasnoyarsk Territory, Central Siberia, Russia (55° 42′ - 56° 48′ N, 90° 54′ - 93° 06′ E).
The climate of the study area is classified as strongly continental. It is characterized by a wide annual temperature range (up to 34 °C based on monthly averages) and significant daily variation (12-14 °C). The mean annual air temperature is slightly above zero, at 0.5-0.6 °C. Mean annual precipitation ranges from 400 to 600 mm, with the majority falling during the summer months. The total sum of temperatures above 10 °C during the vegetation period is about 1520° - 1568°. The last frost typically occurs in May or June, while the first frost is recorded between mid-August and September. The frost-free period lasts on average 65-120 days ([3]).
Most hills in the region are covered by forests. In the central part, moist fir-spruce forests with some Siberian pine (Pinus sibirica) are widespread, forming dense and tall stands. The first dendrochronological evidence of FFBB activity in Krasnoyarsk Territory dates back to 1976 ([8]). In the Kozulsky district, bark beetle breeding centers had been active for at least seven years at the time of the study ([7]), while in the Emelyanovsky district, FFBB was first detected in 2011 ([6]).
The coarse woody debris inventory was conducted in 2012-2013 on four temporary experimental plots. In Emelyanovsky district, three experimental plots were established with different levels of FFBB damage: (i) low (less than 20% of trees affected, 56° 12′ N, 92° 16′ N); (ii) medium (about 50% affected, 56° 11′ N, 92° 11′ E); and (iii) high (over 95% affected, 56° 12′ N, 92° 16′ E). In the Kozulsky district, one plot (56° 12′ N, 91° 12′ E) was established in a stand with a medium level of damage. The mean stand age was 110 years in Emelyanovsky district and 80 years in Kozulsky district.
The overstory was dominated by Siberian fir (A. sibirica), with admixture of Siberian pine (Pinus sibirica Du Tour), spruce (Picea obovata Ledeb.), and birch (Betula pendula Roth.). The understory was diverse and well developed, including mountain ash (Sorbus sibirica Hedl.), bird cherry (Padus racemosa [Lam.] Gilib.), blackcurrant (Ribes glabellum ([Trautv. et Meyer] Hedl.), spirea (Spiraea media Franz Schmidt) and raspberry (Rubus idaeus L.) ([39]).
The soil of the plots was classified as dark grey soils (Grey-Luvic Phaeozems, WRB) in the Emelyanovsky district and as soddy-podzolic soils (Albic Retisol) in the Kozulsky district.
The main characteristics of the tree stands at the sample plots are presented in Tab. 1.
Tab. 1 - Tree stand characteristics on the sample plots. (1) Tree species: F - fir, SiP - Siberian pine, As - aspen (Populus tremula L.), B - birch.
| Sample plot |
District | Degree of damage |
Tree stand composition(1) |
Age group | Age class | DBH (cm) |
H (m) |
|---|---|---|---|---|---|---|---|
| E1 | Emelyanovsky | low (< 20%) | 9F1As+SiP | Mature and overmature | VI-VII | 16.4 | 13.8 |
| E2 | Emelyanovsky | medium (~50%) | 7F2B1SiP+As | Approaching maturity and mature | IV-VI | 19.3 | 19.0 |
| K3 | Kozulsky | medium (~50%) | 10F | Approaching maturity and mature | IV-VI | 21.8 | 22.8 |
| E4 | Emelyanovsky | high (> 70%) | 9F1As+SiP | Approaching maturity and mature | IV-VI | 18.8 | 17.1 |
Inventory and sampling of CWD on the sample plots
Sample plots of 25 × 25 m were established in representative forest areas. A full tree census was conducted on each plot, recording tree species, height, diameter at breast height (DBH), and the presence of FFBB damage.
In this study, coarse woody debris (CWD) was defined as all above- and below-ground woody debris with a diameter greater than 2.5 cm at the thin end. Structurally, the CWD pool was divided into three main groups: (i) snags - trees that have died but not fallen to the forest floor (standing or leaning on neighboring trees); (ii) logs - tree trunks or their parts, in various stages of decomposition, lying on the forest floor or within the litter layer; (iii) stumps - trunk remains less than 2 m in height, left by broken or felled trees.
Snags were counted in the same way as live trees throughout the entire plot, including species, height, DBH, and decay stage. Snags decay stages were classified according to the following criteria: “Stage 0” - recently dead trees with grey, yellow, or reddish-brown needles; “Stage 1” - needles absent, small branches preserved; “Stage 2” - needles and small branches absent, only large branches preserved; “Stage 3” - trunk with remnants of large broken branches; “Stage 4” - apical break ([20]). To monitor subsequent falls, snags were marked with moisture-resistant paint.
On each sample plot, logs and stumps were counted in two 10 × 10 m subplots. During the survey, tree species and decomposition class were recorded. For logs, the length and the diameters at both ends were measured; for stumps, the height and two diameters (at the cut or break level and at the root collar) were measured.
Decomposition classes for logs were defined as follows: “DC I” - wood solid, bark and branches intact; “DC II” - wood partially decomposed, bark peels easily, branches still present; “DC III” - wood almost fully decomposed, crumbling under light pressure, little bark and large branches remain ([26]). Stump decomposition classes were determined similarly.
Samples of live and dead wood (snags and logs) of different decomposition classes were collected for bulk density and carbon content analysis. Snags and logs were sampled as cross-sectional discs taken at different heights along the stem to account for variation in decomposition rates. At least five discs were collected per tree.
Bulk density and carbon content in wood
The bulk density of wood was measured for four sectors of each trunk slice. Each sample was oven-dried at 80 °C for 48-72 h to achieve constant weight. To measure volume, samples were coated with molten paraffin to prevent water absorption, then measured by the water displacement method ([33]).
Average wood density was calculated for each stem and then averaged by decomposition class. Total carbon content in live and dead wood samples was determined by the Anstett wet oxidation method, modified by Ponomareva and Nikolaeva ([36]).
Calculation of CWD stocks
The volume of logs and stumps (V, m3) was calculated using the formula for the volume of a truncated cone (eqn. 1):
where R1 and r2 are the radii at both ends of the stem or stump (m), and L is the length or height (m). Snag volume (V, m3) was calculated using tree basal area (TBA, m2) at breast height and total height (H, m -eqn. 2):
where DBH is the diameter of the trunk at breast height (m).
Stem volume was converted to dry mass using wood bulk density by decomposition class. Organic matter stock (Mg ha-1) was converted to carbon stock (Mg C ha-1), using the measured carbon concentration for live and dead wood.
Determination of the year of tree death and tree age
The year of fir tree death due to FFBB infestation was determined by cross-dating ([47]). Evidence of past infestation was identified by characteristic beetle markings in the sapwood. Saw cuts and wedges were taken at heights of 20-100 cm, and increment cores were extracted from both dead and living trees, avoiding those with extensive heart rot.
Wood samples were air-dried, polished with decreasing grit sandpaper, and scanned at 1200-4800 dpi. Ring widths were measured to 0.01 mm using CooRecorder® (Cybis Electronic & Data AB, Sweden) or WinDendro® (Regent Instruments, Canada).
Tree-ring series were dated using CDendro® (Cybis Electronic & Data AB, Sweden). Standard chronologies were established from living trees, and series from dead trees were aligned to maximize the T statistic (eqn. 3):
where n is the overlap length (years), and r is the Pearson’s correlation coefficient. The year of the last ring was taken as the year of death.
Tree age was determined by counting annual rings and cross-dating to account for missing rings. When ring counts were incomplete due to decay or inaccessibility, the missing number was estimated using the “arching” method in the ring measurement software.
Calculation of CWD decomposition rates and carbon fluxes
To determine snag decomposition rates and associated carbon fluxes, years of death were established for 9 snags in the Emelyanovsky District and 14 in the Kozulsky District. The Pearson’s correlation coefficient of cross-dated series was calculated using the leave-one-out method ([40]), with a threshold of r ≥0.4.
Wood density loss was determined from cross-sections taken at different heights (4-5 discs per tree). Mean wood density per snag was then used to calculate decomposition rates.
Decomposition of CWD was modeled using a first-order exponential function ([31] - eqn. 4):
where C0 is the initial carbon mass, k is the decomposition constant (in year-1), and t is time (in years).
Statistical analysis
Basic descriptive statistics (mean, standard deviation, σ; coefficient of variation, Vσ) were calculated in Microsoft Excel™ 2007. Data normality was tested using the Shapiro-Wilk test in STATISTICA® v. 10 (StatSoft Inc, Tulsa, OK, USA). When data were non-normally distributed, non-parametric methods were applied. Differences in CWD stock, wood density, and carbon content were evaluated using a two-sample t-test with unequal variances in MS Excel™.
Results and discussion
Wood density of live trees and coarse woody debris
To calculate wood biomass from stem volume data, the wood’s bulk density is required. The bulk density of live fir wood ranged from 0.368 to 0.428 g cm-3. The density of snag wood fell within the same range, varying from 0.355 to 0.411 g cm-3. Wood density decreased significantly for logs in DC II and DC III due to mass loss during decomposition.
The measured mean wood densities and their variability for living trees and CWD components are presented in Tab. 2. The mean wood density obtained for snags and logs in the early stage of decomposition (DC I) is consistent with the range reported for fir logs in the Tomsk Region (0.412 ± 0.37 g cm-3 - [24]).
Tab. 2 - Wood density of live trees and logs in different decomposition classes. (n): sample size; (σ): standard deviation, g cm-3; (Vσ): coefficient of variation, %.
| CWD component |
Decomposition class |
Wood density (g cm-3) |
n | σ | Vσ |
|---|---|---|---|---|---|
| Live wood | - | 0.413 | 13 | 0.029 | 7.06 |
| Logs | DC I | 0.414 | 6 | 0.041 | 9.91 |
| DC II | 0.319 | 7 | 0.045 | 14.20 | |
| DC III | 0.182 | 10 | 0.088 | 48.42 | |
| Snags | - | 0.375 | 108 | 0.027 | 7.20 |
CWD in fir forests with different levels of damage by the bark beetle P. proximus
The stock of CWD in the studied fir forests ranged from 68.1 to 179.9 Mg ha-1, depending on the degree of damage to the forest stand by the FFBB (Fig. 1a).
Fig. 1 - Amount (a) and composition (b) of CWD on plots with different levels of damage by P. proximus.
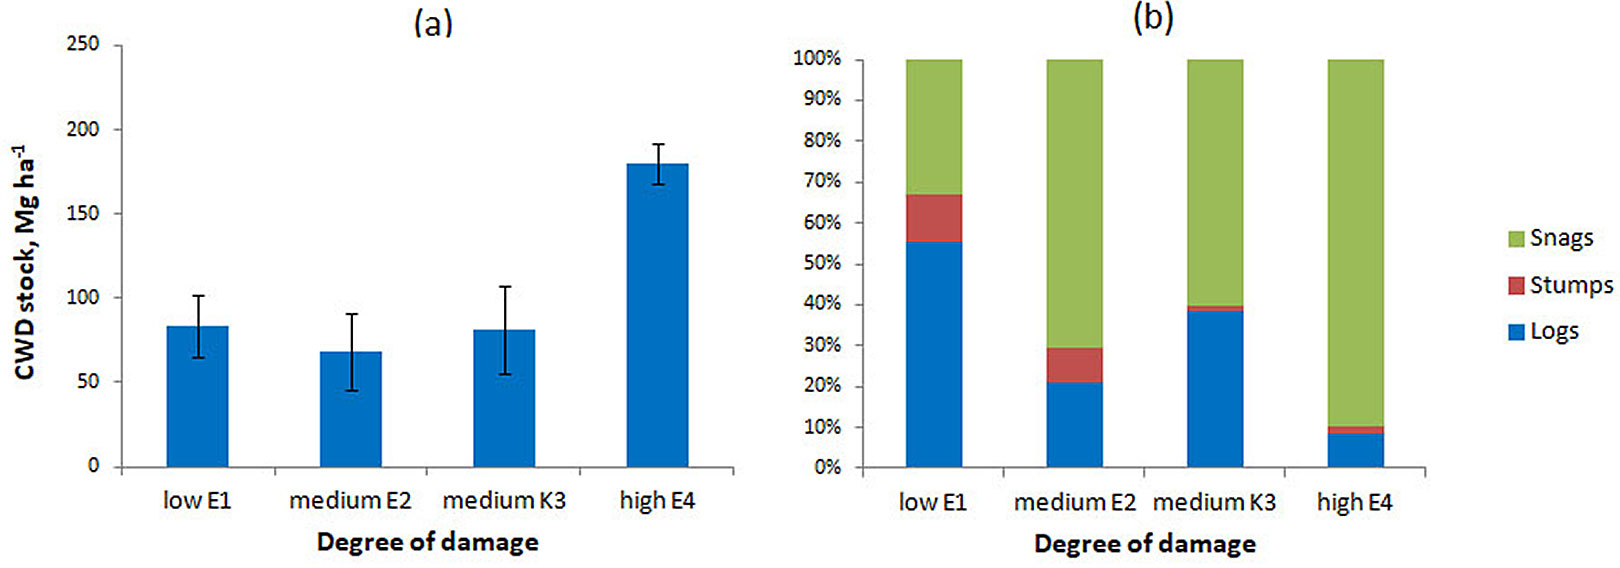
In the sample plot with low FFBB damage (E1), the CWD stock was 83.6 ± 18.1 Mg ha-1. The structure of this CWD stock consisted of 56.21% logs, 11.7% stumps, and 32.1% snags (Fig. 1b).
On the plots with medium damage (E2 and K3), the proportion of snags approximately doubled to 62%-73%, while the proportion of logs decreased to 19.5%-35.5%. The highest CWD stock (179.9 ± 12.1 Mg ha-1) was observed on the plot with severe damage, where more than 90% of the CWD consisted of snags.
The measured CWD stock on the plots with different levels of damage is comparable to that reported for fir forests affected by FFBB in the Larinsky Landscape Reserve, Tomsk Oblast (62-160 Mg ha-1 - [24]).
Carbon stock in CWD
Snags
In the sample plots with moderate and severe FFBB damage, almost all snags showed clear signs of bark beetle infestation, including pupal chambers extending into the sapwood and imprints of larval tunnels in the remaining bark.
The mean diameters of living and dead fir trees in plots E2 and K3 (medium disturbance) differed slightly: 10.09 ± 7.53 and 13.7 ± 7.36 cm for living and dead trees in E2, and 16.81 ± 8.46 and 14.35 ± 9.37 cm in K3, respectively. On the plot with low FFBB infestation (E1), the mean diameter of snags was almost half that of living trees (11.11 ± 7.53 and 20.18 ± 9.02 cm). This difference reflects the fact that weakened, small-diameter trees are the first to die when bark beetles colonize a stand. A similar pattern of outbreak development has been observed in P. proximus infestations in other regions, including Japan and Tomsk oblast ([42], [24]).
Based on the ratio of live to dead trees affected by the FFBB, we calculated the degree of stand damage for each plot (Tab. 2).
Snag biomass ranged from 26.49 to 164.54 Mg ha-1. The average carbon content of the stem wood of live fir trees was 55.76 ± 4.45% (Vσ = 7.98%, n = 5). In snags, carbon content ranged from 48.6% to 58.9%, with an average of 53.98 ± 3.03% (n =15). As no relationship was found between carbon content and tree diameter or snag age (see below), the mean carbon content was used in subsequent calculations.
Carbon stocks in snag wood increased systematically with increasing FFBB damage: from 14.30 Mg C ha-1 on the low-damaged plot to 88.85 Mg C ha-1 on the severely damaged plot (Tab. 2). In contrast, carbon stocks in living trees declined from 63.42 to 14.11 Mg C ha-1. These values for the less damaged plot are consistent with literature data on the native fir stand in the southern taiga. According to Koshurnikova ([27]), carbon stock in live fir stands ranges from 67.18 Mg C ha-1 in 90-year-old forests to 107.47 Mg C ha-1 in 170-year-old forests. Other studies report live tree stocks of 42-44 Mg C ha-1 in undisturbed mature fir stands and 11-14 Mg C ha-1 in moderately and severely damaged stands ([50]). Reported snag stock in the region is 6-7 Mg C ha-1 in undisturbed stands and 29-32 Mg C ha-1 in disturbed stands.
The proportion of snags in the total stand carbon pool increased from 18% to 86% with increasing stand damage (Tab. 3).
Tab. 3 - Percentage of bark beetle-killed firs in the stand and carbon stock in live trees and snags. (Perc. Snags): contribution of snags to the tree stand carbon stock (%).
| Sample plot |
Damage by FFBB (%) |
Live trees (Mg C ha-1) |
Snags (Mg C ha-1) |
Perc. Snags (%) |
|---|---|---|---|---|
| E1 | 15.8 | 63.42 | 14.30 | 18.40 |
| E2 | 44.6 | 50.58 | 28.60 | 36.12 |
| K3 | 56.3 | 39.60 | 29.40 | 42.61 |
| E4 | 96.2 | 14.11 | 88.85 | 86.30 |
Snag formation results directly from the mortality of living trees. In moderately disturbed plots (E2 and K3), the tree mortality rate over a four-year period was 23%, while the proportion of dead fir trees was 42%. The mean diameter of the dead trees (11.4 ± 7.54 cm) was about three times larger than that of living trees (4.7 ± 1.96 cm). Consequently, approximately 77% of the live wood stock was converted to dead wood within this period. Over the same period, the snag pool and the total CWD pool increased by 12.5 Mg C ha-1. Two dead trees (equivalent to 1.3 Mg C ha-1) transitioned from the snag pool to the log pool, resulting in a 39% increase in deadwood carbon over four years (Fig. 2a).
Fig. 2 - Carbon stock changes in snags in sample plots with moderate (a) and severe (b) damage by FFBB.
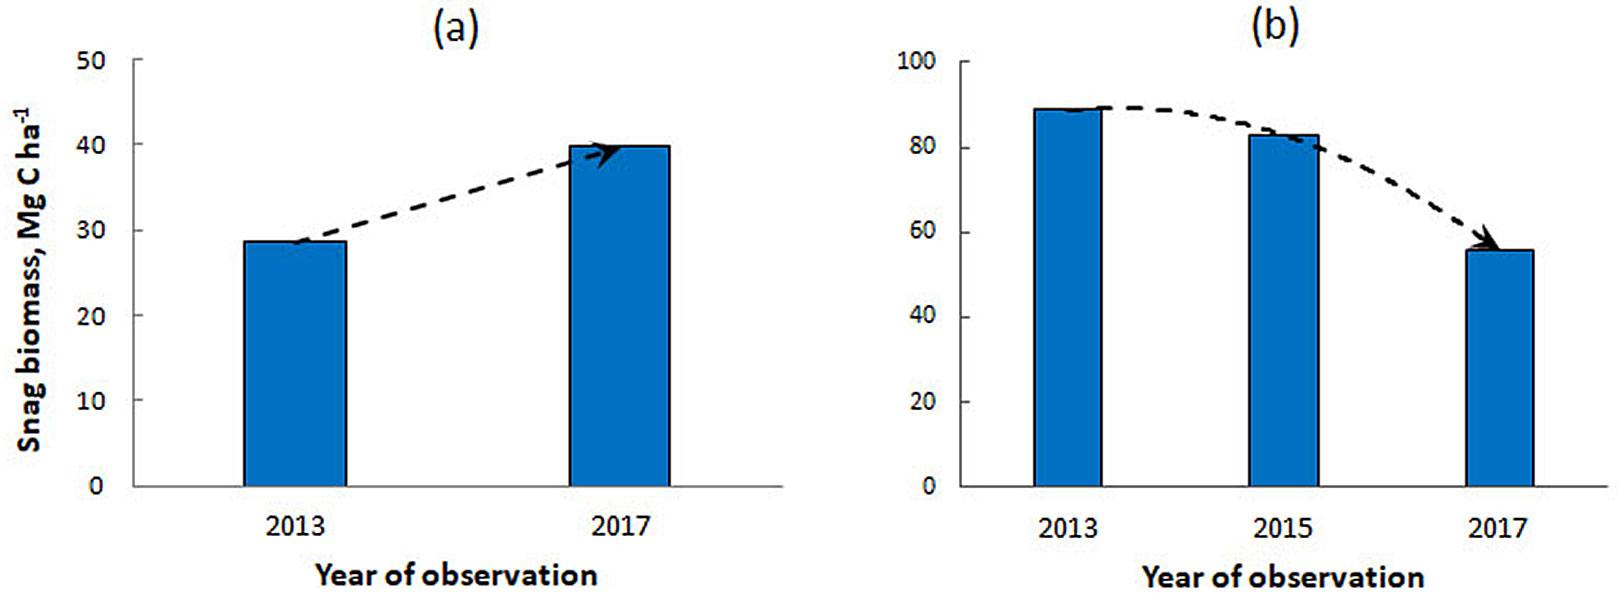
On the severely damaged plot (E4), where living fir trees were absent, snag dynamics were driven solely by the fall of standing dead trees and their transition into the log pool. More than 35% of the snags fell during the observation period, representing approximately 37% of the total snag stock (Fig. 2b). Snag loss was not uniform: up to 26% of snags fell during the second half of the four-year period.
After the tree’s death, wood undergoes decomposition that destroys tissues, releases carbon and mineral elements, reduces density, and causes a slight decrease in volume.
Cross-dating of mortality dates for 23 snag samples showed that the trees died between 1 and 19 years ago.
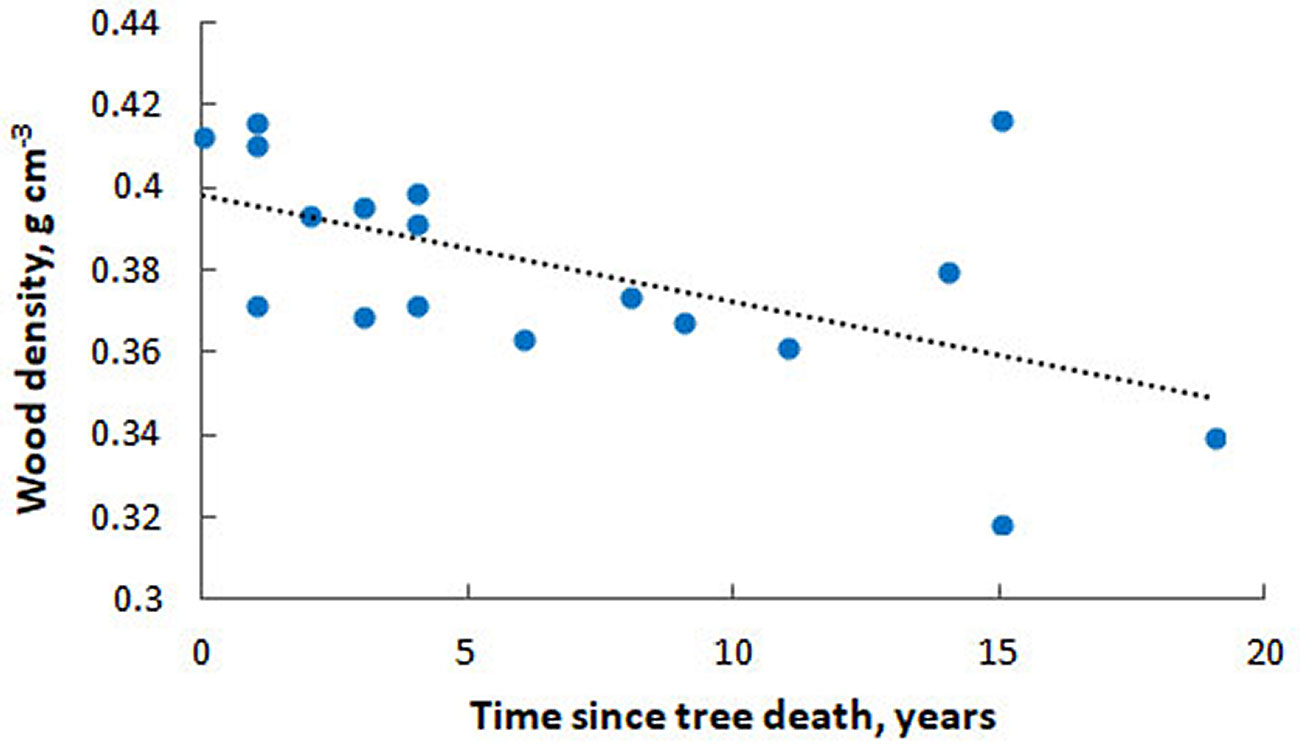
Analysis of snag wood density revealed a 17% loss of density over 19 years in the snag state. A significant negative linear correlation was found between snag age (time since tree death) and wood density (R = -0.57, p<0.05 - Fig. 3). The decomposition rate constant (k) derived from these data was 0.0069 yr-1, which is consistent with previous findings for fir forests in the southern taiga of the Krasnoyarsk region ([27]).
Fig. 3 - Dynamics of wood density as a function of time since tree dieback.
No significant relationship was found between cutting height and wood density, or between stem diameter and snag wood density (R2 = 0.07-0.15). Time since tree death and tree diameter also had no significant effect on the total carbon content of fir wood (Fig. S1 in Supplementary material).
Logs
After a snag falls to the ground, wood decomposition continues, resulting in a further natural decrease in wood density ([26]). Differentiating logs by decomposition class enables more accurate estimation of the organic carbon mass in dead wood within the study plots.
The decomposition classes of logs differ not only in the degree of morphological preservation but also in wood density (Tab. 2). The wood density of logs in the first decomposition class (DC I) was 0.414 ± 0.041 g cm-3, which was virtually indistinguishable from that of living fir. Transition to DC II was accompanied by a mass loss of up to 23%, with wood density decreasing to 0.319 ± 0.045 g cm-3. In DC III, the total mass loss exceeded 56%, and wood density declined to 0.182 ± 0.088 g cm-3. The highest variability in wood density was observed for DC III (48%), reflecting the high heterogeneity of logs in this class. The coefficients of variation for DC I and DC II were 9% and 14%, respectively.
On the low-damage plot (E1), most logs were in DC III (69.7%), while 27.6% were in DC II. On the moderate damage (E2), the proportions of DC II and DC III logs were approximately equal (45.5% and 43.5%, respectively). In the Kozulsky District plot (K3), 64.4% of logs were in DC II and 33.3% in DC III. Conversely, on the high-damage plot (E4), the vast majority of logs (90.8%) belonged to DC II (Fig. S2 in Supplementary material).
The total log stock in the sample plots ranged from 14.25 to 46.42 Mg ha-1 and showed no clear dependence on the degree of bark beetle damage. This likely reflects differences in stand age and disturbance history rather than current outbreak intensity. However, as shown above, an increase in the proportion of wood in DC II and a decrease in DC III were observed as bark beetle damage increased (Fig. S2).
It is likely that the pool of DC III logs with the highest stock on plot E1 accumulated prior to the FFBB outbreak. The subsequent increase in deadwood input following bark beetle colonization led to a higher share of poorly decomposed (DC II) logs.
The carbon concentration in dead fir wood ranged from 46.2% to 61.1%, with a mean of 52.03 ± 7.39%. It varied only slightly among decomposition classes: 54.40 ± 3.13% for DC I, 56.14 ± 4.51% for DC II, and 51.54 ± 3.60% for DC III (differences within standard error). These results are consistent with previous studies ([26], [24]). The total carbon stock in logs across the sample plots ranged from 7.15 to 24.68 Mg C ha-1 (Tab. 4).
Tab. 4 - Carbon stock in CWD components in the sample plots.
| Sample plot |
Carbon stock (Mg C ha-1) | |||
|---|---|---|---|---|
| Logs | Stumps | Snags | Totally | |
| E1 | 24.68 | 5.34 | 14.30 | 44.32 |
| E2 | 7.15 | 2.97 | 28.60 | 38.72 |
| K3 | 16.69 | 1.31 | 29.40 | 47.40 |
| E4 | 15.32 | 1.80 | 88.85 | 105.97 |
The log pool is replenished through the natural transition of snags into fallen wood. On the moderately damaged plots, this input amounted to 1.3 Mg C ha-1 over four years, equivalent to 16% of the initial carbon stock in the logs pool. On the severely damaged plot, log carbon increased by 33 Mg C ha-1 over the same period. As a result, the carbon pool in this plot increased by more than 200%, reaching 48.3 Mg C ha-1, and exceeded the log carbon pool on the low-damage plot by a factor of two.
Stumps
The total stump stock ranged from 2.35 to 9.65 Mg ha-1. On the low-damage plot, the majority of stumps belonged to decomposition class II (DC II - 83.11%), while DC III accounted for only 16.9%. On the moderately damaged plots, stump stocks were composed of 60.3%-95% DC II wood and 5%-39.7% DC III wood. On the high-damage plot, stumps consisted of 58.2% DC II and 41.8% DC III wood (Fig. S3 in Supplementary material).
The carbon stock in stumps ranged from 1.31 to 5.34 Mg C ha-1 (Tab. 4). The highest stump carbon stock was observed on the plot with low bark beetle damage. Across all sample plots, stump wood was represented exclusively by DC II and DC III, with DC II dominating (Fig. S3).
In stands disturbed by bark beetles, stumps are formed primarily from trees with broken trunks. This process contributed to the higher proportion of DC III stumps observed on the severely damaged plot, as trunk breakage occurs once the wood has become too decayed to support the vertical load of the stem - typically corresponding to the third decomposition class. On the moderately damaged plot, the input to the stump pool during the four-year observation period was 0.23 Mg C ha-1. Over the same period, the severely damaged plot received 1.59 Mg C ha-1. The average annual input rate to the stump pool was 1.9% of the existing stump stock on the moderately damaged plot and 25.4% in the severely damaged plot.
The total carbon reserves in coarse woody debris in fir forests disturbed by the FFBB ranged from 38.72 to 105.97 Mg C ha-1. These reserves were similar between plots with low and moderate damage, but increased sharply in the severely damaged plot due to a catastrophic accumulation of deadwood (Tab. 4).
In these ecosystems, CWD represents a major carbon pool. In stands with moderate bark beetle damage, CWD carbon stocks were comparable to the carbon stored in living trees, whereas in severely damaged stands, they were more than seven times greater than the carbon pool in living wood (Tab. 2).
Carbon fluxes from decomposition of CWD stock in forests damaged by P. proximus
In the carbon balance of forest ecosystems, CWD acts as a reservoir of organic matter and a source of carbon for fungi and microorganisms. Once wood dies, it undergoes decomposition, releasing carbon dioxide into the atmosphere.
To estimate potential carbon fluxes from CWD decomposition in the study area, experimentally derived and literature-reported decomposition rate constants were used. The decomposition rate constant for snags (k = 0.0069 yr-1) is nearly identical to that reported for deadwood in 90-170-year-old native fir forests of the southern taiga (k = 0.006 yr-1 - [27]). The same study also reported the same value for logs. However, decomposition rates of snags and logs differ because downed logs, being in contact with the litter or soil surface, experience more favorable moisture conditions for microbial activity ([30]). According to estimates from other studies in the middle taiga of Russia and from our research in the mountain taiga-fir forests of southern Siberia, the decomposition constant for logs ranges from 0.025 to 0.059 yr-1 ([21], [44], [48], [29]). Therefore, the value of k = 0.025 yr-1 was used to calculate carbon fluxes from logs. For stump wood, a decomposition constant of k = 0.004 yr-1 was applied ([27]).
The carbon flux from log decomposition was estimated to range from 0.18 to 0.61 Mg C ha-1 yr-1. The highest flux was observed on the E1 plot (least affected by the bark beetles - Tab. 5), reflecting the high initial stock of logs accumulated prior to the FFBB outbreak. Conversely, the E2 plot exhibited the lowest flux (0.18 Mg C ha-1 yr-1).
Tab. 5 - Carbon fluxes during decomposition of CWD in the sample plots.
| Sample plot |
Carbon flux during decomposition (Mg C ha-1 year-1) | |||
|---|---|---|---|---|
| Logs | Stumps | Snags | Totally | |
| E1 | 0.61 | 0.02 | 0.10 | 0.73 |
| E2 | 0.18 | 0.01 | 0.19 | 0.38 |
| K3 | 0.41 | 0.01 | 0.20 | 0.61 |
| E4 | 0.38 | 0.01 | 0.59 | 0.98 |
The carbon flux from stump decomposition ranged between 0.01 and 0.02 Mg C ha-1 yr-1, with the highest value also observed on plot E1. The carbon flux from snag decomposition increased with the degree of damage: from 0.10 Mg C ha-1 yr-1 on the low-damage plot (E1) to 0.59 Mg C ha-1 yr-1 on the high-damage plot (E4 - Tab. 5).
Overall, the lowest total CWD decomposition flux was recorded on the moderately damaged plot E2 (0.38 Mg C ha-1 yr-1 - Tab. 5). This value is consistent with those reported by Koshurnikova ([27]) for southern taiga fir forests, where fluxes were 0.36 Mg C ha-1 yr-1 in 90-year-old stands and 0.41 Mg C ha-1 yr-1 in 170-year-old stands.
On plot E1, 83% of the total carbon flux originated from log decomposition, whereas on plot E2, logs and snags contributed equally. The highest total carbon flux was observed on the severely damaged plot (E4) at 0.98 Mg C ha-1 yr-1, with snags accounting for about 60% of this flux, despite their lower decomposition rate than logs.
The mortality of fir trees affected by bark beetles over a four-year period on moderately damaged plots increased carbon flux to the atmosphere from CWD decomposition by approximately 30%, reaching 0.50 Mg C ha-1 yr-1. On the severely damaged plot, the transition of snags into the log pool over the same period led to a 60% increase in flux, from 0.98 to 1.57 Mg C ha-1 yr-1. Thus, annual carbon emissions increased by an average of 7.5% in moderately damaged stands and by 15% in severely damaged stands.
These elevated flux rates are expected to persist only temporarily. In moderately damaged stands, this phase is likely to continue until most trees have died, whereas in severely damaged stands, it will last until the snag pool has fully transitioned into the log pool. This transition from moderate to severe disturbance is associated with a twofold increase in the rate of carbon release to the atmosphere.
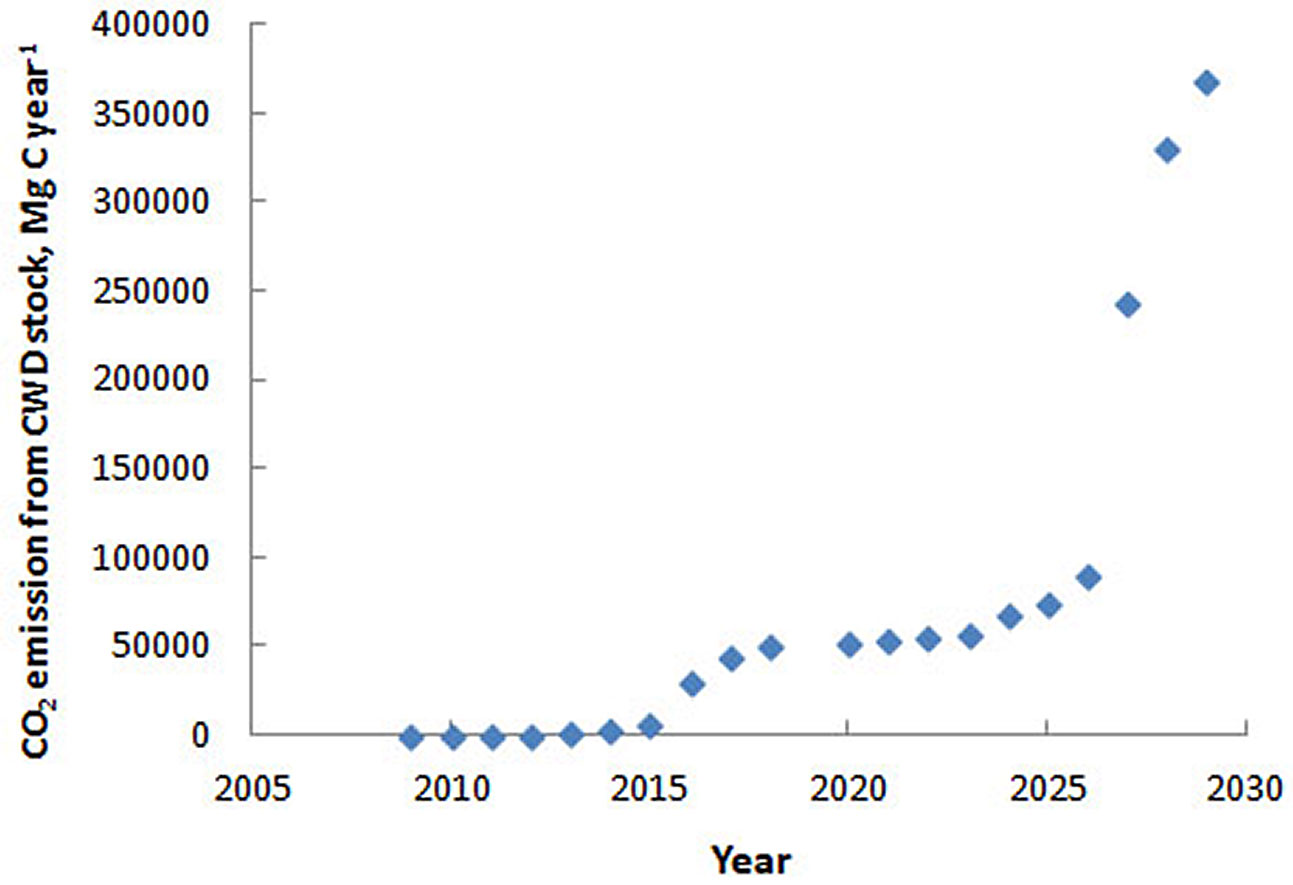
According to Gninenko & Klyukin ([19]), fir forest mortality caused by P. proximus in Russia can reach 5.000 ha yr-1. However, in the Krasnoyarsk region alone, expedition and satellite monitoring by the Krasnoyarsk Center of Forest Health recorded that the FFBB outbreak affected 540.000 ha of fir forests over nine years, expanding at an average rate of 60.000 ha yr-1 ([41]).
Assuming an average carbon stock of 85 Mg C ha-1 in fir biomass (range: 70-100 Mg C ha-1 - [27]), the annual carbon flux associated with tree mortality and snag formation in the region was estimated at 264 Mg C yr-1 in 2009 and 59.554 Mg C yr-1 in 2018. Previous studies ([1]) indicate that the average snag residence time is about five years, after which most snags fall and enter the log pool. This transition is accompanied by a more than threefold increase in decomposition rates, suggesting that regional carbon fluxes will further intensify as snags continue to fall (Fig. 4).
Fig. 4 - Predicted carbon release from CWD stocks in fir forests in the area damaged by Polygraphus proximus, calculated based on the data from [41]).
Modeling the dynamics of carbon fluxes in fir forests after damage by the FFBB
Edburg et al. ([15]) proposed a conceptual model describing the development of a mountain pine beetle (Dendroctonus ponderosae) outbreak, distinguishing four stages with characteristic biogeophysical and biogeochemical features. This framework can be applied to fir forests affected by the FFBB, since stands progress through comparable stages: initial damage to the vascular system of trees (“green attack”), death of infested trees marked by red needles (“red attack”), mass accumulation of dead wood (“grey attack”), and the eventual loss of deadwood accompanied by gradual stand regeneration. The duration of each stage varies under the conditions of the southern taiga of Central Siberia.
The sample plots examined in this study correspond to the following stages: Stage 1 - low bark beetle disturbance; Stage 2 - moderate bark beetle disturbance; Stage 3 - severe bark beetle disturbance.
To assess the invader’s influence on forest carbon dynamics, it is essential to estimate both the duration of each stage and the carbon balance trajectories for each stage. The total ecosystem carbon stock includes multiple pools - living biomass (woody and herbaceous), litter, coarse woody debris, and soil organic matter - each with distinct properties and turnover rates. The present analysis focuses on the woody component, especially the stem wood, which represents a major carbon pool.
Conceptual framework
For modeling purposes, it is useful to consider the stages and their duration both at the individual tree and stand (ecosystem) levels: (1) “Green attack” - vascular system disruption, decline of tree vigor, and early mortality of small trees. (2) “Red attack” - active transfer of carbon from live biomass to deadwood pools. (3) “Grey attack” - loss of snags and dominance of decomposition processes. (4) Stand recovery - regrowth and reestablishment of carbon accumulation.
Green attack stage
At this stage, bark beetle activity disrupts phloem transport, reducing photosynthetic assimilation in infested trees ([15]). A decline in radial growth was documented during the last growing season of attacked trees ([8]).
At the ecosystem level, this stage is characterized by the death of weakened trees in the lower canopy ([8], [12], [42]). Because early mortality primarily affects small trees, the carbon flux into the CWD pool remains minimal. Reported tree mortality rates are around 5% of living trees per year, equivalent to 0.75% of live stand carbon, lower than the background mortality in undisturbed stands (1.2%-3.2% per year - [27]). In the early outbreak period in Kozulsky District, the input to the deadwood pool was as low as 0.25% per year ([16]). A portion of standing dead trees also falls during this stage, contributing to the log pool at a rate of ~4.5% per year, comparable to values reported for the Tomsk Region ([9]).
During this period, changes in the carbon budget of the wood pool will primarily result from reduced carbon accumulation in the wood of living trees, accompanied by a slight increase in carbon flux released from the CWD stock that existed prior to the bark beetle outbreak.
The duration of this stage for individual trees is ~3 years, the time required for FFBB and its associated fungi to kill the host ([28]). At the stand level, visible mortality of dominant layer trees typically begins 3-4 years after infestation. However, since the bark beetle initially attacks weakened fir trees in the second canopy layer, which are not critical for timber volume, this process will not initially have a significant impact on the appearance or functioning of the ecosystem. It is only when the number of dead trees exceeds a certain threshold that the outbreak transitions to the next stage. Physiognomically, this transition is likely to become apparent when the massive mortality begins in the upper canopy layer (i.e., when the “red attack” reaches the top). The mortality of the upper layer already represents a substantial proportion of the stand’s woody biomass. This period may last 10-20 years, reflecting the interval between initial colonization and mass tree mortality ([8]).
Red attack stage
The “red attack” stage corresponds to the active transfer of carbon from live trees to the deadwood pools.
For an individual tree, this period ranges from several months for thin, weakened trees to 2-3 years for large, healthy trees. At the stand level, the duration of this period is extended due to the gradual spread of infestation from small to large trees ([8], [13], [42]).
The transition of the entire fir stand into the CWD pool may take up to 35 years ([8]). The onset of mass tree mortality due to bark beetle damage was observed 20-26 years after the first tree’s dieback, with maximum mortality typically occurring ~30 years after initial infestation. Within the period of mass mortality, a near-linear increase in dieback was observed ([8]).
Reported annual mortality rate during this stage ranges from 7.5% to 14% ([9], [28]). Over four years of observation on moderately damaged plots, the mortality rate of living trees was 10.5% per year, corresponding to 19.25% of the total fir stand biomass. Unlike the mountain pine beetle, in which the “red attack” stage lasts only a few months ([15]), the FFBB outbreak has an extended mortality window, leading to overlapping processes: tree death, snag formation, and the transition of snags into logs. Over four years of observation, the snag-to-log transfer rate was 1.16% of snags per year, equivalent to 0.42% of carbon in standing trees.
Decomposition begins immediately after the tree’s death. Snag decomposition rates averaged 0.68% yr-1 during the first 10 years, decreasing to 0.63% yr-1 during the next 10 years. Log decomposition rates averaged 2.3% yr-1 during the first 5 years, then declined by 11.75% in each subsequent 5-year period.
During this stage, photosynthetic assimilation of atmospheric carbon and its accumulation in wood continue, and in some cases, the growth of other tree species increases due to canopy opening and competition for soil resources ([37], [13]). For example, in severely degraded stands, the growth of Siberian pine (measured by an increase in annual ring width) may increase by 21%-78% ([13]).
Within about 10 years, most living fir trees are expected to have transitioned into the deadwood pool, marking the shift to the “grey attack” stage.
When considering only the woody component of forest ecosystems, the principles for distinguishing between “red” and “grey” outbreak stages differ from those proposed in the conceptual model of Edburg et al. ([15]). This distinction arises because the shedding of dead needles has little effect on the qualitative and quantitative characteristics of the woody component or on the dynamics of its decomposition. In contrast, the transition of tree trunks from standing dead trees (snags) to fallen logs fundamentally alters the conditions for wood decomposition. Standing dead trunks are strongly affected by wind-induced drying, whereas contact between fallen logs and the soil surface or litter modifies the wood’s hydrothermal regime, promoting more active colonization by wood-decomposing organisms. Therefore, we assign the entire dying period of the fir stand to the “red attack” stage and logically designate the period during which snags fall from the tree layer to the “grey attack” stage.
Grey attack stage
The “grey attack” stage is characterized by the absence of living fir trees, gradual loss of snags and their transition into the log pool, and increased growth of remaining non-fir species.
For each individual tree, this period equals the duration of the standing snag. According to published data, the average snag residence time is about 5 years ([1]).
At the stand level, the snag-to-log transition is non-linear (Fig. 2b); as snag stocks increase, fall rates accelerate, reflecting prior mortality dynamics. Assuming an average lifespan of five years for snags, it can be inferred that most trees entering the log pool in year n died approximately five years earlier (in year n-5). If, during this period, tree mortality increased significantly compared to the preceding years - as shown by changes in mortality rate of living trees during outbreak development ([8]) - it is plausible to hypothesize that the loss of deadwood five years later will be greater than in the previous year.
Observed annual snag loss averaged 9.25%, corresponding to 53.5% of the initial log stock. Similar rates (7%-10% yr-1) were observed during a 12-year study in the Tomsk Region ([24]).
Concurrently, carbon is released from existing deadwood reserves. Assuming that the decomposition rates of snags and logs remain constant, the intensity of carbon fluxes from each of these CWD pools will vary with changes in their respective stocks. As the snag pool diminishes, the carbon flux from it will correspondingly decrease, while the expansion of the log pool during this period will be accompanied by an increase in the intensity of the carbon flux from that component. This transition is accompanied by a 3.6-fold increase in decomposition rates. As the snag pool declines, fluxes from snags decrease, while fluxes from logs increase. Total CWD decomposition fluxes were estimated to increase by ~32% per year during this stage.
At the stand level, the duration of the “grey attack” phase will depend on the rate of snag loss. At an average loss rate of 9.25% yr-1, the grey attack stage may last ~11 years.
Simultaneously, stand recovery begins as residual trees and new recruits grow.
Stand recovery stage
In the recovery phase, carbon accumulation is driven by regrowth of fir saplings and other tree species, while decomposition of existing deadwood continues.
Fir dominates the undergrowth, with sporadic regeneration of Siberian pine, spruce, and Scots pine. Viable fir seedling density is 6.6-15.6 thousand ha-1 ([39]), but large saplings are scarce in severely affected plots due to high FFBB attack rates on regeneration. A high proportion of bark beetle attacks on fir undergrowth (up to 64-80%) has also been observed in the fir forests of the Tomsk region ([28]). Consequently, the undergrowth in these forests is expected to play a negligible role in wood accumulation during forest restoration. Even accounting for annual sapling growth of 12% ([12]), the wood carbon increment is minimal (0.5-2.0 kg C ha-1 yr-1), less than 0.2% of the annual carbon release from CWD decomposition.
The time required to lose 90% of the mass of fir logs has been estimated at approximately 92 years, based on the calculated decomposition rate constant. Over this period, the flux of carbon released will gradually decline due to two primary factors: (i) a reduction in the total stock of dead wood, and (ii) a progressive decrease in the decomposition rate. During the initial 28 years, approximately 50% of the total carbon stock in dead wood is expected to be lost, corresponding to an average annual loss rate of 1.8%. Over the subsequent 64 years, the remaining 40% of the carbon mass will be released from the logs with an average rate of loss about three times lower (0.63% per year). Consequently, the carbon flux from logs formed as a result of bark beetle activity will show a gradual decline - initially by roughly twofold within the first 28 years, and then by an additional threefold, corresponding to a tenfold decrease in the log stock and a threefold decrease in decomposition rate, compared with the early years of this phase. The mean annual rate of decline in this flux is estimated at 2.47% yr-1. At this rate of decomposition, it would take approximately 50-60 years for the log stock to reach levels typical of an undisturbed forest stand.
In a young tree stand reestablished in an area disturbed by the bark beetles, the natural loss of trees in the new generation will not be significant during the first years. This is because the remaining large trees of the upper canopy layer, which in these ecosystems account for 14% to 42% of the total wood stock, will die at a rate typical of natural forest stands, i.e., about 1.2% per year ([27]). The understory trees, which die through natural selection, are small in both size and biomass and therefore do not significantly affect the deadwood stock in these ecosystems.
Carbon budget implications
If the total carbon stock in live and dead wood of an undisturbed fir forest is taken as 100%, then the relative contributions of carbon pools and fluxes during an FFBB outbreak can be schematically represented (Fig. 5): (i) in undisturbed forests, wood production exceeds decomposition fluxes by a factor of >10; (ii) during the “green attack” stage, production surpasses decomposition by a factor of ~3; (iii) during the “red attack” stage, production still dominates but only by 2-2.5 times; (iv) in the “grey attack” stage, decomposition exceeds wood production by up to a factor of 2-2.5. This calculation includes the potential increase in the undergrowth’s wood mass or the growth rate of other tree species.
Fig. 5 - Relationship between carbon pools and fluxes in the above-ground woody component of a fir forest following an outbreak of P. proximus. Stages of stand condition: 0 - undisturbed stand; 1 - “’green attack”; 2 - “red attack”; 3 - “grey attack”; 4 - stand recovery stage.
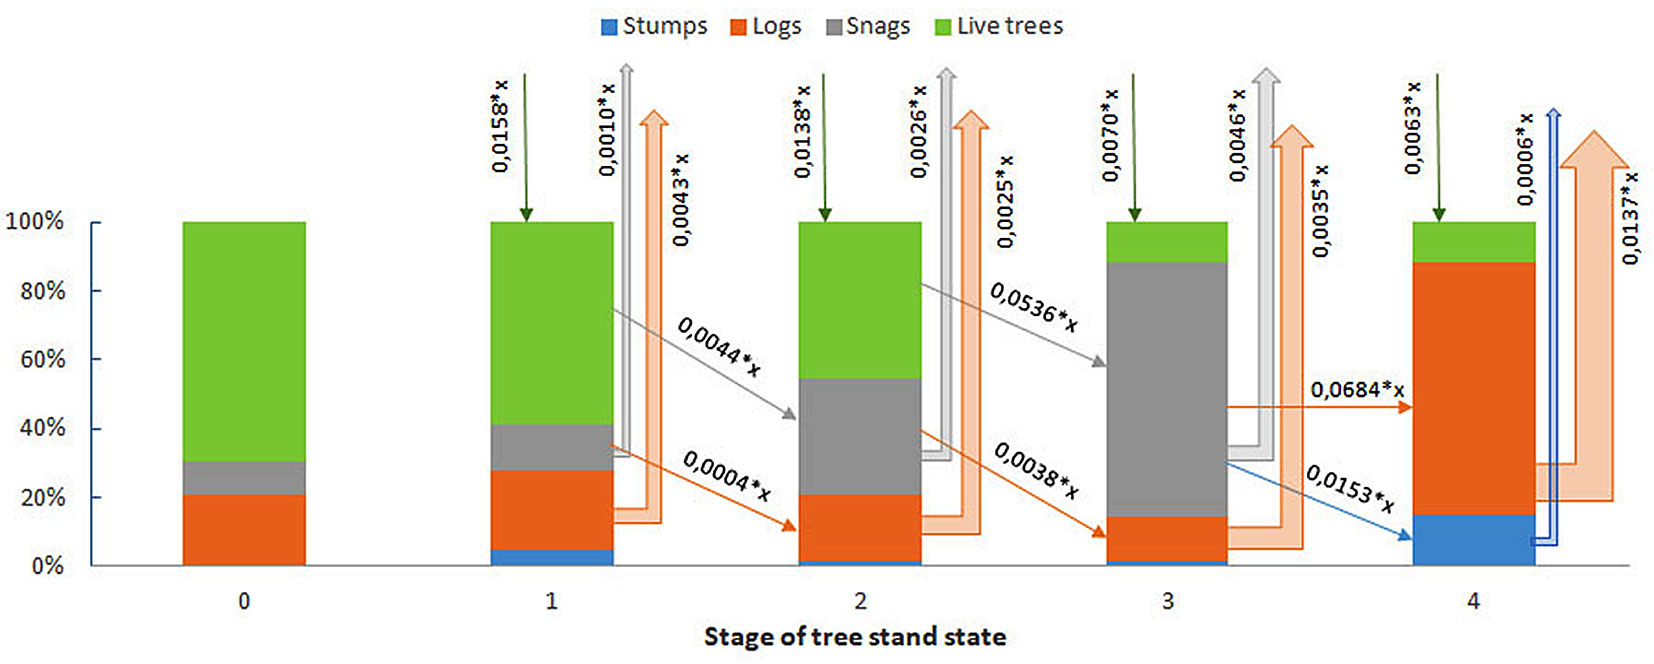
The imbalance between carbon accumulation and decomposition can persist for 10-15 years, even with healthy undergrowth. It is evident that the activity of the FFBB causes substantial disruptions to the carbon budget of the woody component of fir forest ecosystems. During the colonization and outbreak phases, these disturbances are not yet critical, as forest ecosystems continue to accumulate carbon in woody biomass, albeit at a reduced rate compared to undisturbed stands. However, more severe imbalances in the carbon cycle occur following widespread mortality of fir trees due to bark beetles. The transition of dead stems from the snags to the log pool markedly increases the flux of released carbon, which begins to exceed the accumulation of assimilated carbon in the ecosystem’s wood pool. The predominance of decomposition over production processes can persist for more than a decade after the outbreak subsides, even in the presence of sufficient viable undergrowth. The effect of deadwood resulting from FFBB activities on the carbon budget of these ecosystems is expected to persist for more than 50 years.
This sequence of events is likely generic for pest-induced stand-replacing disturbances, although the duration of outbreak stages and magnitude of carbon imbalance will depend on pest biology, tree species characteristics, and site conditions.
Conclusions
As damage from the four-eyed fir bark beetle (P. proximus) increases, coarse woody debris stock more than doubles. In the early stages, this increase is driven mainly by the growth of the snag pool; with severe infestation, mass tree mortality causes a sharp escalation of total woody debris. These shifts substantially increase carbon fluxes to the atmosphere.
At the same time, the number of living trees central to the production side of the forest carbon cycle declines markedly in disturbed stands, creating a pronounced imbalance between production and decomposition.
Because the outbreak stages exhibit distinct structural signatures, stage-specific carbon parameters can be used to interpret regional carbon budgets in Siberian forests from ground observations and remote sensing.
This study analyzed inputs and outputs of the above-ground woody carbon pool, which is especially vulnerable to dendrophilous pests such as the FFBB. To quantify the full carbon budget response, further work should assess other components affected by dieback of the tree stand: forest floor and soil organic matter, below-ground biomass and root decomposition, and changes in understory and ground vegetation driven by canopy opening and altered microclimate. Only by integrating these elements can we evaluate the full impact of FFBB outbreaks on the ecosystem functions of Siberian fir forests.
Acknowledgments
Thiswork was funded by the State Assignment of the Ministry of Science and Higher Education of the Russian Federation FW ES-2024-0023 (Theme no. 12401290055 8-7).
Authors’ contributions
L.M. and Yu.B. conceived and designed the study; L.M., O.S., and L.K. carried out the field measurements; D.D. performed the cross-dating of wood samples; O.S. carried out the wood density and carbon content measurements; L.M. and O.S. conducted the calculations and statistical analysis; L.M. drafted the manuscript. All authors contributed to editing.
References
Gscholar
Gscholar
Gscholar
Gscholar
Gscholar
Gscholar
Gscholar
Gscholar
CrossRef | Gscholar
Gscholar
Gscholar
Gscholar
Gscholar
Gscholar
CrossRef | Gscholar
Gscholar
CrossRef | Gscholar
Gscholar
Gscholar
CrossRef | Gscholar
Gscholar
Gscholar
Gscholar
Gscholar
Authors’ Info
Authors’ Affiliation
Denis Demidko 0000-0001-6538-9828
Leonid Krivobokov 0000-0003-4105-6281
Yury Baranchikov 0000-0002-2472-7242
V.N. Sukachev Institute of Forest SB RAS, Federal Research Center “Krasnoyarsk Science Center SB RAS”, Krasnoyarsk, 660036 (Russian Federation)
Siberian Federal University, Krasnoyarsk, 660041 (Russian Federation)
Corresponding author
Paper Info
Citation
Mukhortova L, Sergeeva O, Demidko D, Krivobokov L, Baranchikov Y (2026). Impact of the four-eyed fir bark beetle (Polygraphus proximus Blandf.) on coarse woody debris stock and carbon budget of fir forests in Central Siberia. iForest 19: 209-218. - doi: 10.3832/ifor4882-018
Academic Editor
Matteo Marchioro
Paper history
Received: Apr 15, 2025
Accepted: Dec 06, 2025
First online: Jun 08, 2026
Publication Date: Jun 30, 2026
Publication Time: 6.13 months
Copyright Information
© SISEF - The Italian Society of Silviculture and Forest Ecology 2026
Open Access
This article is distributed under the terms of the Creative Commons Attribution-Non Commercial 4.0 International (https://creativecommons.org/licenses/by-nc/4.0/), which permits unrestricted use, distribution, and reproduction in any medium, provided you give appropriate credit to the original author(s) and the source, provide a link to the Creative Commons license, and indicate if changes were made.

Web Metrics
Breakdown by View Type
Article Usage
Total Article Views: 874
(from publication date up to now)
Breakdown by View Type
HTML Page Views: 211
Abstract Page Views: 364
PDF Downloads: 256
Citation/Reference Downloads: 1
XML Downloads: 42
Web Metrics
Days since publication: 53
Overall contacts: 874
Avg. contacts per week: 115.43
Article Citations
Article citations are based on data periodically collected from the Clarivate Web of Science web site
(last update: Jul 2026)
(No citations were found up to date. Please come back later)
Publication Metrics
by Dimensions ©
Articles citing this article
List of the papers citing this article based on CrossRef Cited-by.
Related Contents
iForest Similar Articles
Research Articles
Decomposition of Norway spruce and European larch coarse woody debris (CWD) in relation to different elevation and exposure in an Alpine setting
vol. 9, pp. 154-164 (online: 28 August 2015)
Research Articles
Long-term effects of single-tree selection cutting management on coarse woody debris in natural mixed beech stands in the Caspian forest (Iran)
vol. 10, pp. 652-658 (online: 20 June 2017)
Research Articles
A bark beetle infestation predictive model based on satellite data in the frame of decision support system TANABBO
vol. 13, pp. 215-223 (online: 06 June 2020)
Research Articles
Post-fire effects and short-term regeneration dynamics following high-severity crown fires in a Mediterranean forest
vol. 5, pp. 93-100 (online: 30 May 2012)
Research Articles
Assessment of the protective function of forests against debris flows in a gorge of the Slovenian Alps
vol. 8, pp. 73-81 (online: 17 June 2014)
Research Articles
Determination of differences in temperature regimes on healthy and bark-beetle colonised spruce trees using a handheld thermal camera
vol. 14, pp. 203-211 (online: 02 May 2021)
Research Articles
Historical fire ecology and its effect on vegetation dynamics of the Lagunas de Montebello National Park, Chiapas, México
vol. 14, pp. 548-559 (online: 01 December 2021)
Research Articles
Ecological factors affecting the recent Picea abies decline in Slovenia: the importance of bedrock type and forest naturalness
vol. 16, pp. 105-115 (online: 29 March 2023)
Research Articles
Amount and distribution of coarse woody debris in pine ecosystems of north-western Spain, Russia and the United States
vol. 7, pp. 53-60 (online: 28 October 2013)
Research Articles
Contribution of legume and non-legume trees to litter dynamics and C-N-P inputs in a secondary seasonally dry tropical forest
vol. 15, pp. 8-15 (online: 13 January 2022)
iForest Database Search
Google Scholar Search
Citing Articles
Search By Author
Search By Keywords


