A bark beetle infestation predictive model based on satellite data in the frame of decision support system TANABBO
iForest - Biogeosciences and Forestry, Volume 13, Issue 3, Pages 215-223 (2020)
doi: https://doi.org/10.3832/ifor3271-013
Published: Jun 06, 2020 - Copyright © 2020 SISEF
Research Articles
Abstract
The European spruce bark beetle Ips typographus L. causes significant economic losses in managed coniferous forests in Central and Northern Europe. New infestations either occur in previously undisturbed forest stands (i.e., spot initiation) or depend on proximity to previous years’ infestations (i.e., spot spreading). Early identification of newly infested trees over the forested landscape limits the effective control measures. Accurate forecasting of the spread of bark beetle infestation is crucial to plan efficient sanitation felling of infested trees and prevent further propagation of beetle-induced tree mortality. We created a predictive model of subsequent year spot initiation and spot spreading within the TANABBO decision support system. The algorithm combines open-access Landsat-based vegetation change time-series data, a digital terrain model, and forest stand characteristics. We validated predicted susceptibility to bark beetle attack (separately for spot initiation and spot spreading) against beetle infestations in managed forests in the Bohemian Forest in the Czech Republic (Central Europe) in yearly time steps from 2007 to 2010. The predictive models of susceptibility to bark beetle attack had a high degree of reliability (area under the ROC curve - AUC: 0.75-0.82). We conclude that spot initiation and spot spreading prediction modules included within the TANABBO model have the potential to help forest managers to plan sanitation felling in managed forests under pressure of bark beetle outbreak.
Keywords
Spatial Predictive Model, Bark Beetle Infestation, GIS, ROC Curve, Norway Spruce
Introduction
Bark beetles cause severe damage to coniferous forests in the Northern Hemisphere ([35]). Spatio-temporal analyses of bark beetle population dynamics are the subject of study for several research teams in Europe ([21], [14], [29]) and in North America ([42], [40], [25], [39]). Spatially explicit models predicting the risk of tree mortality are needed to efficiently mitigate damage related to bark beetle attacks ([21]).
Predictive modelling creates a model of future behaviour or occurrence of a phenomenon. In geographic information systems (GIS), spatial predictive modelling aims to predict the occurrence of a certain phenomenon in unknown areas based on its occurrence in space. As such, spatial predictive modelling relies on a multi-layered spatial database that contains attribute information (slope, aspect, distance from important objects, etc.) and their distribution in space ([12]). The spatial database is transformed into an aggregation of attribute values to obtain an index of suitability (or of the contrasting propensity) of the landscape to an occurrence of the modelled phenomenon. Various mathematical and machine learning methods have been applied to create spatial predictive models ([23]), such as multiple linear regression or logistic regression ([32], [17], [18]), multi-criteria decision-making using crisp or fuzzy set theory ([24], [3]), Dempster Shafer theory, Bayesian theory, and support vector machines ([19]). The result of spatial predictive modelling is usually a raster with cell values between 0 and 1, where a high value indicates a high probability of occurrence of the modelled phenomenon.
Several databases or statistical models based on a GIS approach have also been developed to estimate bark beetle population dynamics in order to predict future damage or optimize forest protection measurements ([42], [40], [21], [25]), as operational and public data-based models are missing.
Satellite remote sensing offers the opportunity for repeated mapping of tree mortality, and Landsat-resolution (30 m) imagery is sufficient to map the dynamics of tree mortality due to bark beetles within stands during the epidemic phase of a beetle outbreak ([44], [25], [13]). Open-access Landsat-based classifications record the removal of canopy tree cover ([10]) or monitor forest health ([1], [37]). The monitoring of forest defoliation ([2]) and parametrized country-wide main tree species can even reveal subtle canopy changes due to beetle attack ([14]). Satellite data are reliable for the estimation of bark-beetle-caused tree mortality, especially in the later stages of bark beetle outbreak ([13], [14]). However, bark-beetle-caused tree mortality interacts with wind damage (wind-caused tree mortality - [27]). This means that, despite many advantages, the ability to use satellite data for the mapping of bark-beetle-caused tree mortality has certain limitations.
Satellite data, especially Landsat products, together with relevant forest stand characteristics, are used to model tree mortality ([22], [40], [21], [25]). The bark-beetle-induced tree mortality predictors are usually various stand characteristics obtained from forestry databases or from remote sensing sources ([40], [21], [25]) and various landscape characteristics ([22], [40]).
The TANABBO (Tatra Mountains Bark beetle infestation prediction model - [22], [17]) decision support system combines freely available satellite imagery with stand characteristics to predict the occurrence of beetle-induced tree mortality in subsequent years. TANABBO is also a GIS-based system for the evaluation of forest stand predisposition to bark beetle attacks ([18]). The system is based on the known causal links between bark beetle outbreaks and environmental parameters. A module on the prognosis of a bark beetle stand infestation is also a part of the system. The system captures vegetation change over time using a time-series of Landsat images, NDVI (the normalized difference vegetation index), a digital terrain model at the resolution of Landsat pixel size, and available stand characteristics (stand age, volume, average diameter, and average height) at the stand resolution from forest management databases ([16]). A system of partial models is used, where each partial model produces an output which is later used as an input for the main model. The main output from the forecasting part of TANABBO is a subsequent-year prediction of bark-beetle-caused tree mortality. This forecast is important for the planning of forest protection measures in the subsequent year. The one-year forecast of bark-beetle-caused tree mortality is based on the combination of the two processes related to the spread of tree mortality over the landscape: the initiation of bark beetle spots and the spots spreading ([16], [36]). Spot initiation means the creation of new bark beetle infestations in areas without previous attacks, which is difficult to predict and relates to long-distance beetle dispersal occurring even during beetle epidemics ([17]). Spot spreading represents the expansion of an existing bark beetle spot into a neighbouring forest stand ([17]). Spot spreading becomes dominant over the course of the beetle outbreak, and in later phases, the majority of new infestations are adjacent to previous years’ infestations ([20], [33]).
Each predictive model requires quality determination before its use. One of the most widely used methods to validate the results of predictive modelling is the Receiver Operating Characteristic (ROC) curve analysis, first introduced in signal detection theory ([6]). In ROC curve analysis, the area under the ROC curve (AUC) is a very popular metric of prediction quality ([26], [7]). This method is also useful to measure the quality of spatial predictive models and maps ([32], [24]), as well as to compare them.
The aim of our work is (i) to introduce an algorithm of an updated module to predict landscape-level spot bark beetle spot initiation and spot spreading within the TANABBO decision support system methodology, and (ii) to validate the model outcomes against recorded proxies of bark beetle mortality data from public resources in conditions of managed forests in 2008, 2009, and 2010 using ROC curve analysis.
Materials and methods
Study area and main disturbances
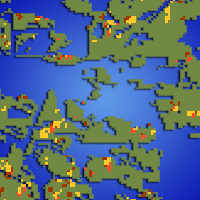
The case study area is a Division of “Vojenské lesy a statky” (VLS, Military Forests and Properties), s.p., Horní Planá in the Czech Republic (Fig. 1). VLS is a special-purpose organization managing military training areas. The forest enterprise manages 19,960 ha of land. Forests represent 16,569 ha of this area, and a water reservoir covers 203 ha; the rest of the area is covered by grassland under intensive military activity (⇒ https://www.vls.cz/en). The rugged hills with an altitude change of 100-150 m are a landscape typical of the region. Most of the area is of altitude between 600 and 800 m, with the highest point at 1228 m a.s.l. (Lysá Mt). The area partly belongs to the Bohemian Forest (the Šumava Mts.) and partly to the Šumavské podhurí Mts. The mean annual temperature varies between 5 and 7 °C, and annual precipitation totals vary between 700 and 800 mm ([4]).
Fig. 1 - Study area (The Bohemian Forest, Czech Republic).
Norway spruce (Picea abies L. Karst) is the dominant tree species in the forests (69%), very often growing with silver fir (Abies alba Mill., 6%) and European beech (Fagus sylvatica L., 5%). Scots pine (Pinus sylvestris L., 12%) is abundant at lower altitudes. Forest stands younger than 40 years cover 23.5% of the area, and 32% of stands are older than 100 years (⇒ https://www.vls.cz/en). Natural conditions are represented by Querceto-Fagetum to Fageto-Piceetum forest altitudinal zones. Forests form a large complex in higher altitudes surrounded by meadows and pasturelands.
Wind, snow, and bark beetles are the main disturbances to spruce forests. Windthrows (föhn is a common phenomenon in the study area) are the most important disturbance factor. In recent years, incidental felling due to being windthrown and bark beetle infestations have accounted for approximately 50% of total felling. Bark beetle outbreaks in the study area follow trends of bark beetle populations in the entire Czech Republic, with peaks in the mid-1980s and mid-1990s. A long-term outbreak started in 2003 following a strong drought in the whole of Central Europe ([38]). This outbreak was triggered by windstorm Kyrill in 2007 ([8]). Since 2015, a new bark beetle outbreak started as a result of drought and warm vegetation seasons.
Prediction framework
The predictive model involved known parameters controlling the occurrence of tree mortality by spruce bark beetle (see more details in Input data). We used yearly data from 2007 to 2010 to predict and validate the outcomes. The study area was hit by a large windstorm, Kyrill, in January 2007 ([8]); therefore, we chose the three years after the storm (2008, 2009, and 2010) to capture newly created beetle infestations during the beetle outbreak.
Input data to predict beetle infestations
Age structure, percentage of spruce, stand density, and wood volume values were taken from the forest management plan; potential solar radiation ([15]) was derived from the Shuttle Radar Topography Mission (SRTM) digital elevation model (DEM, 30 m resolution - ⇒ http://srtm.csi.cgiar.org/). NDVI was calculated from Landsat 5 and 7 satellite data (⇒ https://landsat.gsfc.nasa.gov/). For 2008, the NDVI raster layer was based on Enhanced Thematic Mapper Plus (ETM+) scenes from July 28 and June 10; for 2009, on the TM (Thematic Mapper) scene from August 24; and for 2010, on the TM scene from July 10. The selection of data was to a large extent limited by the public availability of satellite time-series and GIS data. The selection of stand characteristics from forest management databases was based on our previous work ([27], [28]).
Ground-truth data on bark-beetle-caused tree mortality
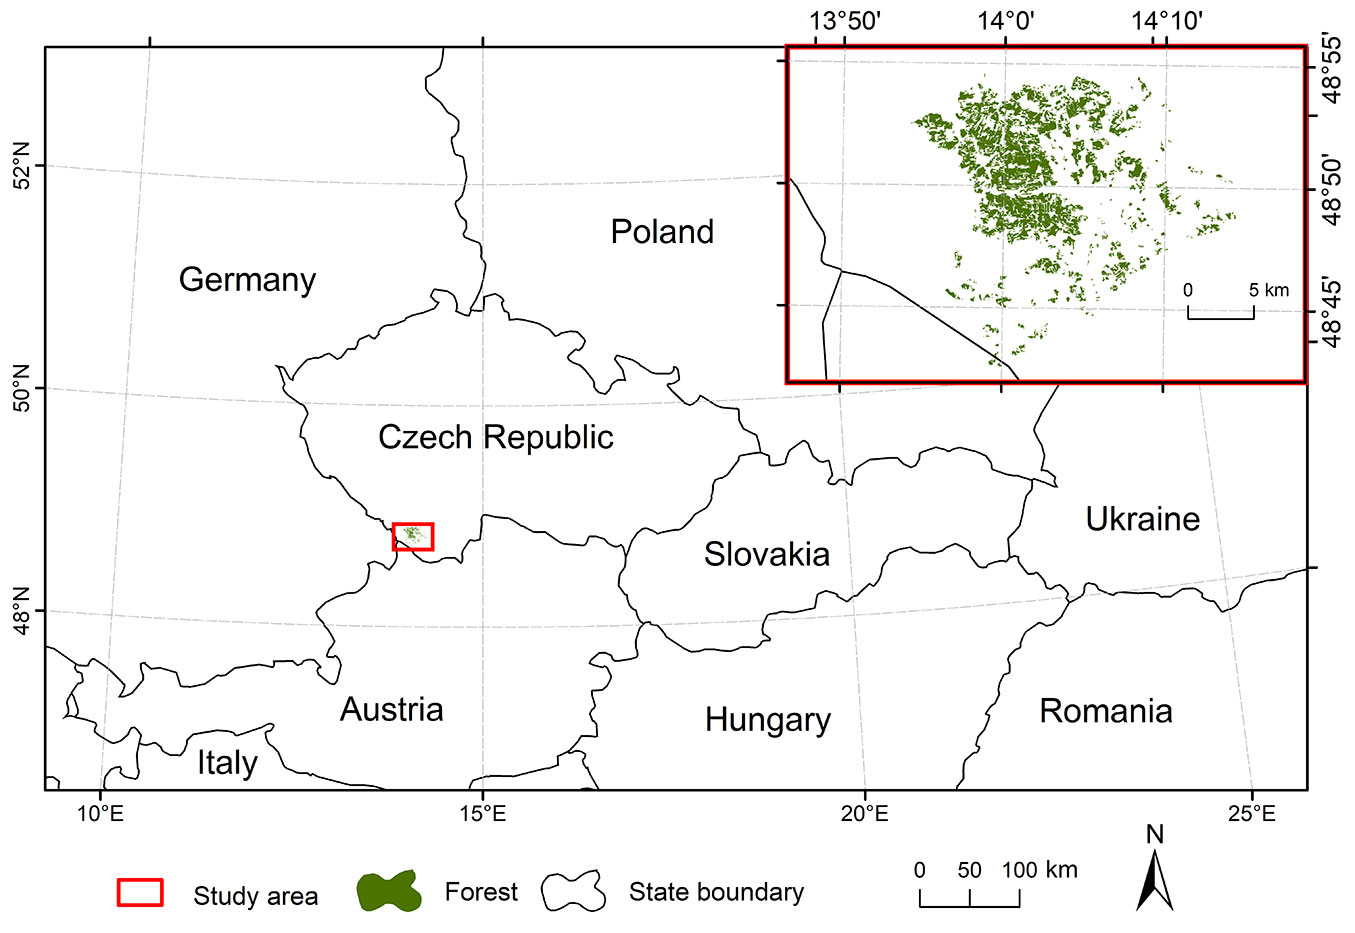
To validate the predictive model, model quality parameters (performance metrics) were calculated using maps of bark-beetle-caused tree mortality from 2008, 2009, and 2010 (Fig. 2).
Fig. 2 - Map of spruce bark beetle infestations in the study area (The Bohemian Forest, Czech Republic) in 2008-2010.
As a proxy for the localization of bark-beetle-caused tree mortality, we used Landsat-based and expert-classified forest health data available as Web map service (WMS) layers from the Czech Institute of Forest Management (Ústav pro hospodárskou úpravu lesu Brandýs nad Labem - ÚHÚL); these data were available until 2016. The portal has published classified Landsat time-series data (forest stands health status) since 1994 ([41], [1]). These data were accepted as a good estimation of forest health in the Czech Republic and in the study area, where they corresponded to areas infested by bark beetles. The forest health status layers contain the following categories: 0, healthy stands; 0/I, first signs of damage; I, small damage; II, medium damage; IIIa, strong damage; IIIb/IV, very strong damage. We transformed the forest health data to bark-beetle-caused tree mortality. We considered pixels classified to the classes “IIIa, strong damage” and “IIIb/IV, very strong damage” as bark-beetle-caused tree mortality, based on expert knowledge of the study area. The pixels classified as bark-beetle-caused tree mortality are considered as such only in the first year of occurrence. The yearly combination of beetle occurrences resulted in a time series of bark-beetle-caused tree mortality.
For the next step, we measured the distances between new and previous years’ infestation spots (Euclidean distance tool in ArcGIS® v. 10.5 - Esri, Redlands, CA, USA). Based on the proximity to the previous year’s infestation, we considered pixels more distant than 30 m (Landsat resolution, delineating neighbouring pixels) from the previous year’s infestation as spot initiation; otherwise, they were considered spot spreading.
Predictive maps of susceptibility to a bark beetle attack
In our study, the prediction of bark beetle attack probability was based on the combination of susceptibility to bark beetle spot initiation and susceptibility to the spreading of existing bark beetle spots.
Prediction of susceptibility to bark beetle spot initiation
Based on the TANABBO methodology ([18]) we applied logistic regression ([9]) to estimate susceptibility to the initiation of bark beetle spots over the landscape. Logistic regression is a special form of multivariate regression analysis in which the dependent variable is a non-metric, dichotomous (binary) variable. It is also the case with spatial predictive models, because we predict the occurrence of phenomena, i.e., whether or not they are present at a given site. This is also the reason why the better-known linear regression is not suitable for this type of classification problem.
Tree mortality (presence of pixels with dead trees) caused by spot initiation was the dependent factor and was represented as presence (1) or absence (0) of new (initial) bark beetle spots in the analysed year. The distance from existing spots (dst), NDVI (ndv), solar radiation (sol), age structure (age), stand density (dns), and wood volume per hectare (vol) were the independent factors in the statistical analyses. Before calculating the logistic regression, we statistically analysed the significance of the input parameters by calculating the Gini index ([11]) and mutual independence by calculating the correlation coefficients. The Gini coefficient, sometimes called the Gini index or Gini ratio ([11]), is a measure of statistical dispersion used primarily in economics, but it is also useful in geostatistics ([43]). The Gini index measures the inequality among the values of a variable, in our case between the values of input factors in the healthy forest and the values in the bark beetle spots. We applied it to calculate the significance of input factors in spatial predictive modelling.
The result of the logistic regression in each raster cell (corresponding to the input raster data) forms a prediction model of spot initiation.
Prediction of susceptibility to a bark beetle spot spreading
The relationship between active bark beetle spot size and independent factors (the same as in the case of modelling susceptibility to bark beetle spot initiation) was the basis for calculations of the potential of a bark beetle spot spreading ([17]). In the frame of raster GIS, it could be understood as the estimation of the likelihood that a given cell would be added to an existing spot, thus increasing the spot’s size.
First, for each bark beetle spot, the spot size was computed. This means that for each raster cell, the spot size containing that cell was calculated. Cells not affected by bark beetle spots have a value of 0. The potential for the bark beetle spot size was calculated using linear regression. The size of the active bark beetle spot was considered as the dependent factor, and the other parameters (distance, NDVI, solar radiation, age structure, stand density, and wood volume per hectare) were considered as the independent factors. All factors were normalized before entering the calculation, i.e., their values were transformed to values ranging from 0 to 1. The resulting multiple linear regression function was used for the calculation of the potential bark beetle spot size for each pixel. The raster of the relative resistance was computed from the potential bark beetle spot size by the function 1/s, where s is a potential spot size. Based on a GIS algorithm of movement of a friction surface ([5]), the model of relative resistance was used as a friction surface in the computation of cost distances from existing bark beetle spots. The maximum spreading distance was derived from the maximum spot size in the study area. The cost distances were linearly resized to 0-1 to create a predictive model of the probability of bark beetle spot spreading (maximum cost distance corresponds to 0, distance 0 m corresponds to 1).
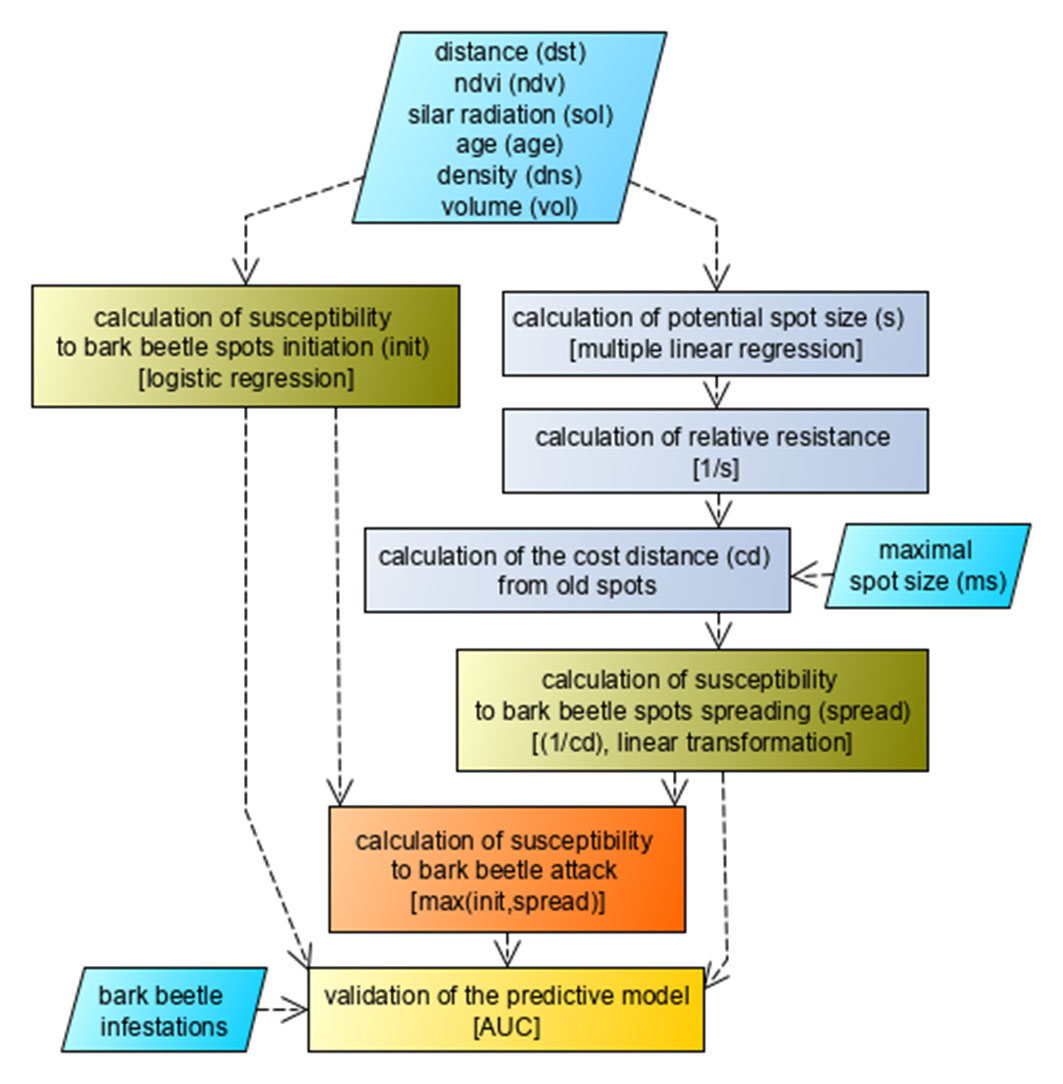
A combined predictive model of susceptibility to bark beetle attack
A model of susceptibility to bark beetle attack was created based on the model of bark beetle initiation and the model of bark beetle spreading using the maximum operation (the MAX() function in map algebra). In other words, each value of the model of susceptibility to bark beetle attack represented the higher corresponding value from the two predictive models described above. The flowchart of the methodology of the creation of the predictive models is shown in Fig. 3. Details of the complete methodology of the creation of the predictive models are described in previous papers ([17], [18]).
Fig. 3 - A flowchart of the methodology of creation and validation of the predictive models of the susceptibility of an area to bark beetle attack.
Validation of the predictive models and predictive maps
In this paper, we propose a methodology and new module of the TANABBO decision support system for the validation of all predictive models. We applied ROC curve analysis according to Pontius & Schneider ([32]), where AUC is computed using the trapezoidal rule of integral calculus. To validate the predictive model for each year, we used reference bark beetle spots detected in the subsequent year (Fig. 4). We proposed the application of two types of validation. In the first case (combined), we validated all models, i.e., models of susceptibility to the initiation, spreading, and attack, using all bark beetle spots detected in the subsequent year. In the second (separated) case, we validated the models of susceptibility to bark beetle attack initiation only using the initialized bark beetle spots and the models of susceptibility to bark beetle spots spreading only using the spread spots.
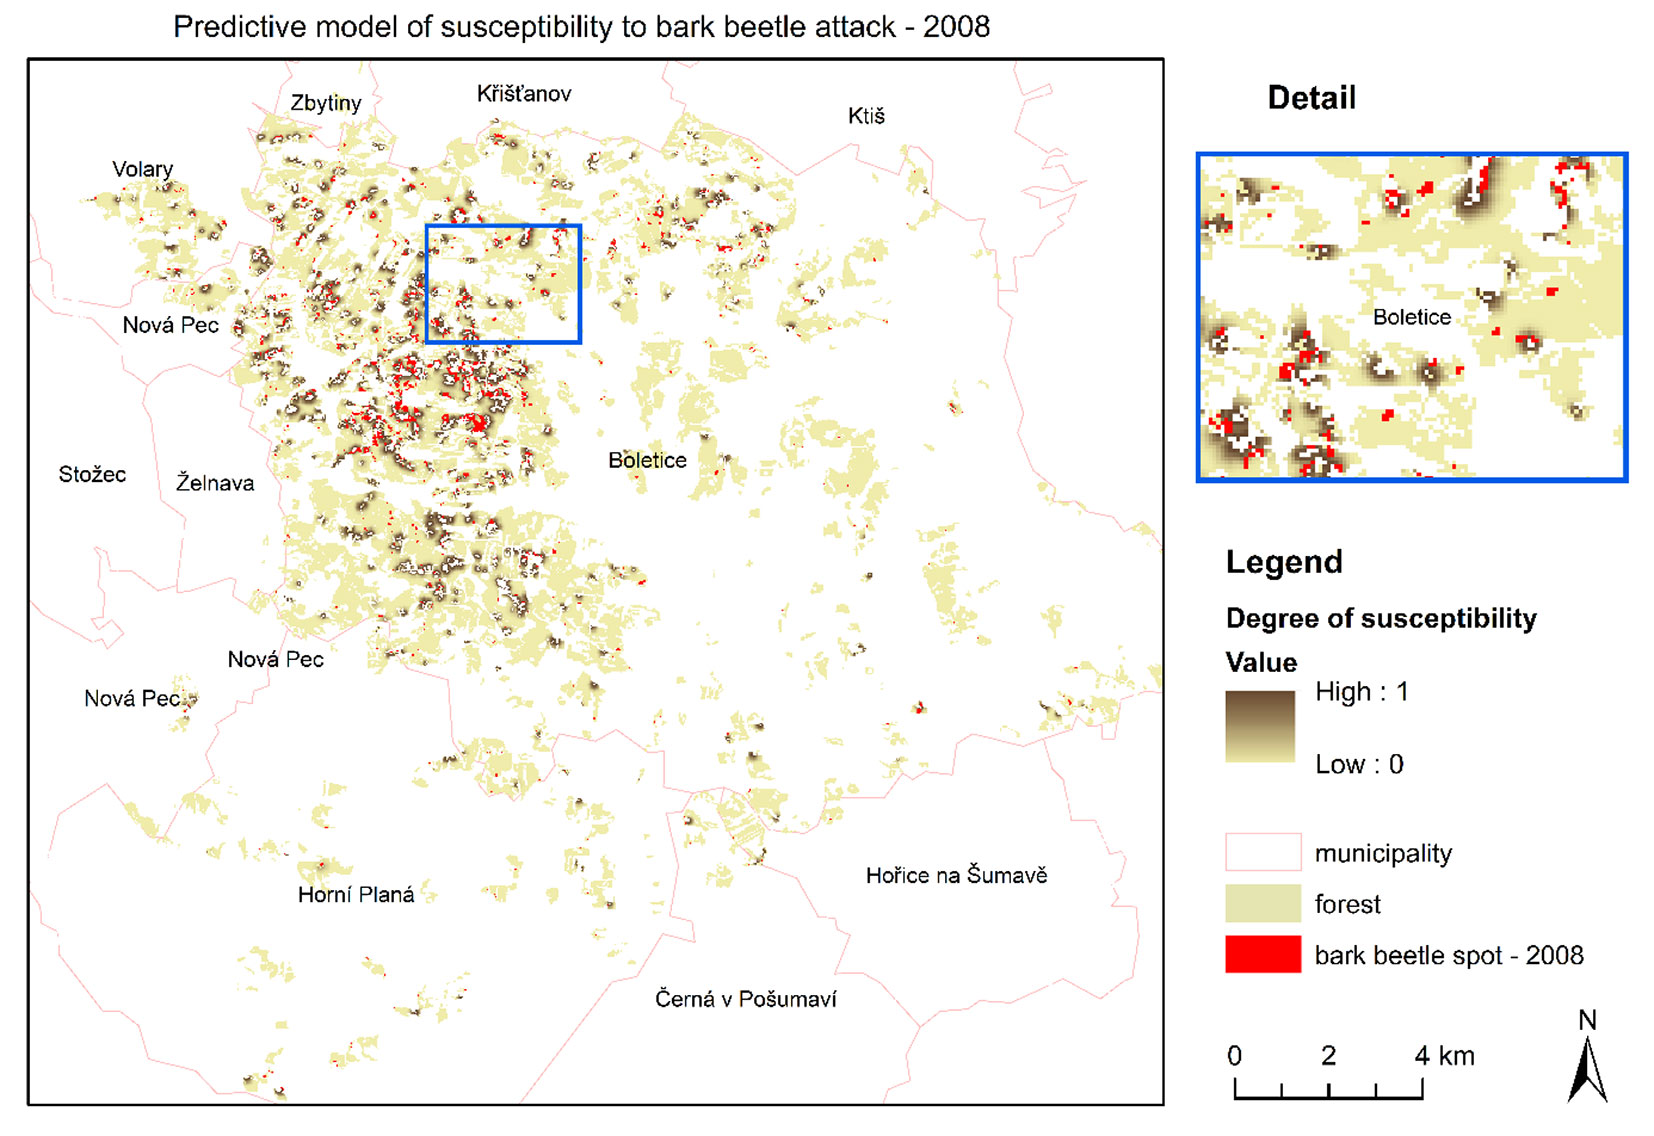
Fig. 4 - The predictive model of the susceptibility of the study area (The Bohemian Forest, Czech Republic) to bark beetle attack in 2008.
Data processing and analysis
We performed most of the data preparation and processing in the TANABBO v. 1.9 software system ([18] - ⇒ http://www.tanabbo.org/⇒ http://www.tanabbo.org/). The TANABBO 1.9 enables time-series analysis of data on spruce stand mortality. Statistical analysis of input parameters, logistic regression, and ROC curve analysis were performed with the Python programming language and the libraries NumPy, SciPy, Matplotlib, and scikit-learn.
All predictive models were visualized by predictive maps created in the ArcGIS® v. 10.5 software environment.
Results
In the case study, we created predictive models of the susceptibility of an area to a bark beetle attack for 2008, 2009, and 2010. For each model, we calculated parameters of its accuracy based on the proposed methodology.
Statistical analysis and predictive model creation
The results of preliminary statistical analysis (correlation matrix and Gini index calculation) are presented in Tab. 1 and Tab. 2. The analysis was performed on 734,608 (937 × 784) raster cells representing the study area. The results show the statistical significance of the input parameters (Tab. 1) and their mutual independence (no or low correlation - Tab. 2).
Tab. 1 - Gini index of all input factors for 2008, 2009, and 2010, which expresses the difference in the distribution of individual factors in bark beetle spots compared to the distribution in the forest (the larger the absolute value of the index, the greater the difference).
| Input factor | Year | ||
|---|---|---|---|
| 2008 | 2009 | 2010 | |
| Distance from spots | -0.45 | -0.64 | -0.48 |
| NDVI | -0.16 | -0.24 | -0.19 |
| Solar radiation | -0.12 | -0.12 | -0.15 |
| Age structure | 0.19 | 0.21 | 0.15 |
| Stand density | -0.13 | -0.07 | -0.04 |
| Wood volume ha-1 | 0.16 | 0.16 | 0.15 |
Tab. 2 - Correlation matrix of input factors.
| Input factor | Distance from spots |
NDVI | Solar radiation |
Age structure |
Stand density |
Wood volume ha-1 |
|---|---|---|---|---|---|---|
| Distance from spots | 1.00 | - | - | - | - | - |
| NDVI | 0.11 | 1.00 | - | - | - | - |
| Solar radiation | 0.00 | -0.03 | 1.00 | - | - | - |
| Age structure | -0.15 | -0.01 | -0.02 | 1.00 | - | - |
| Stand density | 0.12 | -0.10 | -0.02 | -0.18 | 1.00 | - |
| Wood volume ha-1 | -0.10 | 0.01 | 0.00 | 0.44 | 0.17 | 1.00 |
The coefficients of regression functions for the creation of the predictive model of susceptibility to bark beetle spot initiation from 2008 to 2010 are shown in Tab. 3, and the coefficients of linear regression functions for potential spot size calculation are shown in Tab. 4. The size of the coefficients also indicates the relative importance of the input factors.
Tab. 3 - Coefficients of logistic regression functions for the creation of the predictive models of susceptibility to the bark beetle spot initiation for 2008, 2009, and 2010.
| Parameters | Year | ||
|---|---|---|---|
| 2008 | 2009 | 2010 | |
| Distance from spots | -36.7099 | -26.9146 | -18.9125 |
| NDVI | -1.6011 | -0.0525 | -0.5652 |
| Solar radiation | -0.0240 | -0.2789 | -0.2934 |
| Age structure | 1.0524 | 0.6254 | 1.0125 |
| Stand density | -0.0004 | -0.0021 | 0.0001 |
| Wood volume ha-1 | -0.3194 | -0.4225 | -0.3119 |
Tab. 4 - Coefficients of linear regression functions for potential bark beetle spot spreading calculations for 2008, 2009, and 2010 (all parameter values were normalized).
| Parameters | Year | ||
|---|---|---|---|
| 2008 | 2009 | 2010 | |
| Constant | 0.732 | 0.598 | 0.731 |
| Distance | -0.535 | -0.622 | -0.443 |
| NDVI | -0.607 | -0.564 | -0.591 |
| Solar radiation | -0.303 | -0.212 | -0.178 |
| Age structure | 0.47 | 0.419 | 0.416 |
| Stand density | 0.192 | 0.267 | 0.043 |
| Wood volume ha-1 | -0.572 | -0.545 | 0.521 |
The maximal spot size during the analysis period in the study area was 52,200 m2; thus, we used the value 228 m (calculated as a square root) as the maximal distance of bark beetle spot spreading in constructing the predictive model of susceptibility to a bark beetle spot spreading (cells beyond a distance of 228 m from existing spots were ineligible).
The predictive models of the susceptibility of an area to bark beetle attack were created using both the above-described models and the MAX() function. All predictive models are shown as predictive maps in Fig. 4 and Figs. S1-S2 in Supplementary material.
Validation of predictive models
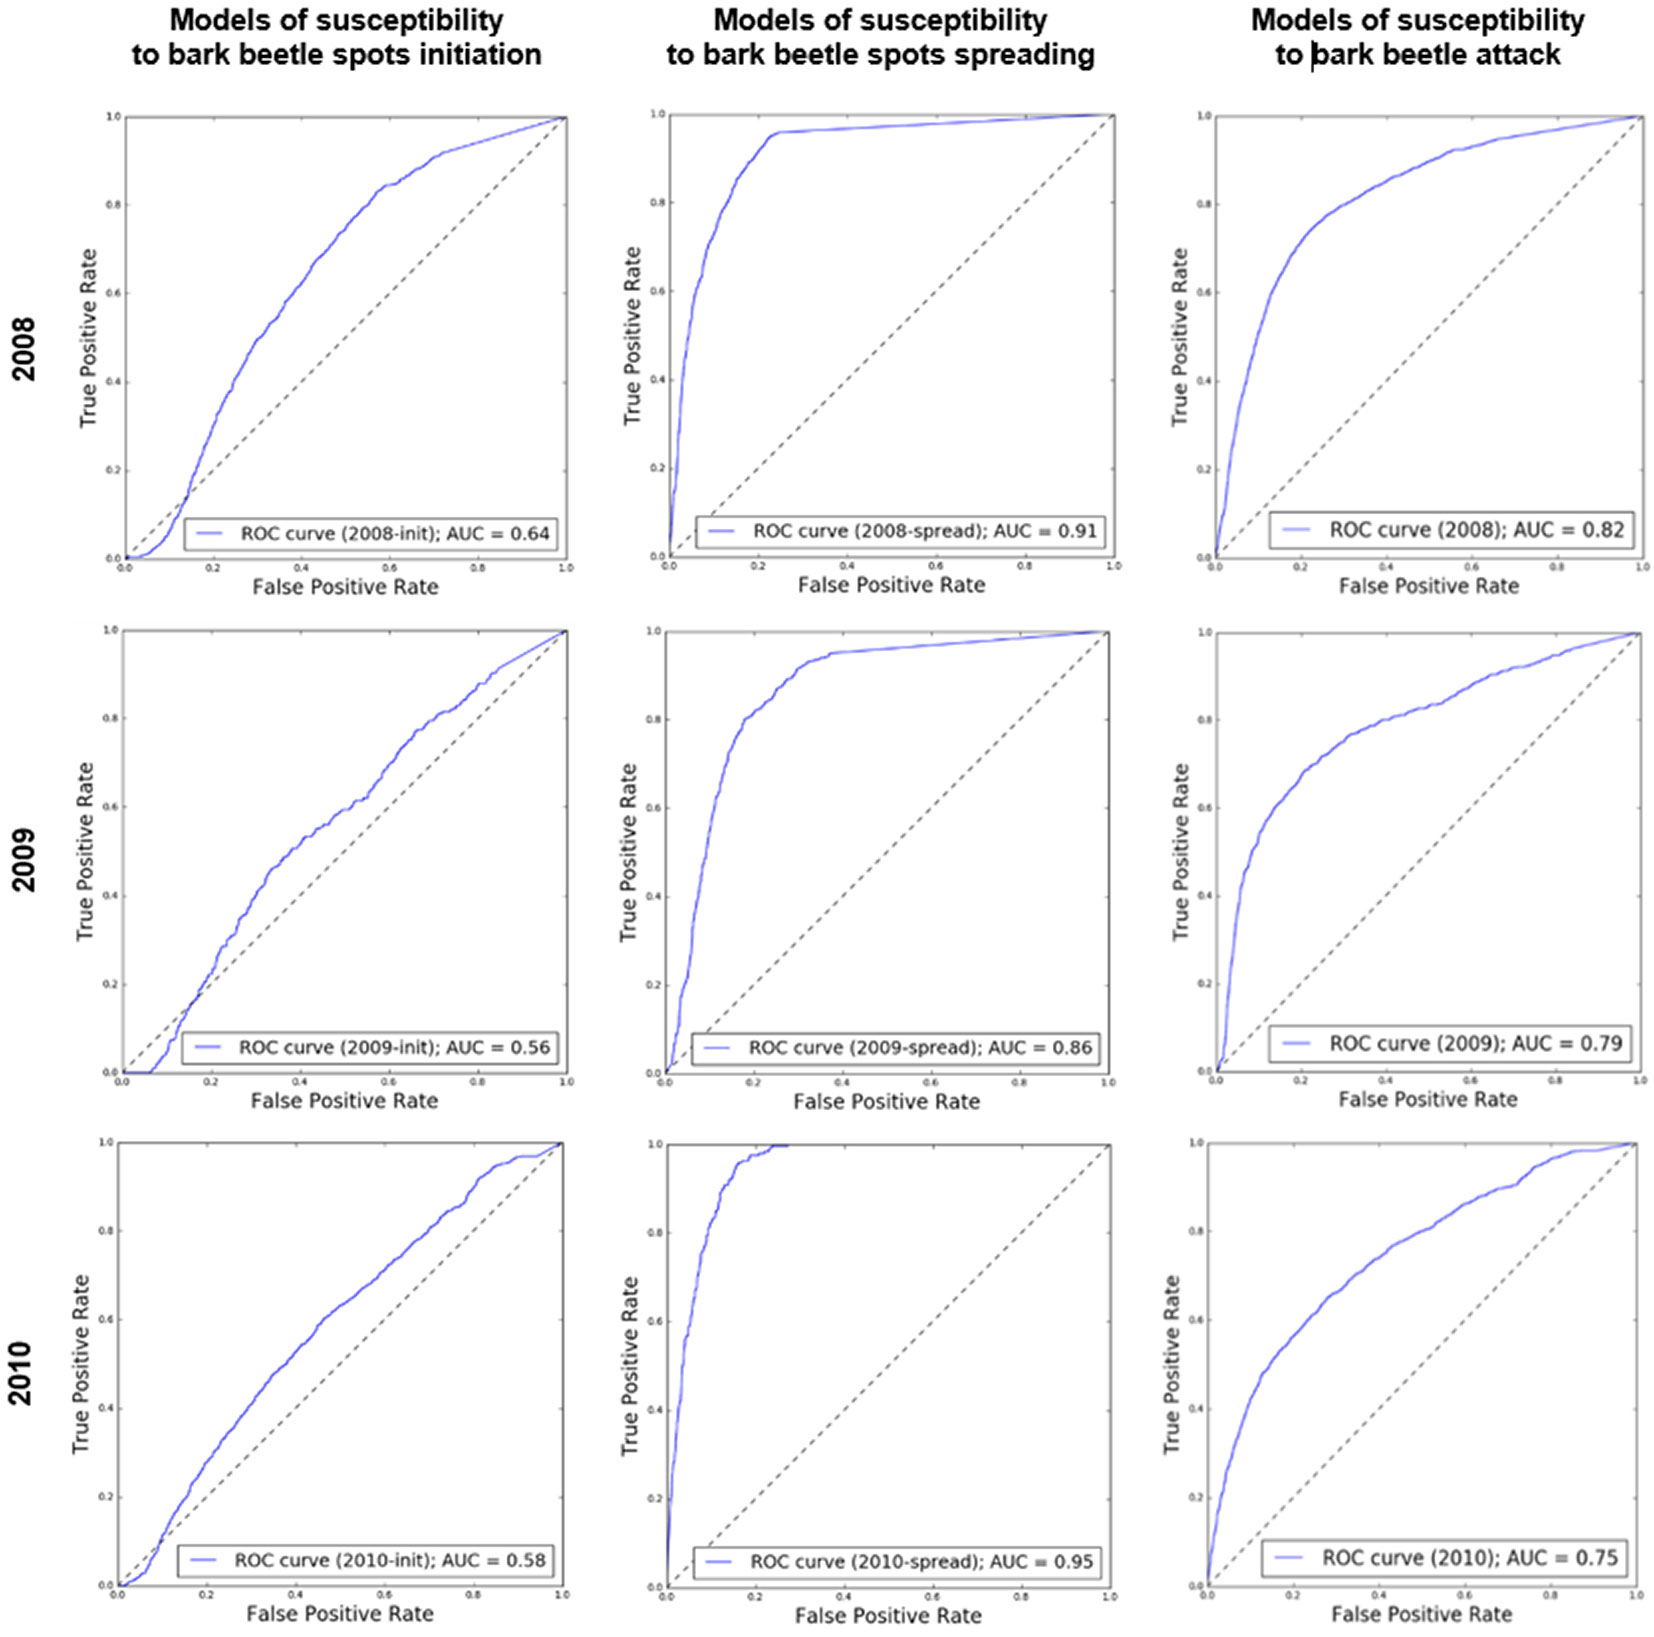
Fig. S3 (Supplementary material) shows the validation of the combined spot initiation and spread predictive models (e.g., 2008, AUC=0.82). The validation for separate spot initiation and spot spreading is shown in Fig. 5. The results of the validation of all predictive models created within our case study are summarized in Tab. 5, which contains the mean of all predictive values (ma), mean of predictive values in bark beetle spots (ms), and the AUC for each model. For the prediction of susceptibility to bark beetle spot initiation, the AUC values ranged from 0.71 to 0.82. The AUC values for the model of susceptibility to a bark beetle spot spreading ranged from 0.72 to 0.76.
Fig. 5 - The results of the second (separated) type of validation of predictive models. The ROC curves and the calculated AUC values of the predictive models from 2008 to 2010 using classified bark beetle spots (initialized spots were used for validation of the model of susceptibility to bark beetle spot initiation and spread bark beetle spots for validation of the model of susceptibility to bark beetle spots spreading).
Tab. 5 - Results of the validation of predictive models from 2008 to 2010. (ma): mean of all predictive values of the model; (ms): mean of predictive values in bark beetle spots; (AUC): area under ROC curve. The higher the ms value compared to the ma value, the more reliable the model.
| Year of prediction |
m a | m s | AUC |
|---|---|---|---|
| 2008 | 0.110 | 0.435 | 0.82 |
| 2009 | 0.063 | 0.242 | 0.79 |
| 2010 | 0.182 | 0.631 | 0.75 |
The combined type of validation shows relatively high accuracy in the prediction of all infested areas. Separated types of validation show better results for bark beetle spot spreading.
Discussion
The use of public data derived from the Landsat time series is sufficient for monitoring beetle outbreaks during epidemic phases ([13]). However, mid-resolution satellite scenes represent an important data source. We used a national web service ([41], [1]), with limited references. Havašová et al. ([14]) showed that the national web service data could be more precise in bark beetle damage identification than data from the well-referenced Global Forest Watch service ([10]).
The main limitation of our reference tree mortality data was the difficulty in distinguishing between wind damage and bark-beetle-caused tree mortality. However, our study was performed in a period after extensive windstorm damage, when bark beetles were the dominant cause of tree mortality, which was the subject of the study. This allowed us to use public data about forest health as a proxy of bark beetle damage.
Our models show relatively good results in the early stages of the bark beetle outbreak. According to Økland et al. ([31]), this is a period when an attack is relatively hard to predict. Our study provides testing and extension of the TANABBO decision support system and also the design and implementation of a module for its validation.
Statistical analysis and predictive model creation
The predictors used herein are similar to predictors applied by other authors ([40], [21]). We used Landsat-based NDVI as an important predictive variable. Its significance was also confirmed by statistical analysis (Gini index and coefficients of regression equations). Meddens & Hicke ([25]) also used several Landsat-based indices, including NDVI, as explanatory variables to predict bark-beetle-caused tree mortality. The use of data on tree mortality from the previous year is in agreement with the approach used by Kärvemo et al. ([21]). During an outbreak, infestations are usually spatially concentrated and show a high spatial and temporal autocorrelation pattern ([40]). Kautz et al. ([20]) and Simard et al. ([40]) used the distance to the closest local infestation as a bark beetle pressure variable. This parameter also proved to be significant in our study. Other important factors are wood volume per ha, age, and potential solar radiation. On the contrary, the least significant parameter in our analysis was density. The statistical significance of the solar radiation parameter was not so high in our analysis, but this parameter alone has the potential for more accurate determination based on more accurate digital models created by aerial laser scanning. Nevertheless, the results showed that the predictive models of susceptibility to bark beetle attack from the TANABBO decision support system provided predictions of subsequent years’ infestations with relatively high accuracy (AUC = 0.75-0.82).
Validation of whole predictive models
Modelling complex spatiotemporal phenomena such as forest susceptibility to bark beetle attack is a very challenging problem, which deals with complex nonlinear conditioning parameters that are often dynamic and change dramatically over time. Therefore, validation results above 0.90 in these types of modelling are extremely hard to achieve. In our study, the AUC values of the final models ranged from 0.75 to 0.82 (Tab. 5). Phillips & Dudik ([34]) suggested that models with AUC values above 0.75 should be considered as useful for predictions ([30]). Therefore, the validation result of AUC = 0.75 can be considered as reasonable, and the susceptibility model can be considered as usable and reliable. Kärvemo et al. ([21]) used boosted regression trees for large-scale risk mapping of an eruptive bark beetle. The model was validated for multiple years and gained AUC results ranging from 0.729 to 0.818.
An interesting point is that our model was more accurate for the prediction of bark beetle attack in 2008 (AUC = 0.82) than in subsequent years. This result indicated that our model better predicted beetle infestations just after wind damage (from 2007, otherwise not included in study), which is likely explained by the spatial dependence of proximity to windthrown trees in subsequent years ([33]).
Validation of partial models
Our two types of validation (validation of models of all bark beetle infestations and separate validation of bark beetle infestations created by spot initiation and infestation caused by existing spots spreading) helped us more deeply understand undergoing processes. The first (combined) type of validation did not show large differences between the partial models and the final predictive model (AUC for initiation: 0.71-0.82, AUC for spreading: 0.70-0.76, final predictive models AUC 0.75-0.82). One of the key variables in both models is the distance from the infestations of the previous year, therefore the partial models are, to a certain extent, interchangeable.
On the other hand, the second type of validation (separate) showed significantly better prediction of the processes of existing spot spreading (AUC 0.86-0.95) than prediction of new bark beetle infestations (AUC 0.56-0.64). This is caused by the significance of distance from the previous year’s infestations and especially by hypothetical overlay between spot initiation and spot spreading at short distances from the last year’s infestations. We can see that on ROC curves for spot initiation, the graph is even below the diagonal for small false positive rate (FPR) values, and vice versa; for spreading, the ROC curve grows rapidly. To summarise, it is easier to predict spot spreading than spot initiation ([31]).
The final effect of the described processes is the confirmation of relatively high accuracy of the final predictive model.
Implementation in forest management
The described and validated algorithm for prediction of bark beetle infestation is a core part of the TANABBO decision support system ([22], [17], [18]). The one-year prediction can potentially be applied in the planning of forest protection measures in areas affected by bark beetle outbreaks or areas with extensive wind damage and expected bark beetle outbreak. Important limitations of the practical use of our models are the difficulties in distinguishing between wind- and bark-beetle-caused tree mortality with the use of Landsat data. On the other hand, the interaction between wind- and bark-beetle-caused tree damage ([27]) could possibly improve those negative effects on model accuracy.
A limitation of Landsat data is the fact that in the mountainous conditions of central Europe, there is usually only one cloud-free Landsat scene available in the course of one year.
Conclusions
The beetle infestation model implemented within the TANABBO decision support system ([22], [17], [18]) relatively accurately predicts tree mortality as a combination of spot initiation and spot spreading over the landscape (AUC = 0.75-0.82).
Acknowledgements
This work was supported by grants nos. 1/0300/19 and 1/0468/20 from the Grant Agency of Slovak Republic VEGA, the project of the Slovak Research and Development Agency under contracts APVV-15-0413, APVV-15-0761, and the National Agency for Agricultural Research within the framework of project no. QJ1220317 administered by the Ministry of Agriculture of the Czech Republic and by the grant “EXTEMIT - K”, no. CZ.02.1.01/0.0/0.0/15_003/0000433 financed by OP RDE.
References
Gscholar
CrossRef | Gscholar
Gscholar
Gscholar
Gscholar
Gscholar
Gscholar
Gscholar
Online | Gscholar
Gscholar
Gscholar
CrossRef | Gscholar
Gscholar
Gscholar
CrossRef | Gscholar
CrossRef | Gscholar
Gscholar
Gscholar
Gscholar
Authors’ Info
Authors’ Affiliation
Milan Muňko
Faculty of Civil Engineering, Slovak University of Technology in Bratislava, Bratislava (Slovakia)
Faculty of Forestry, Technical University in Zvolen, Zvolen (Slovakia)
Jaroslav Holuša 0000-0003-1459-0331
Rastislav Jakuš 0000-0003-2280-1952
Faculty of Forestry and Wood Sciences, Czech University of Life Sciences, Prague (Czech Republic)
Rastislav Jakuš 0000-0003-2280-1952
Institute of Forest Ecology, Slovak Academy of Sciences, Zvolen (Slovakia)
Department of Biological and Environmental Sciences, University of Jyvaskyla, Jyvaskyla, Finland
Corresponding author
Paper Info
Citation
Duračiová R, Muňko M, Barka I, Koreň M, Resnerová K, Holuša J, Blaženec M, Potterf M, Jakuš R (2020). A bark beetle infestation predictive model based on satellite data in the frame of decision support system TANABBO. iForest 13: 215-223. - doi: 10.3832/ifor3271-013
Academic Editor
Massimo Faccoli
Paper history
Received: Oct 17, 2019
Accepted: Apr 05, 2020
First online: Jun 06, 2020
Publication Date: Jun 30, 2020
Publication Time: 2.07 months
Copyright Information
© SISEF - The Italian Society of Silviculture and Forest Ecology 2020
Open Access
This article is distributed under the terms of the Creative Commons Attribution-Non Commercial 4.0 International (https://creativecommons.org/licenses/by-nc/4.0/), which permits unrestricted use, distribution, and reproduction in any medium, provided you give appropriate credit to the original author(s) and the source, provide a link to the Creative Commons license, and indicate if changes were made.

Web Metrics
Breakdown by View Type
Article Usage
Total Article Views: 47015
(from publication date up to now)
Breakdown by View Type
HTML Page Views: 37514
Abstract Page Views: 5393
PDF Downloads: 3266
Citation/Reference Downloads: 17
XML Downloads: 825
Web Metrics
Days since publication: 2225
Overall contacts: 47015
Avg. contacts per week: 147.91
Article Citations
Article citations are based on data periodically collected from the Clarivate Web of Science web site
(last update: Mar 2025)
Total number of cites (since 2020): 18
Average cites per year: 3.00
Publication Metrics
by Dimensions ©
Articles citing this article
List of the papers citing this article based on CrossRef Cited-by.
Related Contents
iForest Similar Articles
Research Articles
Determination of differences in temperature regimes on healthy and bark-beetle colonised spruce trees using a handheld thermal camera
vol. 14, pp. 203-211 (online: 02 May 2021)
Research Articles
Impact of the four-eyed fir bark beetle (Polygraphus proximus Blandf.) on coarse woody debris stock and carbon budget of fir forests in Central Siberia
vol. 19, pp. 209-218 (online: 08 June 2026)
Research Articles
Assessment of sanitary conditions in stands of Norway spruce (Picea abies Karst.) damaged by spruce bud scale (Physokermes piceae Schrnk.)
vol. 6, pp. 73-78 (online: 07 February 2013)
Research Articles
Ecological factors affecting the recent Picea abies decline in Slovenia: the importance of bedrock type and forest naturalness
vol. 16, pp. 105-115 (online: 29 March 2023)
Progress Reports
Landscape-scale Ips typographus attack dynamics: from monitoring plots to GIS-based disturbance models
vol. 4, pp. 256-261 (online: 13 December 2011)
Research Articles
Seven spruce species on a mountain site - performance, foliar nutrients, and forest floor properties in stands 20 years old
vol. 12, pp. 106-113 (online: 11 February 2019)
Research Articles
Distribution and habitat suitability of two rare saproxylic beetles in Croatia - a piece of puzzle missing for South-Eastern Europe
vol. 11, pp. 765-774 (online: 28 November 2018)
Research Articles
Hygroscopicity of the bark of selected forest tree species
vol. 10, pp. 220-226 (online: 06 November 2016)
Research Articles
Ozone fumigation effects on the morphology and biomass of Norway spruce (Picea abies L.) saplings
vol. 2, pp. 15-18 (online: 21 January 2009)
Short Communications
Effective monitoring as a basis for adaptive management: a case history of mountain pine beetle in Greater Yellowstone Ecosystem whitebark pine
vol. 2, pp. 19-22 (online: 21 January 2009)
iForest Database Search
Search By Author
Search By Keyword
Google Scholar Search
Citing Articles
Search By Author
Search By Keywords
PubMed Search
Search By Author
Search By Keyword


