Decomposition of Norway spruce and European larch coarse woody debris (CWD) in relation to different elevation and exposure in an Alpine setting
iForest - Biogeosciences and Forestry, Volume 9, Issue 1, Pages 154-164 (2015)
doi: https://doi.org/10.3832/ifor1591-008
Published: Aug 28, 2015 - Copyright © 2015 SISEF
Research Articles
Abstract
To describe the decay stage of coarse woody debris (CWD) a five decay-class system has been introduced and it is currently the most commonly applied. This system is based on visual, geometric and tactile features of the wood in the field; however, a detailed chemical characterization is often missing. Furthermore, the driving mechanisms (particularly substrate quality vs. environmental conditions) of deadwood decay are controversially discussed. Consequently, we investigated how typical major and minor chemical parameters of wood were correlated with the decay stage. The decomposition patterns of Norway spruce (Picea abies (L.) Karst) and European larch (Larix decidua Mill.) CWD of an Alpine setting were analyzed, and how the chemical and physical parameters were affected by the substrate and environmental conditions was checked. Two altitudinal sequences, having a different exposure (north- vs. south-facing sites), were sampled. We measured main biochemical compounds (lignin and cellulose), physical properties (density and water content), element concentrations (C, N, P, K, Ca, Mg, Fe, Mn), and the carbon isotopic signature (δ13C) of living trees and CWD at five decomposition stages (decay classes). Most investigated wood physico-chemical parameters such as wood density, water content, lignin and cellulose and even minor constituents (N, Ca, Mg, P, Fe, Mn) correlated well to the five decay-class system. Some important components, such as the carbon concentration and δ13C, did not vary with increasing decomposition. Our hypothesis that the different substrate should be traceable during CWD decay had to be rejected, although some statistically significant chemical differences between larch and spruce were measured in the living trees. The chosen tree species were probably not different enough to be chemically traceable in the CWD. Already in decay class 1, these differences were zeroed. The site conditions (expressed by the different altitudes and exposure) influenced only some of the investigated parameters, namely lignin, the δ13C isotopic ratio and nutrients such as P, Ca and K.
Keywords
Deadwood, Alps, Norway Spruce, European Larch, Decomposition, Lignin, Nutrients, Carbon Isotopes
Introduction
Deadwood has a well-acknowledged role in forest functioning: it is a habitat for many autotrophs and heterotrophs ([54], [41]). Deadwood also plays an important role in C and nutrient dynamics ([32]). Large-dimension residues, though not universally defined, are referred to as coarse woody debris (CWD), i.e., logs, snags and coarse roots. In natural forests, the CWD input results from tree mortality. In managed forests, CWD is also influenced by logging activities and management practices (e.g., left-over stumps and branches). In both natural and managed systems, the input rate is also dependent on the occurrence of major disturbances, such as wind storms or pathologic dieback that can occasionally introduce further amounts of deadwood ([10], [23]).
Depending on the forest ecosystem, CWD can greatly vary, accounting for 10 to more than 30% of the aboveground biomass of forests ([9], [5], [6]). On a global level, it represents 8% of the forests’ C stock ([36]). For North America and Europe, an increase in woody biomass ([39]) coupled with an increased environmental disturbance regime ([46]) may lead to a larger amount of CWD in the short-term. However, a decrease in CWD could be expected as a response to climate warming, due to enhanced decomposition rates ([31]).
Decay mechanisms of CWD are driven by physical, chemical and biological processes ([22]). However, it is often difficult to differentiate between the factors controlling the decay mechanisms ([12], [39], [23]). Furthermore, due to the highly heterogeneous spatial distribution and its long-term decay dynamics, CWD is less represented in decomposition studies. Therefore, it is not surprising that the discussion about the driving factors is still controversial and consequently a matter of debate. While some authors point to the importance of substrate quality, others emphasize the role of climatic conditions.
Decomposition of CWD is largely driven by microbial (mainly fungal) activity, which is influenced by substrate quality and environmental conditions ([22]). Disentangling the role of the different decomposition drivers is challenging because of their strong interactions ([12]). Lignin, cellulose and nitrogen (N) interactions seem to exert a major control on litter decomposition ([48]). Micronutrients can also be important for decomposition, but are less reported in literature. For example, in the late decomposition stage, manganese (Mn) seems to be essential for lignin degradation ([4]). However, in the Austrian Alps Djukic et al. ([14]) found that environmental conditions rather than substrate determine the decomposer community. Temperature and water content explained 74 % of the variation in CWD respiration in an incubation experiment of boreal black spruce ([51]). Risch et al. ([39]) found that soil temperature was the best explanatory variable for the decomposition rate of wood stakes in the Swiss Alps.
The general problem of precise determination of the CWD decay processes seems to be even more basic. To get an overview of CWD and decay mechanisms on a wider area (and not just on a lab or a plot scale), relatively simple tools are required to characterize and quantify the processes. In the field, the different steps of CWD decomposition are often described by so-called decay classes that are determined by visual assessment of the wood ([33]). The five decay-class system is the one most commonly applied ([10], [23], [33] - see Tab. 1). Some authors have tested the effectiveness of using a different number of classes ([49]). Unfortunately, a detailed chemical characterization of such decay classes is often missing for specific tree species and is based on purely macromorphological observations. As suggested by several authors ([19], [10], [44], [33]), wood density, carbon, nitrogen and phosphorous contents together with lignin and cellulose concentrations may be used to better assess the decay patterns of CWD in relation to specific site conditions ([40]).
Tab. 1 - Characteristics of the study sites. (MAAT): mean annual air temperature; (MAP): mean annual precipitation ([45]); (b): thermal favorable conditions on south-facing sites included (according to [3]).
| Sites | Plot ID | Elev. (m a.s.l.) |
Aspect (°N) |
Slope (°) |
MAAT (°C) |
MAP (mm yr-1) |
Parent material |
Dominating tree species |
Land use | Soil classification (WRB - [16]) |
|---|---|---|---|---|---|---|---|---|---|---|
| North-facing sites | N01 | 1180 | 340 | 31 | 5.6 | 950 | Paragneiss debris | Picea abies | Natural forest (ecological forestry) |
Chromi-Episkeletic Cambisol (Dystric) |
| N02 | 1390 | 0 | 28 | 4.6 | 1000 | Paragneiss debris | Picea abies | Natural forest (ecological forestry) |
Chromi-Episkeletic Cambisol (Dystric) | |
| N03 | 1620 | 0 | 29 | 3.5 | 1060 | Paragneiss debris | Picea abies | Natural forest (ecological forestry) |
Chromi-Endoskeletic Cambisol (Dystric) | |
| N04 | 1930 | 20 | 12 | 1.4 | 1180 | Paragneiss debris, moraine material |
Larix decidua | Originally used as pasture |
Episkeletic Podzol | |
| South-facing sites | S06 | 1185 | 160 | 31 | 8.6b | 950 | Paragneiss debris | Picea abies | Ex-coppice, natural forest (ecological forestry) | Episkeleti-Endoleptic Cambisol (Chromi-Dystric) |
| S07 | 1400 | 145 | 33 | 7.6b | 1000 | Paragneiss debris | Larix decidua | Natural forest (ecological forestry) |
Dystri-Endoskeletic Cambisol | |
| S08 | 1660 | 210 | 33 | 6.5b | 1060 | Paragneiss debris | Picea abies | Natural forest (ecological forestry) |
Skeletic Umbrisol | |
| S09 | 1995 | 160 | 25 | 4.4b | 1180 | Paragneiss debris | Larix decidua | Ex pasture, natural forest | Skeletic Umbrisol |
In this study we focused on typical major and minor wood chemical parameters in order to understand how they correlate with the decay stage. The decomposition patterns of Norway spruce (Picea abies (L.) Karst) and European larch (Larix decidua Mill.) CWD of an Alpine setting were analyzed. Furthermore, we tried to trace back how decay stages and chemical parameters were affected by site conditions (different elevations and exposure). Our starting hypothesis was that the physical and chemical properties of CWD would be different for spruce and larch; consequently, differences in the substrate are expected to be traceable also during CWD decomposition. Moreover, we hypothesized that CWD quality would vary with elevation and exposure, since climatic conditions not only affect the rate of CWD decomposition, but also the chemical composition of the remaining CWD. We assumed that more favorable climatic conditions enhanced the decomposition occurring at the south-facing and low-elevation sites of the chosen area. As a consequence, a greater loss of cellulose and a stronger increase in nitrogen and phosphorus, along with a higher (less negative) δ13C, are expected at south-facing sites, due to the enhanced growth of fungal mycelia within the wood.
Materials and methods
Study area, investigation sites and experimental setup
The investigation area was located in Val di Sole and Val di Rabbi, Trentino, in the south Alpine belt of northern Italy (Fig. 1). The climate of the valleys ranges from temperate to alpine (above the timberline). Mean annual temperature varies from 8.2 °C in the valley floor to about 0 °C at 2400 m a.s.l., and mean annual precipitation approximately from 800 to 1300 mm ([45]). The geological substrate is paragneiss debris at all the sites. Soil units are Cambisols, Umbrisols and Podzols (WRB, [27] - Tab. 1). The timberline is close to 2000-2200 m a.s.l. and the forests are dominated by Norway spruce (Picea abies (L.) Karst) and at the highest altitudes by European larch (Larix decidua Mill.).
Fig. 1 - Location of the study area (Val di Sole and Val di Rabbi) with major vegetation units and the investigation sites: north-facing (N01-N02-N03-N04) and south-facing sites (S01-S02-S03-S04). Data source: Museo delle Scienze (Trento), CORINE Landcover (Joint Research Center of the European Union) and scilands GmbH.
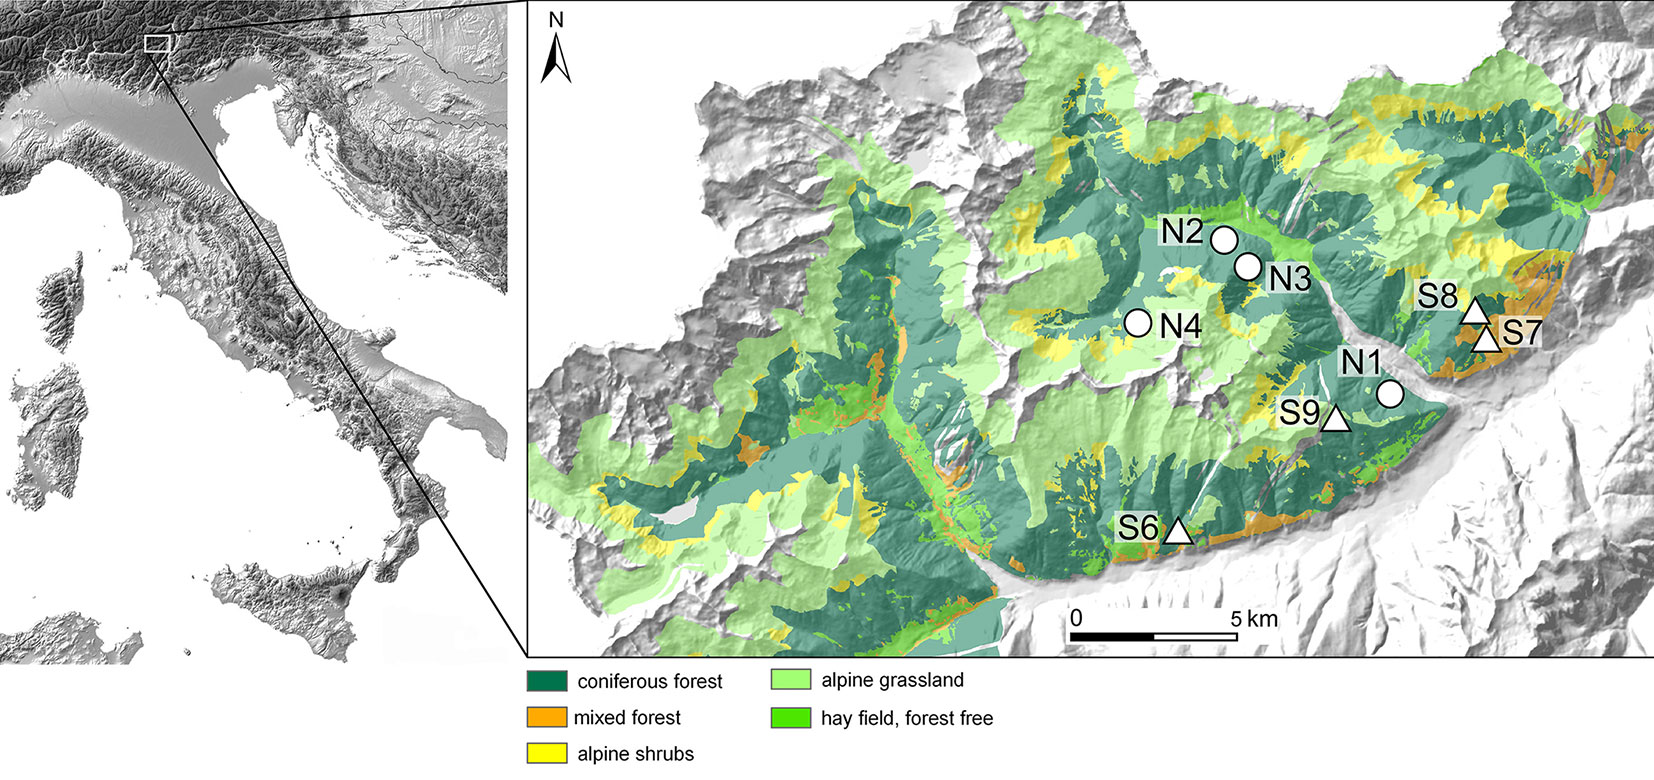
Eight plots along two altitudinal transects (climosequences) were investigated: one north- and one south-facing. Each climosequence included four sites from 1200 up to 2000 m a.s.l. (Tab. 2, Fig. 1). Using this approach, a broad temperature range (approx. 6.2° C differences in mean annual air temperature between coldest and warmest site) was covered having distinctly different thermal conditions. Differences in surface temperature between north- and south-facing sites in the Alpine area are usually between 2 and 3 °C ([3]). The following thermal sequence (from warmer to cooler sites) for the chosen sites (Tab. 1) is given: S06 (1200 m a.s.l., south) > S07 (1400 m a.s.l., south) > N01 (1200 m a.s.l., north) ≈ S08 (1600 m a.s.l., south) > N02 (1400 m a.s.l., north) > N03 (1600 m a.s.l., north) ≈ S09 (2000 m a.s.l., south) > N04 (2000 m a.s.l., north). We investigated natural and typical forest sites for this part of the Alps. The dominant tree and deadwood species is Norway spruce at 1200 and 1600 m a.s.l., both at the north- and south-facing sites (Tab. 2). At 1400 m a.s.l., Norway spruce is dominant at the north-facing slope, and European larch at the south-facing slope. At 2000 m a.s.l. the dominant species is European larch.
Tab. 2 - The five decay-class system of log decomposition (according to [26]).
| Log features |
Decay classes | ||||
|---|---|---|---|---|---|
| 1 | 2 | 3 | 4 | 5 | |
| Bark | Intact | Partially absent | Absent | Absent | Absent |
| Twigs | Present | Partially absent or absent | Absent | Absent | Absent |
| Shape of radial section | Round | Round | Round | Oval | Very oval |
| Colour | Original | Original | Faded in the external part | Reddish brown or faded | Reddish or faded |
| Texture of wood | Intact | Intact | Soft outer layer, intact inner part | Small pieces, soft | Powdery or fibrous, very soft |
| Contact with soil | Log elevated on what remains of branches | Log in contact with soil | Log in contact with soil | Log in contact with soil | Log in contact with soil and partially buried |
CWD volume assessment within the plots
At each plot, a fixed square area of 25 × 25 m was delimited. Within this area, all CWD having a minimum diameter of 5 cm and a length of ≥ 100 cm was measured (length, maximum diameter and minimum diameter). Furthermore, the decay class was registered for the CWD. We classified CWD of Norway spruce and European larch using the five decay-class system ([26]). This system is based on visual, geometric and tactile features (Tab. 2). The CWD volume was calculated using the geometric formula of the circular truncated cone (eqn. 1):
where V is the volume, h is the length of the CWD and r1 and r2 are the upper and lower radius, respectively.
When standing dead trees were present, they were also recorded and measured (height and diameter at 1.30 m above the ground). The volume of standing dead trees was estimated using the double-entry volume tables specific for Norway spruce and European larch of this region ([11]). The total volume of deadwood within the fixed area was referred to one hectare. The CWD carbon stocks (Mg ha-1) were calculated for every single site using the eqn. 2:
where i is the decay class, V is the volume (m3 ha-1) referred to one hectare, CC is the carbon concentration (%) and ρ is the density (g cm-3). For the conversion of deadwood volume into C stocks, average values of density and C concentrations for each single decay class were used.
Sample collection and preparation
At all sites, we selected circular areas having a radius of about 50 m. Such extension (compared to the CWD assessment) was chosen in order to obtain enough replicates for each decay class. Each log was assigned to a single decay class ([26]). In a few cases (less than 5% of the total sampled logs) a log could be assigned to more than one decay class. In these cases, samples were then taken from the portion where a clear assignment to a single prevalent decay class was possible. At least 3 samples of each decay class were taken at all sites. When this minimum number was not reached within the sampling area, we explored the adjacent surroundings until the minimum sample number was reached. Samples were taken randomly and using a manual saw or, in more advanced stage of decay, simply by hands. For CWD in decay classes 1, 2 and 3, cross-sections of 5-10 cm thickness were taken. For the more advanced decay stages, a 25 × 30 cm bag was filled. The same number of replicates could not always be collected for each decay class at each site because of the different amount and accessibility of deadwood. Overall, 177 samples were analyzed. Focus was given on Norway spruce samples (because this species is dominant in the region). At the highest sites, the forest is dominated by European larch, whose CWD was sampled here, while Norway spruce was almost absent and no samples could be taken. At all other sites only Norway spruce samples were taken. At the south-facing site at 1400 m a.s.l., predominantly European larch was found (together with Norway spruce). To enable a better comparison between north- and south-facing sites, Norway spruce samples were taken at this site.
In addition, sample replicates of three different living trees were taken (at a breast height of 1.3 m) at each plot using an increment wood corer (Suunto) having a diameter of 5 mm. The trees were cored to the pith from two opposite directions so that two wood cores were obtained from each selected tree. The two cores from the same tree were pooled together.
All samples were weighed and dried in the oven at 50°C until a constant weight was attained. For chemical analyses, all samples were milled to a powder (< 60 µm) using a planetary ball mill. Prior to this operation, mosses and soil particles were removed using a brush. Bark (when present) was also removed in order to avoid an unnecessarily broader variability in chemical composition ([23]). Sapwood and heartwood were pooled together to avoid differences between classes in which sapwood and heartwood were still distinct and classes in which such a distinction was no longer possible.
Density
Density was measured in the CWD only and calculated as the ratio between the dry weight at 50 °C and the fresh volume. The volume of each sample was estimated by water displacement. The samples of the decay classes 3, 4 and 5 were first vacuum sealed in plastic bags to avoid water-absorption and wood-particle dispersion in water. Vacuum sealing was performed using a food-packaging sealer. To avoid compaction of CWD of classes 4 and 5, sealing was performed using a low energy level. Using plastic-covered samples, the volume may be overestimated when hollows are present (due to e.g., heart-rot fungi). By measuring small fragments (about 6 cm3), the volume estimation error is minimized because only micro-pores are present. Furthermore, the volume of the plastic bag alone was subtracted from the sample volume. To estimate the accuracy of the method, standard wood blocks (5 × 5 × 2 cm) were used to measure water displacement with and without vacuum sealing. The differences between the resulting densities were in the range of 2-5%.
Cellulose and lignin determination
To obtain α-cellulose ([7]), 10 mg of powdered wood were weighed in Teflon pockets for chemical and thermal treatments. Samples were first washed in a 5% NaOH solution at 60 °C for two hours, then for an additional two hours using a 5 % NaOH solution and finally rinsed three times using boiling distilled water. The samples were then washed in a 7 % NaClO2 solution at 60 °C for 30 hours, changing the solution at least every 10 hours, and finally rinsed three times using boiling distilled water. The pockets were dried in the oven at 50°C and the cellulose content was determined by the difference from the initial weight. The so-called Klason lignin (lignin insoluble in strong acid - [13]) was determined gravimetrically after a sequential extraction: 0.2 g of each sample was washed three times using 5 ml of distilled water at 80 °C. After each washing, the samples were centrifuged for 10 min at 4500 rpm. The samples were dried in the oven at 80 °C and washed three times using 5 ml of ethanol, centrifuged again (10 min. at 4500 rpm), the supernatant discarded and then dried at 60 °C in the oven. Some 60 mg of each sample was treated with 0.6 ml 72% H2SO4 in a warm bath (30 °C) for one hour, and then, by adding 16.8 ml of distilled water, in an autoclave at 120 °C for one hour. Subsequently, the samples were filtered and the filtrate was used for the determination of the acid-soluble lignin. The insoluble lignin was dried in the oven at 105 °C and determined as the difference from the initial weight.
Carbon concentration and δ13C
The total carbon content and the δ13C isotopic ratio were both measured using a Picarro analyser for isotopic CO2 (Combustion Module-Cavity Ring Down Spectroscopy CM-CRDS, Sunnyvale, California, USA). Wood powder (4.5-5.5 mg) was weighted into tin capsules and combusted at 950 °C. The released amount of CO2 was measured using a CRDS analyser (Picarro, G2131 type). We used two internal standards (Miscanthus spp. and Betula spp. wood) every 6 samples in order to correct for potential drift in the δ13C and C content values. The internal standards were previously analysed (at the Paul Scherrer Institute, PSI, Switzerland) using an elemental analyser (EA 1110, Carlo Erba, Thermoquest, Italy) and an isotope-ratio mass spectrometer (Delta S. Thermo Finnigan MAT, Thermo Electron GmbH, Germany). The measured δ13C values were -27.7 ‰ and -12.72 ‰ for Betula spp. and Miscanthus spp., respectively. The results of the isotope analysis are expressed as a δ value (‰) relative to the international Pee Dee Belemnite standard as follows (eqn. 3):
where δ13C is expressed in permil (‰), R is the ratio 13C/12C, S is the sample and St is the standard. Calibration was carried out using the international standards IAEA-USGS24, IAEA-CH-6 and IAEA-CH-7.
Nutrients
The nutrient contents (N, P, K, Ca, Mg, Fe, Mn) in the CWD and in each single living tree sample were measured. Sub-samples of the CWD samples of the same plot and decay class were pooled (5 decay classes × 8 sites = 40 samples). The total content of N was determined using a CN analyser (Vario Macro CN, Elementar, Hanau, Germany - combustion analysis) and the content of P, K, Ca and Mg using ICP-OES (Optima 8300, Perkin Elmer, Waltham, USA) after acid digestion of 0.5 g of powdered wood with 4 ml of HNO3 in a closed vessel (UltraWAVE Milestone, Shelton, CT, USA - max temperature 230 °C).
Statistical analyss
Data were first checked for normal distribution by a Shapiro-Wilk test (SigmaPlot® ver. 11.0, Systat Software Inc. - [28]). CWD data showed significant departure from normality, while for living trees only a part of the data were normally distributed. No normal distribution was achieved even after several types of data transformations (i.e., square, square root, logarithm, Box-Cox), therefore the U-test (Mann-Whitney) was used to test for differences between two groups. For data showing a normal distribution, a Student’s two-tails t-test was applied. The Spearman’s rank correlation coefficient was used when the data did not show a normal distribution. To perform multiple comparison tests for non-parametric data, one-way ANOVA (Kruskal-Wallis test) was applied using the package “pgirmess” of the software R. The level of significance was p < 0.05.
Results
Effect of different tree species on wood properties of living trees and CWD
The results of the statistical analysis carried out revealed significant differences in several parameters of living trees between Norway spruce and European larch (hereafter referred as spruce and larch). Contrastingly, most variables in CWD did not differ between the two species (Tab. 3). In decay class 1, spruce wood was less dense than larch wood (0.44 vs. 0.59 g cm-3, respectively). During the decomposition, however, such difference steadily became smaller, and finally the two species reached the same value in the decay class 5 (0.2 g cm-3).
Tab. 3 - Comparison of chemical and physical characteristics between Norway spruce and European larch. Mean values (± standard deviation) are given only for parameters showing significant differences between the two species. With respect to CWD, only the density in decay class 1 was found to differ significantly between the two species.
| Type | Parameter | Spruce | Larch | P-value |
|---|---|---|---|---|
| Living trees | Cellulose (%) | 45.10 ± 3.90 | 39.40 ± 4.80 | 0.004 |
| Carbon (%) | 45.20 ± 0.80 | 43.50 ± 1.50 | 0.004 | |
| K (g/kg) | 0.51 ± 0.29 | 0.20 ± 0.07 | < 0.001 | |
| Ca (g/kg) | 1.24 ± 0.56 | 0.61 ± 0.40 | < 0.001 | |
| Fe (mg/kg) | 33.80 ± 21.99 | 11.19 ± 7.66 | < 0.001 | |
| Mn (mg/kg) | 50.47 ± 14.22 | 14.19 ± 3.77 | < 0.001 | |
| CWD | Density in decay-class 1 (g cm-3) | 0.44 ± 0.15 | 0.59 ± 0.11 | 0.027 |
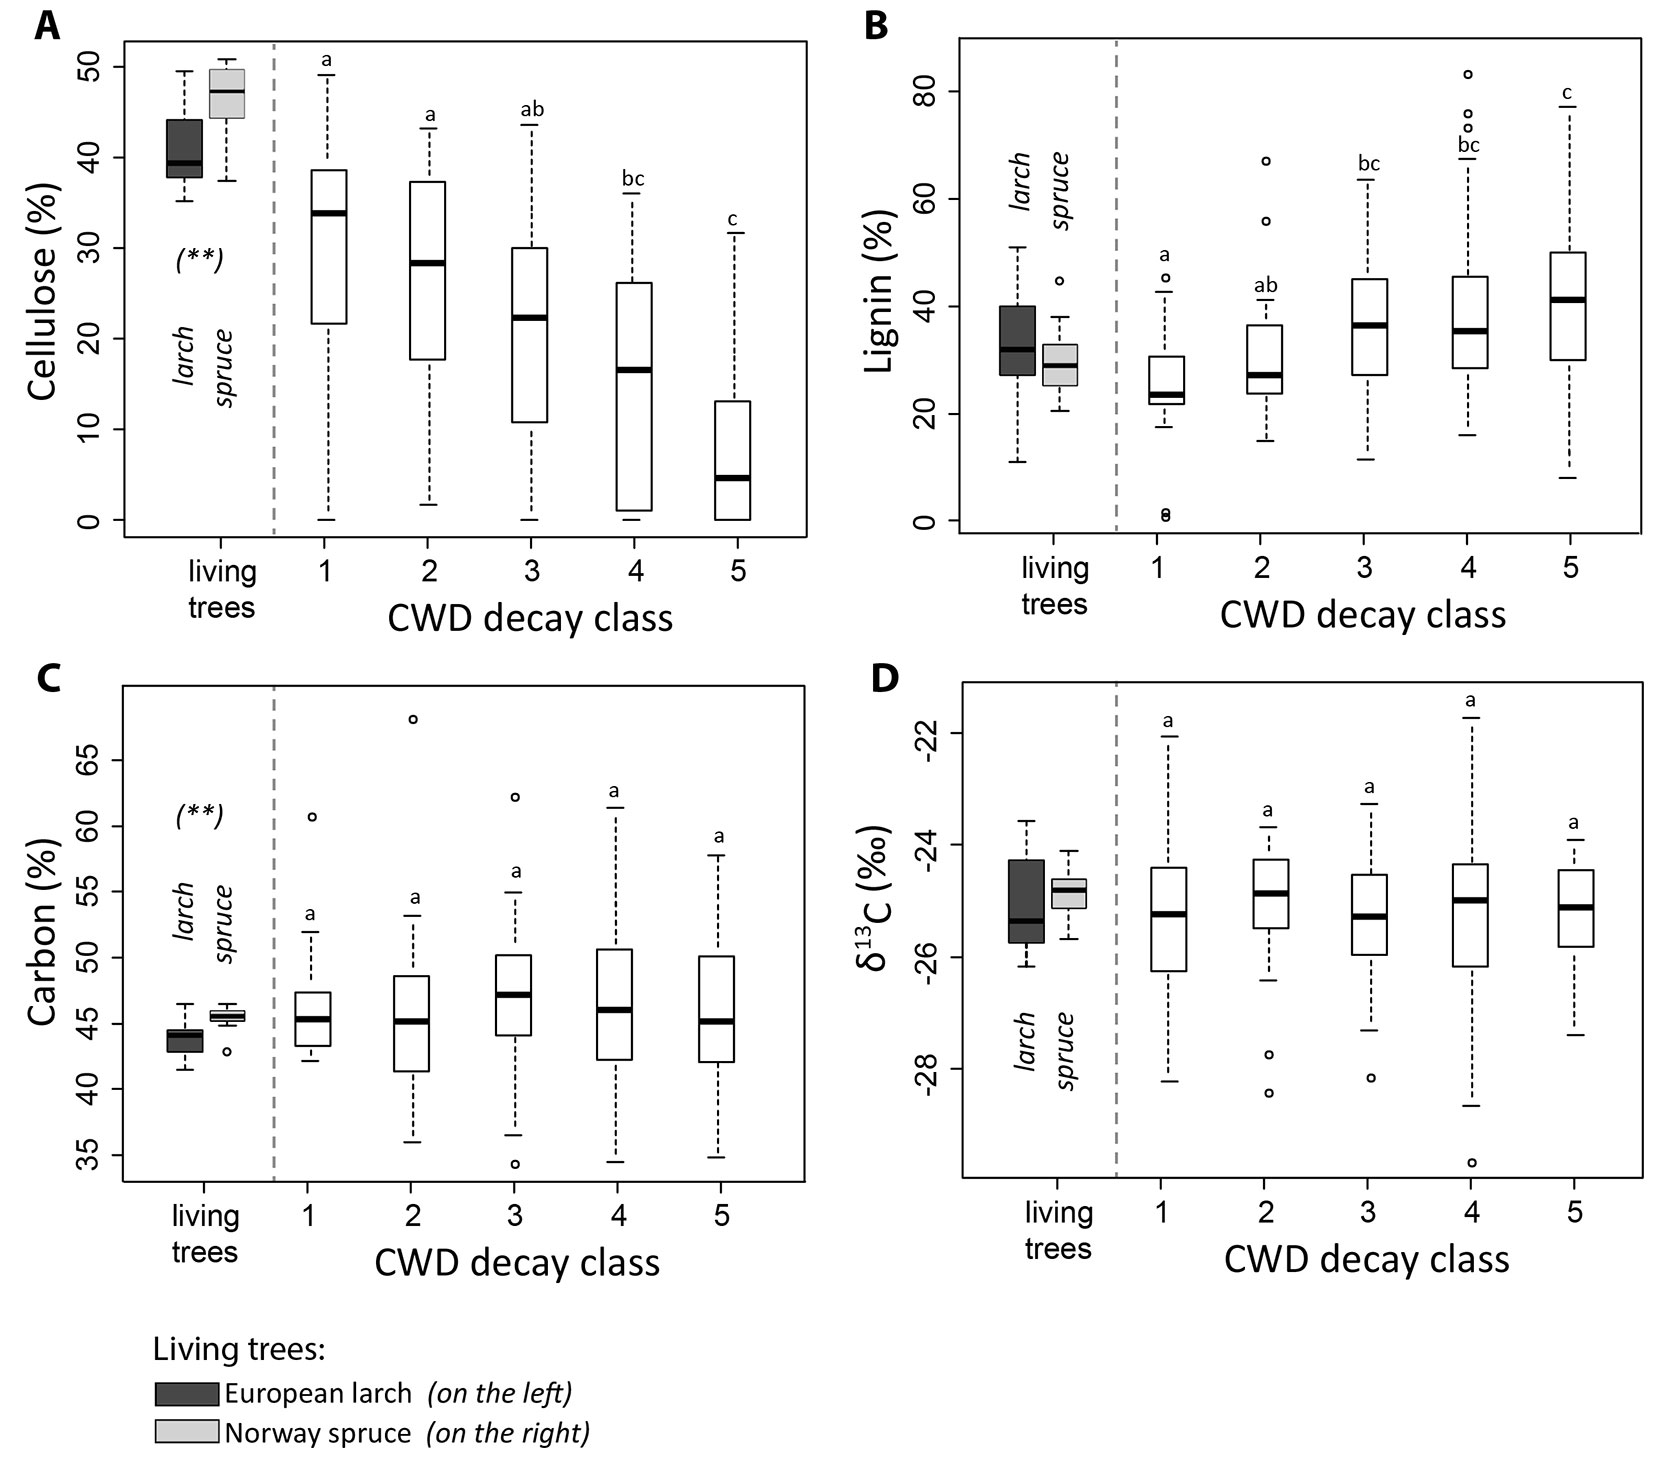
Wood of living spruce trees had significantly more cellulose (45% for spruce vs. 39% for larch) and slightly less lignin (Fig. 2A, Fig. 2B) than larch. The difference in lignin content was, however, not significant (27% in spruce, 29% in larch). Although very small, some differences in the total carbon content between the two tree species could be measured (45.2 vs. 43.5% for spruce and larch, respectively).
Fig. 2 - Box plots for decay-classes 1 to 5 (both tree species, larch and spruce, are treated as one entity; see text for explanation) and living trees (distinction between spruce and larch) with respect to: (A) α-cellulose; (B) Klason lignin; (C) carbon; (D) the isotopic ratio δ13C. Different letters indicate significant differences among the decay classes tested with multiple comparison tests (non-parametric ANOVA, Kruskal-Wallis) with a significance level at P < 0.05. For living trees, differences between European larch and Norway spruce are indicated as follows: (*) P < 0.05; (**): P < 0.01; (***): P < 0.001.
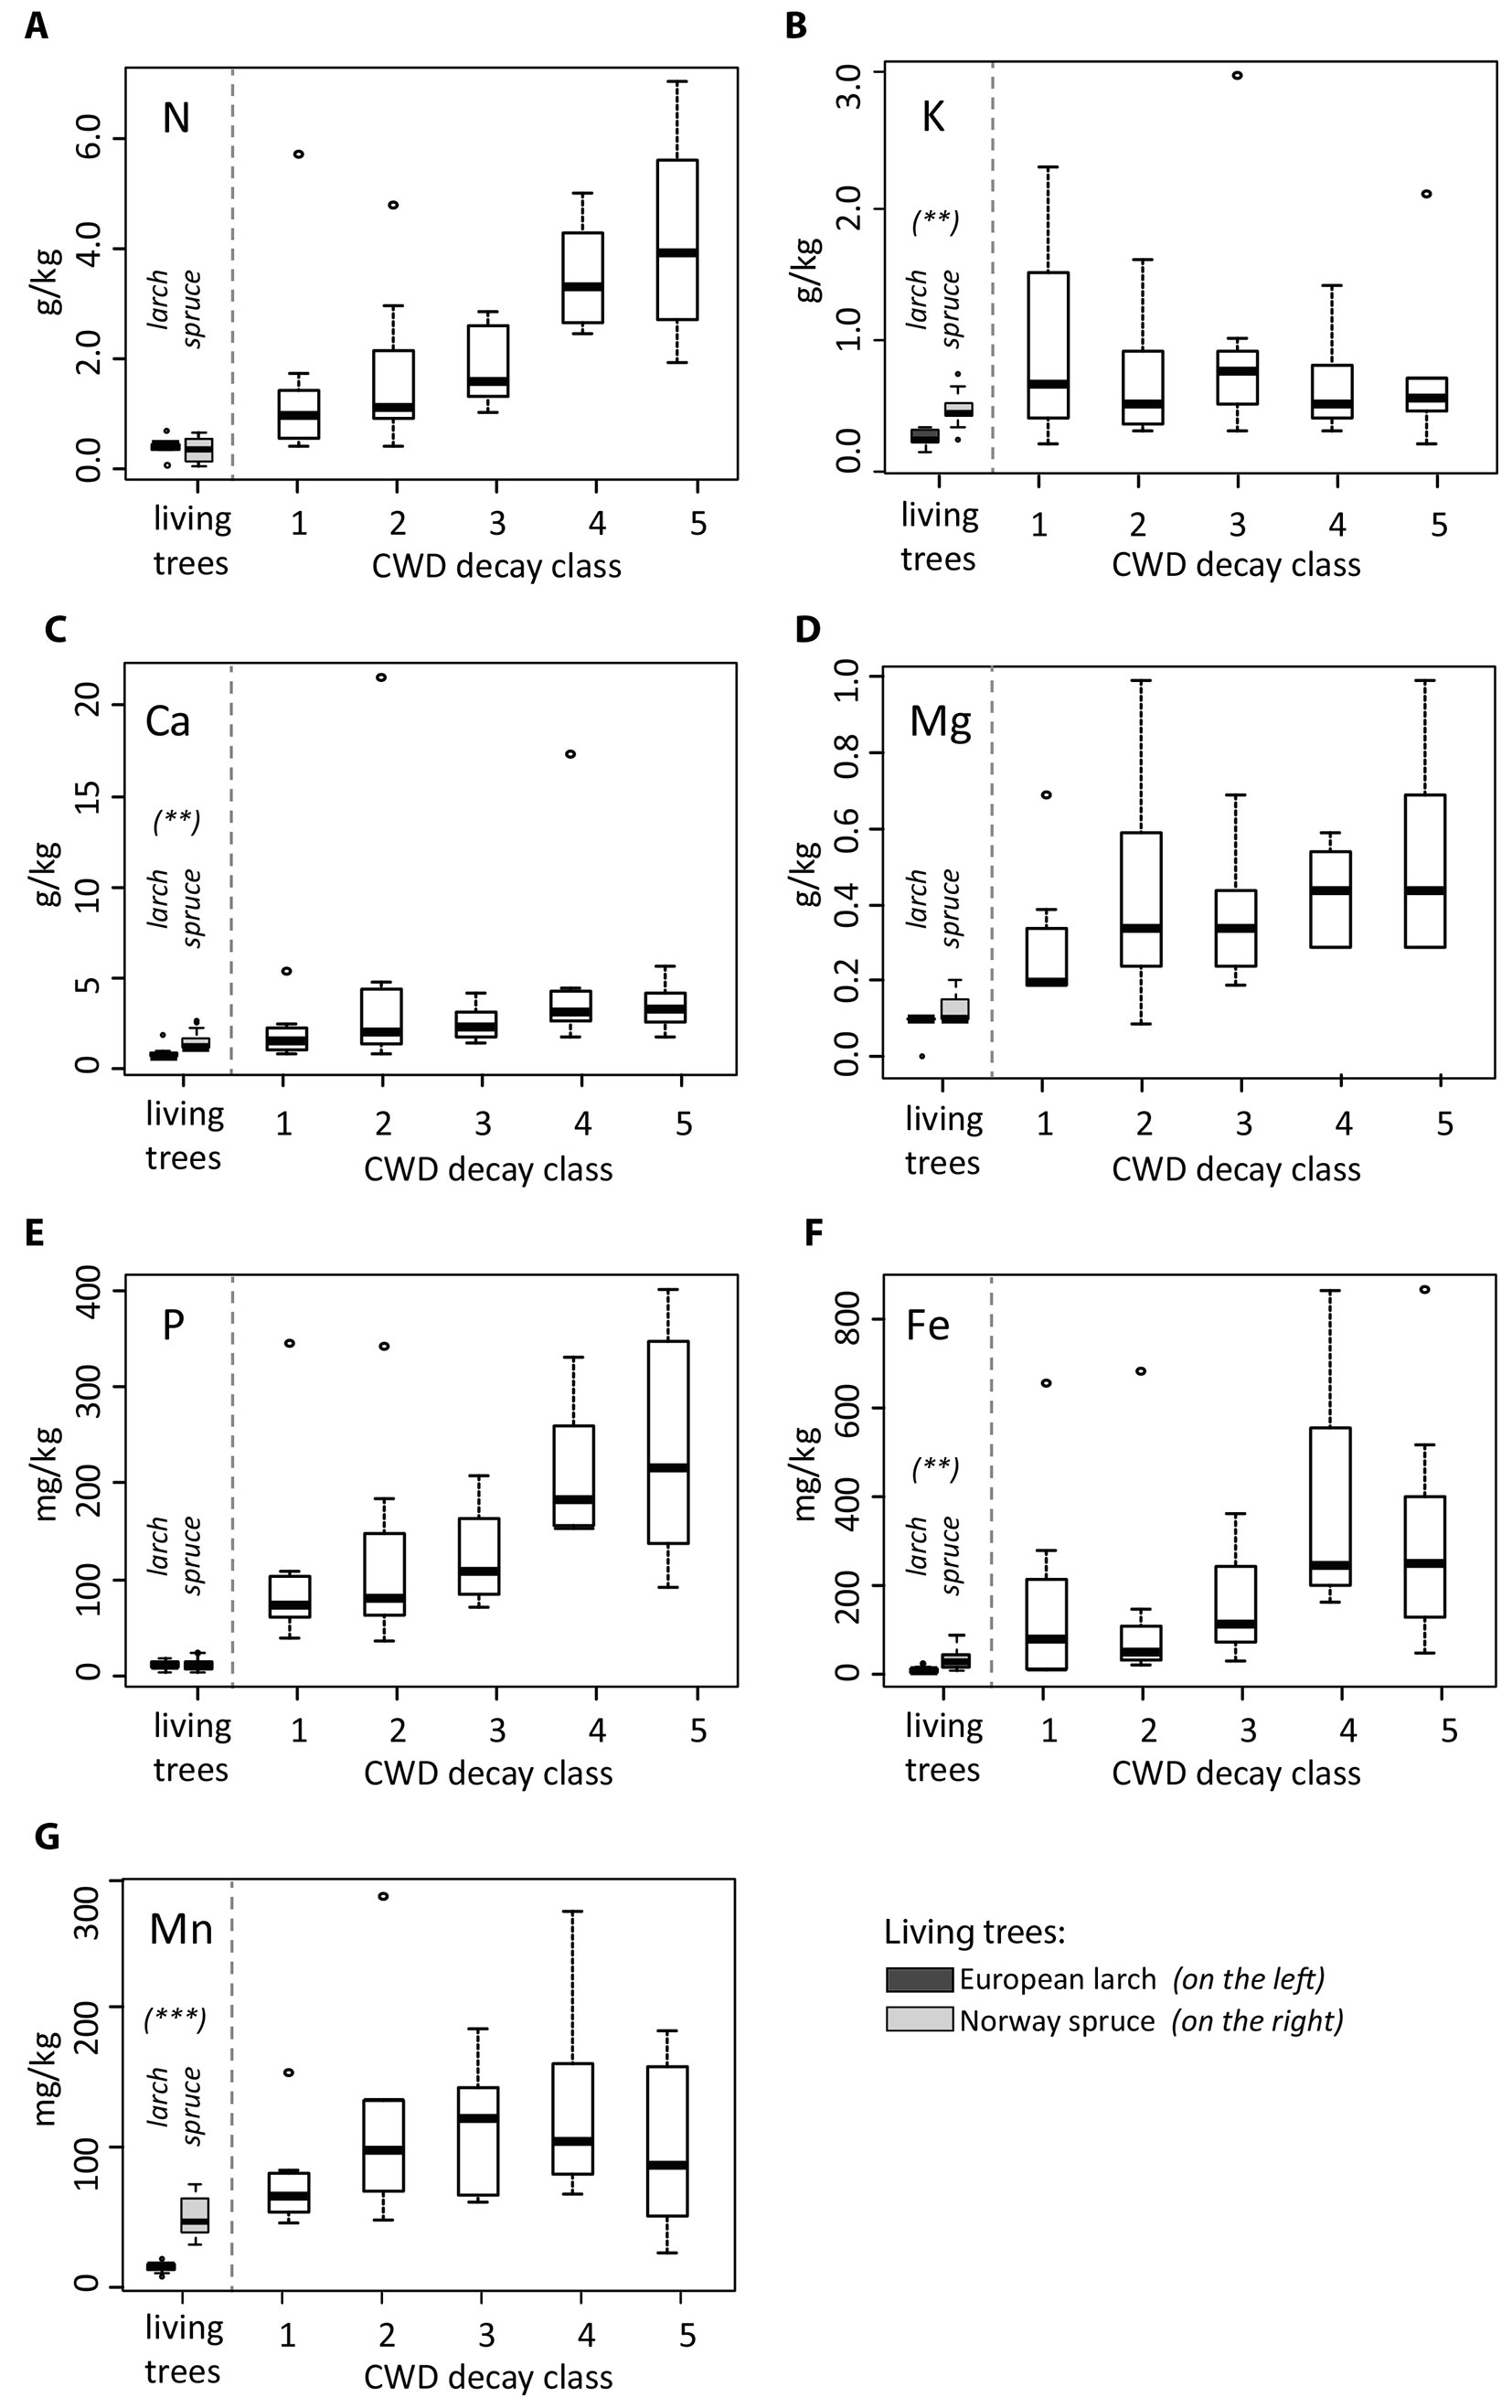
Carbon, nitrogen and phosphorus had similar values for spruce and larch both in the living trees and CWD. As for living trees, Mg, K, Fe and Mn were usually more abundant in spruce than in larch (Fig. 3). However, no differences between larch and spruce could be detected in the CWD with respect to cellulose, lignin and all other major or minor nutrients (Tab. 3). Based on this result, we consider the whole dataset as one entity (spruce and larch) for further statistical analyses.
Fig. 3 - Elemental concentrations in the living trees and deadwood. Differences between the two types of living trees (European larch and Norway spruce) are indicated as follows: (*) P < 0.05; (**): P < 0.01; (***): P < 0.001. With respect to CWD, no distinction between spruce and larch is made and the dataset is treated as one entity (see text for explanation).
Physical-chemical properties of CWD during decomposition
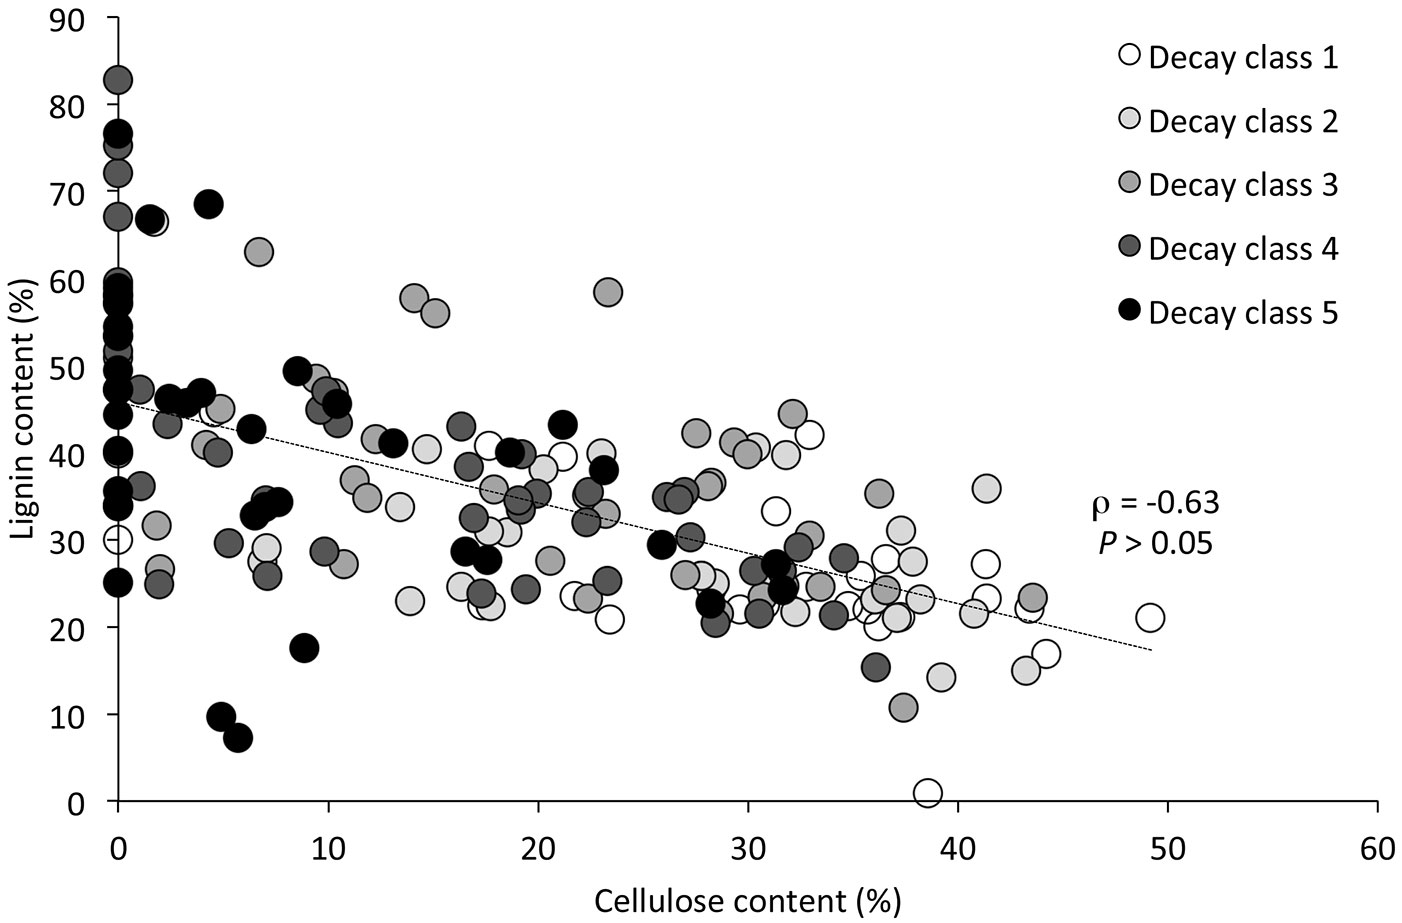
The decay stage was a determining factor for several major compounds (water content, density, cellulose, lignin, nitrogen, phosphorus and iron). For the carbon concentration, δ13C and several elements; however, no statistically significant relation to the decay class could be detected. The water content of CWD increased with increasing the decay class, with a particularly significant differences between the decay classes 1-2-3 and 4-5 (Fig. 4A). The wood density exhibited a clearly opposite trend (Fig. 4B). Both cellulose and lignin correlated well with the decay classes. Furthermore, a significant negative correlation between these two components was found (ρ = -0.63; P < 0.05 - Fig. 5).
Fig. 4 - Water content (A) and wood density (B) given for the individual decay classes (spruce and larch is treated as one dataset; see text for explanation). Different letters indicate significant differences among groups tested using multiple comparison tests (non-parametric ANOVA, Kruskal-Wallis) with a significance level at P < 0.05.
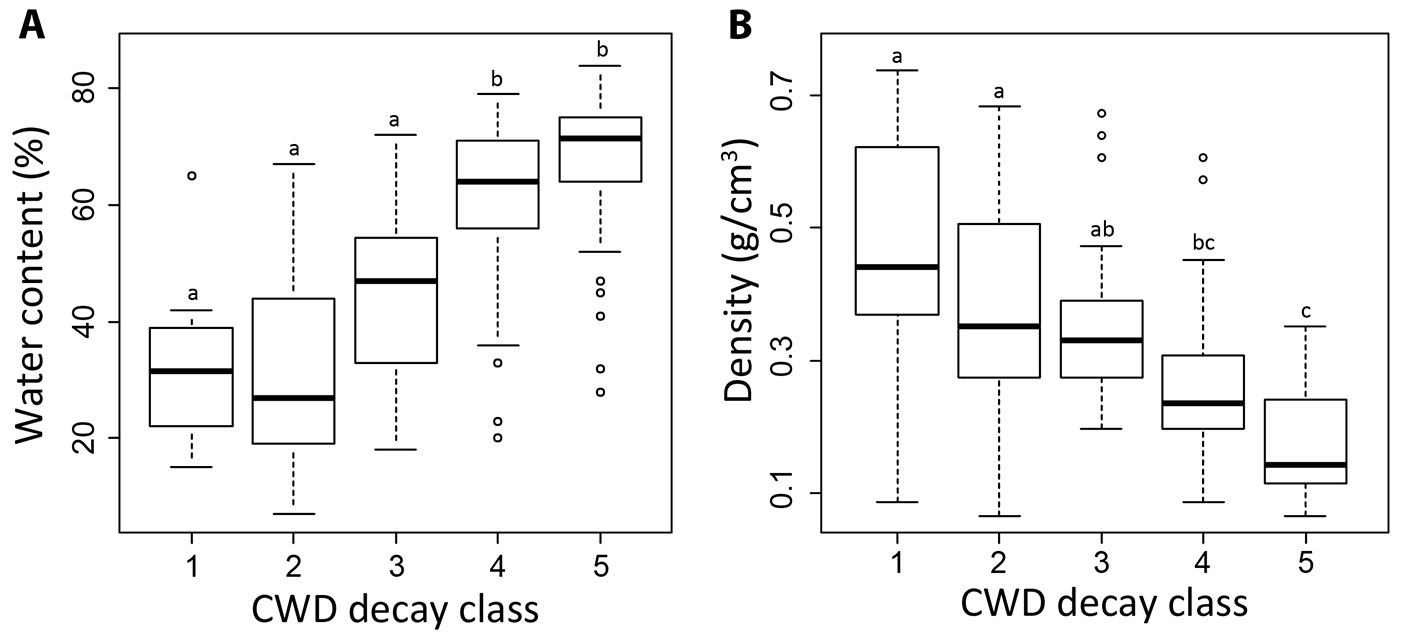
Fig. 5 - Correlation (Spearman’s rank correlation coefficient) between the cellulose and lignin content in the deadwood.
With increasing decay stage, the cellulose content decreased steadily (P < 0.001 - Fig. 2A). In the last two decomposition stages (decay classes 4 and 5), several samples (33%) did not contain any cellulose at all. Differences in cellulose content between adjacent decay classes were statistically significant in all cases except for classes 1 and 2. In contrast to cellulose, the lignin content increased with increasing decay stage (Fig. 2B). The carbon concentration of CWD (46% on average) did not exhibit any significant variations among decay classes (Fig. 2C). A similar pattern was found for the δ13C isotopic ratio (-25.26 ‰ on average), with no significant differences and no evident trend across decay classes (Fig. 2D). Nitrogen and phosphorus concentrations steadily and significantly increased with increasing decay class (Fig. 3A, Fig. 3E). Iron had a significant (P = 0.03) increase in classes 4 and 5 (Fig. 3F), while manganese was most abundant in classes 2, 3 and 4 (Fig. 3G). However, for the other elements (Ca, Mg, K) no distinct trend was found. All element concentrations were significantly higher (P < 0.001) in the CWD compared to the living trees (Fig. 3).
Influence of elevation and exposure on physical-chemical properties of CWD
Compared to the south-facing sites, the average water content of samples seemed to be slightly higher at the north-facing sites in decay class 1 (34 ± 14 % vs. 30 ± 9 %, respectively), decay class 4 (63 ± 11 % vs. 59 ± 17 %, respectively) and decay class 5 (72 ± 9 % vs. 62 ± 15 %, respectively). However, these differences were statistically significant only in the last case (north vs. south in class 5, P = 0.018). If all decay classes are considered together, no significant effect of elevation and exposure on the water content was found (Tab. 4). To a certain degree, density seemed to be influenced by elevation (statistical significant correlation with elevation, P = 0.017 - Tab. 4). This trend, however, might be slightly biased by the fact that CWD density in decay class 1 is higher in larch than in spruce. Furthermore, the larch samples were from the highest sites. The cellulose concentration in CWD showed significantly higher values in decay classes 1 at north-facing sites compared to south-facing sites (38 vs. 23 %, respectively; P = 0.002 - Fig. 6). With increasing decay class, the differences became smaller or non-existent (Fig. 6).
Tab. 4 - Effect of the decay stage (decay-class), elevation and exposure on chemical and physical parameters. The Spearman’s rank correlation coefficient ρ was used for the comparison of chemical and physical wood parameters with the factors “Decay class” and “Elevation”. Significant relationships with p < 0.05 (*), p < 0.01 (**) and p < 0.001 (***) are indicated. The Wilcoxon-Mann-Withney test was used (probability values P are given) to derive wood parameters differences between north- and south-facing slopes (factor “exposure”). (1): n = 177; (2): n = 40.
| Parameter | Decay-class (ρ) |
Elevation (ρ) |
Exposure (P) |
|---|---|---|---|
| Water content (1) | 0.72*** | -0.11 | 0.312 |
| Density (1) | -0.62*** | 0.19 * | 0.919 |
| Cellulose (1) | -0.55*** | 0.05 | 0.116 |
| Lignin (1) | 0.38*** | 0.01 | 0.007** (north: lower content) |
| C (1) | -0.01 | -0.14 | 0.830 |
| δ13C (1) | -0.00 | 0.24** | 0.004** (north: more negative) |
| K (2) | -0.08 | -0.32* | 0.369 |
| Ca (2) | 0.41** | -0.45** | 0.323 |
| Mg (2) | 0.37* | -0.24 | 0.069 |
| P (2) | 0.58*** | -0.34* | 0.565 |
| Fe(2) | 0.46** | -0.21 | 0.072 |
| Mn (2) | 0.20 | -0.29 | 0.678 |
| N (2) | 0.66*** | -0.28 | 0.337 |
Fig. 6 - Concentration of cellulose and lignin in decay classes 1 and 5 of CWD as a function of exposure (north- vs. south-facing sites). Differences between north- and south-exposure only exist at a low decay stage. The median value and the 25- and 75-percentile are given as error bars.
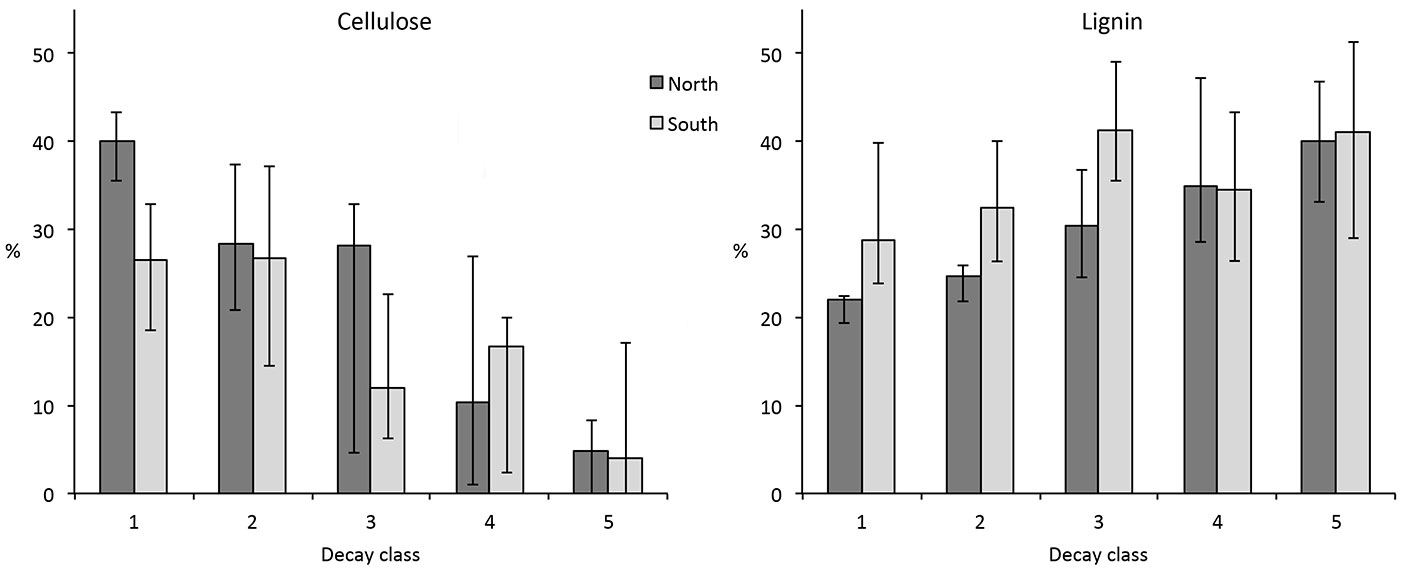
When all decay classes pooled together are taken into account, however, the effect of site exposure and elevation on the cellulose content did not seem to be relevant (P > 0.05 - Tab. 4). This is in contrast to the lignin content, which exhibited a highly significant difference (P = 0.007) between opposite aspects (Tab. 4). Lignin showed significantly lower concentrations particularly in the decay classes 1, 2 and 3 at the north-facing sites (22%, 25%, 30% at north-facing sites vs. 29%, 32%, 41% at south-facing sites).
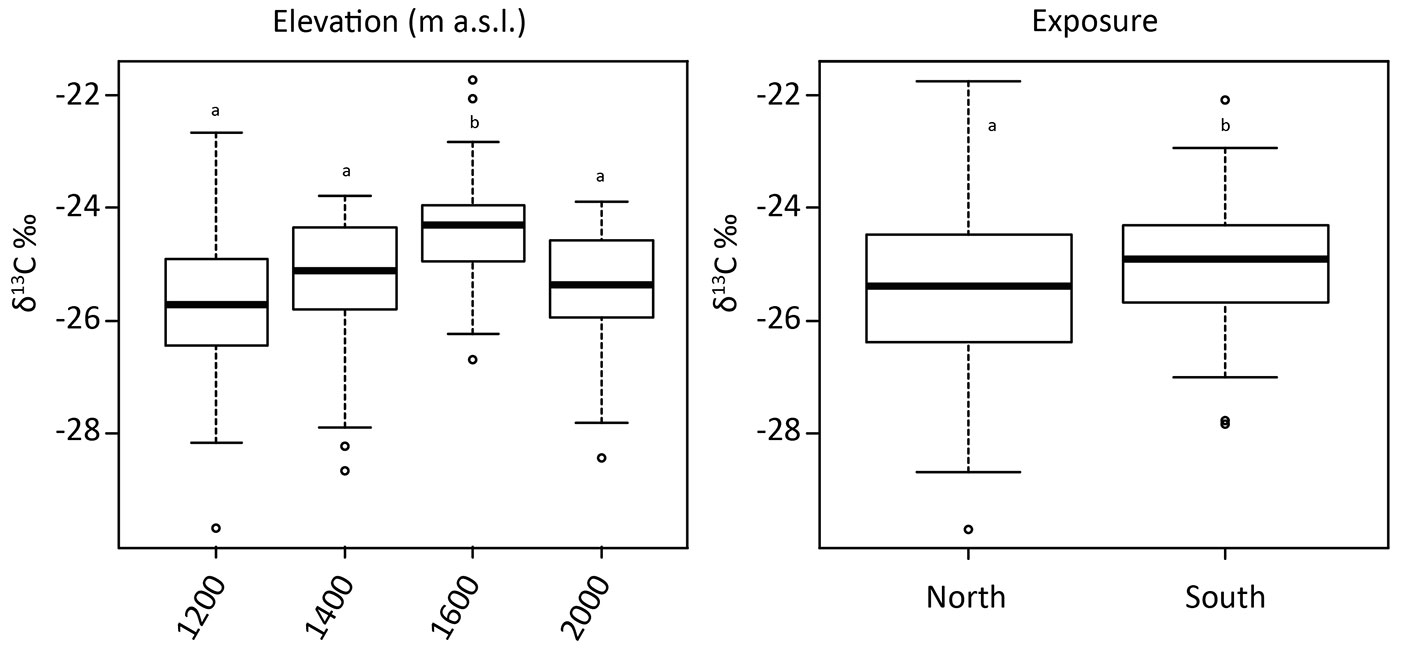
No significant effect of elevation on lignin was detected. Carbon concentrations significantly varied (although the differences were small) with elevation (average values: 48 % at 1200 m a.s.l., 45 % at 1400 and 1600 m a.s.l., 46 % at 2000 m a.s.l.), but site aspect had no effect. The carbon isotopic signature (δ13C) was the only parameter that was significantly influenced by both site elevation and aspect (Tab. 4). The δ13C isotopic ratio was less negative with increasing elevation up to 1600 m a.s.l., and again more negative at 2000 m a.s.l. (Fig. 7, left panel). The more negative value at 2000 m a.s.l. was probably caused not only by climate but more likely by the change from spruce to larch CWD. Moreover, CWD of the south-facing sites had, in general, a significantly (P = 0.004) less negative isotopic ratio compared to the north-facing sites (Fig. 7, right panel). Consequently, the δ13C isotopic ratio reflected the different climatic conditions to a certain extent. Elevation had a significant effect on the calcium concentration that decreased in the CWD along the altitudinal gradient from 4.5 g kg-1 at 1200 m to 1.2 g kg-1 at 2000 m a.s.l. (average values). Also the K concentrations were significantly lower at the uppermost site (0.8 g kg-1 at 1200 m a.s.l., vs. 0.3 g kg-1 at 2000 m a.s.l.). A similar significant trend with altitude was also detectable for phosphorous. No significant effect of the site aspect on nutrient concentrations was found.
Fig. 7 - δ13C values (represented as box plots) as a function of the four different elevations (left panel) and exposure (right panel). Different letters indicate significant differences (P < 0.05).
C-stocks in CWD
The values of the CWD volume and related carbon stocks at the eight study sites are reported in Tab. 5. The C-stocks were not uniform along the toposequences and varied between 3 and 17 Mg ha-1. Due to the low number of observations, no statistically robust trend as a function of altitude or exposure could be calculated, though the average value of the north-facing sites was slightly higher (9.75 Mg ha-1) compared to the south-facing sites (8.25 Mg ha-1).
Tab. 5 - Deadwood volume (m3 ha-1) and C stock (Mg ha-1) for each plot.
| Plot | Volume (m3 ha-1) |
C stock (Mg ha-1) |
|---|---|---|
| N01 | 78 | 17 |
| N02 | 45 | 9 |
| N03 | 55 | 10 |
| N04 | 18 | 3 |
| S06 | 16 | 3 |
| S07 | 52 | 14 |
| S08 | 70 | 10 |
| S09 | 22 | 6 |
Discussion
Norway spruce and European larch characteristics
In spite of the complex experimental design (nested, unbalanced), with two different species (Norway spruce and European larch), we were able to define common patterns of CWD decomposition. Different authors investigated the role of species-specific traits in wood decomposition ([52]). However, the two coniferous species under investigation which are commonly found in the Alps did not exhibit a species-specific behavior with respect to the physico-chemical characteristics of the decay classes. We were able to demonstrate that physico-chemical parameters undergo distinct changes at different decomposition stages (see below), and that they can be (but not always are) influenced by elevation and/or site aspect. Furthermore, some other CWD properties are clearly influenced by elevation and/or aspect, but do not vary along the decomposition process (such as C and δ13C).
Physical-chemical parameters changing with decomposition stage, but less strongly affected by elevation and
The increasing water content and the decreasing density of CWD along the decomposition process can be explained by the gradual loss of wood structure. Water content of CWD is often reported to correlate negatively with wood density ([34]). Also Bütler et al. ([10]) described a similar pattern. In contrast to our results, Pichler et al. ([37]) found a U-shaped distribution of the water content values, with a tendency to drier conditions in class 2 and a distinct increase in moisture in class 3. In this study, the highest difference in water content between north- and south-facing sites was found in the decay class 5, when deadwood was in close contact to soil and partly mixed with it. For this reason, it can be assumed that site exposure drives changes in soil moisture regime ([16]), which are also reflected by the CWD water content. The measured nutrient concentrations in CWD fit well to those documented in the literature ([32], [35]). However, P concentrations at the investigated sites were slightly higher than those reported elsewhere ([10], [24]). Deadwood is in general a rather nutrient-poor substrate when compared to litter, leaves and needles ([53], [50]). With increasing the decay stage, the elemental contents (nitrogen and phosphorus) usually increase. An increase in elemental contents in deadwood during decomposition has also been reported by Bütler et al. ([10]), Palviainen et al. ([35]) and Lombardi et al. ([33]). These authors ascribe this phenomenon to the active nutrient transfer from the forest floor by mycelia cords of wood-decaying fungi ([22]). Apart from this, an increase in nutrients is also due to a relative enrichment caused by organic matter decay (and thus loss in carbon and mass in general). By performing a mass balance calculation, an active nutrient transfer can be distinguished from a passive enrichment. For this purpose, a volume-based calculation was done using the following equation (eqn. 4):
where EFi is the the enrichment factor of the component of interest in the decay class i, Ci is the concentration in the decay class i, ρi is the the density of CWD in the decay class i, C1 is the concentration in the decay class 1 and ρ1 is the the density of CWD in decay class 1. An EF value < 1 indicates a depletion and a value > 1 indicates an enrichment. This calculation showed that about 60-70% of the initial carbon (decay class 1) was lost during decay. The amount of phosphorus, however, remained more or less constant over all decay classes. Consequently, an active nutrient transfer during decay from the forest floor seems to be rather negligible. A moderately comparable situation for P was also measured in woody debris in the Mediterranean-type climate area in Australia ([8]) and CWD in the continental and cool climate area ([1]). However, the amount of nitrogen increased (in the range of about +50 to +100%). Therefore, nitrogen was actively transferred into CWD - most likely due to fungi. Accumulation of nitrogen in CWD has also been observed in a similar range elsewhere for other tree species ([1], [8], [21]). According to Hale & Pastor ([21]), the level of rot prior to tree death may alter the patterns of nutrient flows in hollow logs compared to solid logs (hollow logs accumulate N more rapidly than do solid logs, but they begin to mineralize this pool earlier). This process seems to occur more frequently in deciduous stands than in coniferous forests. Nitrogen fixation may also occur in the logs but the rates usually seem to be too low to explain an accumulation of nutrient elements ([32]). As a consequence of C losses and N inputs, the C/N ratio of CWD decreases with increasing decay stage (Tab. 6 - [10]). The relatively low C/N ratio at 1400 m a.s.l. (south-facing slope) in decay class 1 might have been due to fungi that were already present in the wood samples and therefore gave rise to an elevated N concentration. The variability of the C/N ratio is relatively high. High C/N ratios are due to a low concentration of N. With very low N contents the analytical precision may decrease, giving rise to an increased variability of the C/N ratio.
Tab. 6 - C/N ratio in the decay classes 1 and 5 at four different elevations and as a function of the site aspect.
| Aspect | Elevation (m a.s.l.) |
Decay Class | |
|---|---|---|---|
| 1 (C/N) |
5 (C/N) |
||
| North-facing sites | 1200 | 313 | 144 |
| 1400 | 564 | 65 | |
| 1600 | 310 | 70 | |
| 2000 | 496 | 174 | |
| South-facing sites | 1200 | 450 | 92 |
| 1400 | 82 | 109 | |
| 1600 | 223 | 118 | |
| 2000 | 376 | 215 | |
The negative relationship of Ca, K and P in CWD with altitude is probably related to the strongly leaching conditions at high altitudes due to cooler and wetter climate conditions. A similar effect could be observed in the same area for soils ([16]).
Cellulose and lignin influenced by decomposition pattern and partially by exposure
Cellulose was depleted with increasing decay class. Similar results were found for silver fir (Abies alba) and beech (Fagus sylvatica) in the Apennines ([33]) and for Norway spruce (Picea abies) in the Swiss Jura Mountains ([10]), although in the latter study the trend was less obvious. In contrast to cellulose, the relative content of lignin increased. The significant negative correlation (Fig. 5) between cellulose and lignin can be explained by a preferential degradation of cellulose by brown rot fungi ([19], [10], [33]). The lignin increase is caused by its relatively slower decomposition and therefore it becomes enriched in the remaining CWD.
Exposure had a significant effect on the lignin content of CWD. Interestingly, differences between north-facing and south-facing sites were higher in class 1, less pronounced in classes 2 and 3 and negligible in classes 4 and 5 (Fig. 6). As decomposition progresses, these differences tend to diminish. The differences at the beginning of the decay stage are difficult to explain, because they do not exist in the living trees. These differences probably depend more on site-specific properties such as moisture and temperature - particularly for the decay class 1 where CWD is often not in contact with the soil. According to Strukelj et al. ([47]), logs become more similar to the forest floor with on-going decomposition.
Carbon and δ13C undifferentiated during decomposition, but sensitive to elevation and exposure
Similarly to our finding, Ganjegunte et al. ([19]), Bütler et al. ([10]), Lombardi et al. ([33]) and Strukelj et al. ([47]) observed that the C content did not change with decay class. However, Sakai et al. ([42]) found that carbon concentration of CWD of Japanese conifers varied among the decay classes, but no consistent pattern was observed. Harmon et al. ([23]) measured an increase in carbon from 48.3 to 52% with increasing decay classes. They explained this increase as being due to the longer residence time of wood pieces in the last decay classes and the prevalence of brown-rot fungi in gymnosperms ([20]). Furthermore, our measured C values in the deadwood were slightly lower when compared to other investigations ([10]). One of the most interesting findings is that the carbon isotopic signature (δ13C) was not varying with decay classes, but was sensitive to site elevation and aspect. The variation of δ13C with altitude and exposure is not caused by differences in the 13C content of the starting material. With respect to altitude, the signal in the living tree was opposite to that of the CWD: with increasing altitude, δ13C tended to more negative values (from about -24.6 to -26.0‰). This trend most likely reflects air humidity and soil moisture conditions. Eilmann et al. ([17]) showed that maximum δ13C values in tree rings were measured after the hottest and driest period of the year. Likely, the differences between north and south exposure in the CWD are to a certain degree due to the starting material. Although not significant, living trees showed a lesser difference between north and south-facing sites (δ13C of -25.3 ‰ at north-facing sites and -24.9 ‰ at south-facing sites).
With increasing decay, a 13C depletion should be the consequence when the relative proportion of lignin increases ([18], [38], [15]) because the δ13C of lignin is known to be usually more negative (depleted in 13C) than cellulose. However, our data do not reflect such pattern. The presence of microbial-derived organic compounds can induce a 13C enrichment ([15]). Kohzu et al. ([30]) even reported about a selective incorporation of a 13C enriched fraction by fungi. The δ13C differences can also be due to a temperature-dependent shift in the active microbial community causing a shift in the carbon pool being mineralized ([2]). The interpretation of the δ13C values is more challenging when the elevation trend is considered (Fig. 7, left panel). The trend of less-negative values with altitude (up to 1600 m a.s.l.) seems to reflect a climate signal: indeed, a cooler climate often leads to less negative δ13C values ([25]). Ascher et al. ([3]) detected distinct differences in the macro- and micro-organism composition in subalpine forest soils (in a similar area in Trentino) due to different thermal conditions. Species richness of microannelid assemblages was higher under warmer conditions (south exposure, lower altitude) and the vertical distribution of microannelids shifted along the gradient to lower temperatures from predominant occurrence in the mineral soil to exclusive occurrence in the organic layer. Microbial biomass (total phospholipid fatty acids, DNA yields) was higher at the cooler sites ([3]). The δ13C signatures of the PLFA markers suggested a lower decomposition rate at the cooler sites, resulting in a lower respiratory loss and an accumulation of weakly decomposed organic material ([3]). By determining microbial community composition, Djukic et al. ([14]) demonstrated that environmental and site conditions may influence the decomposition process even more substantially than changes in substrate quality.
Carbon stocks in CWD
CWD in European natural forests is frequently in the range of 50-120 m3 ha-1 ([6]) with values up to 160 m3 ha-1 ([5]). In our study area, the CWD volume was ranging between 16 and 78 m3 ha-1, thus at the lower end of the above-mentioned range. The measured C-stocks in the CWD corresponded well to values reported in the literature for similar sites ([43]). CWD is a non-negligible C reservoir in subalpine forests. However, the C-stocks in the soils are much more abundant - a fact that is well-known ([29]). In the investigation area, 8-35 kg C m-2 is stored in the soils ([16]), whereas 0.3-1.7 kg C m-2 is found in the CWD. Consequently, only 5% of the amount of carbon found in soils is stored in the CWD.
Conclusions
The decomposition of coniferous wood in subalpine forests can be traced back very well by using the five decay-class system. Important wood physico-chemical parameters such as wood density, water content, lignin and cellulose concentration strongly correlate with the decay-classes. Not only major but also minor constituents showed a tight relationship to these classes. Among these components were N, Ca, Mg, P, Fe and to a lower extent Mn. In contrast, carbon concentrations and, interestingly, the δ13C ratio remained unaltered along the entire decomposition process.
Although wood chemistry for some compounds differed slightly between Norway spruce (Picea abies (L.) Karst) and European larch (Larix decidua Mill.), no significant chemical differences between these two species seem to exist any more during the whole decomposition process. Consequently, we have to reject our initial hypothesis that a different substrate should be traceable during CWD decomposition. It is interesting to note that these differences are zeroed already in decay class 1.
The site conditions also affected the chemical characteristics of CWD. Lignin varied with site exposure and the δ13C isotope ratio varied with both elevation and exposure. Consequently, climate and site specific conditions exerted a distinct influence on the decay mechanisms. A site- and climate-specific effect, could not be detected for nitrogen, but could be detected for phosphorous and other nutrients (such as Ca and K).
Acknowledgements
This study is part of the DecAlp DACH project no. 205321L_141186. We are indebted to Dr. Fabio Angeli of the Ufficio distrettuale forestale - Malé (Trento, Italy) and his team of foresters for their support in the field. We also thank Dr. Dolores Asensio for her help in performing elemental and isotopic analysis. We are grateful to two anonymous reviewers for their helpful comments on an earlier version of the manuscript.
References
Gscholar
CrossRef | Gscholar
Gscholar
CrossRef | Gscholar
Gscholar
CrossRef | Gscholar
Gscholar
Gscholar
CrossRef | Gscholar
Gscholar
Authors’ Info
Authors’ Affiliation
Samuel Abiven
Markus Egli
Department of Geography, University of Zurich, CH-8057 Zurich (Switzerland)
Paolo Cherubini
WSL Swiss Federal Institute for Forest, Snow and Landscape Research, CH-8903 Birmensdorf (Switzerland)
Museo delle Scienze, I-38123 Trento (Italy)
Department of Agrifood and Environmental Science, University of Florence, I-50144 Florence (Italy)
Institute of Microbiology, University of Innsbruck, A-6020 Innsbruck (Austria)
Federica Camin
Alice Barbero
Roberto Larcher
IASMA, Fondazione Edmund Mach, I-38010 San Michele all’Adige (Italy)
Corresponding author
Paper Info
Citation
Petrillo M, Cherubini P, Sartori G, Abiven S, Ascher J, Bertoldi D, Camin F, Barbero A, Larcher R, Egli M (2015). Decomposition of Norway spruce and European larch coarse woody debris (CWD) in relation to different elevation and exposure in an Alpine setting. iForest 9: 154-164. - doi: 10.3832/ifor1591-008
Academic Editor
Rupert Seidl
Paper history
Received: Feb 06, 2015
Accepted: Jul 13, 2015
First online: Aug 28, 2015
Publication Date: Feb 21, 2016
Publication Time: 1.53 months
Copyright Information
© SISEF - The Italian Society of Silviculture and Forest Ecology 2015
Open Access
This article is distributed under the terms of the Creative Commons Attribution-Non Commercial 4.0 International (https://creativecommons.org/licenses/by-nc/4.0/), which permits unrestricted use, distribution, and reproduction in any medium, provided you give appropriate credit to the original author(s) and the source, provide a link to the Creative Commons license, and indicate if changes were made.

Web Metrics
Breakdown by View Type
Article Usage
Total Article Views: 58035
(from publication date up to now)
Breakdown by View Type
HTML Page Views: 45671
Abstract Page Views: 5342
PDF Downloads: 5421
Citation/Reference Downloads: 43
XML Downloads: 1558
Web Metrics
Days since publication: 3981
Overall contacts: 58035
Avg. contacts per week: 102.05
Article Citations
Article citations are based on data periodically collected from the Clarivate Web of Science web site
(last update: Mar 2025)
Total number of cites (since 2016): 44
Average cites per year: 4.40
Publication Metrics
by Dimensions ©
Articles citing this article
List of the papers citing this article based on CrossRef Cited-by.
Related Contents
iForest Similar Articles
Research Articles
Tree-ring-based reconstruction of larch budmoth outbreaks in the Central Italian Alps since 1774 CE
vol. 12, pp. 289-296 (online: 27 May 2019)
Review Papers
Linking deadwood traits with saproxylic invertebrates and fungi in European forests - a review
vol. 11, pp. 423-436 (online: 18 June 2018)
Research Articles
Potential relationships of selected abiotic variables, chemical elements and stand characteristics with soil organic carbon in spruce and beech stands
vol. 14, pp. 320-328 (online: 09 July 2021)
Research Articles
Seven spruce species on a mountain site - performance, foliar nutrients, and forest floor properties in stands 20 years old
vol. 12, pp. 106-113 (online: 11 February 2019)
Research Articles
Assessment of sanitary conditions in stands of Norway spruce (Picea abies Karst.) damaged by spruce bud scale (Physokermes piceae Schrnk.)
vol. 6, pp. 73-78 (online: 07 February 2013)
Research Articles
Ozone fumigation effects on the morphology and biomass of Norway spruce (Picea abies L.) saplings
vol. 2, pp. 15-18 (online: 21 January 2009)
Short Communications
Culturable fungi associated with wood decay of Picea abies in subalpine forest soils: a field-mesocosm case study
vol. 11, pp. 781-785 (online: 28 November 2018)
Research Articles
Effects of substrate and ectomycorrhizal inoculation on the development of two-years-old container-grown Norway spruce (Picea abies Karst.) seedlings
vol. 8, pp. 487-496 (online: 10 November 2014)
Research Articles
Litter quality changes during decomposition investigated by thermal analysis
vol. 8, pp. 827-837 (online: 19 March 2015)
Research Articles
Dynamics of soil organic carbon (SOC) content in stands of Norway spruce (Picea abies) in central Europe
vol. 11, pp. 734-742 (online: 06 November 2018)
iForest Database Search
Search By Author
Search By Keyword
Google Scholar Search
Citing Articles
Search By Author
Search By Keywords
PubMed Search
Search By Author
Search By Keyword


