Amount and distribution of coarse woody debris in pine ecosystems of north-western Spain, Russia and the United States
iForest - Biogeosciences and Forestry, Volume 7, Issue 1, Pages 53-60 (2014)
doi: https://doi.org/10.3832/ifor0644-007
Published: Oct 28, 2013 - Copyright © 2014 SISEF
Research Articles
Abstract
The quantity and characteristics of coarse woody debris (CWD) were examined in four distinct pine ecosystems of north-western (NW) Spain, NW Russia and the NW USA. The average CWD volume and biomass ranged from 3.76 m3 ha-1, 1.55 Mg ha-1 in pine plantations in NW Spain to 24.86 m3 ha-1, 6.69 Mg ha-1 in Scots pine forest in NW Russia to 55.35 m3 ha-1, 20.38 Mg ha-1 and 77.04 m3 ha-1, 28.84 Mg ha-1 in ponderosa and lodgepole pine forests in the NW USA. Despite differences in species, ecological conditions and management histories, in all four ecosystems the mean snag volume was less than that of logs, most of the CWD mass was in an intermediate degree of decay, and mature stands had the greatest amount of CWD mass, followed by middle-age and then young stands. The CWD ratio (ratio of dead to live wood volume) ranged from 2.8% to 126.6%, depending on pine ecosystem and stand age, and was influenced by the type of natural and human disturbance. The difference in CWD amount and distribution among the regions studied reflected differences in disturbance history and management practices. Only in NW USA was the sample size large enough to examine the effect of disturbance type on CWD amount and distribution. There, fire and insect damage were found to considerably influence the amount of CWD in both lodgepole and ponderosa pine forests. Comparison of how different factors affect the amount and distribution of CWD in different ecosystems could be useful in developing ecologically sustainable forest management guidelines.
Keywords
Disturbance, Lodgepole Pine, Dead Wood, Ponderosa Pine, Scots Pine
Introduction
Coarse woody debris (CWD) is one of the most important functional and structural components of forest ecosystems ([19], [35]). CWD affects nutrient cycling, carbon storage and hydrological processes. It also serves as an essential substrate for a multitude of species, including numerous rare and endangered species ([48]).
Numerous studies have examined the role of CWD in maintaining biodiversity ([12], [1]), estimating the decomposition rates of many important tree species ([53]), evaluating the effect of CWD in carbon and nutrient cycles ([27], [24], [34]) and analyzing the quantity, structure and dynamics of CWD in managed and unmanaged forests ([17], [30], [40], [31]). In unmanaged forests, the amount of CWD is the result of tree mortality and dead wood decay rates, both of which are affected by climate, site productivity, tree species composition, disturbance regime, previous forest stand characteristics and the successional stage of the forest ([19], [42]). In managed forests, CWD quantities are typically kept very low, to avoid pest problems and fire hazards and to maximize the commercial value of the harvest. Where economics and accessibility allow, trees affected by insects, diseases, and fire are usually removed immediately, before they die or deteriorate ([8], [17]). Plantation forests are typically managed on short rotations and are generally subject to intensive harvesting methods, resulting in structurally homogenous stands without significant amounts of CWD ([19], [9]). However, silvicultural activities such as thinning, pruning and harvesting can create woody debris ([5]). The increasing importance of biodiversity and carbon storage favors the maintenance and promotion of CWD in managed forests. Leaving some live and dead trees during logging operations, or even killing trees to create CWD, are some of the operational means for meeting biodiversity needs in managed forests ([12]).
The amount and distribution of CWD can be a criterion for assessing and determining baseline silvicultural practices. This type of data is available for different types of forests, but the geographic extent and focus of most studies is limited to one or a few specific stands. There is very little information on continental or global CWD quantities and distribution patterns or on how management affects these patterns. Comparison of different forest ecosystems makes it possible to examine the effects of site productivity and stand structure on CWD amounts and decomposition rates. It also improves understanding of how different management practices affect CWD as a resource, which is vital to formulating guidelines and strategies for increasing carbon storage on forest lands.
In light of this information gap, the aim of this paper was to quantify the amount, quality and distribution of CWD in four pine ecosystems in NW Spain, NW Russia and NW USA: three diverse geographical locations with different species and histories of human activity and disturbance. In NW Spain, we find relatively young, actively managed and moderately productive plantations. Even-age silvicultural management is typically used on public lands in this region and consists of clearcutting followed by natural regeneration, pre-commercial thinning and a low thinning regime when economically feasible. Previous research has indicated that thinning increased CWD abundance in this area ([22]). Forestry in NW Russia is characterized by an established, relatively long rotation system with few natural stands remaining. Disturbances are frequent and windthrow fairly widespread ([26]). Clearcutting followed by natural regeneration has been the dominant silvicultural system in this region. However, the current trend is toward more site-specific approaches that favor partial cutting or cutting and regeneration, with methods that recognize forest peculiarities and environmental conditions. Finally, NW USA features a relatively recent initial expansion of timber harvesting in previously unmanaged forests where natural disturbance regimes continue to play a major role, in addition to forests that have never been managed. The current landscape is a mixture of different conditions including managed stands, protected areas, and second growth forests that originated after extensive harvesting in the 1920’s. Of particular importance has been the suppression of the natural, low-severity fire regime that favored fire-tolerant species and kept tree density low ([23]). Current forests are affected by natural disturbances such as fire or damage from insect plagues and diseases. The three regions are representative of typical land-use histories throughout the world, which are assumed to influence CWD stores.
This study was structured around the following specific objectives: (1) to quantify the amount of CWD in the different pine ecosystems; (2) to study CWD distribution among decay classes and stand ages; and (3) to determine the impact of natural and human disturbances on CWD in NW USA pine ecosystems.
Material and methods
Study areas
The first study region was located in NW Spain (42° N, 4° W) at an altitude of 800-1000 m a.s.l. It is a transitional area between forest and cropland, with low mountains and valleys. The Mediterranean climate features long, cold winters and warm, dry summers. January temperatures range between -2 °C and 6 °C, July temperatures between 9 °C and 21 °C, and mean annual rainfall is 633 mm. Soils are mainly acidic, with some neutral soil and limestone areas ([37]). Forest covers 61 570 ha (33.0%) of the total area. Thanks to an extensive plantation program that started in the 1970s, pine stands cover 41.5% of the total forested area. The three main species are Scots pine (Pinus sylvestris L. - 43.6%), black pine (Pinus nigra Arn. - 43.9%) and maritime pine (Pinus pinaster Ait. - 12.5%). Plantations are typically a mixture of these three species, with homogeneous 30 to 60 year-old stands managed for wood production.
The second study area was situated on the East-European plain in the St. Petersburg region of NW Russia (58-61° N, 29-34° E), at an elevation range of 0-250 m a.s.l. The cool maritime climate features wet summers and long, cold winters. July mean temperatures are 16 - 17 °C, January minimum temperatures range from -7 to -11 °C and mean annual precipitation is 700 mm. The flat terrain rests on ancient sea sediment covered by a layer of moraine deposits. Soils are mostly podzols on deep loamy to sandy sediment. Forest covers 55% of this 8.1 million ha area. The natural vegetation and dominant conifer species consist mainly of southern taiga, Scots pine (Pinus sylvestris L.) and Norway spruce (Picea abies Karst.), growing in pure and mixed stands. Forest management in this region began in the 18th century. Most forests are second-growth and harvested on a 60-120 year rotation.
The third region was located in NW USA, specifically eastern and central Oregon (42-46° N, 117-123° W), and includes the eastern Cascades Range, the pumice plateau of south-central Oregon, and the Blue Mountains. Elevation of the forested areas ranges between 900 and 2000 m a.s.l. The climate is characterized by low summer rainfall, cold winters and a short growing season. Average January minimum temperatures range between -7 and -11 °C, average July maximum temperatures are 27 to 31 °C. The 350 to 700 mm of average annual precipitation falls mostly in the form of snow. Soils range from relatively young, poorly developed, mineral deficient and highly porous volcanic types to more developed basaltic types ([14]). Forests in the study area were dominated by ponderosa pine (Pinus ponderosa Dougl. ex Laws) and lodgepole pine (Pinus contorta Dougl. ex Loud), which covered 2.1 and 0.8 million ha, respectively ([11]).
Sampling design
NW Spain
In NW Spain, sixty-seven plots were selected in Pinus spp. plantations on a systematic grid with a density of one plot per 2 km2. Pine plantations were grouped in two stand development stages: young (≤ 40 years old) and middle-age (40-80 years old). A total of 36 plots (11 young and 25 middle-age) were located in stands that had been thinned (Tab. 1). Plots were composed of four circular subplots (15 m radius) joined by two perpendicular transects 50 m long.
Tab. 1 - Main characteristics of the pine ecosystems included in the study. Plots with evidence of natural disturbance are plots affected by natural disturbances such as fire, insect and disease damage or windthrow.
| Species | Age Class | Years | Stand volume (m3 ha-1) |
Total plots |
Thinned plots |
Plots with evidence of natural disturbance |
|---|---|---|---|---|---|---|
| Pinus spp. (NW Spain ) | Young | 0-40 | 103.14 | 25 | 11 | 0 |
| Middle-age | >40 | 102.49 | 42 | 25 | 0 | |
| Pinus sylvestris (NW Russia) | Young | 0-40 | 63.06 | 13 | 0 | 0 |
| Middle-age | 40-80 | 187.84 | 32 | 7 | 0 | |
| Mature | >80 | 415.3 | 5 | 1 | 3 | |
| Pinus ponderosa (NW USA) | Young | 0-40 | 53.2 | 51 | 10 | 22 |
| Middle-age | 40-80 | 124.96 | 187 | 33 | 72 | |
| Mature | >80 | 199.18 | 191 | 21 | 80 | |
| Pinus contorta (NW USA) | Young | 0-40 | 44.02 | 65 | 10 | 30 |
| Middle-age | 40-80 | 129.22 | 62 | 7 | 31 | |
| Mature | >80 | 182.31 | 44 | 5 | 21 |
Snags in the four subplots, stumps in two of the four subplots, and logs on the transects were inventoried. Snags were defined as standing dead trees with a diameter at breast height greater than 7.5 cm. Species, height, diameter at breast height (dbh), decay class, presence of excavated cavities, azimuth and distance to plot center were recorded for each snag. The number, mean diameter and height of stumps in each plot were measured and recorded. Finally, line intersect sampling (LIS - [49]) was used to estimate the log volume. Logs were defined as dead trees with a diameter greater than 7.5 cm, either on the ground or suspended by one extreme at an inclination greater than 45° from vertical. Species, diameter at the transect intersection point, length, inclination, decay class and wildlife use were recorded for each log ([13]). All pieces of woody debris were assigned to one of five decay classes ranging from nearly sound wood to the most advanced stages of decomposition, according to criteria described by Goodburn & Lorimer ([16]).
NW Russia
Fifty Scots pine plots were studied in NW Russia (Tab. 1), distributed among 7 different stands, ranging in age from 15 to 150 years. Of these, 38% of the plots were located in young stands (≤ 40 years old), 36% in middle-age stands (40-80) and the remaining 26% in mature stands (>80 years old). Eight plots (7 middle-age, 1 mature) had been thinned. The plots were also classified according to whether disturbance (windthrow) was apparent or not. Only 3 plots, all in mature stands, showed signs of disturbance.
CWD (snags, logs and stumps) was measured in fixed-area plots ranging in size from 0.2 to 1.0 ha. Within each plot, the large- and small-end diameters, length, species and decay class were recorded for each log >10 cm in diameter and >1m in length. Stumps and snags were measured regardless of their height. Measurements varied by CWD type and condition, and were designed to characterize the volume of each piece. A detailed description of field methods can be found in Harmon & Sexton ([20]). The same five-class system for categorizing decay was used as in the NW Spain survey.
NW USA
Plots were located systematically by the US National Forest inventory ([3]) across the entire NW USA region, with approximately one plot every 4850 ha. Only plots with at least 25% of the area covered in either ponderosa pine (429 plots) or lodgepole pine (171 plots) were selected for analysis. The plot design consisted of 4 cluster points within a 1 ha circle. At each point, snags and live trees 12.7-61.0 and >61.0 cm dbh were measured in a set of two nested plots measuring 0.0169 and 0.1012 ha, respectively. Species, height, diameter and decay class were recorded for each snag. Logs greater than 7.54 cm in diameter and 0.91 m in length were measured using line intersect sampling on two 17.95 m transects per point, resulting in a total transect length of 143.60 m per plot. Large- and small-end diameters, diameter at the point of intersection with the transect, species, decay class and length were recorded for each log. The decay class of each CWD piece was rated according to a five-class decay scale similar to that used in NW Spain and NW Russia. When distinct forest conditions were found within a plot, such as changes in ownership or forest type, they were mapped and described. Individual snags and logs were assigned to the condition where they fell. A host of other relevant variables were collected for each condition, including ownership, stand age, disturbance and management history. As in the other regions, plots were classified as young (≤ 40 years old), middle-age (40-80) or mature stands (> 80 years old). More detailed information about the field methods and sampling procedures can be found in USDA Forest Service ([44]).
Stand age in the ponderosa pine forest type ranged from 1 to 350 years old. Most plots were located in middle-age (43.6%) or mature stands (44.5%). The plots were divided into two types: plots without apparent disturbance (n=228) and plots with disturbances in the previous 10 years. A variety of disturbance types were observed: 99 plots had a history of fire (prescribed or natural, crown or ground fire), 75 plots presented insect or disease damage and 64 plots showed signs of different types of harvesting. The disturbance types were not mutually exclusive; any plot could have incurred two or more types of disturbance.
Stand age in the lodgepole pine forest type ranged from 3 to 200 years old. As with ponderosa pine forests, plots were classified as young (≤ 40 years old), middle-age (40-80) or mature stands (> 80 years old) and were divided into plots without disturbances (n=86) and plots with disturbances. Thirty-four plots presented fire disturbances (prescribed or natural crown or ground fire), 48 plots had insect or disease damage and 22 plots showed signs of different types of harvesting. The frequency of disturbed plots varied according to the age category of the stand (Tab. 1).
Calculation of volume and mass
In NW Spain, snag volume (m3) was calculated using equations from the Spanish National Forest Inventory ([10]). The volume of each stump was calculated using Huber’s formula ([20]). Snag and stump volumes (m3) were then expanded to the hectare. Log volume (m3 ha-1) was estimated using the following equation ([49], [46] - eqn. 1):
where Vi is the estimated log volume in the i-th plot (m3 ha-1); dij the intersection diameter of the j-th log in the i-th plot (cm); and L transect length, in our case 100 m.
In NW Russia, volume estimates were calculated from field measurements of each piece of CWD using local volume tables for intact snags and appropriate volume formulas (Newton, paraboloid, frustrum of a cone or neiloid) for other CWD conditions and types. The individual volumes were summed for each plot and plot values scaled up to obtain a value per hectare.
In NW USA, snag volume was computed using a standard set of US Forest Inventory volume equations based on diameter and height. Mean estimates of the total volume and volume per hectare were computed according to the methods of Bechtold & Scott ([3]). Log volume and mass estimates were computed using the same procedures as in NW Spain ([51]).
In the three regions, the CWD volume was aggregated by decay class. To estimate CWD mass, the estimated volume was multiplied by the wood bulk density. In NW Russia and NW USA, published bulk density values by species and decay class were used ([53], [21]). In Spain, bulk density was estimated by collecting 33 logs of different decay classes in the field. Large diameter, end diameter, midpoint diameter and length were measured to calculate the volume using Newton’s equation ([20] - eqn. 2):
where Vi is the volume of the log, L is the length, and Ab, Am and At were the cross-sectional areas at the base, middle and top of the log, respectively. Dry weights of logs were determined after drying at 75 °C to constant weight. The estimated mean bulk densities (in Mg m-3 ± standard error) were 0.441 ± 0.075, 0.351 ± 0.079, 0.281 ± 0.101, 0.199 ± 0.042 and 0.044 ± 0.013 for decay classes 1 through 5, respectively.
Though standard and consistent sampling designs were applied in the three regions, there were slight differences with regard to the CWD components tallied and piece definitions. Snags, logs and stumps were measured in NW Spain and NW Russia, but only snags and logs were measured in NW USA. Additionally, the minimum size threshold used for piece definitions varied: the minimum diameter was 7.5 cm in NW Spain and NW USA and 10 cm in NW Russia. In order to assess the impact of this difference, the volume of CWD with diameters between 7.5 and 10 cm was calculated for NW Spain and NW USA.
For each sample plot, volume and mass of total CWD were calculated as the sum of the volume and mass of the different components (snags, logs and stumps). Averages were computed by pine ecosystem and stand age class. Only in NW USA was the sample size large enough to compute the average amount of CWD by natural (fire, insect damage) or anthropogenic (harvesting) disturbance regime. Finally, live tree volume was calculated to compute the CWD ratio (ratio of dead to live wood volume) in each plot. The CWD ratio was also calculated by age class in the three regions and by disturbance types in NW USA pine ecosystems.
Statistical methods
For each pine ecosystem, descriptive and graphical analyses of the estimated mean CWD volume and mass by components (snags, logs and stumps), decay class, age class and disturbance type were examined. To determine statistically significant differences in volume and mass of CWD, logs, snags and stumps, a linear mixed model (LMM) was used for the following factors and their interactions: pine ecosystem with four levels: 1 (pine plantations in NW Spain), 2 (Scots pine in NW Russia), 3 (ponderosa pine in NW USA), and 4 (lodgepole pine in NW USA); age class with three levels: 1 (young stands), 2 (middle-age stands) and 3 (mature stands). Only two pine ecosystem levels (NW Spain and NW Russia) were used for the analysis of stump volume and mass. The LMM allowed us to correct the heteroscedasticity of variance caused by the pine ecosystem factor. Differences among age classes in each pine ecosystem were evaluated by individual contrasts. The SAS 9.1 PROC MIXED statistical program was used for the analyses ([39]).
Results
There were significant differences (p<0.0001) in the volume and biomass of logs and snags among pine ecosystems, age classes and the interaction between the two factors. The stump pool showed significant differences among age classes in pine ecosystems of NW Spain and NW Russia (p<0.0002).
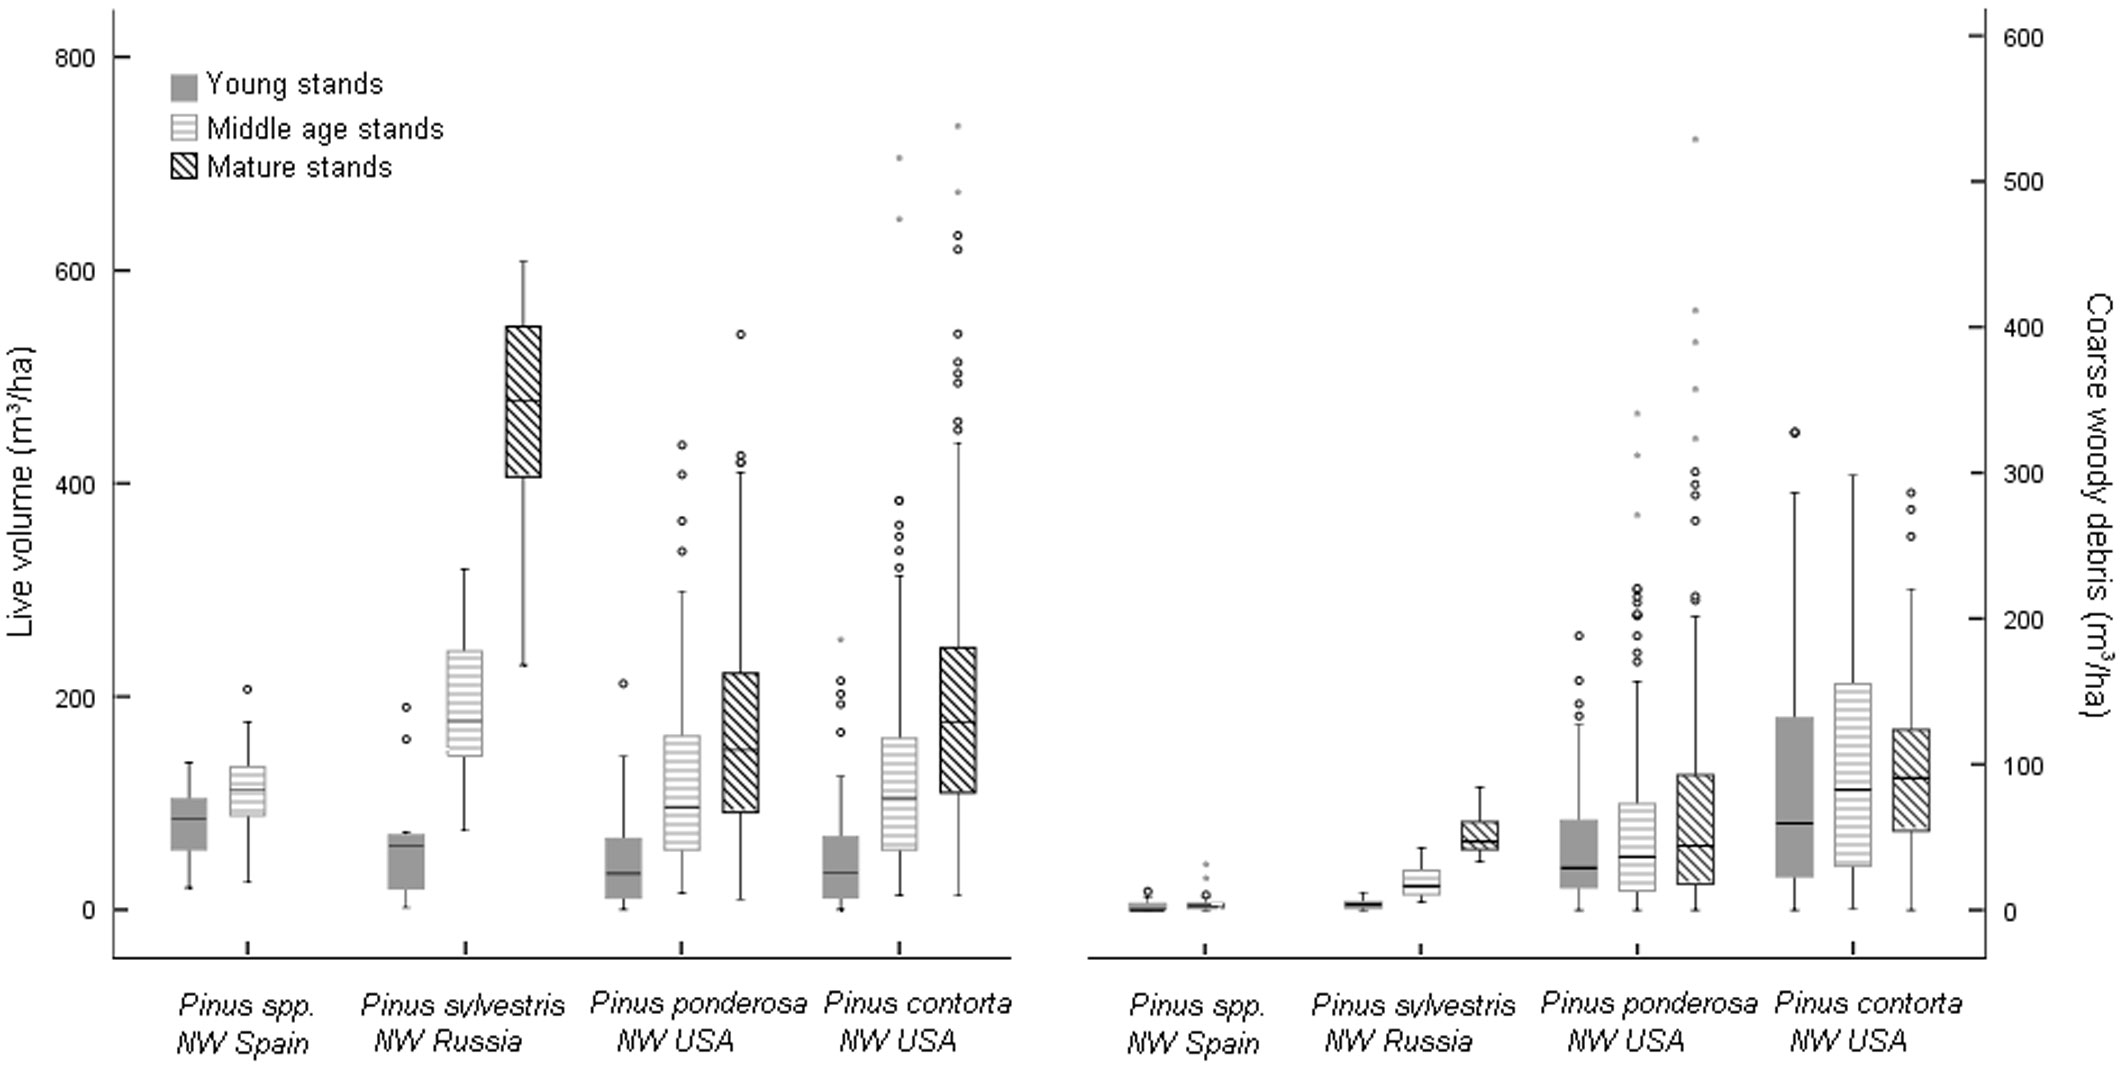
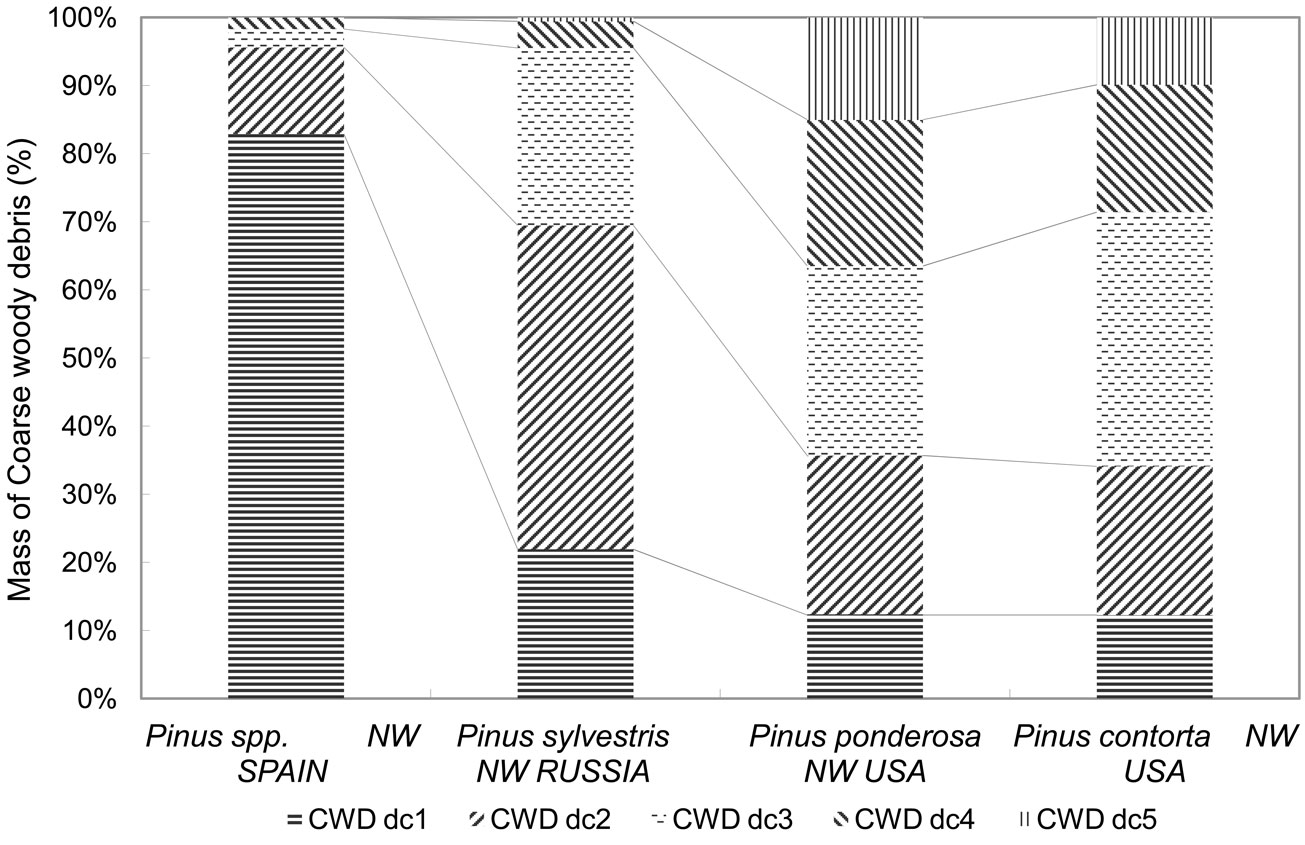
The amount of CWD varied greatly between pine ecosystems (Fig. 1). The CWD averages in plots without recorded disturbances ranged from 3.76 m3 ha-1 (1.55 Mg ha-1) in pine plantations in NW Spain to 77.04 m3 ha-1 (28.84 Mg ha-1) in lodgepole pine in NW USA (Tab. 2). Between these two extremes, 24.86 m3 ha-1 (6.69 Mg ha-1) was estimated for Scots pine in NW Russia and 55.35 m3 ha-1 (20.38 Mg ha-1) for ponderosa pine in NW USA. CWD distribution by decay class also varied among pine ecosystems (p<0.0001 - Fig. 2). In the NW Spain plantations, decay class 1 material was the most abundant due to recent thinning, and mass in decay classes 3-5 was the scarcest. In NW Russia, CWD mass for Scots pine was greatest in decay classes 1, 2 and 3. Ponderosa and lodgepole pine ecosystems in NW USA showed a relatively homogeneous CWD mass distribution across decay classes.
Fig. 1 - Live and CWD volume by pine ecosystem and age class. Distribution of live and coarse woody debris volume by pine ecosystem and age class.
Tab. 2 - CWD volume and mass for logs, snags and stumps by age class and pine ecosystem. Letters indicate statistically significant differences among age classes (p<0.05) within each pine ecosystem evaluated with individual contrasts. CWD ratio is the ratio of dead to live wood volume.
| Species | Age Class |
Log | Snag | Stump | Total CWD | Live volume(m3 ha-1) | CWD ratio(%) |
||||
|---|---|---|---|---|---|---|---|---|---|---|---|
| Volume (m3 ha-1) | Mass (Mg ha-1) | Volume (m3 ha-1) | Mass (Mg ha-1) | Volume (m3 ha-1) | Mass (Mg ha-1) | Volume (m3 ha-1) | Mass (Mg ha-1) | ||||
| Pinus spp. (NW Spain) | All | 1.28 | 0.49 | 1.04 | 0.43 | 1.44 | 0.63 | 3.76 | 1.55 | 102.73 | 3.66 |
| Young | 0.68 | 0.29 | 0.83 | 0.34 | 1.12 | 0.49 | 2.64 | 1.12 | 103.14 | 2.56 | |
| Middle-age | 1.64 | 0.61 | 1.17 | 0.48 | 1.62 | 0.71 | 4.43 | 1.62 | 102.49 | 4.32 | |
| Pinus sylvestris (NW Russia) | All | 15.16 | 3.70 | 8.41 | 2.77 | 1.29 | 0.22 | 24.86 | 6.69 | 248.31 | 10.01 |
| Young | 1.31 | 0.25 | 1.78 | 0.51 | 0.84 | 0.15 | 3.94 | 0.91 | 63.06 | 6.25 | |
| Middle-age | 11.30 | 2.90 | 7.05 | 2.31 | 0.87 | 0.15 | 19.22 | 5.36 | 187.84 | 10.23 | |
| Mature | 32.04 | 7.71 | 15.88 | 5.29 | 2.20 | 0.37 | 50.13 | 13.38 | 460.18 | 10.89 | |
| Pinus ponderosa (NW USA) | All | 45.29 | 17.46 | 10.06 | 2.91 | - | - | 55.35 | 20.38 | 141.24 | 39.19 |
| Young | 39.33 | 15.07 | 2.33 | 0.52 | - | - | 41.66 | 15.59 | 62.59 | 66.56 | |
| Middle-age | 42.57 | 16.49 | 5.68 | 1.38 | - | - | 48.24 | 17.87 | 116.45 | 41.43 | |
| Mature | 49.98 | 19.22 | 17.07 | 5.27 | - | - | 67.04 | 24.49 | 191.03 | 35.09 | |
| Pinus contorta (NW USA) | All | 67.23 | 25.67 | 9.81 | 3.18 | - | - | 77.04 | 28.84 | 117.31 | 65.67 |
| Young | 54.23 | 20.70 | 5.28 | 1.50 | - | - | 59.51 | 22.20 | 47.00 | 126.62 | |
| Middle-age | 71.90 | 27.41 | 10.66 | 3.65 | - | - | 82.56 | 31.06 | 138.80 | 59.48 | |
| Mature | 82.58 | 31.56 | 16.13 | 5.32 | - | - | 98.72 | 36.88 | 205.02 | 48.15 | |
Fig. 2 - Mass by decay class. Percentage CWD mass by decay class in the different pine ecosystems. CWD dci is the mass of CWD in decay class i.
For all regions, log volume was higher than snag volume, especially in NW USA, where log volume was 1.8 times greater than that of snags in both forest types (Tab. 2). Examination by decay class showed the same pattern.
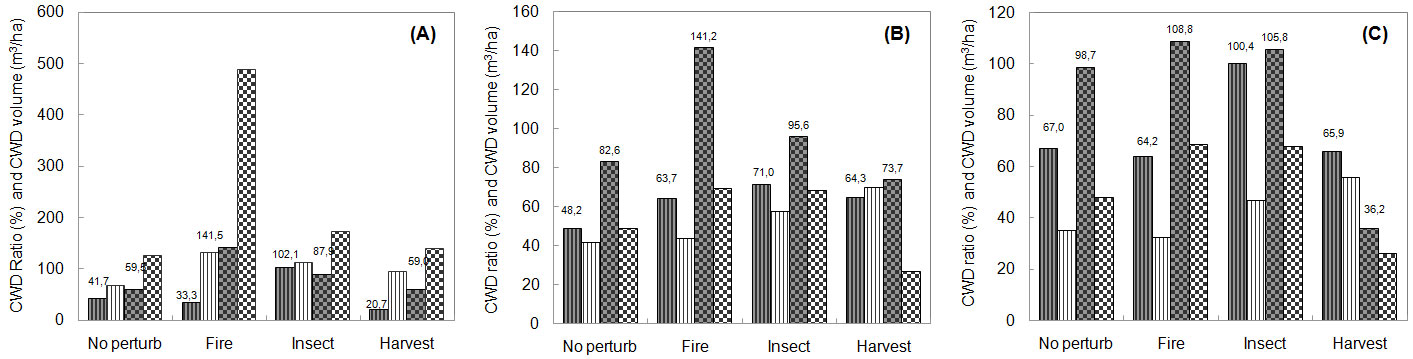
The interaction between pine ecosystem and age class was also statistically significant, indicating that CWD and component distribution by age class differed among pine ecosystems. Most individual contrasts showed a statistically significant higher amount of CWD in older stands. In general, the greatest amount of total CWD was found in mature stands, followed by middle-age and then young stands (Tab. 2). In NW USA however, although the total amount of live volume was greatest in the oldest age classes (Fig. 1), the CWD ratio was greatest in young stands (Tab. 2). This suggests a legacy effect from past disturbances. For several decay classes of the NW USA forest ecosystems there was more CWD in middle-age stands than in mature stands (Tab. 3). Large amounts of CWD were found in recently disturbed ponderosa pine areas, mainly due to insect and disease damage and harvesting (Fig. 3). Young stands had the highest log volume (97.05 m3 ha-1). The CWD ratio in lodgepole pine stands with evidence of fire disturbance was very large in all age classes, but more so in young stands.
Tab. 3 - Log and snag mass in the different decay classes by age class and pine ecosystem. dc1 to dc5 are the decay class level ranges from 1 = nearly sound wood with bark intact to 5 = the most advanced stages of decomposition.
| Species | Age Class | Log mass (Mg ha-1) | Snag mass (Mg ha-1) | ||||||||
|---|---|---|---|---|---|---|---|---|---|---|---|
| dc1 | dc2 | dc3 | dc4 | dc5 | dc1 | dc2 | dc3 | dc4 | dc5 | ||
| Pinus spp. (NW Spain) | Young | 0.24 | 0.05 | 0 | 0 | 0 | 0.24 | 0.1 | 0 | 0 | 0 |
| Middle-age | 0.39 | 0.12 | 0.06 | 0.04 | 0 | 0.37 | 0.1 | 0.01 | 0 | 0 | |
| Pinus sylvestris (NW Russia) | Young | 0 | 0.01 | 0.19 | 0.04 | 0.01 | 0.17 | 0.29 | 0 | 0.05 | 0 |
| Middle-age | 0.04 | 0.98 | 1.85 | 0.03 | 0 | 0.93 | 1.22 | 0.16 | 0 | 0 | |
| Mature | 0.72 | 4.08 | 2.32 | 0.54 | 0.07 | 2.45 | 2.7 | 0.14 | 0 | 0 | |
| Pinus ponderosa (NW USA) | Young | 0.24 | 1.46 | 5.17 | 4.35 | 3.85 | 0.25 | 0.2 | 0.05 | 0.02 | 0.01 |
| Middle-age | 0.48 | 3.67 | 4.96 | 4.45 | 2.94 | 0.59 | 0.4 | 0.09 | 0.26 | 0.03 | |
| Mature | 2.07 | 4.77 | 5.7 | 3.95 | 2.72 | 2.60 | 1.64 | 0.78 | 0.06 | 0.18 | |
| Pinus contorta (NW USA) | Young | 0.87 | 5.35 | 10.05 | 3.08 | 1.34 | 1.37 | 0.08 | 0.05 | 0 | 0 |
| Middle-age | 1.92 | 6.14 | 8.79 | 6.8 | 3.76 | 2.97 | 0.55 | 0.12 | 0.02 | 0 | |
| Mature | 0.91 | 5.3 | 13.96 | 7.23 | 4.15 | 3.04 | 1.9 | 0.29 | 0.09 | 0 | |
Fig. 3 - CWD ratio and volume by age class in NW USA ecosystems. Estimated ratios of CWD to live tree volume (grey bars) and CWD volumes (white bars) in young (A), middle-age (B) and mature stands (C) by disturbance type in Pinus ponderosa (line patterns) and Pinus contorta (dotted patterns) ecosystems in NW USA.
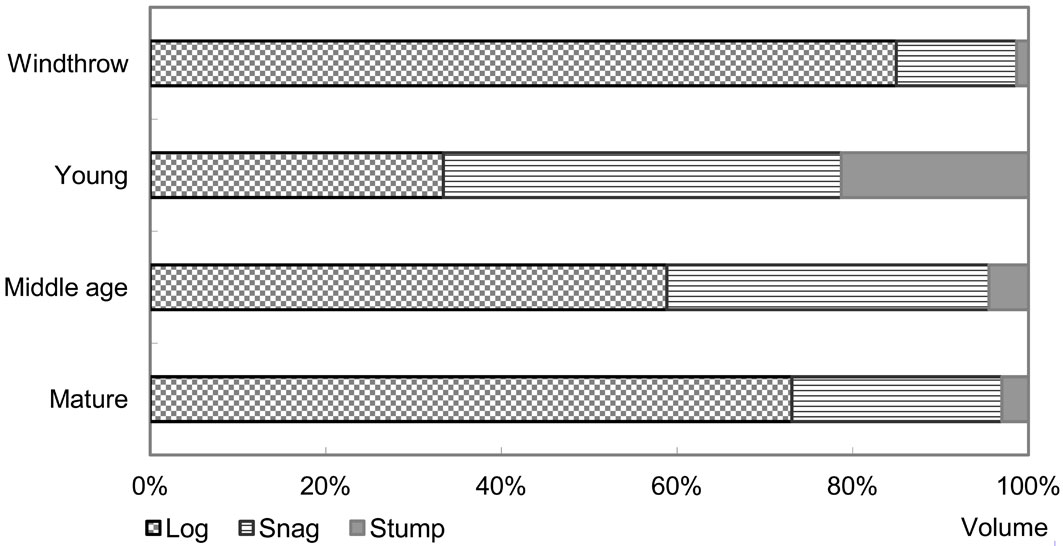
The role of disturbance was difficult to compare across regions because the sample size for disturbed plots was insufficient in all regions except NW USA. However, results from the 3 plots affected by windthrow in NW Russia showed an average log, snag and stump volume of 162.72 m3 ha-1, 26.25 and 2.62 m3 ha-1, respectively. In these plots, log volume after windthrow disturbance accounted for more than 80% of total CWD (Fig. 4).
Fig. 4 - Log volume in disturbed and undisturbed stands in NW Russia. Estimated log volume in undisturbed stands and in stands after windthrow disturbance in NW Russia
Finally, we estimated the volume of woody debris with diameters between 7.5 and 10 cm in NW Spain and NW USA in order to ascertain the importance of the smallest CWD pieces with respect to total volume. This class constituted 1.9% and 3.4% of total CWD in the ponderosa and lodgepole pine ecosystems of NW USA, respectively, and 6% of total CWD volume in Spain.
Discussion
In this study, we quantified and compared amounts of coarse woody debris (snags, logs and stumps) in four different pine ecosystems from three different geographical regions with distinct site conditions, forest histories and legacies, in order to understand the spatial and temporal distribution of dead wood under different forest management regimes.
The amount of dead wood varied greatly among the different pine ecosystems, but the distribution of CWD among decay classes and stand age are consistent with other studies of CWD stores. In northern Europe, Siitonen et al. ([40]) found 14 m3 ha-1 of CWD in mature stands (dominant spruces <120 years old) and 22 m3 ha-1 in over-mature stands (>120 years old) in southern Finland. Stand history, successional stage and exogenous disturbances in individual stands were the explanatory factors for CWD variation. In the USA, Spetich et al. ([41]) found 30 m3 ha-1 CWD in mid-western second-growth forests. In the Pacific Northwest, Spies et al. ([42]) reported higher values for Douglas fir: 423 m3 ha-1 mean CWD volume for young stands (age 65), 250 m3 ha-1 for mature forests (age 121), and 534 m3 ha-1 for old-growth forests (age 404). Results from the present study for the average CWD mass of Pinus contorta (28.84 Mg ha-1) fell within the range identified by Tinker & Knight ([43]) for undisturbed Pinus contorta stands in Wyoming. Finally, our results are in agreement with those of several studies of managed Mediterranean forests. Relatively low CWD estimates of less than 25 m3 ha-1 have been reported in France ([45]), Turkey ([2]) and Italy ([36], [31]). Higher values were observed in unmanaged forest or older stands ([33], [32]).
The distribution of CWD by decay class is important, because decay influences wood density and consequent carbon and nutrient content. Though Linder et al. ([30]) observed large amounts of CWD in decay classes 4 and 5 in stands dominated by Scots pine in northern Sweden, our results are more in line with those of other studies in which the greatest amount of CWD was found in the intermediate decay classes ([19], [41], [31]).
The results of this study indicate that logs are more abundant than snags, a finding that corroborates other studies ([28]). In considering the benefits for nature conservation, Butler & Schlaepfer ([4]) suggested that snags should account for at least 50% of CWD volume in managed forests, because they provide a critical habitat for many species of cavity-nesting birds ([6], [19], [25]). The relatively lower proportion of snags found in all regions studied may reflect the transitory nature of this component. The number of snags can increase temporarily after a period of increased tree mortality, but they eventually fall over and become downed logs. To promote biodiversity, the proportion, size and longevity of snags should be taken into consideration in developing forest management guidelines ([25]).
A review of north American forest structure literature suggests a “U-shaped” distribution of CWD volume, mass, and density as a function of stand age. In other words, CWD is greatest after disturbance in very young stands, decreases in developing stands and increases slightly in mature stands, as tree mortality increases ([19], [42]). Our results only support those findings in Scots pine ecosystems in NW Russia, where log volume in mature stands was more than double that of middle-age stands, and log volume in young stands was more than eight times greater. This pattern was less apparent in the other three pine ecosystems, where different mechanisms (partial disturbance, prior management history) affected CWD distribution during stand development. In NW USA, the legacy of disturbance in the 10 years prior to the study determined CWD distribution across age classes. In ponderosa pine, the large amount of CWD could be related to the combination of drought and bark beetle plague in the early 1990s ([29]). Though fire is historically the most common mortality agent in ponderosa pine forests, its suppression also resulted in greater accumulation of dead wood ([23]). Fire disturbance in lodgepole pine systems led to high CWD levels and a high ratio of dead to live wood volume in young stands. Tinker & Knight ([43]) showed that burned stands contained more than twice the amount of CWD than clear cut stands, largely due to the removal of live trees in harvested stands and the presence of snags in burned stands. The results of the present study also indicated that the proportion of logs vs. snags in stands with fire disturbances varied across the age classes. While the volume of logs (84.58 m3 ha-1) and snags (56.91 m3 ha-1) was similar in young stands, logs dominated the total CWD volume (120.61 m3 ha-1) vs. snag volume (20.44 m3 ha-1) in middle-age stands.
Despite the small sample size, results from the NW Russia pine ecosystem showed that windthrow disturbance can create a high volume of CWD in a stand. Finally, harvesting can produce drastic changes in CWD quantity and quality. Tree removal decreases the CWD input and harvesting can affect wood pools indirectly through the fragmentation of decaying ground wood caused by machinery ([38]). In NW Spain, thinning could have a significant effect on CWD amounts in young stands, where higher log and stump volumes were found in thinned stands, and where logging waste such as crown debris or pruning residues is commonly left on the ground.
Comparing CWD estimates from different studies requires caution due to variations in field measurement methods, plot selection, the area of the region studied and calculation procedures among studies ([15], [18]). One limitation of this study is that the sampling methods, designs and minimum piece sizes in the three regions were not exactly the same, though they all are standard procedures for sampling CWD in different parts of the world. While a common method for sampling CWD would be ideal, researchers argue that no unique method can be adopted for all forest types due to differences in forest structure, research objectives and resources (e.g., [50]). There is also disagreement regarding the definition of the different CWD components. For example, Woodall et al. ([52]) surveyed the methods used in the National Forest Inventories of 30 countries that sample CWD. They found that “the definitions of down woody (DW) variables varied among countries that inventory DW. Common minimum diameters at breast height for standing dead trees were 5, 7, 10, and 12 cm.” They reported that 33% of the countries used a minimum diameter of 7.0 to 7.6 cm and 27% used 10 cm. They also noted that the 7.5 cm threshold is very close to 3 inches, the cut-off measurement used to differentiate between fine and heavy fuels in fire behavior models. In this study, NW Spain and NW USA used a minimum diameter threshold of approximately 7.5 cm, while NW Russia used 10 cm. Therefore, we would expect the estimated CWD volume in NW Russia to be somewhat less than if a 7.5 cm threshold had been used. However, the number of small pieces and their contribution to total volume and biomass resulted in a very small difference that does not significantly alter the results and conclusions of this study.
The study shows that stand histories affect amounts of CWD, legacy wood and distribution relative to live volume. Forest management and response after natural disturbance or harvesting activities have a great influence on CWD quantity and quality in a forest ecosystem. After disturbances, logging residues and snags may be removed to avoid the outbreak of bark beetle and other insect populations that could damage living trees. After commercial thinning, harvested trees are also removed because the available technology and demand for wood has resulted in greater utilization of smaller and poorer quality trees. Reduction of CWD can reduce forest health risks, but can also contribute to a decline in biological diversity and nutrient cycling. The characterization of CWD amounts and distribution can inform forest management decisions by improving understanding of how diverse conditions, beyond those that might be encountered in a single location, can affect CWD dynamics. The mature stands without disturbances in NW USA allowed us to examine deadwood accumulation in a context similar to primary forest or forest with stand development stages approaching naturalness. In contrast, CWD was scarce in the short-rotation, managed forest sites of NW USA and NW Spain, where natural stage development was interrupted early on ([7], [47]).
Managers need to know how much CWD to leave or create in a stand. Here, we have examined deadwood accumulation in stands ranging from short rotation managed forest to those approaching levels of naturalness. The results can inform guidelines for prescribing adequate levels of CWD in terms of density, size, and amount in different decomposition classes, as well as for attaining optimal response after disturbances. The relevance of such information cannot be understated in the current context of forest management linked to intensive silviculture. The significant role of dead wood in carbon pooling linked to biodiversity is becoming clearer and competes with a growing interest in harvesting logging residues for energy production.
Conclusions
Four pine ecosystems were compared in three regions with different site conditions, forest histories and legacies. The results of this paper show that the quantity of dead wood varies greatly according to pine ecosystem and stand age class. The large differences in CWD stores and successional patterns appear to correspond to variations in natural conditions, management practices, legacy and disturbance history in the regions studied. Coarse woody debris ranged from 3.76 m3 ha-1 (1.55 Mg ha-1) for Pinus spp. NW Spain to 24.86 m3 ha-1 (6.69 Mg ha-1) for Pinus sylvestris in NW Russia to 55.35 m3 ha-1 (20.38 Mg ha-1) for Pinus ponderosa and 77.04 m3 ha-1 (28.04 Mg ha-1) for Pinus contorta, both in NW USA.
The common assumption of a “U-shaped” CWD accumulation pattern was not supported in NW USA forest ecosystems. Fire and insect damage disturbances affected CWD amounts in all age classes in both Pinus contorta and Pinus ponderosa forests. Dead to live wood volume ratios were found to be closely related to natural and human perturbations.
Acknowledgments
We want to express our gratitude to Becky Fasth, Mark Harmon, Mikhail Yatkov, Susan Morré and Valentín Pando for providing help with data support, analysis and the English language. This work was made possible through the INTERREG III B FORSEE project financed by the European Union and through the University of Valladolid grant program. The authors thank Andrea Blanch for her helpful English review and the anonymous referees for their valuable comments on the manuscript.
References
Gscholar
Gscholar
Gscholar
Gscholar
Gscholar
Gscholar
Gscholar
Gscholar
Gscholar
Gscholar
CrossRef | Gscholar
Gscholar
Gscholar
Gscholar
Gscholar
Gscholar
Gscholar
Gscholar
Authors’ Info
Authors’ Affiliation
Felipe Bravo
Sustainable Forest Management Research Institute, Uva-INIA, University of Valladolid, Avda. Madrid 44, C.P. 34071 Palencia (Spain)
Department of Forest Science, Oregon State University, 321 Richardson Hall, 97331 Corvallis, Oregon (USA)
USDA Forest Service, Pacific Northwest Research Station, 3200 Jefferson Way, 97331 Corvallis, Oregon (USA)
Corresponding author
Paper Info
Citation
Herrero C, Krankina O, Monleon Vicente J, Bravo F (2014). Amount and distribution of coarse woody debris in pine ecosystems of north-western Spain, Russia and the United States. iForest 7: 53-60. - doi: 10.3832/ifor0644-007
Academic Editor
Renzo Motta
Paper history
Received: May 21, 2012
Accepted: Jul 28, 2013
First online: Oct 28, 2013
Publication Date: Feb 03, 2014
Publication Time: 3.07 months
Copyright Information
© SISEF - The Italian Society of Silviculture and Forest Ecology 2014
Open Access
This article is distributed under the terms of the Creative Commons Attribution-Non Commercial 4.0 International (https://creativecommons.org/licenses/by-nc/4.0/), which permits unrestricted use, distribution, and reproduction in any medium, provided you give appropriate credit to the original author(s) and the source, provide a link to the Creative Commons license, and indicate if changes were made.

Web Metrics
Breakdown by View Type
Article Usage
Total Article Views: 56092
(from publication date up to now)
Breakdown by View Type
HTML Page Views: 46298
Abstract Page Views: 3494
PDF Downloads: 4716
Citation/Reference Downloads: 29
XML Downloads: 1555
Web Metrics
Days since publication: 4583
Overall contacts: 56092
Avg. contacts per week: 85.67
Article Citations
Article citations are based on data periodically collected from the Clarivate Web of Science web site
(last update: Mar 2025)
(No citations were found up to date. Please come back later)
Publication Metrics
by Dimensions ©
Articles citing this article
List of the papers citing this article based on CrossRef Cited-by.
Related Contents
iForest Similar Articles
Research Articles
Allometric equations to assess biomass, carbon and nitrogen content of black pine and red pine trees in southern Korea
vol. 10, pp. 483-490 (online: 12 April 2017)
Research Articles
Coping with spring frost-effects on polyamine metabolism of Scots pine seedlings
vol. 10, pp. 227-236 (online: 27 January 2017)
Research Articles
The growth dynamics of East European Scots pine (Pinus sylvestris L.) populations - a Lithuanian field trial
vol. 17, pp. 59-68 (online: 06 March 2024)
Research Articles
Growth patterns of Scots pine (Pinus sylvestris L.) under the current regional pollution load in Lithuania
vol. 8, pp. 509-516 (online: 12 November 2014)
Research Articles
Scots pine’s capacity to adapt to climate change in hemi-boreal forests in relation to dominating tree increment and site condition
vol. 14, pp. 473-482 (online: 18 October 2021)
Research Articles
Growing season water balance of an inner alpine Scots pine (Pinus sylvestris L.) forest
vol. 11, pp. 469-475 (online: 02 July 2018)
Research Articles
Twenty years of conversion: from Scots pine plantations to oak dominated multifunctional forests
vol. 10, pp. 75-82 (online: 19 October 2016)
Review Papers
Should the silviculture of Aleppo pine (Pinus halepensis Mill.) stands in northern Africa be oriented towards wood or seed and cone production? Diagnosis and current potentiality
vol. 12, pp. 297-305 (online: 27 May 2019)
Short Communications
Effective monitoring as a basis for adaptive management: a case history of mountain pine beetle in Greater Yellowstone Ecosystem whitebark pine
vol. 2, pp. 19-22 (online: 21 January 2009)
Research Articles
Sap flow, leaf-level gas exchange and spectral responses to drought in Pinus sylvestris, Pinus pinea and Pinus halepensis
vol. 10, pp. 204-214 (online: 01 November 2016)
iForest Database Search
Search By Author
Search By Keyword
Google Scholar Search
Citing Articles
Search By Author
Search By Keywords
PubMed Search
Search By Author
Search By Keyword


