Determination of differences in temperature regimes on healthy and bark-beetle colonised spruce trees using a handheld thermal camera
iForest - Biogeosciences and Forestry, Volume 14, Issue 3, Pages 203-211 (2021)
doi: https://doi.org/10.3832/ifor3531-014
Published: May 02, 2021 - Copyright © 2021 SISEF
Research Articles
Abstract
In this study, we compared the daily temperature regimes of healthy uninfected trees in the interior of a forest stand and at the fresh forest edge with infested trees at the forest edge in an area affected by a bark beetle outbreak. We estimated the potential of a handheld thermal camera for early identification of bark-beetle infested trees. We show that infested trees have significantly higher trunk temperatures than uninfested trees, which is more visible on the shine side of the trunk, and we report the differences in temperature between the shine and shadow sides. The differences are more noticeable on a warm, bright, and sunny day than on cold and cloudy day. The different intensity of solar radiation does not affect the distinction between infested and uninfested trees. The handheld thermal camera shows potential for identifying bark-beetle infested trees by scanning tree trunks on bright sunny days.
Keywords
Bark-beetle Infested Trees, Handheld Thermal Camera, Incoming Solar Radiation, Norway Spruce, Solar Radiation Modelling, Temperature Differences
Introduction
Stands of mature Norway spruce (Picea abies [L.] Karst.) are often attacked by European spruce bark beetle (Ips typographus L.). In response to climatic changes and especially to increases in maximal temperatures, the extent of damage caused by these beetles is significantly increasing ([24]). In mountainous conditions, I. typographus prefers to attack trees on fresh forest edges or in small openings caused by wind damage, salvage cutting, or previous bark beetle infestation ([12], [16]). Undisturbed spruce stands are usually well protected against direct insolation by individual and/or collective shading ([12]). Natural disturbances, such as windthrows or bark beetle infestation gaps, create new forest edges within a stand, which show a sharp microclimatic gradient. The altered microclimate is characterised by increased solar radiation, wind exposure, higher temperatures, and lower humidity ([16]). Higher air temperatures at cleared edges, associated with increased solar radiation, predispose such edge trees to infestation by providing favourable flight conditions for bark beetles and by reducing host resistance mechanisms due to drought or thermal stress on dispersing beetles ([16]). Higher temperatures on sun-exposed bark can increase the emission of primary bark beetle attractants ([3], [9], [23]). During host selection, bark beetles prefer warmer trees ([16]).
Another factor is connected with sun-related effects. A clear cut of a recent infestation patch will lead to sudden sun exposure to large parts of the stems of the edge trees, which were previously located within a closed stand and are thus characterised by relatively short crowns. Sun exposure without any prior adaptation to the altered microclimate, particularly on south-facing cleared edges, may result in heat-damaged phloem and increased transpiration rates, and may eventually lead to trees being subjected to drought stress ([16], [23]).
To some extent, trees can influence their thermal environment and thereby avoid excessive heat or enhanced temperatures during otherwise hot conditions ([22]). According to Helliker & Richter ([8]), the morphological and physiological characteristics of a tree canopy work to maintain leaf temperatures near the optimal value for photosynthesis (about 21 °C), irrespective of tree species, latitude, or average growing season temperatures. In warmer climates, leaf temperatures are lowered by evaporative cooling and mechanisms that reduce the absorbance of solar radiation, such as decreased leaf angles. However, the architecture of an individual tree changes only marginally during a few weeks of drought. On bright, warm days, the difference between canopy foliage and air temperature is mainly the result of transpiration. Longer drought periods increase canopy foliage temperatures ([32]). Stress induced by an invasion of insects or the onset of disease leads to, among other symptoms, stomatal closure and, consequently, to increased leaf and canopy temperatures ([33]). This temperature rise can often be detected at the leaf level at an early stage of infection by thermal imaging. However, research on the use of thermal remote sensing approaches for tree health monitoring has been limited ([33]). The development of handheld thermal cameras has allowed thermal imaging to be extended to the diagnosis of the physiological status of both woodland trees and individual urban trees ([13]).
The cooling effect of sap flow can help keep tree bole temperatures lower. According to Hietz et al. ([9]), during daylight hours, the bark is warmed by the surrounding air and direct radiation. The high water content of sapwood dampens the daily temperature fluctuations in the bole; transpiration water passing through the sapwood, which enters the stem base at the temperature of the soil, will remove heat and cool the cambium and the inner parts of the secondary phloem.
During attack and colonization, bark beetles disrupt two basic life-sustaining transport processes of the trees they infest. In the early phase of overcoming tree host defences, adult beetles enter a suitable host by boring through the outer bark and into the phloem, and consume phloem tissue to build egg galleries; developing larvae consume phloem for food until maturity. Together, phloem feeding by adults and larvae contributes to some amount of phloem girdling, disrupting the transport of photosynthate from the canopy to other tissues within the tree ([28], [36], [10]). Later, phytopathogenic fungal spores introduced by bark beetles germinate, and the spreading fungal hyphae penetrate the water-conducting xylem tissue in the sapwood and block water transport from the soil to the canopy ([36], [10]). Transpiration can begin to decline within the first weeks of beetle infestation. After several weeks, pre-dawn water potential drops significantly as water transport to the canopy significantly declines. In the early stages, there may be no visible signs of needle discoloration ([17], [10]). The subsequent death of the tree (staining or occlusion of sapwood, fading of foliage) may occur long after the critical interactions between the tree and beetle/fungus complex ([28]). Wullschleger et al. ([36]) showed that when xylem function begins to fail, the progeny of attacking beetles would have already departed the tree, and the phloem and cambium would have been so thoroughly girdled that mortality was assured long before any effects on sap velocity were observed.
Early detection of infested trees is crucial for the effective management of bark beetle outbreaks ([19]). Infested trees begin to undergo changes in their spectral characteristics ([1]), which can be effectively detected using remote sensing (RS) techniques, e.g., unmanned aerial vehicles (UAV), satellites, and thermal imaging ([20], [21]). Thermal imaging, based on terrestrial sensors or handheld thermal cameras, has been used for a wide range of conditions and with diverse plant species. The technique can be applied at different scales: from single seedlings/leaves ([4]) to whole trees or field crops and regions ([5]). It shows significant potential for studying plant-environment interactions and specific phenomena, such as stomatal closure, stress tolerance, and the effects of different management strategies on crop water status and tree health ([13], [30], [5]). However, using a handheld thermal camera for identifying bark-beetle infested trees based on trunk temperature sensing has not yet been described.
In our study, we aimed to compare daily temperature regimes of healthy uninfested trees in the stand interior and at a fresh forest edge and infested trees at the forest edge in areas affected by a bark beetle outbreak. We also estimated the potential of a handheld thermal camera for early identification of bark-beetle infested trees. We were specifically interested in the following: (1) What is the proper height for sensing trees for mutual comparison (base, 1.3 m, 4 m, or crown) to find the differences between uninfested and bark-beetle infested trees? (2) Is it possible to distinguish between uninfested and bark-beetle infested trees based on temperature? (3) How much is the temperature difference affected by direct solar radiation and does that prevent the identification of infested trees? (4) Can phloem temperature be derived from thermal imaging by handheld thermal cameras?
Materials and methods
Research site
The study plots were set up in a 90-year-old Norway spruce stand (Picea abies [L.] Karst.) on a moderately southwest-exposed slope at 650-730 m a.s.l. in the Western Carpathians, Central Slovakia, Michalová forest district (48° 45′ 55.85″ N, 19° 47′ 31.18″ S; WGS84). The mean annual climate indicators of the research site were as follows: air temperature, 4-6 °C; precipitation, 900-1000 mm; sum of global radiation, 1100-1150 kWh m-2 ([18]). The soil is classified as Dystric Cambisols and Cambic Umbrisols, associated with Leptosols, from weathering products of acid to neutral rocks ([18]) according to the World Reference Base (WRB) classification system ([11]).
Research design and measurements
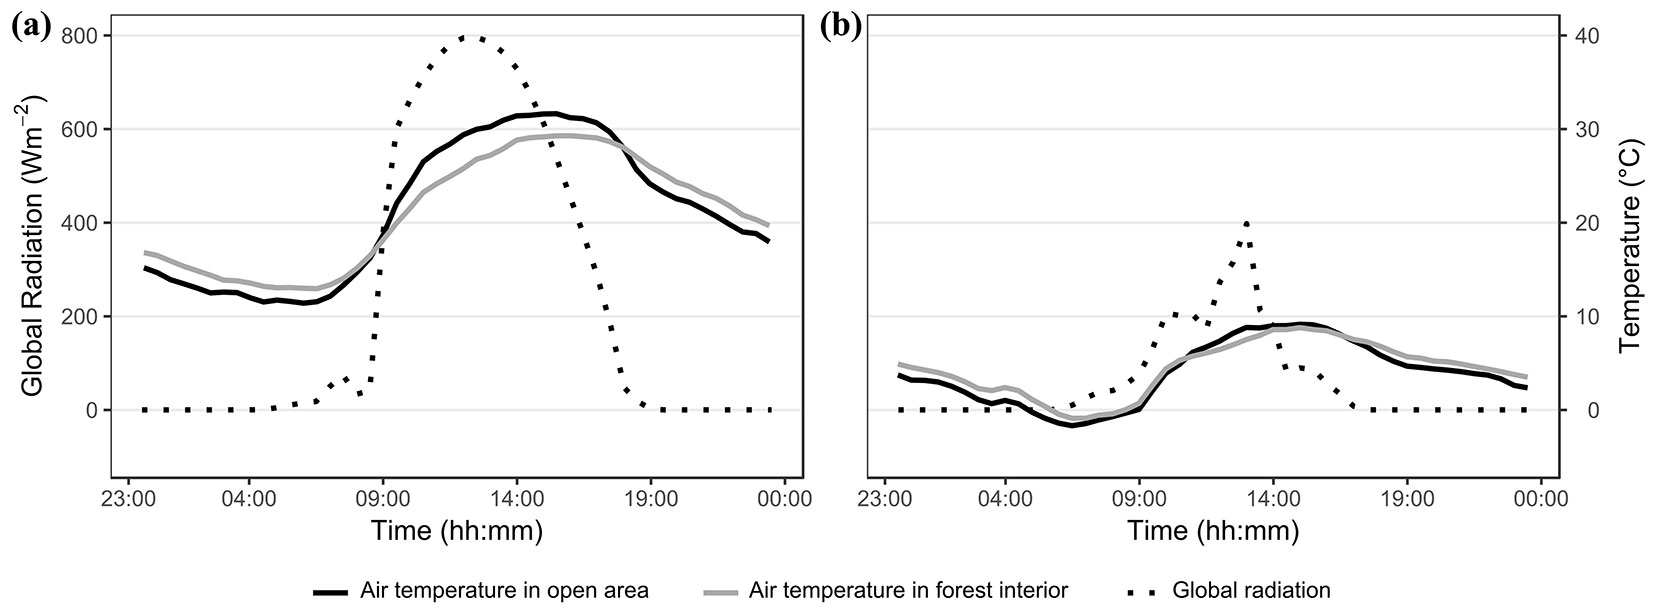
For our observations, three groups of trees were selected. Two groups contained healthy trees, not infested by bark beetles, and one contained infested trees. There were five trees in each group. The first group of healthy trees was selected in the forest interior (plot A, Interior_Uninfested) and the second at the newly created forest edge (plot B, Edge_Uninfested). The group of five infested trees (plot C, Edge_Infested) was selected at another newly created forest edge close to the two groups of healthy trees, about 150 m apart. The trees were selected from the dominant and codominant trees in the forest stand, and the mean values of selected tree characteristics of the observed tree groups are listed in Tab. 1. The measurements were recorded in two days. The first day (20 August 2012) was sunny with high temperatures, with a maximum air temperature in the open area close to the forest edge reaching 31.7 °C and the sum of global radiation totalling 5588 Wm-2 (Fig. 1a). The second day (10 October 2012) was cloudy and cold, with a maximum air temperature of 9.2 °C and sum of global radiation of 1452 Wm-2 (Fig. 1b). Twenty days before the first day of measurement, there was almost no precipitation; the total for this period was 2.6 mm. This means that the conditions were not only hot but also relatively dry before the first day of measurement. The weather characteristics in the 20 days before each measurement day are presented in more detail in Tab. 2.
Tab. 1 - Mean values (± standard error, SE) of selected tree characteristics between the plots and results of ANOVA (F[1, 2], α = 0.05). (*): diameter at breast height; (**): trees creating the surrounding forest stand and assessed for the purpose of modelling the light distribution in the MIXLIGHT model.
| Stats | Plot | DBH* (cm) |
Height (m) |
Crown length (m) |
|---|---|---|---|---|
| Mean tree characteristics (± SE) |
A | 38.6 ± 1.80 | 37.2 ± 1.11 | 18.2 ± 0.92 |
| B | 34.0 ± 1.70 | 37.0 ± 1.08 | 16.7 ± 0.44 | |
| C | 36.0 ± 2.26 | 38.6 ± 0.93 | 17.6 ± 0.85 | |
| other** | 36.8 ± 0.49 | 38.7 ± 0.26 | 17.5 ± 0.27 | |
| ANOVA results | F[3, 103] | 0.90 | 1.16 | 0.30 |
| p-value | 0.45 | 0.33 | 0.82 |
Fig. 1 - Daily course of global radiation and air temperature in an open area close to plots and in the forest interior during measurement days: (a) warm and sunny day and (b) cold and cloudy day. Air temperature in the open area is represented by a solid black line and by a solid grey line in the forest interior. Global radiation is represented by a dotted black line.
Tab. 2 - Course of weather characteristics in the 20 days before each day of measurement (20 August and 10 October 2012).
| Parameter | Stats | 31 July - 19 Aug. 2012 | 20 Sept. - 9 Oct. 2012 |
|---|---|---|---|
| Air temperature (°C) |
Avg | 17.6 | 11.8 |
| Min | 4.5 | -0.5 | |
| Max | 34.2 | 24.3 | |
| Relative air humidity (%) |
Avg | 72 | 80 |
| Min | 32 | 37 | |
| Max | 100 | 100 | |
| Precipitation (mm) | Sum | 2.6 | 30.6 |
| Global radiation (W m-2 day-1) |
Avg | 4722 | 2847 |
| Min | 1047 | 786 | |
| Max | 6532 | 5299 |
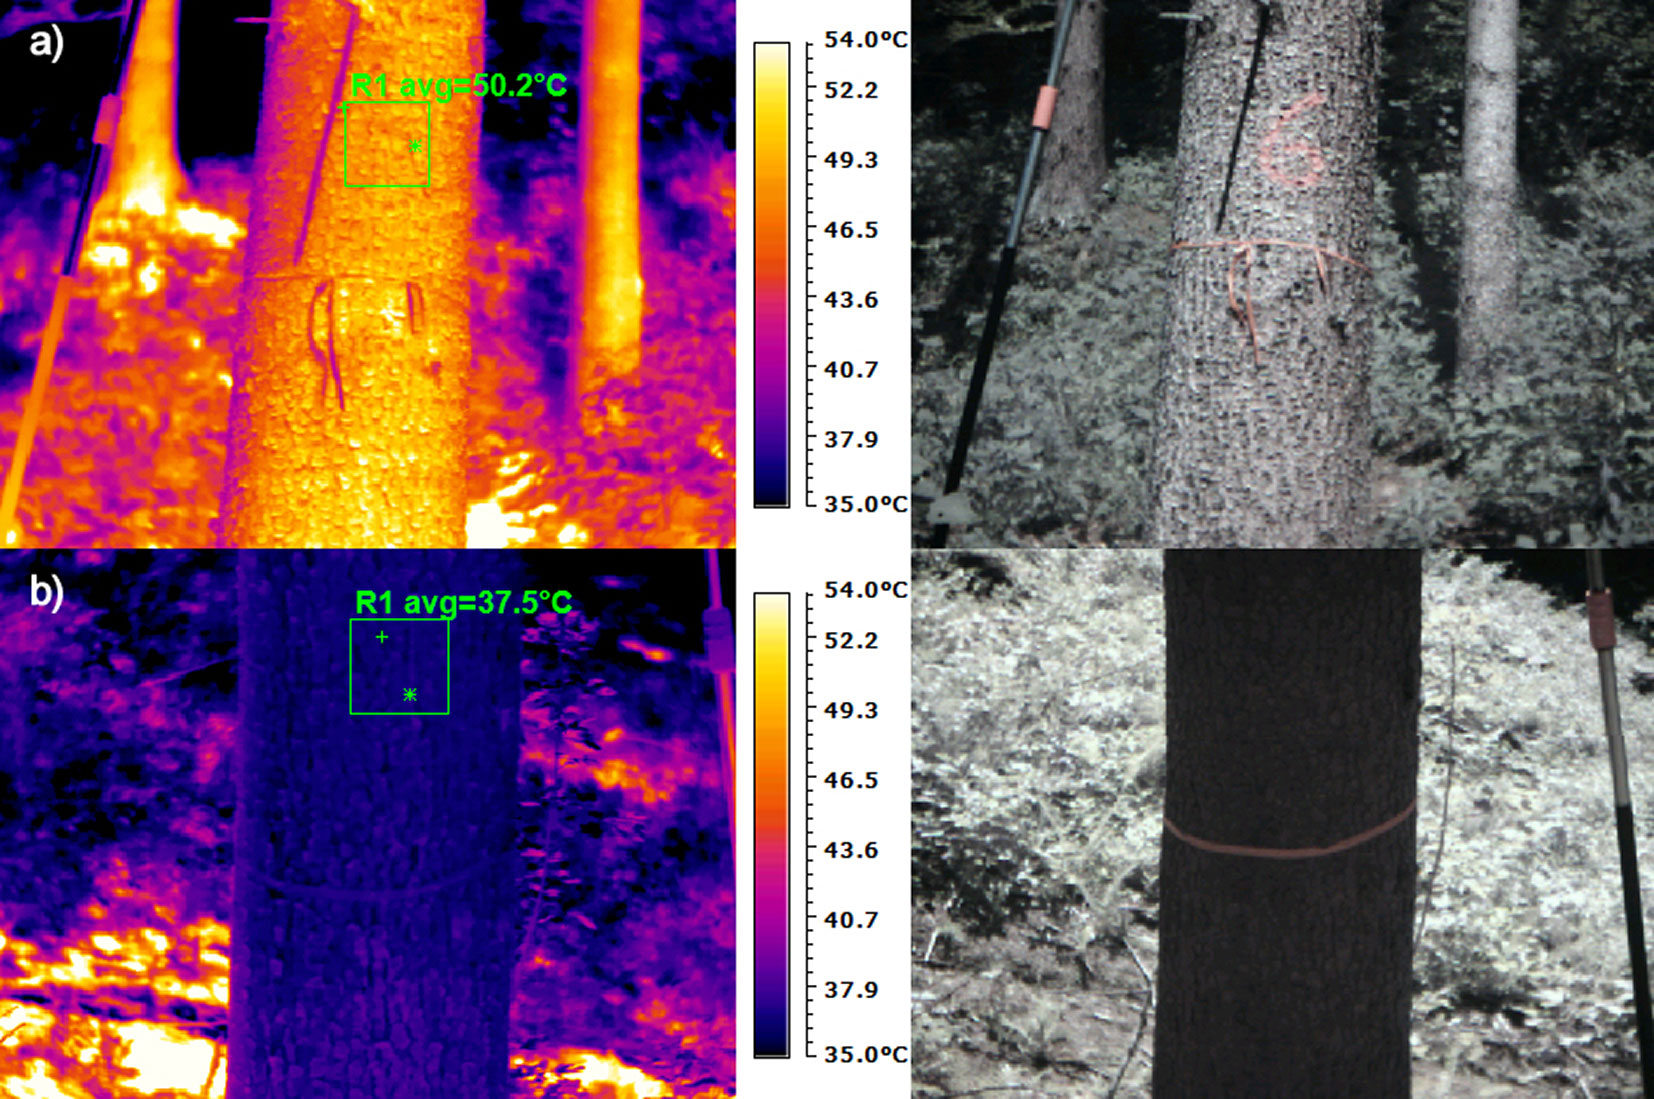
Images of stem and crown temperatures were captured using a WH-8 thermal camera (Wuhan Guide Infrared Co., Ltd., China), with a focal plane array (FPA) and uncooled microbolometer with a resolution of 384 × 288 pixels. The spectral range was 8-14 μm and the sensitivity was ≤ 0.08 °C at 30 °C. The emissivity of imaging was set to 0.96. For trees in plot A (Interior_Uninfested, two trees) and plot B (Edge_Uninfested, three trees), the temperature of phloem close to the place sensed by the infrared camera was recorded continuously using thermal sensors inserted into the phloem (EMS, Brno, Czech Republic), connected to a datalogger and stored in 15-minute intervals. The obtained infrared pictures were processed with IR Analyser software (Wuhan Guide Infrared Co., Ltd., China). To eliminate local inaccuracies of stem temperatures caused by sunlight penetrating through the canopy, we selected an area of about 20 × 20 cm of the observed stem, from which the average temperature was obtained (Fig. 2).
Fig. 2 - Thermal image and RGB photo from 1.3 m height captured using a thermal camera: (a) shine side of a tree; and (b) shadow side of a tree. On the thermal image, an area of approximately 20 × 20 cm in the middle of the observed stem was selected for obtaining the average temperature. On the right or left side of the stem is an auxiliary scale visible for easier identification of the required height on the thermal image.
Thermal pictures of each tree trunk were captured at three heights: at the base and at 1.3 and 4 m on both the shine and shadow sides; the temperature of the tree crown was taken from the ground. The shine side was the part of the tree trunk facing direct sun every time a thermal image was captured, and the shadow side was on the opposite side. The images were captured in approximately one hour intervals from morning hours after sunrise to evening hours when the sun was no longer shining on the plots. The last interval lasted two hours. We captured nine measurements on plots A (Interior_Uninfested) and B (Edge_Uninfested) and eight measurements on plot C (Edge_Infested) on the first day (20 August 2012), and nine measurements on all plots on the second day (10 October 2012). In the open area, air temperature and global radiation were measured at half-hour intervals using a Minikin RT® (EMS, Brno, Czech Republic). Air temperature was simultaneously measured in the forest interior using a Minikin TH® (EMS, Brno, Czech Republic).
Solar radiation modelling
The amount of solar radiation at each measurement point (height on the stem) was recalculated using the MIXLIGHT model ([34]), which is used to calculate solar radiation passing through tree crowns. The input to the model was data obtained with an Ilris HD® terrestrial laser scanner (Teledyne Optech, Canada). The scanning method was chosen to produce the best possible representation of the forest stand structure. The focus was not only on selected trees in individual plots, but on all trees at a distance of at least 3 times the average height of trees from experimental areas. The point cloud was processed in the Polyworks™ v. 12 software environment (InnovMetric Software, Canada), where the scan was then georeferenced into the WGS84 geodetic system. Geometric characteristics of the trees were obtained manually from the created point cloud. The parameters that were detected were tree height, diameter at breast height (DBH), trunk coordinates, crown deployment height, crown parameters, and tree social status. After entering the tree characteristics and other characteristics, such as slope, orientation, geographic position of the area, and time (or time interval), the model quantifies the percentage of solar radiation passing through the forest stand. We used mean values from 10 minute intervals of solar radiation at the time of thermographic camera measurement. Using real solar radiation data from the weather station converted with MIXLIGHT data, we were able to calculate the real amount of solar radiation. Using a Python script, we exported individual solar radiation values at the selected height and for a particular measurement time for each tree measured by the thermographic camera.
Statistics
The data were tested by Levene’s homogeneity test and the Shapiro-Wilk normality test. Given the test results, the data met the assumptions for parametric statistical methods and were statistically evaluated in R.
(1) To determine the appropriate height for thermal camera measurements, we used repeated-measure ANOVA (a = 0.05) for testing the temperatures at each tree height: at the base, at 1.3 and 4 m, and at the crown, separately for the two measurement days. The relevance of the tree to the individual plot (plot A, Interior_Uninfested; plot B, Edge_Uninfested; and plot C, Edge_Infested) and the sensing time was not considered. Tukey’s test was used to determine statistically different groups.
(2) To identify the temperature differences in 1.3 m height between trees on each of the three plots based on individual time of measurement and sunny and shady sides, we used ANOVA (α = 0.05) followed by Tukey’s test.
(3) To determine the role of incoming solar radiation on the temperature of the trees in each individual plot, we used outputs from the MIXLIGHT model containing information on the recalculated global radiation for individual trees and the individual measuring times as covariates in the ANCOVA test (α = 0.05).
(4) To determine the dependence of tree surface temperature and phloem temperature, we used linear correlation analysis. Trees from plot A (Interior_Uninfested) and plot B (Edge_Uninfested), where the phloem temperature was measured, were used in the analysis.
Results
Vertical temperature profile and optimal height for thermal measurement
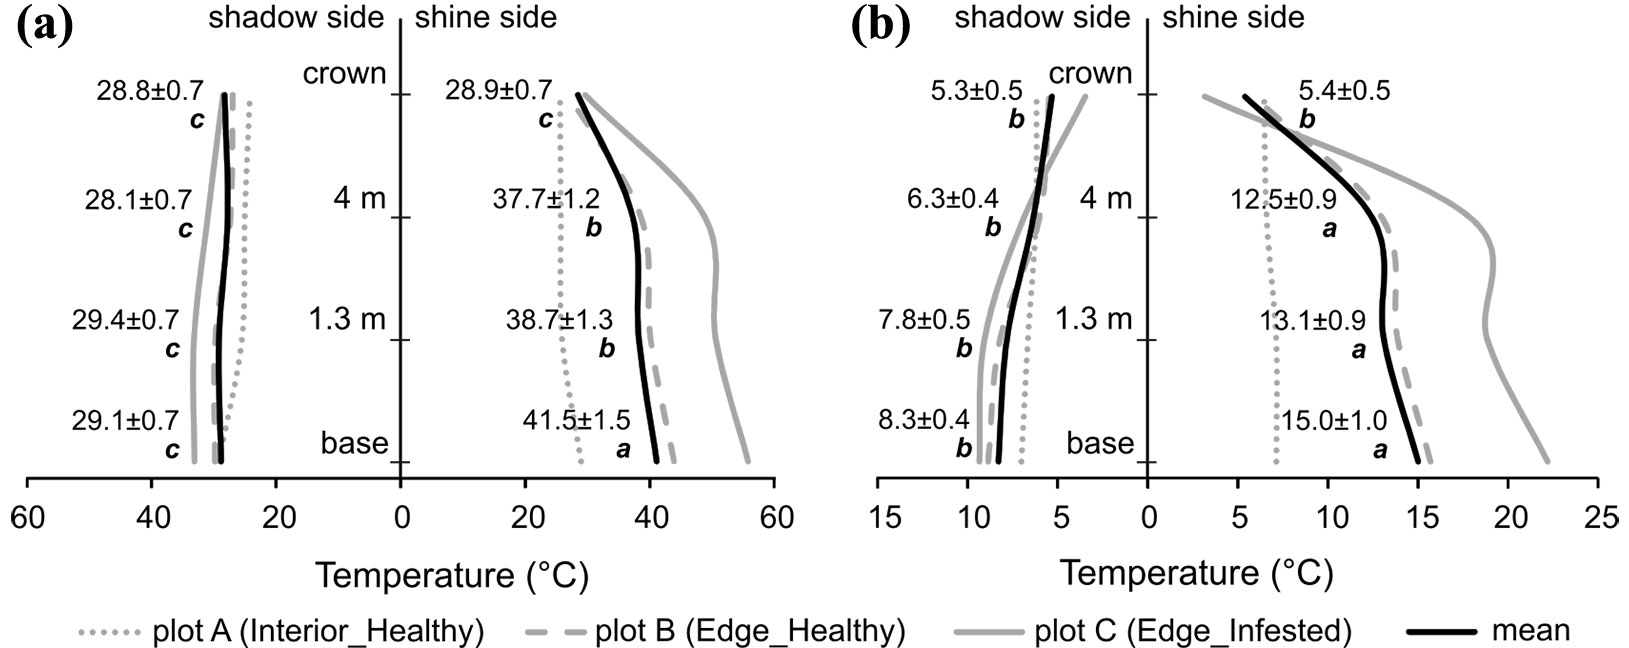
The total mean temperature of the stem base on a warm and sunny day on the shine side in all plots was the highest (Fig. 3a) and significantly different (F = 141.9, df = 7, p < 0.001) from temperatures at other heights. With increasing measurement height, temperatures decreased, whereas at heights of 1.3 and 4 m did not show statistically significant differences among groups but differed from crown temperature. Temperatures on the shady side were balanced along the full height profile; together with the crown temperature on shine side, they did not show statistically significant differences among groups. On the cold and cloudy day (Fig. 3b), the mean temperatures also decreased with measurement height on both sides of the trees. The highest mean temperature was observed at the stem base from the shine side and did not differ significantly from temperatures at heights of 1.3 and 4 m, but differed from crown temperature (F = 28.51, df = 7, p < 0.001). The mean stem temperatures on the shady side together with crown temperatures on both sides did not show statistically significant differences among groups.
Fig. 3 - Vertical mean temperature profile from measurements on both shine and shaded sides of trees on (a) warm and sunny days and (b) cold and cloudy days. Mean temperatures from uninfested trees in the forest interior (plot A) are represented by dotted grey lines, from uninfested trees on the forest edge (plot B) by dashed grey lines, and from bark-beetle-infested trees on the forest edge (plot C) by solid grey lines. Solid black lines represent total mean temperatures from all plots. Statistically different groups of total mean temperatures between the heights on both shine and shaded sides of trees within each measuring day separately were determined according to Tukey’s test (α = 0.05) and are highlighted by different lowercase letters.
Differences between healthy and bark-beetle infested trees
The temperature course on the warm and sunny day (Fig. 4a) shows that bark-beetle infested trees (plot C) had statistically significantly higher temperatures on the shine side since the first measurement than the uninfested trees on the forest edge (plot B) and in the forest interior (plot A). The temperature remained above 50 °C for most of the day, with first and last measurements being above 40 °C, which differed from the uninfested trees in the forest interior, whose temperatures did not exceed 33 °C. The temperatures from the first six measurements were significantly higher compared to those of uninfested trees on both the shine and shaded sides. The temperatures of uninfested trees, both edge and interior, were similar for the first two measurements, with minimal differences between shine and shaded sides. The temperatures of uninfested trees on the forest edge and the interior began to differ from the third measurement on the sunny side and the fourth on the shadow side.
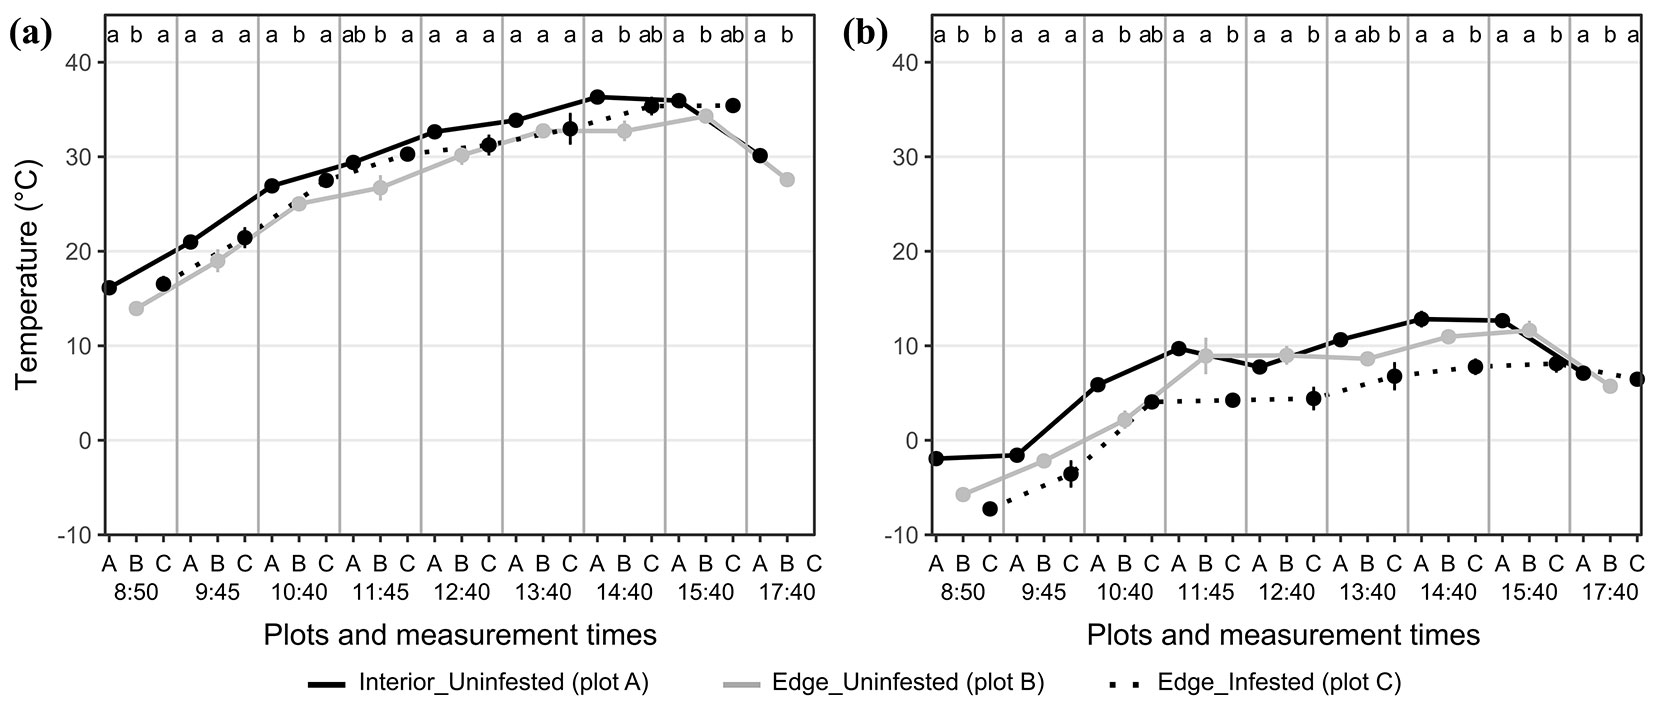
Fig. 4 - Mean temperature ± standard error (SE) at 1.3 m above the ground from the shine and shaded sides of trees and temperature difference ± SE between both sides separately for both days of measurements: (a) warm and sunny; (b) cold and cloudy. Statistical differences in temperatures between plots according to Tukey’s test (α = 0.05) at particular measurement times are separately highlighted by different lowercase letters at the top of subgraphs. The X-axis is divided for each plot (A, B, C) within each measurement, indicated by corresponding measurement times. Uninfested trees in the forest interior (plot A) are represented by solid black lines, uninfested trees on the forest edge (plot B) by solid grey lines, and bark-beetle infested trees on the forest edge (plot C) by dotted black lines.

The temperature course on the cold and cloudy day in Fig. 4b shows that bark-beetle infested trees (plot C) had statistically significant higher temperatures on the shine side during the first three measurements than the uninfested trees on the forest edge (plot B). The temperatures of uninfested trees from the shine side, both edge (plot B) and interior (plot A) trees, remained similar for the first four measurements. They began to differ significantly from the fifth measurement. The temperature courses of both sides of uninfested trees in the interior were similar, with the difference not exceeding 1 °C. The results from the cold and cloudy day showed that the infested trees also had significantly higher temperatures on the shine side from the morning hours, when the difference between sides was the highest.
The crown temperature course was similar in all plots on the warm and sunny day (Fig. 5a), with relatively small but significant differences for some measurements. On the cold and cloudy day (Fig. 5b), the crown temperature course followed the same trend in all plots, with the same course of air temperature and relatively small but significant differences for some measurements.
Fig. 5 - Mean crown temperature ± SE from the shine side of trees for both measurement days: (a) warm and sunny; (b) cold and cloudy. Statistical differences in temperature between plots according to Tukey’s test (α = 0.05) at particular measurement times are separately highlighted by different lowercase letters at the top of subgraphs. The X-axis is divided for each plot (A, B, C) within each measurement, indicated by corresponding measurement times. Uninfested trees in the forest interior (plot A) are represented by solid black lines, uninfested trees on the forest edge (plot B) by solid grey lines, and bark-beetle-infested trees on the forest edge (plot C) by dotted black lines.
Role of incoming solar radiation on the temperature of healthy and bark-beetle infested trees
On the warm and sunny day (Tab. 3), the differences between bark-beetle infested trees on the forest edge and healthy uninfested trees on the forest edge and in the forest interior from the shine side were highly statistically significant. This indicated that the state of the trees, infested or not, has a greater effect on surface temperature than incoming solar radiation. The only statistically significant difference from the shaded side was found between infested and healthy trees in the forest interior, though the difference between infested and healthy trees on the forest edge was close to statistical significance.
Tab. 3 - Results of ANCOVA comparison (F, df, p) at α = 0.05 between plots for shine and shadow sides of trees and different measurement days.
| Day | Side | Plot comparisons | ANCOVA results | ||
|---|---|---|---|---|---|
| df | F | p-value | |||
| warm and sunny | Shine | Interior_Uninfested (A) - Edge_Uninfested (B) | 1 | 1.02 | 0.316 |
| Interior_Uninfested (A) - Edge_Infested (C) | 1 | 49.77 | <0.001 | ||
| Edge_Uninfested (B) - Edge_Infested (C) | 1 | 17.91 | <0.001 | ||
| Shadow | Interior_Uninfested (A) - Edge_Uninfested (B) | 1 | 0 | 0.958 | |
| Interior_Uninfested (A) - Edge_Infested (C) | 1 | 9.1 | 0.003 | ||
| Edge_Uninfested (B) - Edge_Infested (C) | 1 | 3.13 | 0.081 | ||
| cold and cloudy | Shine | Interior_Uninfested (A) - Edge_Uninfested (B) | 1 | 6.83 | 0.011 |
| Interior_Uninfested (A) - Edge_Infested (C) | 1 | 12.62 | <0.001 | ||
| Edge_Uninfested (B) - Edge_Infested (C) | 1 | 4.69 | 0.033 | ||
| Shadow | Interior_Uninfested (A) - Edge_Uninfested (B) | 1 | 0.65 | 0.423 | |
| Interior_Uninfested (A) - Edge_Infested (C) | 1 | 3.1 | 0.082 | ||
| Edge_Uninfested (B) - Edge_Infested (C) | 1 | 0.44 | 0.506 | ||
On cold and cloudy days (Tab. 3), the largest significant difference in the shine side was, as expected, between the infested trees on the forest edge and healthy trees in the interior. Differences between other plots were also statistically significant.
Relationship between tree stem surface temperature and phloem temperature
A significant coefficient of determination (R2 = 0.92) for the shine side with a mean temperature of 22.9 °C from the thermal camera and 18.5 °C from thermal needles was obtained (Fig. 6a). The most sun-exposed were the uninfested trees on the forest edge (plot B) with the mean surface temperature of 40.5 ± 2.54 °C (Tab. 4) and mean phloem temperature of 34.4 ± 1.61 °C. However, starting with the fourth measurement, the surface temperatures were above 40 °C with a maximum of 54.4 °C and a mean of 48.6 °C. In contrast, phloem temperatures were above 33 °C with a maximum of 43.5 °C and a mean of 39 °C. The mean difference between the stem surface and the phloem temperatures during this period was 9.6 °C. For the shadow side, a significant coefficient of determination (R2 = 0.92) with a mean temperature of 17.72 °C from the thermal camera and 15.34 °C from thermal needles was obtained (Fig. 6b).
Fig. 6 - Correlation between temperatures obtained from thermal camera and thermal needles for (a) shine and (b) shaded side of trees. The belonging of the obtained points in the graph to the individual groups of trees and the day of measurement are graphically differentiated as follows: uninfested trees in the forest interior (plot A) on warm and sunny day are represented by black circle; uninfested trees on the forest edge (plot B) on warm and sunny day are represented by white circle; uninfested trees in the forest interior (plot A) on cold and cloudy day are represented by black square; uninfested trees on the forest edge (plot B) on warm and sunny day are represented by white square.

Tab. 4 - Comparison of mean values (± standard error, SE) of bark temperatures (captured using thermal camera) and phloem temperatures (measured using thermal needles inserted in the phloem) from shine and shadow sides of trees and different measurement days.
| Day | Side | Plot | Bark temperature (°C) |
Phloem temperature (°C) |
Difference (°C) |
|---|---|---|---|---|---|
| warm and sunny | Shine | Interior_Uninfested (A) | 25.5 ± 3.77 | 21.8 ± 0.89 | 3.8 |
| Edge_Uninfested (B) | 40.5 ± 2.54 | 34.4 ± 1.61 | 6.1 | ||
| Shadow | Interior_Uninfested (A) | 25.6 ± 1.14 | 21.5 ± 0.82 | 4.1 | |
| Edge_Uninfested (B) | 29.2 ± 1.48 | 27.3 ± 1.02 | 1.8 | ||
| cold and cloudy | Shine | Interior_Uninfested (A) | 6.4 ± 0.96 | 4.1 ± 0.44 | 2.3 |
| Edge_Uninfested (B) | 14.8 ± 2.20 | 10.0 ± 1.11 | 4.8 | ||
| Shadow | Interior_Uninfested (A) | 6.3 ± 1.06 | 3.9 ± 0.40 | 2.4 | |
| Edge_Uninfested (B) | 8.6 ± 1.28 | 6.8 ± 0.65 | 1.8 |
Discussion
Vertical temperature distribution
Our results showed that the temperature on the trunk base is influenced not only by solar radiation, but also by the local microclimate. A strong effect is related to distance from the soil surface. The temperature at the trunk base is much higher compared to other measurement heights. Temperatures are higher on the sunny part of the trunk. This agrees with our observations of early spring bark beetle attacks on forest edges in NP Šumava (Jakuš R, unpublished observations). In spring swarming, bark beetles first attack trees on forest edges at the base of the trunk ([37]). Contrary to our findings, Powell ([29]) reported lower temperatures at the base of lodgepole pine trunks than the rest of the bole. Although it is a different species from Norway spruce, both species have similarly finely scaly bark with similar thermal properties ([27]). So, according to Powell ([29]), possible contributing factors to the lower temperatures at the base included the lower temperature of xylem water coming from the roots, conduction of heat between the trees and ground, increased bark thickness nearer to the ground, and lower air temperature near the ground that persisted for most of the 24 h period within the forest stand. It seems that the base of the trunk is strongly influenced by many factors that affect the microclimate of the tree. Powell ([29]) indicated higher trunk sections as being more similar in temperature. We concluded that the temperature at the trunk base was not appropriate for further analysis.
Crowns tend to maintain stable temperatures, even on infested trees. The measurements of crown temperatures were not suitable for further analysis of these differences because this would involve different types of measurement (i.e., surface and distance). Based on our results, we determined the optimal height of this measurement to be 1.3 m. An important factor is the angle of measurement, which should be perpendicular to the measured surface, as recommended by the manufacturer, to achieve the highest accuracy. However, we recorded almost equal temperatures on the tree trunk 1.3 m above the ground on the shine side. This indicated that for other thermal camera applications, the whole profile of the tree trunk can be used. For example, scanning forest edges from greater distances would be possible, focusing on the part of the tree between the trunk base and the crown deployment height.
On the shaded side, the soil surface has a stronger influence, heating the tree stems. The temperature is highest at the base and gradually decreases upward along the stem. On the shine side, the temperature is more directly determined by direct solar radiation.
Differences between trees in forest stand interior and at newly created forest edge
Healthy or infested trees on forest edges had higher temperatures than trees in the stand interior. This corresponds with the preference of I. typographus to attack trees on forest edges ([12], [16]). A higher level of solar radiation generally increases surface temperature. Due to the effect of transpiration, the surface temperature of relatively healthy trees on the forest edge did not increase directly with exposed irradiation, as observed for the infested ones. Our results correspond with those of Hietz et al. ([9]), especially with the described cooling effect of transpiration on sapwood and cambium temperature.
With lower irradiation, healthy trees on the forest edge maintained their surface temperatures near those of trees in the interior. In the case of interior trees, we found a similar temperature pattern for shine and shaded parts of the trunk. This is caused by low irradiation in the stand interior and the forest stand microclimate.
Differences between healthy and bark-beetle infested trees
Bark-beetle infested trees on the forest edge had higher trunk temperatures than healthy trees on the forest edge and in the interior, whereas both groups of trees on the forest edge were exposed to similar amounts of incoming solar radiation. This agrees with the results of Powell ([29]) on lodgepole pines infested by Dendroctonus ponderosae. According to that study, freshly infested trees had subcortical temperatures similar to those of uninfested ones. However, as the beetle broods developed, the water content of the sapwood lowered, and the brood experienced higher subcortical temperatures and greater extremes of temperature. On uninfested trees on the forest edge (plot B) and in the forest interior (plot A), we report a strong correlation between phloem and bark surface temperatures. This agrees with the results reported by Powell ([29]) and Hietz et al. ([9]), and also demonstrates the precision of thermal camera measurement, which has potential for tree physiology and bark beetle development modelling. The most extreme values of surface bark temperatures on uninfested trees were recorded on the forest edge (plot B) from the shine side during the warm and sunny day, especially during noon and afternoon. During this period a maximum of 54.4 °C was recorded on the bark surface, but the temperatures recorded in the phloem were on average 9.6 °C lower. This agrees with the study of Nicolai ([27]), who described the insulating properties of bark in different tree species and types of bark. According to Annila ([2]), not only temperature but also relative humidity affects the survival of adults and offspring of Ips typographus. The relative humidity is naturally higher in the galleries under the bark and thus reduces the risk of mortality from drying out. Larvae, as well as pupae and adults, survived at 45° and 46 °C for 6 hours, at 47 °C for 4 hours and at 48 °C for 2 hours. Only temperatures exceeding 47 °C appear to be fatal in the wild, but such temperatures only stay for a few hours and the bark beetles survive this without loss. Karasev et al. ([15]) used semiconductor thermoresistors to detect trends in stem temperatures of Scots pine in different groups based on the physiological state of trees. The temperature was found to have a strong inverse correlation with the state of the trees, confirming that the method of assessing physiological state using temperature parameters allows early diagnosis of decreased viability of conifers.
Canopy layer
Only a few studies have focused on bark beetle detection using UAVs ([31], [7]). For example, Näsi et al. ([26]) and Näsi et al. ([25]) distinguished between healthy and infested and dead trees with overall accuracies of 76% and 81%, respectively, using hyperspectral UAV-borne images in Finland; however, they did not distinguish between healthy trees and those in an early stage of infestation.
Using a handheld thermal camera, we measured the bottom, and shady part of the crown, and our study is thus limited. Measuring crown temperature from the bottom is not the most appropriate method. We cannot be sure of the temperatures on the sunny/upper part of the canopy because significant temperature differences could exist between the upper and lower parts of the crown ([30]).
We can assume that the healthy canopy layer of uninfested trees tends to cool by transpiration and maintains stable and homogeneous temperatures ([8]). Air flow could also be an important factor regulating the temperature of the crown layer. Even the canopies of bark-beetle infested trees had temperatures similar to healthy trees. This may be due to bark beetles attacking phloem ([35]). Sap flow and cooling by transpiration can be affected only later by fungal infection initiated by bark beetles ([28], [36], [10]). Conversely, Junttila et al. ([14]) reported higher temperatures in severely defoliated canopies, using an airborne thermal imaging system. Golomb et al. ([6]) found that red palm weevil infestation caused water stress in palm leaves and increased canopy temperature.
Conclusions
We conclude handheld thermal cameras show potential for identification of bark-beetle attacked trees. Bark-beetle infested trees show higher daytime trunk temperatures than healthy uninfested trees in the stand interior and trees on the forest edge. The difference is more noticeable on warm and sunny days. We showed that bark beetle infestation can be detected earlier using tree trunk temperatures rather than crown temperatures. However, this issue needs further investigation with the use of UAV- or aircraft-based thermal cameras.
Our findings demonstrate the potential for identification of bark-beetle infested trees with a handheld thermal camera by scanning tree trunks on bright sunny days, particularly on forest edges. Investigations should be performed during periods when the forest edge is exposed to direct solar radiation. However, identification of bark-beetle attacked trees by trained foresters is highly subjective and time-consuming in the case of an attack on higher parts of a tree trunk. Identification of fresh attacks requires physically checking every tree. Remote identification of bark-beetle attacked trees using thermal cameras could increase the efficacy and speed of the process. The method could be more efficient in spring or under mountain conditions when initial attacks start on the forest edge. Later, when attacks spread to the forest interior, the use of a handheld thermal camera may be limited. An efficient protocol for this requires further development.
Author contribution
A.M., field work, data measurement and analyses, writing the paper; R.J., experimental design, field work, result evaluation, writing the paper; M.B., experimental design, data measurement and analyses, results evaluation, writing the paper.
Funding
This work was supported as a part of the following projects: (1) Slovak Research and Development Agency, Contract nos. APVV-19-0606 and APVV-15-0761; (2) Research Agency, no. ITMS 26220220109 “Prognostic-information systems for improving the efficiency of management”, supported by the Research & Development Operational Programme funded by the ERDF; (3) Grant Agency of the Ministry of Education and the Slovak Academy of Sciences (VEGA 2/0176/17); (4) EXTEMIT-K grant no. Z.02.1. 01/0.0/0.0/15_003/0000433, financed by Operational Programme Research, Development and Education (OPRDE).
References
Gscholar
Gscholar
CrossRef | Gscholar
Gscholar
CrossRef | Gscholar
Gscholar
CrossRef | Gscholar
CrossRef | Gscholar
CrossRef | Gscholar
Gscholar
Authors’ Info
Authors’ Affiliation
Rastislav Jakuš 0000-0003-2280-1952
Miroslav Blaženec 0000-0001-9743-614X
Institute of Forest Ecology, Slovak Academy of Sciences, Ludovíta Štúra 2, 960 53 Zvolen (Slovak Republic)
Faculty of Forestry and Wood Sciences, Czech University of Life Sciences, Kamýcká 1176, 165 21 Praha 6 - Suchdol (Czech Republic)
Corresponding author
Paper Info
Citation
Majdák A, Jakuš R, Blaženec M (2021). Determination of differences in temperature regimes on healthy and bark-beetle colonised spruce trees using a handheld thermal camera. iForest 14: 203-211. - doi: 10.3832/ifor3531-014
Academic Editor
Carlotta Ferrara
Paper history
Received: May 21, 2020
Accepted: Feb 23, 2021
First online: May 02, 2021
Publication Date: Jun 30, 2021
Publication Time: 2.27 months
Copyright Information
© SISEF - The Italian Society of Silviculture and Forest Ecology 2021
Open Access
This article is distributed under the terms of the Creative Commons Attribution-Non Commercial 4.0 International (https://creativecommons.org/licenses/by-nc/4.0/), which permits unrestricted use, distribution, and reproduction in any medium, provided you give appropriate credit to the original author(s) and the source, provide a link to the Creative Commons license, and indicate if changes were made.

Web Metrics
Breakdown by View Type
Article Usage
Total Article Views: 37996
(from publication date up to now)
Breakdown by View Type
HTML Page Views: 31135
Abstract Page Views: 3294
PDF Downloads: 2881
Citation/Reference Downloads: 6
XML Downloads: 680
Web Metrics
Days since publication: 1876
Overall contacts: 37996
Avg. contacts per week: 141.78
Article Citations
Article citations are based on data periodically collected from the Clarivate Web of Science web site
(last update: Mar 2025)
Total number of cites (since 2021): 12
Average cites per year: 2.40
Publication Metrics
by Dimensions ©
Articles citing this article
List of the papers citing this article based on CrossRef Cited-by.
Related Contents
iForest Similar Articles
Research Articles
A bark beetle infestation predictive model based on satellite data in the frame of decision support system TANABBO
vol. 13, pp. 215-223 (online: 06 June 2020)
Research Articles
Assessment of sanitary conditions in stands of Norway spruce (Picea abies Karst.) damaged by spruce bud scale (Physokermes piceae Schrnk.)
vol. 6, pp. 73-78 (online: 07 February 2013)
Research Articles
Impact of the four-eyed fir bark beetle (Polygraphus proximus Blandf.) on coarse woody debris stock and carbon budget of fir forests in Central Siberia
vol. 19, pp. 209-218 (online: 08 June 2026)
Research Articles
Electrochemical in-situ studies of solar mediated oxygen transport and turnover dynamics in a tree trunk of Tilia cordata
vol. 10, pp. 355-361 (online: 07 March 2017)
Progress Reports
Landscape-scale Ips typographus attack dynamics: from monitoring plots to GIS-based disturbance models
vol. 4, pp. 256-261 (online: 13 December 2011)
Research Articles
Ecological factors affecting the recent Picea abies decline in Slovenia: the importance of bedrock type and forest naturalness
vol. 16, pp. 105-115 (online: 29 March 2023)
Research Articles
Hygroscopicity of the bark of selected forest tree species
vol. 10, pp. 220-226 (online: 06 November 2016)
Research Articles
Analysis of canopy temperature depression between tropical rainforest and rubber plantation in Southwest China
vol. 12, pp. 518-526 (online: 09 December 2019)
Research Articles
Seven spruce species on a mountain site - performance, foliar nutrients, and forest floor properties in stands 20 years old
vol. 12, pp. 106-113 (online: 11 February 2019)
Research Articles
Distribution and habitat suitability of two rare saproxylic beetles in Croatia - a piece of puzzle missing for South-Eastern Europe
vol. 11, pp. 765-774 (online: 28 November 2018)
iForest Database Search
Search By Author
Search By Keyword
Google Scholar Search
Citing Articles
Search By Author
Search By Keywords
PubMed Search
Search By Author
Search By Keyword


