
Estimating leaf area index in semi-Mediterranean oak forests using Sentinel-2 and machine learning algorithms: cross-comparison with global satellite products
iForest - Biogeosciences and Forestry, Volume 19, Issue 6, Pages 388-395 (2026)
doi: https://doi.org/10.3832/ifor4798-019
Published: Nov 06, 2026 - Copyright © 2026 SISEF
Research Articles
Abstract
Leaf area index (LAI) provides crucial insights into forest canopy structure, vegetation density, and overall ecosystem functioning. In the Zagros Mountains of northwestern Iran, traditional silvopastoral practices rely on tree foliage as animal fodder for local communities. Understanding and estimating LAI in these forests can therefore support the adoption of appropriate strategies for sustainable management. This study aims to map LAI in the Zagros semi-Mediterranean Forests (ZMFs) in Iran using Machine Learning Regression Algorithms (MLRAs) combined with Sentinel-2 (S-2) data and a Digital Elevation Model (DEM). We employed three MLRAs, i.e., Support Vector Regression (SVR), K-Nearest Neighbors (KNN), and Random Forest (RF). To train and evaluate the algorithms’ performance, in situ LAI data were collected in 60 field plots measuring 20×20 m. The results revealed that the RF algorithm performed best, with R2 = 0.82, RMSE = 0.16 m2 m-2, and rRMSE = 16.84. We further cross-compared the generated LAI map with three satellite-derived LAI products: Sentinel-2 SNAP, MODIS, and PROBA-V. The results indicated that the uncertainty of global LAI products varies from 30% to 55% higher than that of our applied approach. The study concludes that integrating S-2 data with DEM and MLRAs provides an accurate and reliable method for mapping LAI in open-canopy ZMFs. However, global LAI products show higher uncertainty because of lower spatial resolution and the lack of suitable empirical transfer functions for these forest types.
Keywords
Leaf Area Index, Sentinel-2, Digital Hemispherical Photography, Machine Learning Regression Algorithms, Zagros Forest
Introduction
Iran’s Zagros semi-Mediterranean Forests (ZMFs), covering approximately 5 million ha in western Iran, are vital for water conservation, climate regulation, erosion control, and local livelihoods, but they face degradation due to climate change, pests, deforestation, and agriculture ([24]). Accurately assessing the structural characteristics of ZMFs is essential for their effective monitoring and management ([3]). One such crucial characteristic is the Leaf Area Index (LAI), defined as the total one-sided leaf area per unit ground surface area occupied by the tree canopy in a stand of broadleaf trees ([7], [16]). LAI influences photosynthesis, water storage, carbon sequestration, and forest-atmosphere interactions ([9]). Traditional silvopastoral practices in the ZMFs provide animal fodder from tree foliage for seven months annually ([35]). Therefore, accurate and reliable LAI estimation is key to understanding forest conditions and informing sustainable traditional forest management strategies ([10]).
LAI is measured using destructive or non-destructive methods ([14]). While field measurements are accurate, they are labor-intensive, time-consuming, and impractical for large-scale studies ([12], [31]). Remote sensing offers efficient alternatives, enabling large-area LAI estimation with minimal disturbance, cost, and time ([25], [9]). Advances in diverse sensors, such as MODIS, PROBA-V, and Sentinel-2 (S-2), provide LAI products with varying spatial and temporal resolutions ([17]). However, validating and assessing the uncertainty of these satellite-derived LAI products using in situ data and high-resolution imagery is essential ([21]). LAI retrieval methods typically include statistical, physically-based, and hybrid approaches ([11], [12]).
Statistical approaches, including parametric and non-parametric methods, establish relationships between in situ LAI and remote sensing data ([9]) and incorporate variables such as the Digital Elevation Model (DEM). Physically-based models simulate canopy reflectance by analyzing interactions between vegetation and radiation ([36]). Hybrid methods combine machine learning regression algorithms (MLRAs) with physically-based models for LAI retrieval ([4], [6]). While physically-based and hybrid models offer high accuracy and scalability, they are time-intensive and require additional data ([10], [34]).
Statistical methods are widely used for LAI estimation due to their simplicity, flexibility, and accessibility ([34], [27]). Besides optical bands ([6], [9]), vegetation indices (VIs) derived from reflectance in the visible and near-infrared (NIR) regions are key predictors of vegetation attributes ([18]). Given forest heterogeneity and topographic influence on LAI, DEM data serve as valuable non-spectral variables ([22]). For example, combining satellite data with DEM data has achieved high accuracy in LAI retrieval, with R2 = 0.96 ([9]).
Regression-based MLRAs, i.e., Random Forest (RF - [3]), Support Vector Regression (SVR - [29], [11]), and K-Nearest Neighbors (KNN - [8]), are commonly employed as non-parametric statistical methods due to their fast and efficient retrieval of forest characteristics, particularly LAI. Ali et al. ([1]) investigated various MLRAs for LAI retrieval in mixed mountain forests using S-2 imagery, showing that the RF regression model performed best. Mao et al. ([23]) evaluated the performance of RF and SVR regression algorithms for estimating LAI in cotton crops using S-2 data.
Although S-2 imagery is widely available and has been used in previous studies, the original contribution of this study is developing a locally calibrated LAI model optimized for the open-canopy ZMFs. To date, no high-resolution, site-specific LAI product exists for this area. In addition, we cross-compared our S-2-based LAI maps with three widely used LAI products (S-2 SNAP, MODIS, and PROBA-V), allowing us to evaluate their performance, strengths, and limitations under open-canopy forest conditions with canopy gaps and dense understory vegetation. This study therefore fills an important regional and methodological gap by providing a locally adapted, high-resolution LAI product and benchmarking it against existing global datasets.
We pursued two main objectives in this study: (i) to assess the reliability and accuracy of LAI estimation using S-2 data and MLRAs (i.e., RF, SVR, and KNN) in the ZMFs, and (ii) to validate and cross-compare LAI products derived from S-2 SNAP, MODIS, and PROBA-V with in situ measurements and the S-2-based LAI maps modeled through MLRAs. Comparing the performance of different MLRAs allows us to identify which algorithm produces the most accurate and stable LAI estimates. In addition, validating global LAI products is essential to determine their agreement with locally modeled LAI. Comparing these products with the S-2-based LAI maps modeled from MLRAs enabled us to evaluate their consistency with locally modeled LAI and assess their agreement with site-specific LAI estimates.
Materials and methods
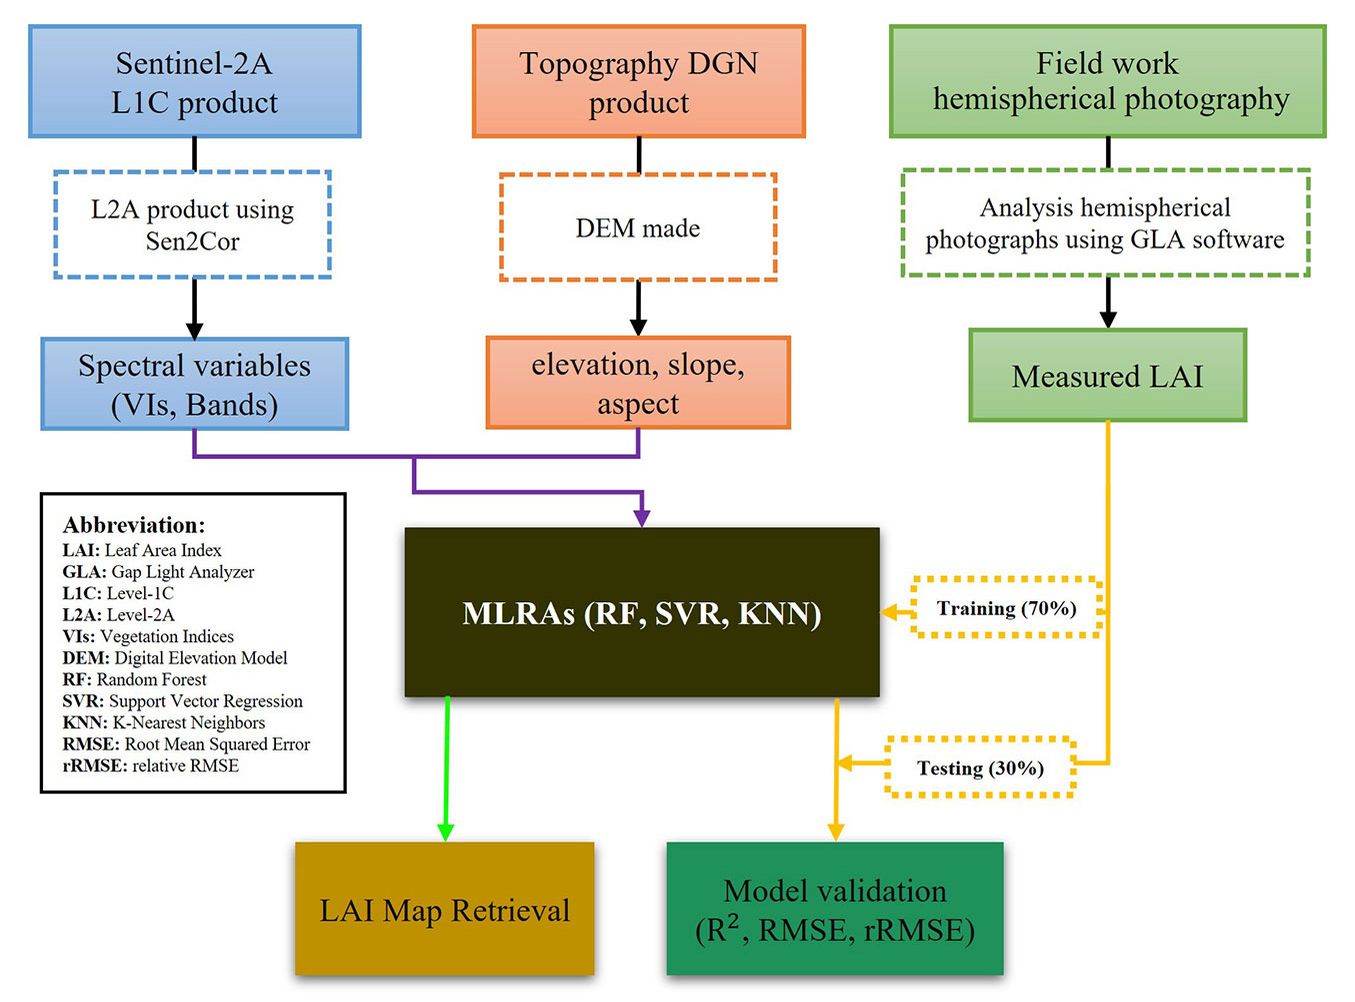
Fig. 1 presents the overall methodological workflow illustrating the step-by-step process of LAI estimation in this study. Each step is described and discussed in detail in the corresponding sections of the paper.
Fig. 1 - Workflow of the applied methodology.
Study site
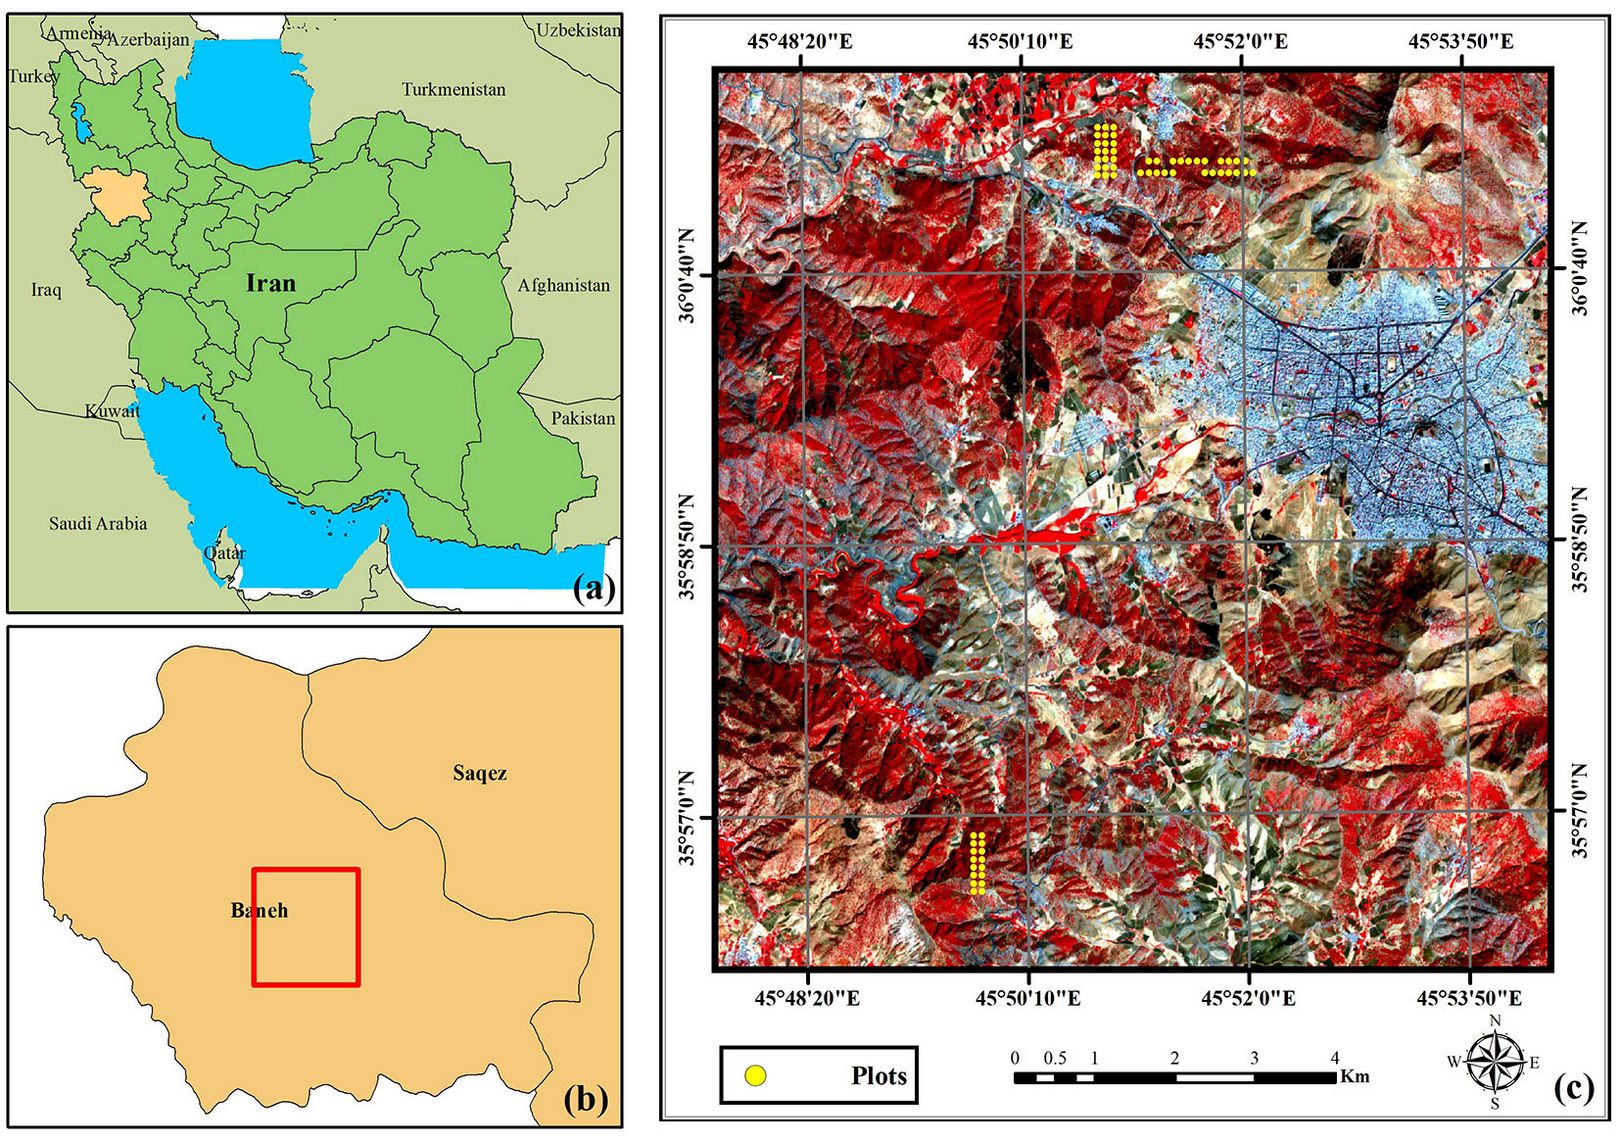
The study area is located in the Kurdistan Province in western Iran and is part of the ZMFs within the Zagros Mountain range, which spans approximately 1000 km in length and 50-100 km in width. Situated near the city of Baneh (45° 47′ 39″ - 45° 54′ 32″ E, 35° 56′ 01″ - 36° 02′ 01″ N - Fig. 2), the study area covers about 7402 ha at elevations ranging from 1398 to 2213 m a.s.l. The region has a semi-arid climate, with a mean annual precipitation of 672.5 mm and a mean annual temperature of 13.9 °C. The dominant oak species include Quercus brantii Lindl., Quercus infectoria Oliv., and Quercus libani Oliv.
Fig. 2 - Location of the studied area in the Kurdistan province, Iran (a), Baneh city (b), and the center of the plots with a false-color background (R: B8, G: B4, B: B3) S-2 image (c).
In situ data collection
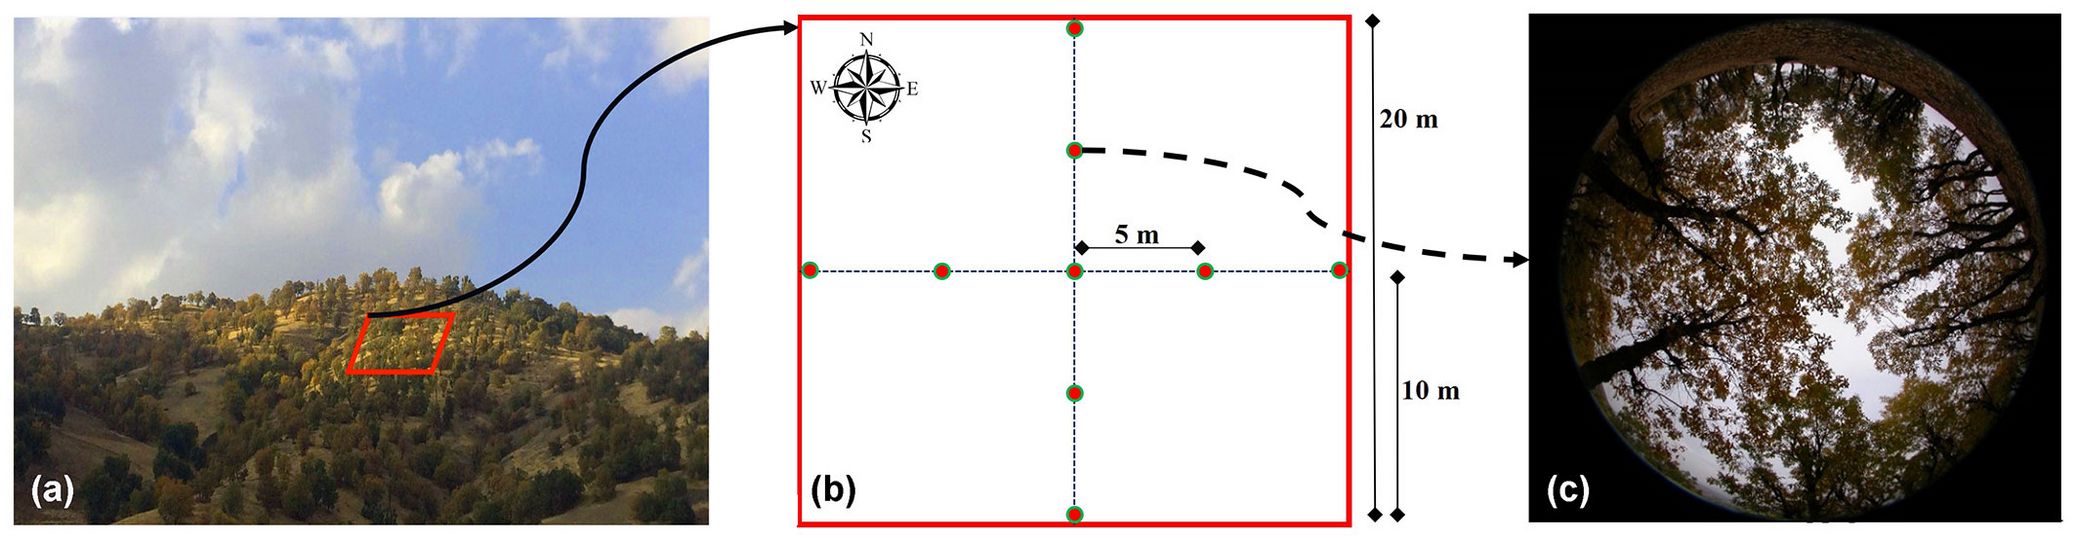
In situ LAI measurements were collected in October 2016 from two forested areas located in the northwest and southwest of Baneh city (Fig. 2b), selected to represent contrasting canopy densities. Sixty 20 × 20 m plots were established along transects spaced 100 m apart, and the geographic coordinates of each plot were recorded using a Global Positioning System (GPS). LAI was estimated using the Digital Hemispherical Photography (DHP) method with a Nikon Coolpix™ 4500 camera equipped with a fisheye lens. Nine hemispherical photographs per plot were taken at 5-m intervals along north-south and east-west directions, either before sunrise, after sunset, or under overcast conditions to minimize the influence of direct sunlight (Fig. 3). The photographs were analyzed using the Gap Light Analyzer (GLA) software, and plot-level LAI values were calculated as the average of the nine images ([26]).
Fig. 3 - Set-up of field LAI measurements. (a) Position of a plot in the studied forest; (b) positions of digital hemispherical photography (DHP) images within each plot; (c) individual DHP images.
Remote sensing data and preprocessing
A cloud-free Sentinel-2A (S-2A) Level-1C (L1C) image acquired on September 21, 2016 was obtained from the Copernicus Data Space Ecosystem (⇒ https://dataspace.copernicus.eu/explore-data/data-collections/sentinel-data/sentinel-2). Although the in situ LAI measurements were conducted after the onset of leaf senescence, we selected the image from the peak greenness period to avoid potential spectral bias and ensure full canopy representation. The Multi Spectral Instrument (MSI) sensor onboard S-2A has 13 spectral bands with spatial resolutions of 10, 20, and 60 m, covering wavelengths from 443 to 2190 nm. To correct for atmospheric effects in the L1C (Top-Of-Atmosphere reflectance) product, the Sen2Cor processor (⇒ https://step.esa.int/main/snap-supported-plugins/sen2cor/) was used to generate the Level-2A (Bottom-Of-Atmosphere reflectance) product ([13]). This study used all 13 spectral bands, resampling the 20 m and 60 m bands to 10 m spatial resolution for consistency. To further characterize vegetation and minimize spectral mixing with background soil (due to low canopy density in the study area), we derived several vegetation indices (VIs) using region-specific settings in the Sentinel Application Platform (SNAP) software (see Tab. S1 in Supplementary material).
DEM Data
The National Cartography Center of Iran (NCC) has produced 2D and 3D maps of Iran at a scale of 1:25.000, in DGN format. The maps are provided in the UTM projected coordinate system, zone 38N, with WGS-84 datum. They contain highly accurate digital topographic information, including 10-m interval contour lines. For this study, we used two sheets (5161INW and 5162IISW) covering the study area to generate DEM data. We then derived slope and aspect maps at a 10 m spatial resolution to match the pixel size of the S-2 imagery.
LAI Products
In this study, we used the S-2-derived LAI product generated with the Biophysical Processor in SNAP software, which applies the PROSAIL (PROSPECT + SAIL) Radiative Transfer Model (RTM) and a Neural Network (NN) trained on eight S-2 spectral bands and observation geometry angles ([17]). We also used the MODIS LAI/FPAR V6.1 (MCD15A2H) product, obtained from the Terra and Aqua platforms, which estimates LAI using red and NIR reflectance with a look-up table from a 3-D RTM ([19]) and complements it with a statistical method for low-quality estimates (⇒ https://earthexplorer.usgs.gov/). Additionally, we used the Copernicus Global Land Service (CGLS) LAI product, derived from PROBA-V reflectance data and an NN trained on MODIS and CYCLOPES estimates ([2]), to complement the analysis (⇒ https://land.copernicus.eu/en/products/vegetation/leaf-area-index-300m-v1.0).
LAI Modeling
We performed Pearson’s correlation analysis to investigate the relationship between field-measured LAI and both spectral and non-spectral variables. Specifically, we extracted average values of Sentinel-2 (S-2) spectral bands and DEM-derived variables from 60 plots. To model forest LAI using S-2 and DEM data, we performed MLRAs on 70% of the field plots (n = 42). Commonly used MLRAs (RF, SVR, and KNN) were applied across different datasets. The SVR, KNN, and RF algorithms were implemented using the “e1071”, “kknn”, and “randomForest” packages in R software, respectively. The SVR algorithm was implemented with a linear kernel, as kernel choice strongly affects performance and the implementation can be complex ([11]). The main model parameters were set as follows: cost (C = 1), which controls the penalty for errors outside the ε-insensitive zone, and predefined margin (ε = 0.1), which defines the width of the zone within which errors are ignored. We implemented the KNN algorithm with 9 neighbors (K = 9) and Gaussian kernel weighting, using Euclidean distance as the proximity measure. This algorithm is simple to implement and has been shown to perform well in remote sensing studies ([8]). We applied the RF algorithm using bootstrap sampling ([5]). Among its parameters, ntree (the number of trees) and mtry (the number of variables considered at each split) play a crucial role in model performance. In this study, we set ntree to 500 trees, while mtry was set to 4, 2, 4, and 8 for the S-2 spectral bands, DEM, VIs, and the combined dataset including all variables, respectively.
Accuracy assessment
After developing the calibration models based on SVR, KNN, and RF, we evaluated the performance using the remaining 30% of independent sample plots (n = 18). The accuracy of these algorithms was assessed using three commonly used metrics, i.e., the coefficient of determination (R2 - eqn. 1), root mean squared error (RMSE - eqn. 2), and relative RMSE (rRMSE - eqn. 3); eqn. (1) to (3) were utilized to compute these metrics:
where n is the total number of plots for accuracy assessment, yi is the measured LAI using hemispherical photography, hat{y}i is the estimated LAI based on models, and bar{y} is the average value of the measured LAI.
LAI map of the study area
In the final stage of our analysis, we selected models generated from three algorithms: SVR, KNN, and RF. These models performed satisfactorily in estimating LAI. We then created a spatial LAI map covering the entire study area. Our study area included not only forests but also other land uses. We used NDVI classification maps, Google Earth, and our knowledge of the study area to exclude areas without vegetation cover from the final map. We generated the LAI map using the “raster” package in R.
Validation of LAI products
Cross-comparison of LAI products was performed in two ways: (i) comparison with in situ field data, and (ii) evaluation against the wall-to-wall LAI generated using our methodology. For this purpose, we applied the best calibration model to generate the LAI map and conducted a pixel-based comparison among S-2 SNAP, MODIS, and PROBA-V products. We defined the raster extent by the study area boundary and resampled all products to a 10 m pixel size.
Results
Correlation analysis
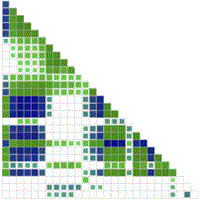
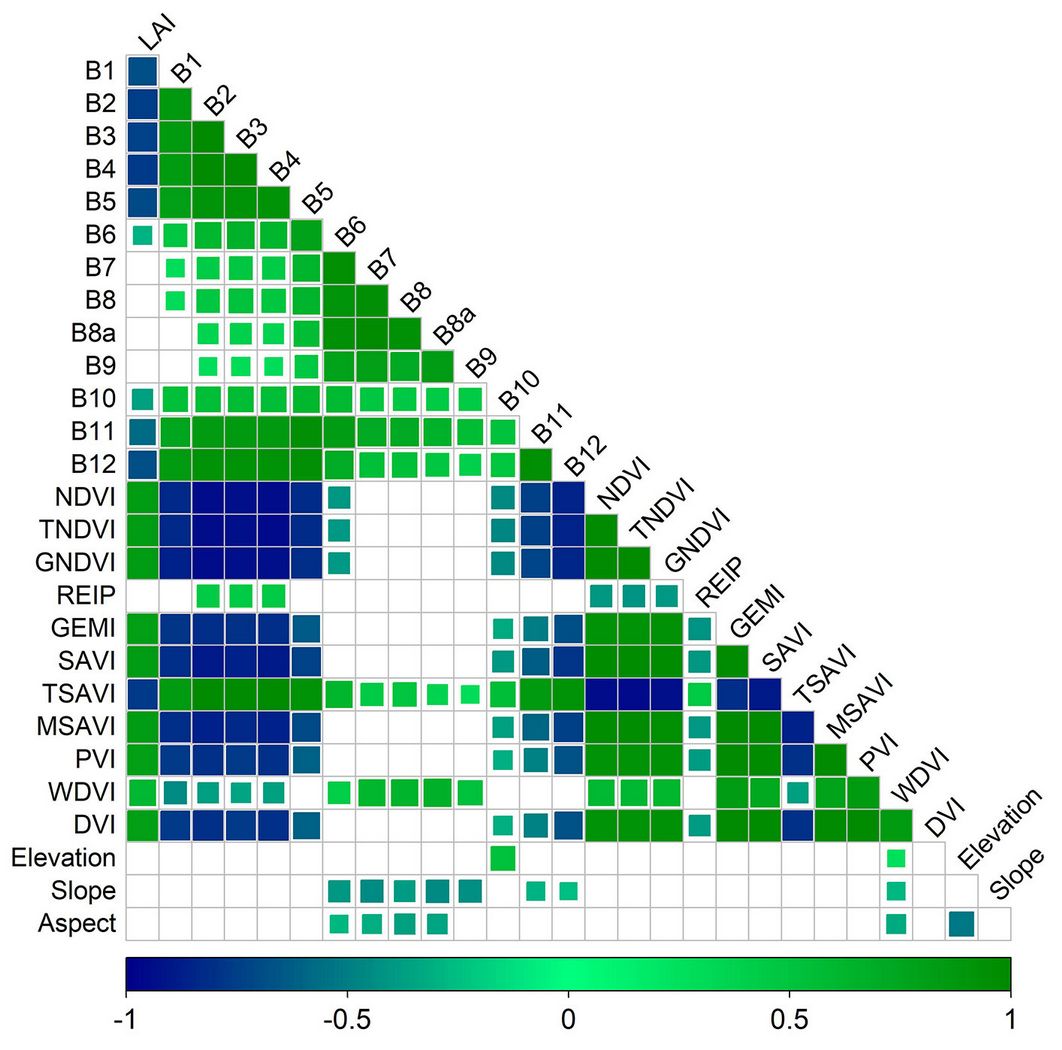
Pearson’s correlation analysis showed that the red band of S-2 data had a strong and significant correlation with LAI (r = 0.77, p < 0.01), while the near-infrared band (NIR-b8a) and the REIP (Red Edge Inflection Point) had weak and poor correlations (Fig. 4). Additionally, LAI was found to be insensitive to physiographic characteristics, with DEM data showing low and insignificant correlations with LAI.
Fig. 4 - Pearson’s correlation matrix between measured LAI, S-2, and DEM data.
Comparative investigation of LAI models and accuracy assessment
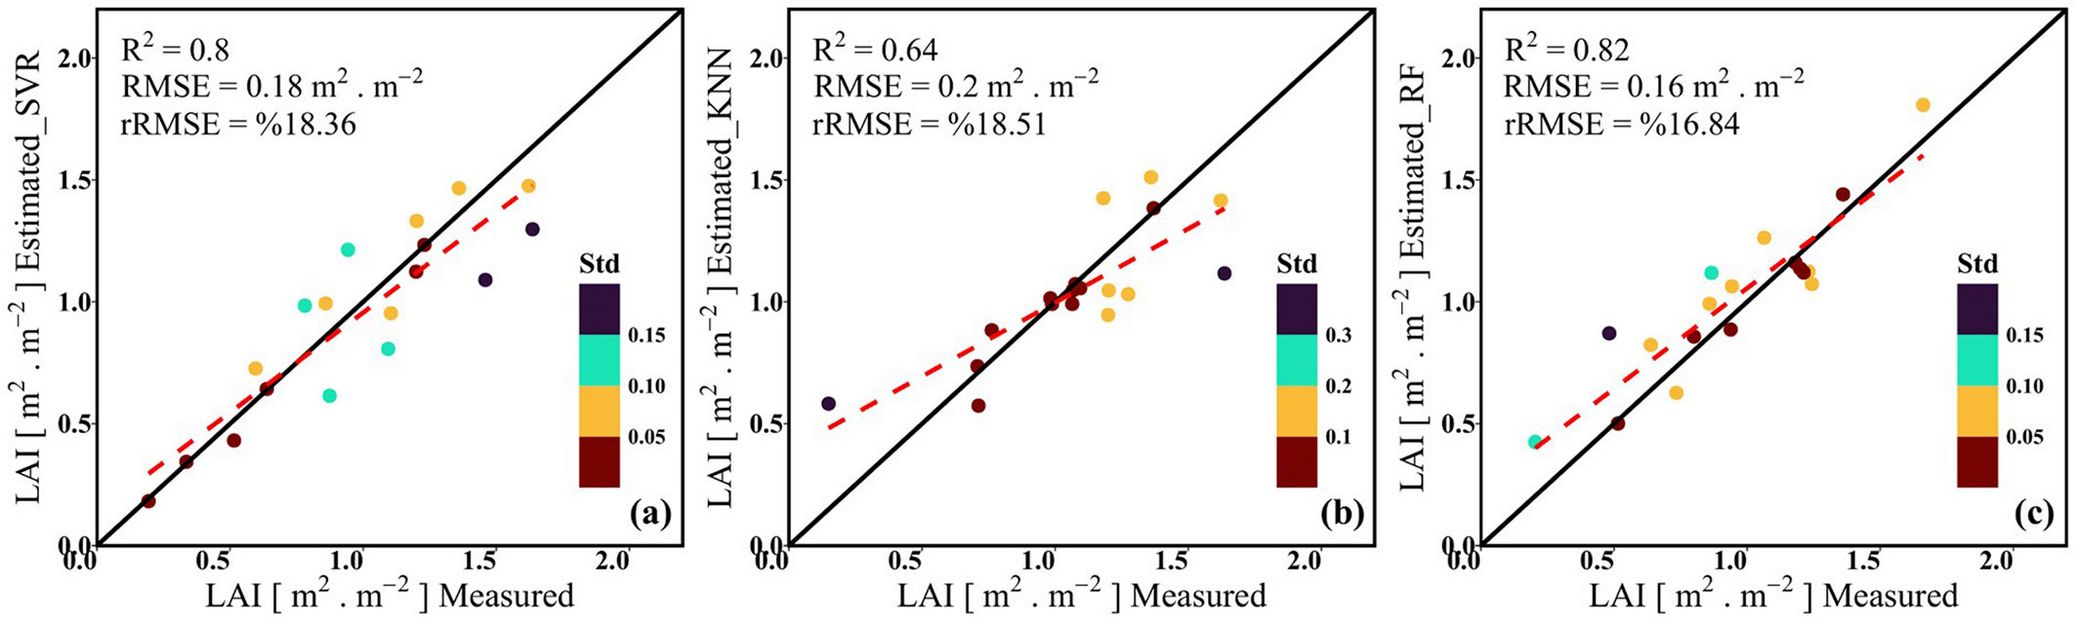
The calibration and validation results are summarized in Tab. 1. While all three models show high R2 values for calibration, the SVR and KNN models show relatively higher training errors. Validation results indicate similar performance among the models in predicting LAI, with the RF model performing best (R2 = 0.82, RMSE = 0.16 m2 m-2, rRMSE = 16.84). In contrast, among the models based on the combined dataset, the KNN model exhibited the weakest performance (R2 = 0.64, RMSE = 0.2 m2 m-2, and rRMSE = 18.51).
Tab. 1 - Model performance evaluation in predicting training and validation data.
| Model | Variables | Training (n = 42) | Validation (n = 18) | ||||
|---|---|---|---|---|---|---|---|
| R2 | RMSE (m2 m-2) |
rRMSE (%) |
R2 | RMSE (m2 m-2) |
rRMSE (%) |
||
| SVR | Band | 0.77 | 0.19 | 21.34 | 0.8 | 0.24 | 24.21 |
| VIs | 0.72 | 0.23 | 26.1 | 0.8 | 0.17 | 17.78 | |
| DEM | 0.02 | 0.44 | 47.82 | 0.29 | 0.46 | 51.22 | |
| Band+VIS+DEM | 0.78 | 0.2 | 22 | 0.8 | 0.18 | 18.36 | |
| KNN | Band | 0.71 | 0.24 | 26.79 | 0.71 | 0.21 | 23.36 |
| VIs | 0.3 | 0.37 | 37.53 | 0.14 | 0.43 | 56.8 | |
| DEM | 0.48 | 0.35 | 38.54 | 0.47 | 0.24 | 25.4 | |
| Band+VIS+DEM | 0.71 | 0.25 | 29.41 | 0.64 | 0.2 | 18.51 | |
| RF | Band | 0.91 | 0.14 | 14.81 | 0.78 | 0.23 | 27.1 |
| VIs | 0.91 | 0.13 | 14.56 | 0.85 | 0.19 | 22.47 | |
| DEM | 0.88 | 0.19 | 23.46 | 0.34 | 0.48 | 43.59 | |
| Band+VIS+DEM | 0.93 | 0.13 | 14.44 | 0.82 | 0.16 | 16.84 | |
Fig. 5illustrates the scatterplots of measured versus estimated LAI for various MLRAs. The SVR model performs well for LAI < 0.8 m2 m-2 but underestimates higher values (Fig. 5a). The KNN model overestimates low LAI values and underestimates higher ones (Fig. 5b). Conversely, the RF model shows minimal overestimation across the entire LAI range, with a slightly higher tendency for overestimation at LAI values below 1.4 m2 m-2 (Fig. 5c). Overall, the RF model is the most reliable, offering consistent estimates with minimal deviations.
Fig. 5 - Scatterplots of measured LAI vs. estimated LAI using SVR (a), KNN (b), and RF (c) models.
LAI mapping and comparison
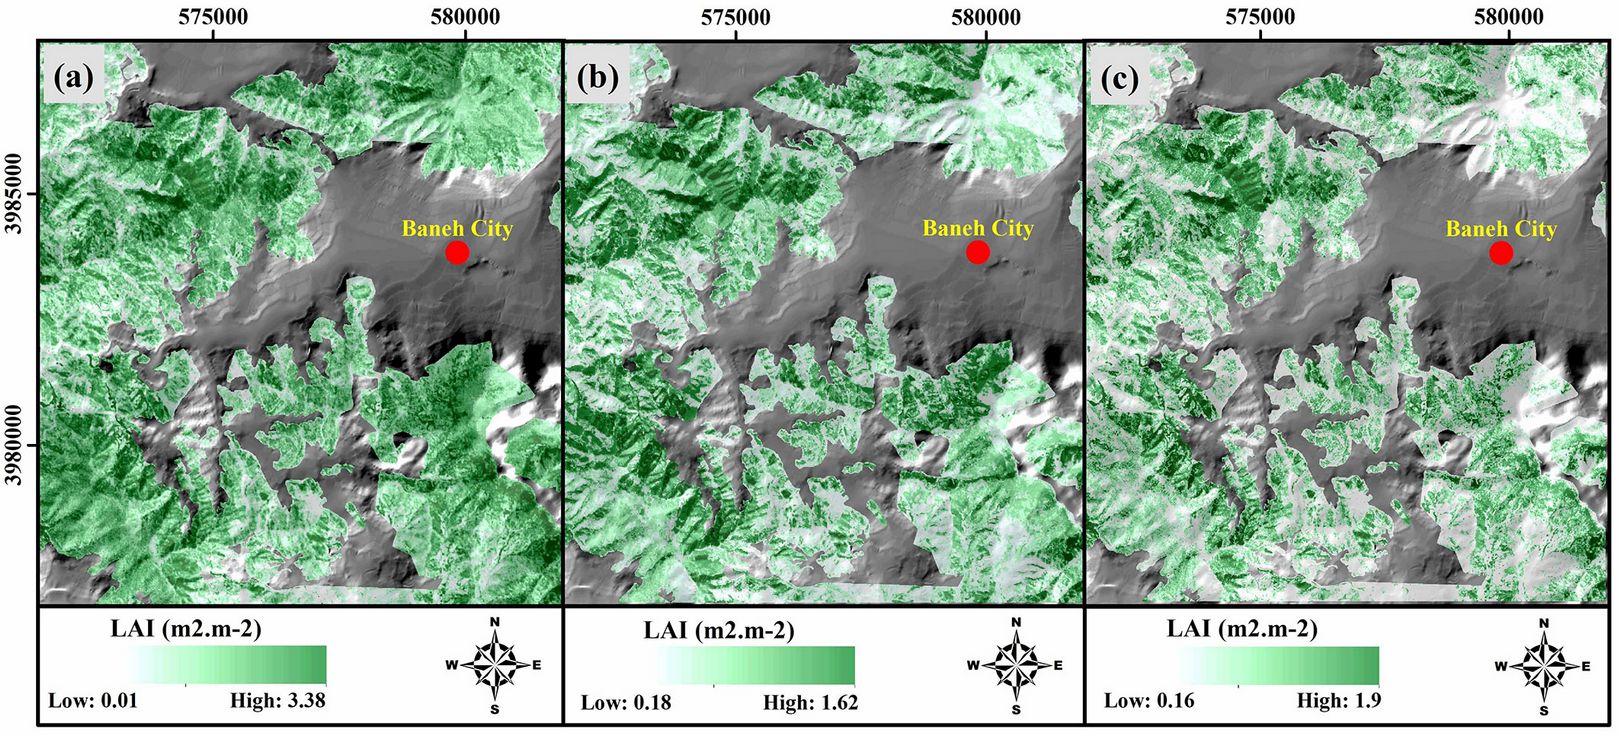
The forest LAI map was generated using all three models (Fig. 6). Non-forest land uses were excluded, represented by a hillshade map, to better visualize the forest’s LAI status. The SVR model produced relatively high LAI estimates, reaching up to 3.38 m2 m-2 (Fig. 6a). In contrast, the KNN model yielded lower estimates, ranging from 1.18 to 1.62 m2 m-2 (Fig. 6b). The RF model, however, provided realistic and reliable LAI estimates for the forest (Fig. 6c).
Fig. 6 - LAI retrieval map based on SVR (a), KNN (b), and RF (c) models.
Validation and comparison of LAI products
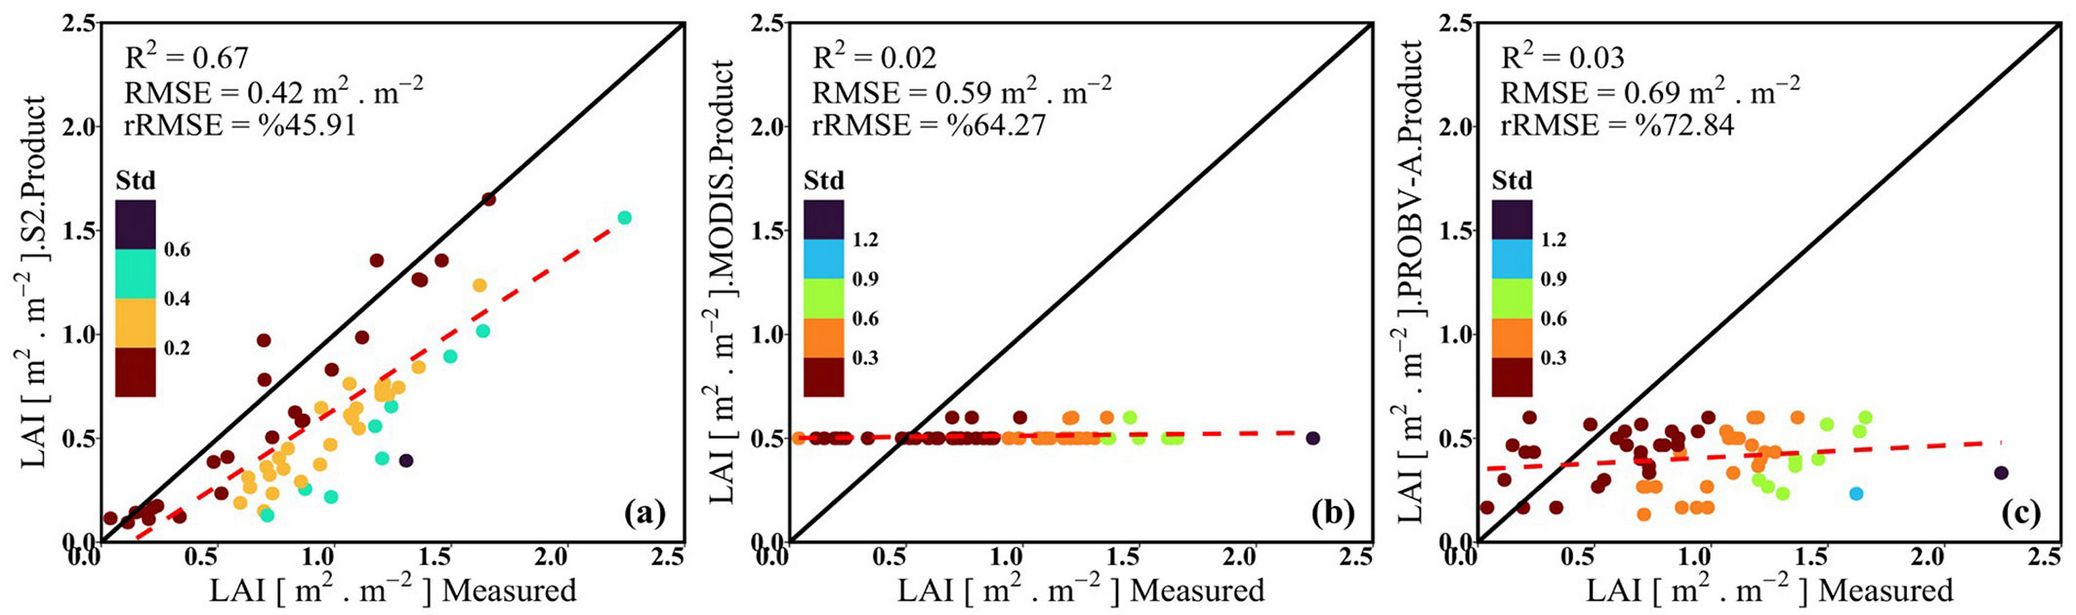
Validation of LAI products from S-2, MODIS, and PROBA-V data against in situ measurements is crucial for large-scale and temporal analyses. Fig. 7shows these validations using field sample data. The S-2 LAI product demonstrates the highest agreement with in situ data (R2 = 0.67), while MODIS and PROBA-V products showed much lower agreement (R2 = 0.02 and 0.03, respectively). Despite its higher R2, the S-2 product underestimates LAI in over 90% of field plots (Fig. 7a). MODIS and PROBA-V products overestimate LAI for values below 0.5 m2 m-2 and underestimate for values above 0.5 m2 m-2. Overall, all three products exhibit significant errors in LAI estimation, with rRMSE values of 45.91, 64.27, and 72.84, respectively.
Fig. 7 - Comparison of LAI products derived from S-2 (a), MODIS (b), and PROBA-V (c) data with in situ data.
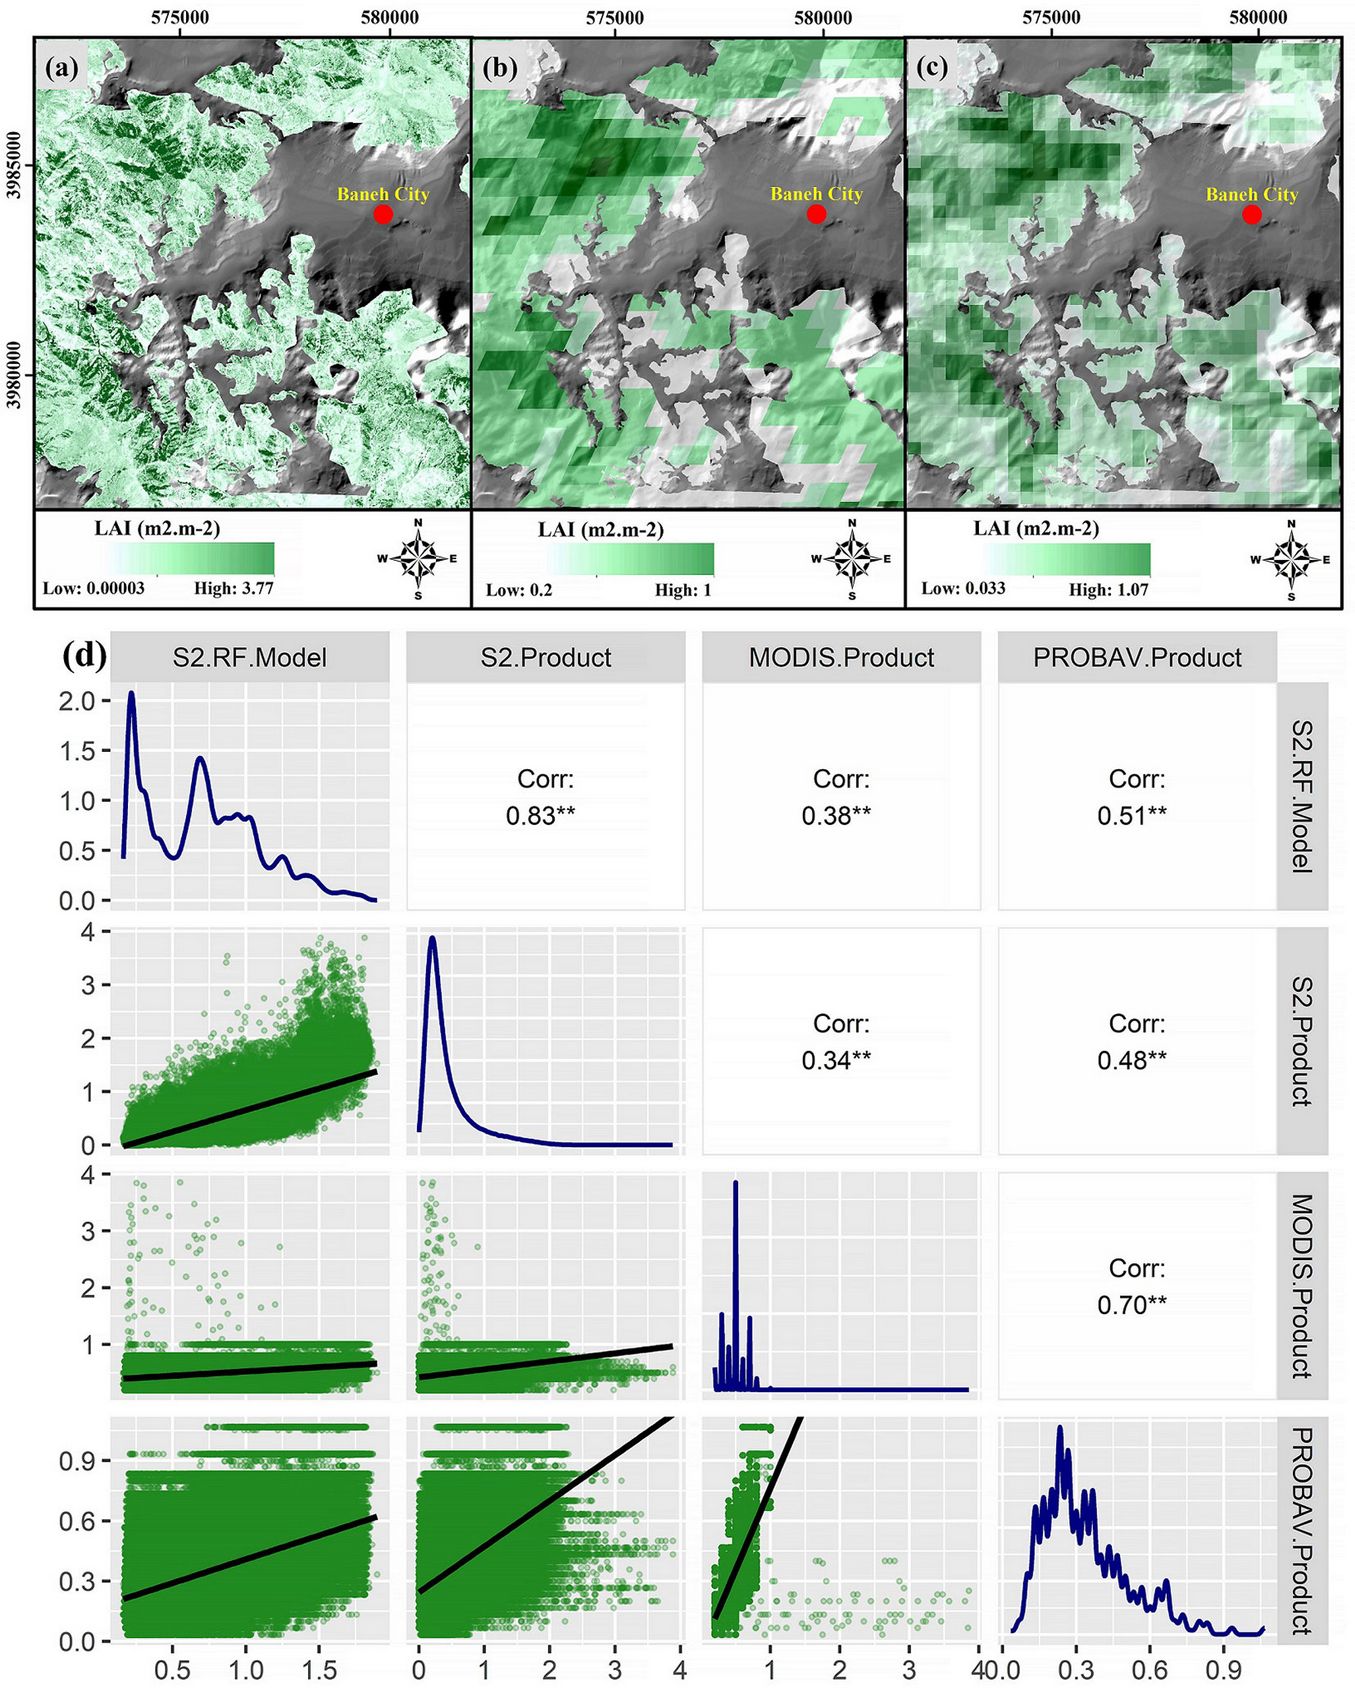
LAI products from S-2 SNAP (Fig. 8a), MODIS (Fig. 8b), and PROBA-V (Fig. 8c) were compared with the reference LAI map derived from the RF model (Fig. 8d) over a larger scale. The comparisons revealed that the reference LAI had the highest correlation with the S-2 product (r = 0.83) and the lowest with the MODIS product (r = 0.38). Reference LAI showed a positive and significant relationship (p<0.05) with all products. Scatterplots indicate that MODIS and PROBA-V LAI products underestimated LAI compared to the S-2 product.
Fig. 8 - S-2 (a), MODIS (b), and PROBA-V (c) LAI products, and a correlogram showing relationships between the LAI reference and LAI Products (d).
Discussion
Iran’s ZMFs, as a protective and supportive ecosystem, require special care and precise management. A key conservation strategy is to gather accurate, updated data on biophysical features. This helps assess forest health, determine the timing of annual growth cycles, and monitor related processes ([4]). Currently, optical remote sensing data can accurately and quickly predict many forest characteristics across various forest ecosystems without direct contact ([15]). In this study, we estimate forest LAI as the most important biophysical characteristic of the ZMFs using a combination of S-2 and DEM data based on three algorithms: SVR, KNN, and RF.
Influence of S-2 and DEM data on LAI estimation
The results of Pearson’s analysis (Fig. 4) demonstrate that S-2 data are more effective than DEM data in estimating LAI, aligning with Chen et al. ([9]), who reported the superior capability of S-2 data for this purpose. The limited impact of DEM data in our study may be due to the narrow elevation range of the field plots (1457 to 1796 m a.s.l.), where a 339 m difference does not create significant variation in LAI values. Additionally, the forest’s gentle slope has minimized climatic differences, a key factor influencing vegetation growth. A comparison between S-2 spectral bands and VIs revealed that VIs had a greater influence on LAI modeling. As noted by Prananda et al. ([30]), VIs effectively highlight vegetation attributes by leveraging relationships between visible and NIR bands, reducing the effects of atmospheric conditions, soil reflectance, and shadows. This is supported by Chrysafis et al. ([10]), who demonstrated that VIs outperformed spectral bands in modeling LAI for Mediterranean mixed forests. Similarly, Korhonen et al. ([20]) confirmed that VIs perform better than spectral bands for LAI estimation. Overall, these findings emphasize the significant role of VIs in improving model performance ([10], [15]). In this study, we successfully achieved strong performance using VIs to estimate LAI.
Our findings show that LAI exhibits a negative correlation with S-2 spectral bands, indicating that increases in LAI (and thus vegetation density) inversely affect the reflectance values of these bands. This negative correlation likely reflects physiological and structural changes in the canopy during the late growing season, such as reduced chlorophyll content and photosynthetic activity in leaves, tree shading, and the presence of understory vegetation. These explanations are consistent with the findings of Nemani et al. ([28]) and are applicable to the forest studied here. Our results also align with Stenberg et al. ([33]) and Soudani et al. ([32]), who observed similar negative correlations between LAI and spectral bands. Among the spectral bands, the red band shows the strongest correlation with LAI, likely because vegetation strongly absorbs red (b4) wavelengths due to chlorophyll. However, the low and negative correlation with NIR bands is unexpected. This can be attributed to the sampling period in the late growing season, when leaf senescence causes changes and degradation in mesophyll structure, thereby reducing the scattering capacity of near-infrared radiation. Moreover, even relatively low chlorophyll contents saturate absorption in the 660-680 nm region, which may contribute to these unexpected spectral responses. We also observed a high correlation between vegetation cover indices, particularly soil line indices, and LAI. In conclusion, our study provides valuable insights into the relationship between LAI and Sentinel-2 spectral bands, offering significant implications for forest vegetation monitoring.
Assessing the effectiveness of MLRAs in retrieving LAI
Recent studies have highlighted the growing interest in using MLRAs to estimate LAI through remote sensing ([23], [29], [9]). This study aimed to evaluate and compare the performance of three MLRAs, i.e., SVR, KNN, and RF, in estimating LAI for semi-Mediterranean sparse forests. The results showed that the RF model provided the most accurate estimates, with R2 = 0.82, and RMSE = 0.16 m2 m-2, outperforming the SVR (R2 = 0.8 and RMSE = 0.18 m2 m-2) and KNN (R2 = 0.64 and RMSE = 0.2 m2 m-2) models (Fig. 5). The superiority of the RF model over the SVR model in estimating LAI was also observed by Zhang et al. ([38]). A similar study by Yuan et al. ([37]) compared the performance of SVR, ANN, and RF models in estimating LAI, with the RF model outperforming the other two models. Overall, our study supports the evidence that the RF model is an effective tool for accurate LAI estimation, aligning with prior research.
Model accuracy in estimating LAI varies with the measured values. The scatterplot in Fig. 5 shows that the SVR model performs well for low LAI values but exhibits significant heterogeneity for higher values. The KNN model provides relatively accurate estimates for mid-range LAI values, but its estimates for LAI values greater than 1 m2 m-2 are lower. In contrast, the LAI values estimated using the RF model appear more uniform and stable ([37], [15]). Therefore, the RF model successfully mitigates heterogeneity in forest density and provides a reliable model for estimating and generating LAI maps.
Evaluation of the LAI products
The reference LAI (RF model), validated by in situ LAI data (rRMSE = 16.84), showed the highest correlation with the S-2 SNAP LAI product compared to the MODIS and PROBA-V LAI products. The geometric and spectral alignment between the reference LAI and the S-2 SNAP LAI product may contribute to the better match between these datasets. Additionally, differences in algorithms and input variables used in the S-2 SNAP LAI product and the global LAI products can also be influential. The higher resolution of S-2 data compared to MODIS and PROBA-V is another factor contributing to its superior performance. Decreasing spatial resolution from 10 m in the S-2-based reference map to 500 m in MODIS and 300 m in PROBA-V, significantly reduces the correlation between their LAI estimates and the reference LAI. Moreover, using neural network algorithms and additional input variables in the LAI estimation of S-2 SNAP and PROBA-V, compared to MODIS, appears to have enhanced their correlation with the reference LAI.
Conclusions
The LAI map, generated with high accuracy using S-2 and DEM data with various MLRAs, was evaluated using in situ data. The evaluation revealed that combining DEM variables with S-2 spectral data as input for MLRAs improves LAI estimation accuracy while reducing uncertainty and enhancing model robustness. Comparing the performance of different MLRAs is crucial for selecting the best model for forest LAI estimation and mapping. Comparing the estimates obtained using three algorithms (SVR, KNN, and RF) with ground LAI data, the RF model had the highest accuracy (R2 = 0.82 and RMSE = 0.16 m2 m-2), and can serve as a reliable reference for LAI mapping.
The comparison of LAI products derived from S-2 SNAP, MODIS, and PROBA-V data with reference LAI data indicated that the S-2 SNAP LAI product exhibits the lowest uncertainty. Overall, the derived LAI products, particularly the global LAI products, performed poorly in estimating the LAI of Iran’s oak forests. This weak performance is attributed to the lack of local adjustments in the LAI estimation algorithms for different forest ecosystems. Based on these results, we recommend further validation of LAI products using in situ data.
Acknowledgements
We are grateful to the University of Kurdistan (Sanandaj, Iran) for providing the equipment for this study, and to the Department of Remote Sensing, Global Change Research Institute of the Czech Academy of Sciences (Brno, Czech Republic) for their scientific support and valuable collaboration.
References
CrossRef | Gscholar
CrossRef | Gscholar
CrossRef | Gscholar
CrossRef | Gscholar
Gscholar
Gscholar
CrossRef | Gscholar
CrossRef | Gscholar
Supplementary Material

Authors’ Info
Authors’ Affiliation
Parviz Fatehi 0000-0002-1667-4750
Department of Forestry and Forest Economics, Faculty of Natural Resources, University of Tehran, Karaj (Iran)
Department of Forestry, Faculty of Natural Resources, and The Center for Research and Development of Northern Zagros Forestry, University of Kurdistan, Sanandaj (Iran)
Global Change Research Institute of the Czech Academy of Sciences, Department of Remote Sensing, Belidla 986/4a, 603 00 Brno (Czech Republic)
Corresponding author
Paper Info
Citation
Miri N, Fatehi P, Pir Bavaghar M, Homolová L (2026). Estimating leaf area index in semi-Mediterranean oak forests using Sentinel-2 and machine learning algorithms: cross-comparison with global satellite products. iForest 19: 388-395. - doi: 10.3832/ifor4798-019
Academic Editor
Angelo Nolè
Paper history
Received: Jan 20, 2025
Accepted: Apr 21, 2026
First online: Nov 06, 2026
Publication Date: Dec 31, 2026
Publication Time: 6.63 months
Copyright Information
© SISEF - The Italian Society of Silviculture and Forest Ecology 2026
Open Access
This article is distributed under the terms of the Creative Commons Attribution-Non Commercial 4.0 International (https://creativecommons.org/licenses/by-nc/4.0/), which permits unrestricted use, distribution, and reproduction in any medium, provided you give appropriate credit to the original author(s) and the source, provide a link to the Creative Commons license, and indicate if changes were made.

Web Metrics
Breakdown by View Type
Article Usage
Total Article Views: 336
(from publication date up to now)
Breakdown by View Type
HTML Page Views: 77
Abstract Page Views: 142
PDF Downloads: 102
Citation/Reference Downloads: 0
XML Downloads: 15
Web Metrics
Days since publication: 4
Overall contacts: 336
Avg. contacts per week: 588.00
Article Citations
Article citations are based on data periodically collected from the Clarivate Web of Science web site
(last update: Jul 2026)
(No citations were found up to date. Please come back later)
Publication Metrics
by Dimensions ©
Articles citing this article
List of the papers citing this article based on CrossRef Cited-by.
Related Contents
iForest Similar Articles
Short Communications
Estimation of canopy attributes of wild cacao trees using digital cover photography and machine learning algorithms
vol. 14, pp. 517-521 (online: 17 November 2021)
Research Articles
Estimation of forest leaf area index using satellite multispectral and synthetic aperture radar data in Iran
vol. 14, pp. 278-284 (online: 29 May 2021)
Review Papers
Digital hemispherical photography for estimating forest canopy properties: current controversies and opportunities
vol. 5, pp. 290-295 (online: 17 December 2012)
Research Articles
Assessing the influence of different Synthetic Aperture Radar parameters and Digital Elevation Model layers combined with optical data on the identification of argan forest in Essaouira region, Morocco
vol. 17, pp. 100-108 (online: 24 April 2024)
Research Articles
Mapping Leaf Area Index in subtropical upland ecosystems using RapidEye imagery and the randomForest algorithm
vol. 7, pp. 1-11 (online: 07 October 2013)
Research Articles
The estimation of canopy attributes from digital cover photography by two different image analysis methods
vol. 7, pp. 255-259 (online: 26 March 2014)
Research Articles
Classification of xeric scrub forest species using machine learning and optical and LiDAR drone data capture
vol. 18, pp. 357-365 (online: 07 December 2025)
Research Articles
Evaluation and correction of optically derived leaf area index in different temperate forests
vol. 9, pp. 55-62 (online: 11 June 2015)
Review Papers
Remote sensing-supported vegetation parameters for regional climate models: a brief review
vol. 3, pp. 98-101 (online: 15 July 2010)
Research Articles
Multi-scale drivers of wildfire burn severity in Central Zagros: insights from remote sensing and machine learning
vol. 19, pp. 359-368 (online: 08 September 2026)
iForest Database Search
Search By Author
Search By Keyword
Google Scholar Search
Citing Articles
Search By Author
Search By Keywords
PubMed Search
Search By Author
Search By Keyword