Variability of ant community composition in cork oak woodlands across the Mediterranean region: implications for forest management
iForest - Biogeosciences and Forestry, Volume 10, Issue 4, Pages 707-714 (2017)
doi: https://doi.org/10.3832/ifor2321-010
Published: Jul 27, 2017 - Copyright © 2017 SISEF
Research Articles
Abstract
We evaluated the potential use of ants as a powerful tool for environmental monitoring, together with the applicability of the functional group approach as an alternative method for studying ant communities in cork oak woodlands. Variations in ant community composition, diversity and functional groups were studied in two cork oak forested sites across the Mediterranean region. Ants were sampled using pitfall traps placed along linear transects at 12 sites located in the main cork districts of Italy and Morocco (Gallura in Sardinia, and Maâmora, east of Rabat). A total of 13.501 specimens were collected, belonging to 38 species (five shared species). A distinct separation in the NMDS plots between Gallura and Maâmora ant assemblages was clearly visible. Ant species composition was widely different between the two districts and significant differences were detected within the Gallura district at the species level. Opportunist species were well represented in Gallura (about 27% of average Bray-Curtis similarity) as well as cryptic species (over 23%). In the Maâmora forest, generalized Myrmicinae, hot climate specialists and opportunists contributed equally to the average similarity (together about 53%). Multi-scale ant diversity showed that the true turnover was higher in Gallura than in Maâmora. These findings support the idea that the functional group approach, rather than species diversity per se, could be considered as a valuable tool to detect the response of the ant community to environmental changes in Mediterranean cork oak woodlands. Using ants as bioindicators could help not only in detecting early warning signs of habitat disturbance, but also in defining a useful management strategy to increase the resilience of agroforestry systems under future global change scenarios.
Keywords
Introduction
Cork oak (Quercus suber Linnaeus, 1753) is a typical evergreen species, which is found in mixed forests, woodlands and managed agroforestry systems in the western Mediterranean region ([17]). Considered as biodiversity hotspots, cork oak land use systems cover nearly 2.5 million ha in Europe and North Africa ([7]). Cork oak agroforestry systems, commonly known as montados in Portugal, dehesas in Spain and azaghar in parts of Morocco, are important managed ecosystems, which represent the most extensive wood pastures in Europe. Cork oak woodlands have historically been subjected to intense disturbances, with a greater threat of deforestation in recent times ([7]). Inadequate management and land overuse are the main triggers of several dynamic interactions that compromise the ecology and conservation of cork oak woodlands ([7], [17]). In the decades to come, the combined pressure of climatic change and anthropogenic impacts will likely exacerbate the effects of pests and pathogens, which in turn will increase the vulnerability of cork oak landscapes, thus accelerating tree mortality and limiting the natural regeneration.
Playing a key role in biodiversity, with a variety of specific responses to environmental stressors, macroinvertebrates have been extensively used as biological indicators in a vast range of habitats ([32]). The role of ants as environmental indicators is thus becoming more important in assessing the ecological health of terrestrial ecosystems, mostly because of their high diversity and functional importance ([3], [4], [29], [31]). Ants are well represented in almost all terrestrial habitats because of a wide range of thermal niches and their ability to cope in varying environmental conditions. Most studies focusing on the use of ants as bioindicators have been conducted in Australia, and North and South America, whereas less attention has been devoted to understanding the anthropogenic impact on European ant communities ([19], [40], [20], [8], [44]). The analysis of ant community structures in relation to habitat stress or disturbance could be a valuable tool to detect early environmental changes in Mediterranean habitats ([18], [33], [20]).
Species richness and other traditional diversity measures have been commonly used in several ecological studies concerning ants as model organisms ([19], [34]). Recently, there has been considerable interest in the use of a complementary approach based on functional groups to predict ant spatial patterns in disturbed landscapes. This approach has been used in Australia and North America to reduce the complexity of ant taxonomy, and could also be exploited as a reliable model for examining the ant community structure and its relationship with land use ([2], [14], [3]). Since ant assemblages do not always follow a regular trend in response to environmental stress and disturbance, there is an urgent need for more studies focusing on species patterns, functional groups, diversity and dominance in order to provide a more accurate predictive understanding of the mechanisms that influence ant distributions in cork oak woodlands in warm-temperate regions.
In this study, we compared ant communities from cork oak woodlands in the main cork districts of Italy (Gallura, Sardinia) and Morocco (Maâmora forest), which represent two striking examples of contrasting forest-management models.
The Gallura cork oak district, with an area of about 39.000 hectares, is a semi-natural system in which agricultural and pastoral activities coexist with the cork oak industry. Depending on the prevailing land use (cereal grains for fodder, grazing, hunting, cork production), the structure of the Q. suber forests varies across the district. The forest ownership is fragmented and cork production, which is mainly located in rural marginal areas, is often considered as a secondary source of income. In parts of the Gallura district, there is a lack of natural regeneration ([43]). Consequently, much effort and public funds have been devoted to improving woodland management practices.
The Maâmora forest is considered to be the largest existing managed cork oak woodland in the world, and represents a paradigmatic example of a forest subject to a dramatic human pressure due to overgrazing and intensive cattle breeding ([7]). The cork oak forest, originally encompassing an area of 300.000 ha ([16]), has now been reduced to less than 70.000 ha ([17]). As in most other western Mediterranean countries, there is almost no natural regeneration in the entire Maâmora forest, and attempts have been made to reduce anthropogenic pressures through projects that encourage sustainable forest management ([13]). Artificial reforestation (with eucalyptus, pine and acacia) is largely practiced over the entire area, although much effort has been devoted to achieving a better cork oak protection and regeneration in recent decades ([7]). In addition to their ecological role, cork oak woodlands are considered to be very important multipurpose systems in Morocco due to the wide range of goods and services they produce (wood products, cork, aromatic and medicinal plants, fodder for livestock, ecotourism). The dominance of cistus and asphodel, the decline in the abundance of plant and animal species, accompanied by the deterioration in the forest structure and the absence of natural regeneration, represent signs of land degradation in Maâmora ([39]).
The aim of our work was to compare the ant assemblages between the cork oak woodlands of the two sites in Morocco and Italy; to study how the diversity and faunal composition varied at different spatial scales; and how the functional group scheme could be adapted to Mediterranean ant assemblages.
Materials and methods
Study areas and ant sampling
The study was conducted in the main cork oak districts of Gallura (Sardinia, Italy) and Maâmora (Morocco). The Gallura cork oak district is located in a typical Mediterranean landscape in the north of Sardinia, at an altitude of 50-600 m a.s.l. The climate is Mediterranean, with mild winters, hot and dry summers; the rainfall distribution follows a typical Mediterranean pattern with a long dry season during the warmer months and a greater concentration in late autumn and early spring (average annual temperature 13.4 °C, average annual precipitation 785 mm).
In the Gallura area, soils are Eutric Leptosols ([25]) according to the IUSS Working Group ([36]). The understory vegetation is mainly composed of rockrose (Cistus monspeliensis Linnaeus, 1753 and Cistus salvifolius Linnaeus, 1753), broom [Calicotome spinosa (Linnaeus, 1753) Link, 1822, Cytisus villosus Pourret, 1788], lavender (Lavandula stoechas Linnaeus, 1753) and asphodel (Asphodelus ramosus Linnaeus, 1753).
The Maâmora forest is located within the two regions of Gharb-Chrarda-Béni Hssen and Rabat-Salé-Zemmour-Zaer in the north of Morocco (elevation 7-290 m a.s.l.). The climate ranges from sub-humid warm winters near the Atlantic cost to semiarid and more moderate winters in the central and eastern regions (mean annual temperature 20 °C, mean annual precipitation 400 mm).
Maâmora soils are classified as Chromic Luvisols ([27]). The natural understory vegetation is extremely rich ([1]) and includes the Mediterranean palm (Chamaerops humilis Linnaeus, 1753), rockrose (C. salvifolius), broom (C. arboreus Linnaeus, 1753 and Genista linifolia Linnaeus, 1753), giant fennel (Ferula communis Linnaeus, 1753), European frostweed [Tuberaria guttata (Linnaeus, 1753) Fourreau, 1868], thatching grass [Hyparrhenia hirta (Linnaeus, 1753) Stapf, 1919], lavender (L. stoechas), narrow-leaved lupin (Lupinus angustifolius Linnaeus, 1753) and rabbit-foot clover (Trifolium arvense Linnaeus, 1753). Pyrus mamorensis Trabut, 1916 is the only endemic tree in Maâmora forest.
Twelve 1-ha sites were randomly selected across an area of approximately 15.000 and 20.000 ha for Gallura and Maâmora, respectively (see Tab. 1 for more information). In order to partially extend the vegetational information on each district, the canopy cover (i.e., the vertical projection of tree crowns on the forest floor) was estimated for each site using Google Earth Pro (⇒ http://earth.google.com). All high resolution digital images (4800 × 2718 pixels) were processed to extract the canopy information from satellite images using the open-source GIMP v. 2.8 software (⇒ http://www.gimp.org). The background represented by the ground, the bare soil and the understory vegetation was removed and digital images were turned into black-and-white. Forest canopy cover was then estimated as the percentage of black pixels in the binary images ([46]).
Tab. 1 - Main characteristics of the cork oak districts analyzed in this study.
| District | Site | Geographic Coordinates |
Elevation (m a.s.l.) |
Canopy cover (%) |
Main land use |
|---|---|---|---|---|---|
| Italy | G1 | 40.7162 N 9.0480 E |
202 | 33.22 | Grazing, cork production |
| G2 | 40.7456 N 9.0912 E |
221 | 58.35 | Grain for fodder, cork production | |
| G3 | 40.7737 N 9.0958 E |
207 | 85.31 | Cork production | |
| G4 | 40.7803 N 9.1143 E |
226 | 65.19 | Cork production | |
| G5 | 40.7883 N 9.1831 E |
259 | 60.37 | Grazing, cork production | |
| G6 | 40.7927 N 9.2294 E |
330 | 46.68 | Grain for fodder, cork production | |
| Morocco | M1 | 34.2072 N 6.5657 W |
94 | 40.66 | No cork extraction, no grazing |
| M2 | 34.1841 N 6.6175 W |
63 | 24.31 | No cork extraction, no grazing | |
| M3 | 34.0286 N 6.5538 W |
168 | 50.70 | Cork production | |
| M4 | 34.0475 N 6.6008 W |
149 | 34.86 | Cork production | |
| M5 | 34.0862 N 6.6321 W |
117 | 51.21 | Cork production, grazing | |
| M6 | 34.1304 N 6.5917 W |
102 | 38.35 | Cork production, grazing |
At each site, we buried eight pitfall traps (polypropylene cups, 7 × 11.8 cm, diameter × depth) partially filled with a solution of water and monopropylene glycol (5/1, v/v), and spaced approximately 10-15 m from each other along a linear transect. Ground-dwelling ants were collected from 96 pitfall traps (2 cork oak districts × 6 transects × 8 traps = 96 traps). Pitfall-traps were checked and emptied once a month from April to October 2010, in order to take into account the different levels of catchability of the ant species throughout the cork oak vegetation season. The traps were operated for one week each month. At the end of each sampling week, all traps were replaced with identical traps with tight-fitting lids. In the following month, the covers were removed and the traps were reactivated. The “digging-in effect” and the disturbance of the surface around the traps were thus strongly reduced.
Specimens were collected and preserved in 70% ethanol, then taken to the laboratory for identification to the lowest taxonomic level possible. When necessary, specimens were compared with ant material deposited in the following institutions: Museo Civico di Storia Naturale, Genova (MCSN); Dipartimento di Valorizzazione e Protezione delle Risorse Agroforestali - Entomologia e Zoologia applicate all’ambiente “Carlo Vidano”, Torino (Italy) (DiVaPRA); Dipartimento di Scienze e Tecnologie Agroambientali - Istituto di Entomologia “G. Grandi”, Bologna (Italy) (DiSTA); Naturhistorisches Museum, Basel (Switzerland) (NMB); Dipartimento di Biologia Animale ed Ecologia dell’Università, Cagliari (Italy) (DiBAE); Dipartimento di Agraria dell’Università, Sezione di Patologia Vegetale ed Entomologia, Sassari (SPaVE). Only the worker caste was considered in the analysis of counts and the nomenclature was based on AntWiki ([6]).
The comparison between the ant assemblages of the two districts was based on a species and functional group approach. Ants were sorted into morphospecies and all specimens were assigned to different functional groups: Subordinate Camponotini (SC), Hot-climate Specialists (HC), Cold-climate Specialists (CC), Cryptic Species (Cr), Opportunists (Op), and Generalized Myrmicinae (GM - [2]). Although this classification still suffers from problems of interpretation, it has also gained acceptance in the Mediterranean region ([33], [40], [8]).
Statistical analyses
Ant species richness (S) was measured as the observed number of species per district, site and trap. Species richness at different scales was analysed by a two-tailed t-test to examine significant differences between the two districts using Statgraphics Plus® ver. 5.1 ([45]). The Chao-2 non-parametric estimator ([23]) of asymptotic richness was estimated for each district, and species accumulation curves (999 permutations) were generated to evaluate the adequacy of the sampling using EstimateS ver. 9.1.0 ([23]).
The counts of workers from each single trap retrieved each month were reduced to the presence/absence to down-weigh the contributions of quantitatively dominant species and to avoid the effects of mass catches due to any traps that might have been accidentally placed close to nest entrances or foraging trails. In order to exclude capture variations due to the seasons, all incidence data were pooled over the sampling period. Statistical analyses were therefore based on the frequency of each species, i.e., the number of pitfall traps per site where each species was collected throughout the entire survey.
Non-metric multidimensional scaling (NMDS), based on Bray-Curtis dissimilarity measures, was used to examine the variation in the ant community composition between the two districts.
The non-parametric analysis of similarities (ANOSIM) was performed in order to test for any differences in ant assemblages among sites, within and between districts. The species/functional groups contributing the most to dissimilarities among sites and districts were identified using the similarity percentage (SIMPER) routine ([50]). Multivariate analyses were run using the Primer ver. 6 package ([22]). For each forest district, Bray-Curtis indices of dissimilarity (dBC) were also computed using the occurrence-based matching components. Dissimilarities were portioned into the balanced variation component (dBC-bal) and gradient component (dBC-gra), representing the degree of substitution by a species from site to site (i.e., turnover), and species nestedness in incidence-based patterns, respectively ([9]).
Analyses were performed following Baselga ([9]) using the “betapart” package ([10]) in R ([41]). Finally, beta diversity was estimated by computing the average dissimilarities, separately for Bray-Curtis dissimilarities and its components, in ant assemblages among all pairs from sites of each cork oak district ([5]).
Results
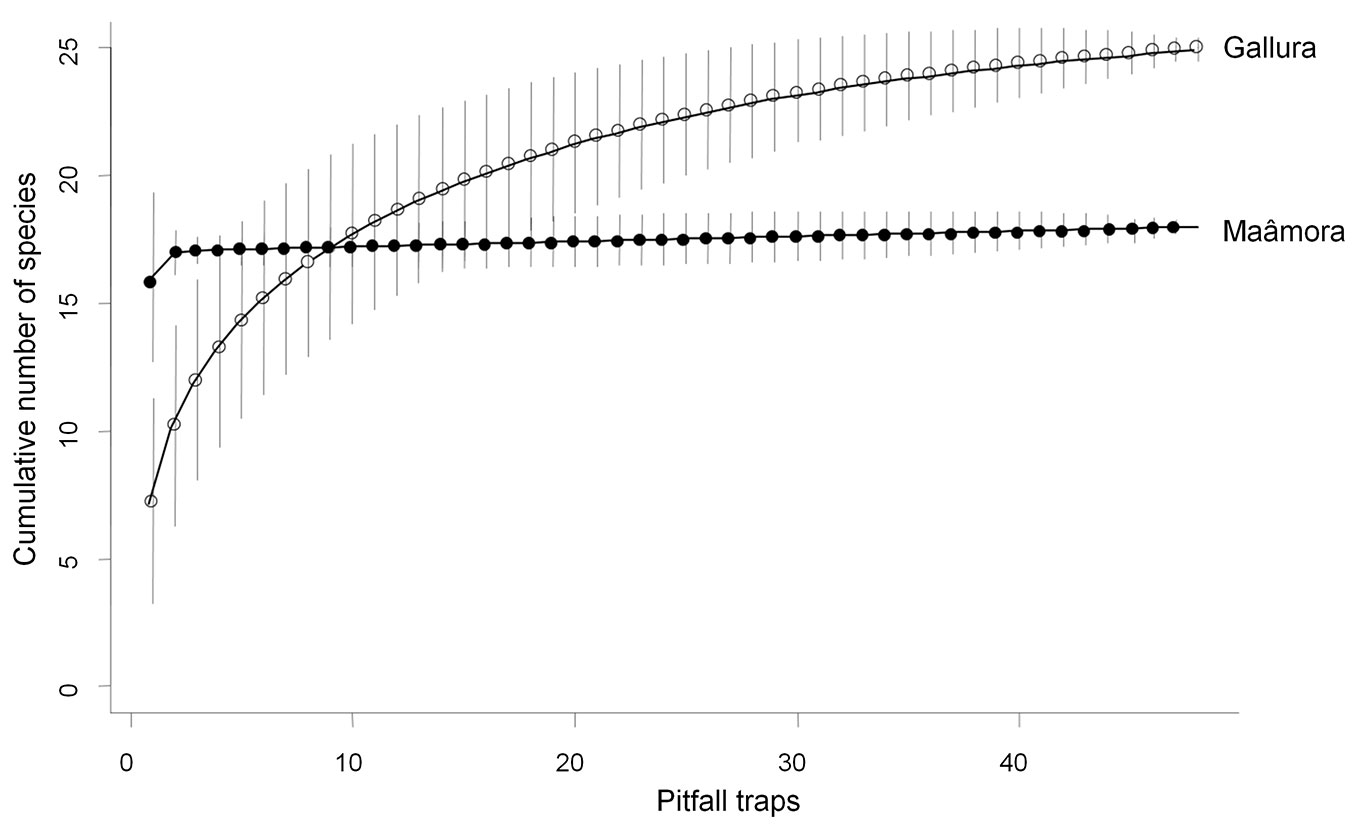
The pitfall traps caught a total of 13.501 ant workers. Throughout the entire survey, 25 and 18 species were recorded in Gallura and Maâmora forests, respectively. The 38 species recorded in this study were assigned to six functional groups (Tab. 2). The sample-based rarefaction curves were close to their plateau, thus indicating an adequate sampling in terms of estimating the number of ant species (Fig. 1). The Chao-2 estimators showed that the species richness at the district scale was higher in Gallura (mean ± SD: 26.12 ± 1.77) than in Maâmora (mean ± SD: 18.00 ± 0.04). In addition, the richness was slightly underestimated for Gallura, probably as a consequence of a higher number of singletons and doubletons. In contrast, species richness per pitfall trap was over two times higher in Maâmora than in Gallura (16.02 ± 1.68 vs. 7.25 ± 2.03; t = 16.81, df = 47, p < 0.01). Significant differences were also found at the site scale with a higher species richness in Maâmora (17.17 ± 0.41 vs. 14.5 ± 2.07; t = 3.11, df = 5, p = 0.03).
Tab. 2 - List of ants collected, functional group (FG) assigned, number of workers and species richness at the site scale for Gallura (G1-G6 sites) and Maâmora (M1-M6 sites). Ant functional groups: Subordinate Camponotini (SC), Hot-climate Specialists (HC), Cold-climate Specialists (CC), Cryptic Species (Cr), Opportunists (Op) and Generalized Myrmicinae (GM). Following Gómez et al. ([33]), A. subterranea was put in the Cryptic Species group.
| Species | FG | Gallura | Maâmora | ||||||||||
|---|---|---|---|---|---|---|---|---|---|---|---|---|---|
| G1 | G2 | G3 | G4 | G5 | G6 | M1 | M2 | M3 | M4 | M5 | M6 | ||
| Aphaenogaster senilis Mayr, 1853 | Op | 0 | 0 | 0 | 0 | 0 | 0 | 62 | 31 | 148 | 137 | 117 | 154 |
| Aphaenogaster spinosa Emery, 1878 | Op | 66 | 205 | 205 | 79 | 351 | 691 | 0 | 0 | 0 | 0 | 0 | 0 |
| Aphaenogaster subterranea (Latreille, 1798) | Cr | 4 | 7 | 157 | 213 | 0 | 3 | 0 | 0 | 0 | 0 | 0 | 0 |
| Aphaenogaster theryi Santschi, 1923 | Op | 0 | 0 | 0 | 0 | 0 | 0 | 89 | 77 | 98 | 65 | 93 | 75 |
| Camponotus aethiops (Latreille, 1798) | SC | 21 | 14 | 16 | 5 | 28 | 12 | 0 | 0 | 0 | 0 | 0 | 0 |
| Camponotus gestroi Emery, 1878 | SC | 2 | 0 | 0 | 0 | 1 | 0 | 0 | 0 | 0 | 0 | 0 | 0 |
| Camponotus lateralis (Olivier, 1792) | SC | 1 | 6 | 5 | 7 | 1 | 7 | 85 | 41 | 125 | 70 | 80 | 67 |
| Camponotus piceus (Leach, 1825) | SC | 0 | 1 | 0 | 1 | 0 | 0 | 0 | 0 | 0 | 0 | 0 | 0 |
| Camponotus serotinus Cagniant, 1996 | SC | 0 | 0 | 0 | 0 | 0 | 0 | 52 | 52 | 96 | 84 | 97 | 80 |
| Cataglyphis viatica (Fabricius, 1787) | HC | 0 | 0 | 0 | 0 | 0 | 0 | 94 | 77 | 87 | 75 | 74 | 128 |
| Colobopsis truncata (Spinola, 1808) | SC | 4 | 0 | 0 | 0 | 1 | 0 | 81 | 35 | 101 | 44 | 84 | 84 |
| Crematogaster auberti Emery, 1869 | GM | 0 | 0 | 0 | 0 | 0 | 0 | 126 | 97 | 130 | 62 | 124 | 144 |
| Crematogaster scutellaris (Olivier, 1792) | GM | 129 | 34 | 143 | 56 | 47 | 126 | 99 | 37 | 129 | 91 | 86 | 133 |
| Hypoponera eduardi (Forel, 1894) | Cr | 0 | 35 | 0 | 0 | 0 | 1 | 0 | 0 | 0 | 0 | 0 | 0 |
| Lasius lasioides (Emery, 1869) | CC | 2 | 0 | 0 | 0 | 0 | 0 | 0 | 0 | 0 | 0 | 0 | 0 |
| Lasius niger (Linnaeus, 1758) | CC | 0 | 5 | 0 | 0 | 20 | 0 | 0 | 0 | 0 | 0 | 0 | 0 |
| Lasius paralienus Seifert, 1992 | CC | 0 | 17 | 0 | 5 | 6 | 0 | 0 | 0 | 0 | 0 | 0 | 0 |
| Messor capitatus (Latreille, 1798) | HC | 0 | 0 | 1 | 0 | 0 | 0 | 0 | 0 | 0 | 0 | 0 | 0 |
| Messor marocanus Santschi, 1927 | HC | 0 | 0 | 0 | 0 | 0 | 0 | 82 | 60 | 118 | 82 | 73 | 71 |
| Messor minor (André, 1883) | HC | 0 | 5 | 5 | 0 | 466 | 0 | 0 | 0 | 0 | 0 | 0 | 0 |
| Messor wasmanni Krausse, 1910 | HC | 3 | 1 | 0 | 0 | 20 | 573 | 0 | 0 | 0 | 0 | 0 | 0 |
| Monomorium subopacum (Smith, Frederick, 1858) | GM | 0 | 0 | 0 | 0 | 0 | 0 | 58 | 59 | 77 | 72 | 100 | 77 |
| Oxyopomyrmex saulcyi Emery, 1889 | HC | 0 | 0 | 0 | 0 | 0 | 0 | 73 | 45 | 117 | 66 | 48 | 80 |
| Pheidole pallidula (Nylander, 1849) | GM | 0 | 0 | 0 | 0 | 33 | 0 | 74 | 57 | 81 | 69 | 80 | 51 |
| Plagiolepis pygmaea (Latreille, 1798) | Cr | 6 | 10 | 13 | 5 | 22 | 30 | 0 | 0 | 0 | 0 | 0 | 0 |
| Plagiolepis schmitzii Forel, 1895 | Cr | 0 | 0 | 0 | 0 | 0 | 0 | 74 | 45 | 75 | 65 | 68 | 63 |
| Plagiolepis sp. Mayr, 1861 | Cr | 1 | 0 | 0 | 0 | 0 | 0 | 0 | 0 | 0 | 0 | 0 | 0 |
| Ponera coarctata (Latreille, 1802) | Cr | 2 | 0 | 0 | 1 | 0 | 1 | 0 | 0 | 0 | 0 | 0 | 0 |
| Solenopsis fugax (Latreille, 1798) | Cr | 72 | 42 | 55 | 24 | 15 | 42 | 0 | 0 | 0 | 0 | 0 | 0 |
| Stenamma striatulum Emery, 1895 | CC | 0 | 0 | 0 | 2 | 0 | 0 | 0 | 0 | 0 | 0 | 0 | 0 |
| Tapinoma simrothi Krausse, 1911 | Op | 84 | 9 | 0 | 1 | 174 | 10 | 77 | 58 | 107 | 150 | 106 | 65 |
| Temnothorax mediterraneus (Ward et al. 2015) | CC | 0 | 8 | 0 | 0 | 0 | 2 | 0 | 0 | 0 | 0 | 0 | 0 |
| Temnothorax marocana (Santschi, 1909) | CC | 0 | 0 | 0 | 0 | 0 | 0 | 93 | 32 | 97 | 82 | 70 | 70 |
| Temnothorax mimeuri (Cagniant, 1997) | CC | 0 | 0 | 0 | 0 | 0 | 0 | 71 | 42 | 57 | 60 | 52 | 57 |
| Temnothorax specularis (Emery, 1916) | CC | 6 | 1 | 5 | 2 | 0 | 2 | 0 | 0 | 0 | 0 | 0 | 0 |
| Temnothorax sp. Mayr, 1861 | CC | 0 | 0 | 0 | 0 | 0 | 0 | 0 | 1 | 0 | 0 | 0 | 0 |
| Tetramorium brevicorne Bondroit, 1918 | Op | 165 | 82 | 35 | 1 | 210 | 154 | 0 | 0 | 0 | 0 | 0 | 0 |
| Tetramorium forte Forel, 1904 | Op | 0 | 0 | 0 | 0 | 0 | 0 | 86 | 84 | 145 | 64 | 96 | 81 |
| Species richness (S) | - | 16 | 17 | 11 | 14 | 15 | 14 | 17 | 18 | 17 | 17 | 17 | 17 |
Fig. 1 - Ant species accumulation curves (bars: 95% confidence interval) in cork oak woodlands in Italy (Gallura) and Morocco (Maâmora).
Five species were shared between Gallura and Maâmora (C. lateralis, C. truncatus, C. scutellaris, P. pallidula, and T. simrothi), contributing to 27.4% of the total number of occurrences. Summarizing the occurrences in the two districts, the most frequent species were C. scutellaris (7.9%), T. simrothi (5.8%), C. lateralis (5.5%), A. senilis (4.2%), A. theryi (4.2%), C. truncatus (4.2%), C. auberti (4.2%), and A. spinosa (4.1%), thus representing about 40% of the total number.
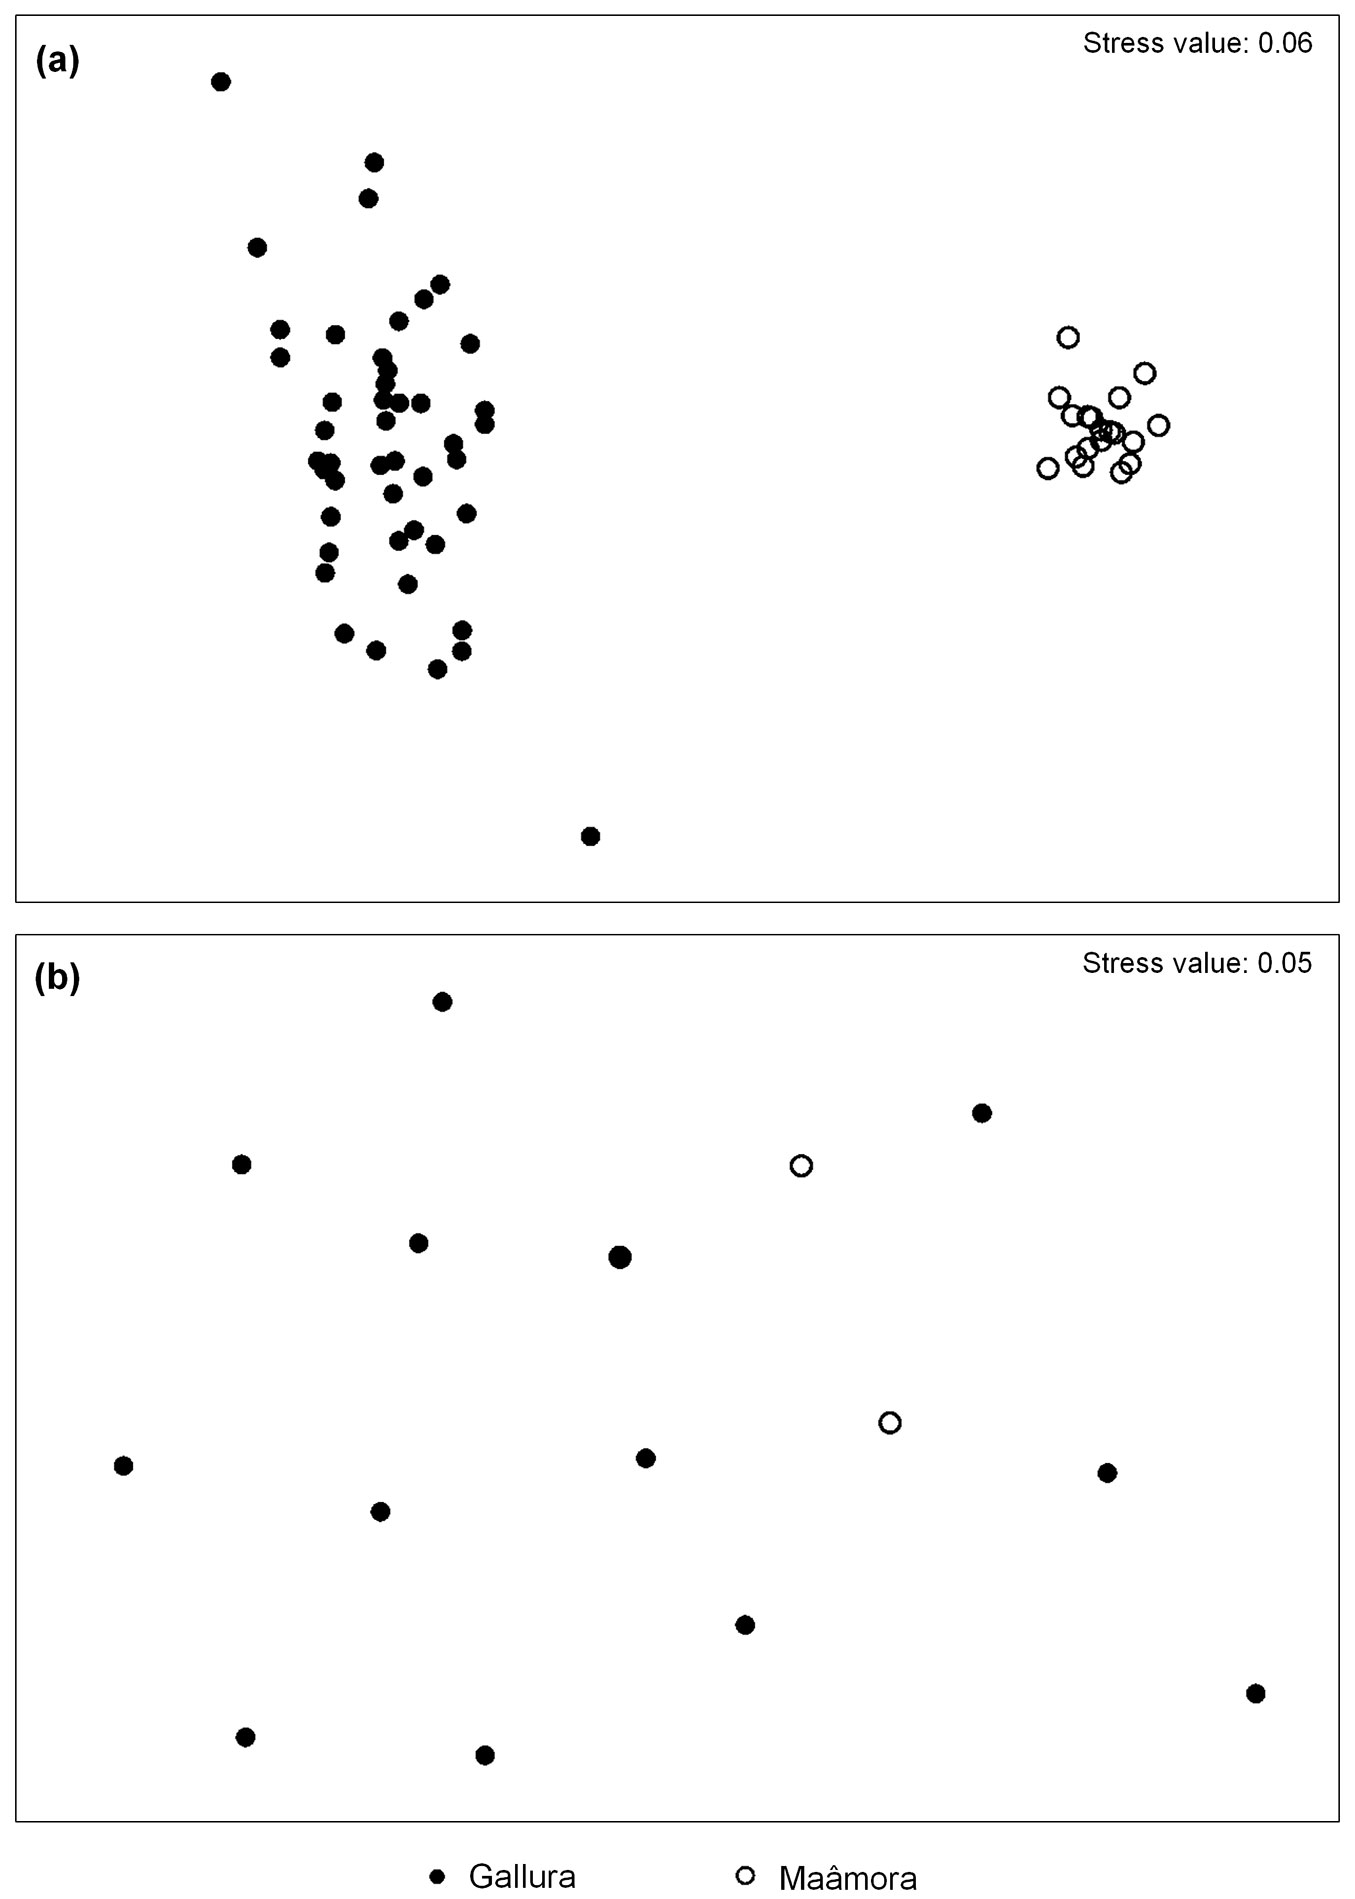
As a consequence, a distinct and reliable separation in the NMDS plots between assemblages in Gallura and Maâmora was clearly visible at the species level. In addition, a good ordination was also obtained at the functional group level, as shown by the low stress value obtained (Fig. 2). However, groupings of site data were not distinguishable within the Maâmora district, where samples overlapped. One-way ANOSIM was performed separately in order to test for differences in ant assemblages between and within each district, thus providing an indirect estimation of beta diversity. The analysis confirmed the differences between the districts in catch composition (based on species and functional groups) showed by the ordination plot. Based on species, ant assemblages differed widely (district as factor: R = 0.99, p < 0.001; site as factor: R = 0.58, p < 0.001). However, ant assemblages did not vary within Maâmora (R = 0.01, p < 0.03), whereas differences were detected among the sites in Gallura (R = 0.27, p < 0.001). These differences were also detected with functional groups (district as factor: R = 0.32, p < 0.001; site as factor: R = 0.20, p < 0.001). Ant functional groups did not differ among sites either in Gallura (R = 0.03, p < 0.03) or in Maâmora (R = 0.01, p < 0.20).
Fig. 2 - Non-Metrical Multidimensional Scaling of samples based on ant occurrence at (a) species and (b) functional group levels. Each circle represents the assemblage of ants caught in a given trap throughout the entire monitoring season.
A SIMPER test, performed by comparing all pairs of sites and using the trap as the spatial scale, identified four taxa as typifying species of the Gallura district. A. spinosa, C. scutellaris (both species generally linked to arboreal habitats and open woodlands with a more complex structure), T. brevicorne, C. aethiops and Solenopsis fugax gave a cumulative contribution of 77.5% to the average Bray-Curtis similarity (58.2), i.e., the measure of variation in ant assemblages within the district. A similar result was obtained using the site as the spatial scale, however, the relative contribution of A. spinosa to the average similarity decreased from 22.2% (trap as spatial scale) to 17.9%. In Maâmora, the Bray-Curtis similarity was high (over 90%) and no group of typifying species was clearly identified (thirteen species contributed to 78.4% of the total similarity in the Maâmora district). Nevertheless, C. auberti, A. senilis, A. theryi, and C. scutellaris (species linked to open woodlands and grasslands) were the species that contributed most to the average similarity at the trap scale. The same pattern was observed at the site scale.
In terms of functional groups and traps, Opportunists were well represented in Gallura (about 27% average Bray-Curtis similarity) as well as Cryptic Species (over 23%). In Maâmora forest, Generalized Myrmicinae, Hot Climate Specialists, Opportunists and Subordinate Camponotini contributed equally to the average similarity (together about 70%), and the relative contribution of Cold Climate Specialists and Cryptic Species was very low. At the site scale, the relative importance of Opportunists decreased in Gallura, whereas no differences were detected for Maâmora in terms of the different scales.
Tab. 3 lists the percentage contribution of each district to the overall Bray-Curtis dissimilarity in terms of traps and sites (a measure of the differences among ant assemblages). The average dissimilarity at both spatial scales was low, and the assemblages of the two cork oak districts diverged above all in terms of the contribution of Hot-climate Specialists and Cold-climate Specialists. Tab. 4 reports the partition of beta diversity into the two separate components of spatial turnover and nestedness. In Gallura the turnover (dBC-bal) was higher than in Maâmora. However, using functional groups, the turnover decreased from fine to coarse spatial scales. Conversely, in Maâmora, beta diversity at the trap scale was primarily due to the dBC-gra component (i.e., nestedness) considering species and functional groups, whereas at the site scale, nestedness increased dramatically from species to functional groups.
Tab. 3 - SIMPER test based on functional groups (see Tab. 2 for group acronyms). Comparison and percentage contribution to average Bray-Curtis dissimilarity between districts at different spatial scales. (SD): standard deviation.
| Spatial scale |
Functional groups |
Average dissimilarity |
Dissimilarity (SD) |
Contribution (%) |
Cumulative (%) |
|---|---|---|---|---|---|
| Trap | HC | 6.56 | 1.40 | 40.26 | 40.26 |
| CC | 5.06 | 0.99 | 31.02 | 71.28 | |
| SC | 1.37 | 0.38 | 8.43 | 79.71 | |
| GM | 1.37 | 0.38 | 8.43 | 88.14 | |
| Cr | 1.70 | 0.42 | 10.42 | 98.56 | |
| Op | 0.24 | 0.15 | 1.45 | 100.00 | |
| Site | HC | 6.45 | 3.18 | 44.27 | 44.27 |
| CC | 4.46 | 2.30 | 30.59 | 74.87 | |
| SC | 1.23 | 1.19 | 8.46 | 83.33 | |
| GM | 1.21 | 0.86 | 8.29 | 91.60 | |
| Cr | 1.01 | 1.19 | 6.95 | 98.57 | |
| Op | 0.21 | 0.44 | 1.43 | 100.00 |
Tab. 4 - Values of beta diversity and its separated components estimated as average Bray-Curtis dissimilarities (dBC), balanced variation in species/functional group occurrence (dBC-bal) and species/functional group gradient (dBC-gra), respectively. For each component, the relative contribution to the average Bray-Curtis dissimilarities (percentage of dBC) is also reported in brackets.
| Grouping | Beta diversity | Gallura | Maâmora | ||
|---|---|---|---|---|---|
| Trap | Site | Trap | Site | ||
| Species | dBC | 0.418 | 0.292 | 0.066 | 0.045 |
| dBC-bal | 0.304 (72.78) | 0.227 (77.64) | 0.014 (21.54) | 0.022 (48.63) | |
| dBC-gra | 0.114 (27.22) | 0.065 (22.36) | 0.052 (78.46) | 0.023 (51.37) | |
| Functional groups | dBC | 0.187 | 0.101 | 0.026 | 0.018 |
| dBC-bal | 0.092 (49.17) | 0.060 (59.79) | 0.000 (0) | 0.001 (8.11) | |
| dBC-gra | 0.095 (50.83) | 0.041 (40.21) | 0.026 (100.0) | 0.016 (91.89) | |
Discussion
The cork oak woodlands of Gallura and Maâmora could be considered as similar agro-forestry systems in terms of characteristics, land uses and management. They are both located in the Mediterranean region and are predominantly used for cork production and livestock grazing. However, both their historical land use and the intensity of exploitation are very different. In Gallura, the cork oak forest is comprised of uneven aged trees and the grass under the forest is still occasionally grazed. The cork is harvested manually every 10-11 years and strict rules regulate its exploitation. Despite an appreciable improvement in management practices, the Maâmora forest has deteriorated greatly and the integral conservation of some areas has recently been established in order to promote natural regeneration. The most recent project (Projet de rehabilitation de la Maâmora, 2005-2014) was funded with approximately 25 million euros. A new management plan for the next decade (2015-2024) is being established. However, apart from the cork harvest, the other forest resources (i.e., wood, charcoal, tannin, aromatic and medicinal plants, and acorn harvesting) are still being exploited inappropriately ([30]).
The comparison of the ant community composition between the two districts provided new insights into the sensitivity of ants as bioindicators. The species richness observed in the Gallura district was comparable to those found in other Mediterranean oak woodlands ([33], [20], [44]). Similarly, the species richness detected in Maâmora forest was very close to the results of a previous study based on a different sampling method ([11]). Lower values of species richness were measured for the Gallura district at both trap and site scales. The mean species richness was significantly higher in Maâmora than in Gallura at both the trap and site scales. However, the overall species richness was higher in Gallura than in Maâmora. We attribute these scale-dependent differences to the higher environmental heterogeneity in Gallura, which positively influenced beta diversity.
As expected, the ant fauna from the cork oak woodlands of Morocco and Italy showed very notable differences at the species level. Considering exclusively the five species shared between the two districts, no differences were detected for C. scutellaris, the main arboreal species which is noxious to cork oak ([49], [48]). In contrast, P. pallidula, which is characterized by an efficient mass recruitment system ([21]), and T. simrothi, a species very common in various agroecosystems ([12], [21], [47], [37]), had a higher frequency in Maâmora than in Gallura. In addition, C. truncatus, an arboreal species associated with deadwood in cork oak woodlands ([49]), was common in Maâmora and contributed greatly to the Bray-Curtis average dissimilarity between districts. A. spinosa, collected in Gallura, and A. senilis, collected in Maâmora, but also common in the south of Sardinia ([47]), are ecologically close ruderal species which significantly contributed to the differences in assemblage composition between the two districts. At all Maâmora sites, C. viatica and Monomorium subopacum were captured by all the traps used during the survey. These are very common species in the endemic Moroccan Argan forest ([28]), as well as in the urban areas of Rabat, Kenitra and Fès, and in the most degraded areas of Maâmora ([11]).
Two functional groups, Opportunists and Hot Climate Specialists, which were very common in Gallura and Maâmora, respectively, appeared to control the structure and dynamics of open cork oak woodland ant assemblages through their aggressive behavior and monopolization of resources under thermal stress ([21]). The relative contribution of Hot Climate Specialists in Maâmora might be related to the dry conditions of the habitat ([8]). In contrast, when the presence of these groups was reduced (e.g., by decreased insolation at ground level in the woodlands of Gallura, where a higher canopy cover was measured), Cryptic Species increased their relative frequency. This thermal effect might have been particularly intense and amplified in Maâmora, where the canopy cover is low and the soil is mainly sandy and has a very low organic matter content ([1]). According to the literature, Hot-Climate Specialists are also abundant in Maâmora, as a likely result of the combination of soil type and vegetation cover, which constitute the main determining factors of ant assemblages ([15], [42]). Although we were not able to identify the drivers of spatial variation in the community composition in depth, the lack of significant differences in ant assemblages within the Maâmora district could be related to environmental and management factors.
In order to clarify this point, the Bray-Curtis index of dissimilarity was partitioned into the two separate components of spatial turnover and nestedness. In Gallura, dissimilarities were principally caused by the relative contribution of turnover, whereas the component with the highest contribution to general dissimilarity in Maâmora was nestedness. In Maâmora, the low values of dissimilarity among sites and the higher contribution of nestedness in the Bray-Curtis dissimilarities could be the consequence of a higher environmental homogeneity. Although the complexity and heterogeneity of the cork oak woodlands could have affected the efficiency of pitfall traps and the catchability of the different species ([38]), significant differences in the composition of ant assemblages were detected within the Gallura district at the species level.
The same trend was not observed in Maâmora where the low dissimilarity in ant composition among sites might be related to the general environmental homogeneity of the forest ([39]). This highlights the importance of maintaining the diversity in cork oak woodlands and mitigating the large-scale impacts of forest overexploitation. Sustainable ecosystems should be a major conservation objective, especially for fragmented landscapes with multiple land-uses. In terms of sustainable forest management, moderate stocking rates, the establishment of temporary grazing-excluded areas and/or of nature reserves could promote plant and animal biodiversity. A longer-term cycle of cork extraction would facilitate the protection of the trees in the most exploited areas. In addition, cork harvesting should be avoided in areas where heavy defoliation, above all by lepidopteran pests, periodically occurs.
In this scenario, a well-managed cork oak system could have strategic importance, not only in terms of soil conservation and the wide array of environmental services it provides, but also for its crucial role in preserving biodiversity ([26]). In fact, in the Gallura cork oak district, livestock breeding, agriculture and forestry coexist, despite the highly fragmented land ownership and the different management practises of the owners.
Conclusions
Our results highlighted the potential value of ants as bioindicators and their sensitivity to environmental changes in cork oak woodlands. The sampling method we employed enabled to collect mainly ground-dwelling and epigeic species. Despite this limitation, pitfall traps also allowed to collect several species associated with the canopy layer, which showed how abundant they are in cork oak woodlands. However, it is possible that other sampling methods and/or multilayer sampling aimed at exploring different microhabitats would better describe the ant assemblages of open woodlands. The results reported by Hoffmann ([35]) show that disturbance factors might have a secondary impact on ant assemblages, inducing changes restricted to species composition, but not necessarily affecting overall species richness or abundance.
Our results support the idea that the understanding of beta diversity and its underlying processes at multiple scales is therefore necessary, above all, for the management and conservation of biodiversity in cork oak woodlands. Functional groups showed a lower sensitivity than species in detecting differences between ant assemblages in Gallura and Maâmora. In addition, our results show that more detailed analyses of ant community dynamics are needed in order to improve the predictive power of the functional group approach. Accordingly, an in-depth understanding of the mechanism modelling the ant assemblages in response to different levels of exploitation is very important. In the Maâmora forest, where the widespread human impact has been well documented, the long-term monitoring of ants might be very useful in evaluating the effectiveness of the natural forest recovery measures that have been applied in recent years. Agroforestry management systems have been proven to be good predictors of cork oak mortality ([24]). A detailed knowledge of responses of the ant community to human disturbance could improve the accuracy of predictive models aimed at understanding environmental issues, such as the Mediterranean cork oak decline, which have principally been caused by severe exploitation.
Acknowledgements
This research was funded by the Italian National Research Council and the CNRST (Agreement on Scientific and Technological Cooperation between the National Research Council of Italy and the Centre National pour la Recherche Scientifique et Technique of Morocco 2010-2011), and partially supported by the Autonomous Region of Sardinia (L.R. n. 7/2007, budget 2010-CRP 24480, budget 2013-CRP 7727).
References
CrossRef | Gscholar
Gscholar
Gscholar
Gscholar
Gscholar
Gscholar
CrossRef | Gscholar
Gscholar
Gscholar
Gscholar
CrossRef | Gscholar
Gscholar
Gscholar
Gscholar
Gscholar
Gscholar
Gscholar
Gscholar
Authors’ Info
Authors’ Affiliation
Carlo Simone Cossu
Oriana Pilia
Roberto Mannu
Istituto per lo Studio degli Ecosistemi, CNR, Traversa La Crucca 3, 07100 Sassari (Italy)
Division de l’Enseignement Supérieur et de la la Recherche et du Développement, Direction de l’Enseignement, de la Formation et de la Recherche, Station D’bagh - Avenue Hassan II, B.P. 607 Rabat (Morocco)
Corresponding author
Paper Info
Citation
Verdinelli M, Yakhlef SEB, Cossu CS, Pilia O, Mannu R (2017). Variability of ant community composition in cork oak woodlands across the Mediterranean region: implications for forest management. iForest 10: 707-714. - doi: 10.3832/ifor2321-010
Academic Editor
Massimo Faccoli
Paper history
Received: Dec 19, 2016
Accepted: May 12, 2017
First online: Jul 27, 2017
Publication Date: Aug 31, 2017
Publication Time: 2.53 months
Copyright Information
© SISEF - The Italian Society of Silviculture and Forest Ecology 2017
Open Access
This article is distributed under the terms of the Creative Commons Attribution-Non Commercial 4.0 International (https://creativecommons.org/licenses/by-nc/4.0/), which permits unrestricted use, distribution, and reproduction in any medium, provided you give appropriate credit to the original author(s) and the source, provide a link to the Creative Commons license, and indicate if changes were made.

Web Metrics
Breakdown by View Type
Article Usage
Total Article Views: 51842
(from publication date up to now)
Breakdown by View Type
HTML Page Views: 41669
Abstract Page Views: 4667
PDF Downloads: 4142
Citation/Reference Downloads: 21
XML Downloads: 1343
Web Metrics
Days since publication: 3257
Overall contacts: 51842
Avg. contacts per week: 111.42
Article Citations
Article citations are based on data periodically collected from the Clarivate Web of Science web site
(last update: Mar 2025)
Total number of cites (since 2017): 16
Average cites per year: 1.78
Publication Metrics
by Dimensions ©
Articles citing this article
List of the papers citing this article based on CrossRef Cited-by.
Related Contents
iForest Similar Articles
Research Articles
Indicators for the assessment and certification of cork oak management sustainability in Italy
vol. 11, pp. 668-674 (online: 04 October 2018)
Research Articles
Red wood ants shape epiphytic lichen assemblages in montane silver fir forests
vol. 15, pp. 71-76 (online: 22 February 2022)
Research Articles
Towards the economic valuation of ecosystem production from cork oak forests in Sardinia (Italy)
vol. 11, pp. 660-667 (online: 04 October 2018)
Research Articles
Feasibility study of near infrared spectroscopy to detect yellow stain on cork granulate
vol. 11, pp. 111-117 (online: 31 January 2018)
Research Articles
Impact of management practices on habitat use by birds in exotic tree plantations in northeastern Argentina
vol. 19, pp. 38-44 (online: 06 February 2026)
Research Articles
Influence of site conditions and land management on Quercus suber L. population dynamics in the southern Iberian Peninsula
vol. 15, pp. 77-84 (online: 14 March 2022)
Research Articles
Effects of forest management on bird assemblages in the Bialowieza Forest, Poland
vol. 8, pp. 377-385 (online: 02 October 2014)
Research Articles
Carbon storage in degraded cork oak (Quercus suber) forests on flat lowlands in Morocco
vol. 9, pp. 125-137 (online: 08 August 2015)
Review Papers
Problems and solutions to cork oak (Quercus suber L.) regeneration: a review
vol. 16, pp. 10-22 (online: 09 January 2023)
Research Articles
The impact of seed predation and browsing on natural sessile oak regeneration under different light conditions in an over-aged coppice stand
vol. 9, pp. 569-576 (online: 04 April 2016)
iForest Database Search
Search By Author
Search By Keyword
Google Scholar Search
Citing Articles
Search By Author
Search By Keywords
PubMed Search
Search By Author
Search By Keyword


