Effect of forwarder multipassing on forest soil parameters changes
iForest - Biogeosciences and Forestry, Volume 15, Issue 6, Pages 476-483 (2022)
doi: https://doi.org/10.3832/ifor4138-015
Published: Nov 24, 2022 - Copyright © 2022 SISEF
Research Articles
Abstract
In the lowland part of Croatia, heavy machinery such as forwarders is mainly used for the purpose of extracting wood from even-aged forest stands. According to the forest management plan, forwarders are used intensively in the winter period when the soil is mostly saturated with water and when their activity can cause significant damage to the soil. The aim of this study was to determine changes in soil characteristics as a consequence of the repeated passage of a loaded 8-wheel forwarder on silty clay loam type of soil. The research was conducted in an area where the forwarder usually works and in a way that did not significantly disrupt his normal workflow. The results indicate that during the study period the soil had a good bearing capacity and that the observed changes in soil characteristics (bulk density, total soil porosity, soil moisture, particle density, soil water retention capacity etc.) occurred as a result of breaking structural soil aggregates after soil compaction by multiple passes. Characteristic points (T) of equalized penetration curves indicate the compaction of the soil surface layer. Cone penetration index (CI) values did not show a proportional increase as the number of forwarder passes increased, although significant differences in their values with respect to the number of passes were found. Shear strength (τ) did not significantly increase with increasing the number of passes, but a statistically significant difference in the measured values was detected at the soil surface, which was not observed at a depth of 15 cm. Exceeding the rut depth limit of 10 cm occurred only after the 20th pass. Our results indicate that the soil at the harvesting site had a good bearing capacity during the study period.
Keywords
Silty Clay Loam, Bulk Density, Cone Index, Shear Strength, Ruts Depth
Introduction
Vehicles used in timber harvesting processes generally have a large mass and can cause significant damage to forest soil whose bearing capacity is often very poor ([36], [47]). This is especially pronounced due to repeated passages, during which the soil is compacted and ruts are formed, while the porosity of the soil decreases and its density increases ([27], [8], [50], [39], [10]). The movement of machines on the ground during wood extraction is mostly influenced by the soil physical properties, such as composition and structure of the soil, bearing capacity, shear strength, soil wetness, and certain chemical properties ([48]). Soil bearing capacity is defined as the strength of the soil or as the connection of soil particles. If the load on the ground is less than its load-bearing capacity, only elastic deformations will occur, while in the case of higher load in relation to the bearing capacity, plastic deformations and formation of the ruts will take place ([51]). The decisive factor is the time (period) when wood extraction is done, because due to changes in weather conditions, sometimes large occasional changes in soil bearing capacity can be expected, especially in sensitive areas. The bearing capacity of coherent soils is directly related to the amount of moisture in the soil. Ignoring this fact while doing forestry operations can lead to huge direct and indirect damage to the soil with equally great economic and environmental consequences ([26], [19], [1]). Direct damage to forest soils is easily noticeable as plastic deformations caused by compaction of soil particles, and in the case of increased humidity, the penetration of the wheels into the depth due to the breakdown of soil layers ([26], [22]). This leads to physical and physiological destruction of the soil by mixing the formed soil horizons and damaging the root system of plants, whereby the absorption of water and nutrients is reduced ([9], [11]). In some cases, compaction and mixing of soil layers have a beneficial effect on nutrient absorption, seed germination, and plant growth ([3], [31]). The number of vehicle passes during wood extraction is one of the most influential factors of soil compaction, where the greatest compaction occurs mainly in the first ten passes, or in the first few passes, depending on the bearing capacity of the soil ([29], [18]). Limiting the number of passages will not prevent damage because 80% of soil compaction occurs during the first passage of the vehicle ([21]). The most common methods of reducing the risk of damage to forest soil and to increase the bearing capacity of the soil in conditions of increased humidity are the use of wood slash reinforcement ([13], [16], [27], [25], [40]), use of wider tires ([34], [12], [17]), reducing the air pressure in the tires ([12], [43], [33]), and the use of semi-tracks on bogie wheels ([43], [17]). Recovery of compacted forest soil is a long-term process and it is not known whether it is completely possible. Recovery time after compaction can be less than 10 years in the surface area ([30]), while others stated that this process can take decades ([15], [32], [46]). The amount of initial compaction, type of soil, forest type and species diversity, climate, microorganisms in soil are the most influencing factors in soil recovery time required.
The cone index (CI) is a common indicator of soil bearing capacity at the soil depth of 15 cm. It is a composite quantity that depends on internal friction and bulk cohesion. An advantage of the cone index is the relative ease of doing field measurement using a cone penetrometer. Also, the cone index has proved useful for predicting the depth of the ruts from a passing vehicle with given load and wheel properties ([41]). In order to be relevant for the evaluation of the risk of soil distortion from field traffic, shear strength (τ) should reflect field conditions ([44]). In general, with increased water content, the cohesion and internal friction angle of soil typically decrease nonlinearly, which is due to the formation of a water film between soil particles with higher water content, thus the internal friction angle and cohesion are reduced ([28]).
Bearing capacity and shear strength are the most important physical characteristics of the soil over which the soil moisture has a significant impact. The granulometric composition and structure of the soil, i.e., the ability of soil particles to bind water molecules, have a significant effect on soil moisture. Due to the higher moisture content in the soil when a loaded wheel passes through, it causes greater soil compaction and the formation of deeper ruts, which results in higher wheel rolling resistance, wheel slip, higher energy consumption, and ultimately lower efficiency. The bearing capacity of coherent soils, to which the soil of the investigated site belongs, greatly increases when the share of soil moisture is low (mainly summer period) or in winter when the water in the soil pores freezes due to low air temperatures.
The aim of this study is to determine the relationship between the soil characteristics (soil density, porosity and moisture, CI, τ, ruts depth) caused by the effect of traffic intensity of a loaded 8-wheel forwarder on silty clay loam type of soil.
Materials and methods
Site description
The research was conducted in compartment 64f (44° 57′ 11.6″ N, 19° 02′ 56.2″ E), Forest Administration Vinkovci, lowland part of Croatia. The research was carried out during the final felling in a stand of pedunculate oak (Quercus robur L.) and common hornbeam (Carpinus betulus L.). The terrain was flat with an altitude between 79-81 m a.s.l. The type of the soil on the site was silty clay loam according to USDA Textural soil classification ([49]) and FAO ([14]) classification. The age of the stand was 140 years, and a total of 203 trees were marked for the final cut comprising to a volume of 1221 m3. Density of the harvesting was 246 m3 ha-1. The DBH (tree diameter at breast height) ranged between 42.5 and 100 cm, and the average height of the trees was over 40 m. Felling and processing were made with a chainsaw and were time-separated from extracting. Extraction of logs was done by 8-wheel forwarder Valmet 860.4. The average weight of the unloaded and loaded forwarder was 18,750 kg and 32,850 kg, respectively (weighted with a large platform scale on the field). Forwarder was equipped with standard tires (600/55 × 26.5) without chains or tracks on bogie wheels. Soil sampling and soil measurements were performed on a separate part of the stand so that the normal course of wood extracting was not disturbed, but the forwarder was only redirected to the part of the stand where sampling was performed.
During the measurement period (March 12-14, 2018), there was no precipitation, and air and soil temperatures at depth of 5 cm were slightly increased as the research was conducted, from 6 to 14 °C and 5 to 12 °C, respectively. This period was unusual for extremely sunny weather all days. The sun’s rays affected the heating and drying of the surface part of the soil (up to 10 cm deep), which was most pronounced in compacted soil in ruts, and in such conditions, it was hardy possible to press the penetrometer cone and vanes from vane tester into the upper surface layer of compacted soil, due to formation of crusts on its surface. Measurements were performed on the ground for each passage and only for the loaded forwarder. Its total mass was known and ranged between 26,860 kg and 36,450 kg, or an average of 32,850 kg.
Measurement of soil characteristics
Soil sampling
In order to determine the soil parameters, samples of undisturbed soil were taken with steel cylinders with a volume of 100 cm3 (height 4.4 cm and diameter 5.5 cm). Soil samples were taken in the ruts after each pass of the forwarder on the surface of the soil (without undecomposed organic material) and at a depth of 30 cm. Samples of undisturbed soil were taken only at the beginning of the research on the soil surface and at a depth of 30 cm due to the fact that there was no precipitation during the research, so changes in soil characteristics were negligible. No soil samples were taken on undisturbed soil between the ruts. Four samples in total were taken after each pass of forwarder at both depths of the ground in both ruts. By laboratory analysis of samples, the following soil parameters were determined: soil moisture, ΘV0; bulk density, ρb; particle density, ρp; total soil porosity, Φ; and soil water retention capacity, ΦVS. These parameters were measured outside the ruts for the purpose of comparison with the same characteristics of disturbed soil. The analysis of samples was performed in the Ecological and Pedological Laboratory of the Faculty of Forestry in Zagreb in accordance with ISO-11272 ([24]) standard.
Cone penetration resistance
Measurements of changes in the physical and mechanical characteristics of the soil were performed in ruts and on undisturbed soil outside and between ruts. Cone penetration resistance shows the dependence of the resistance on the depth of penetration of the cone into the soil and was measured with a digital cone penetrometer Penetrologger® (Royal Eijkelkamp, Giesbeek, Netherlands) to a depth of 80 cm. For the measurement, a steel cone with a base area of 2 cm2 and a top angle of 30° was used, which was manually pressed into the ground at a speed of 2 cm s-1 according to the ASAE standards S313.3 ([4]) and EP542 ([5]). After each passage of the forwarder, fourteen measurements were performed with the penetrometer, eight measurements in ruts, four measurements on undisturbed soil outside the ruts, and two measurements on undisturbed soil between ruts.
Changes in the flow of value of the penetration resistance of the cone depending on the depth of the measurement with the repeated passage of the forwarder on the same tracks show the resulting changes in soil compaction. Based on the cone penetration resistance, the depth in the soil to which the changes occurred can also be observed.
For the purpose of equalizing the data of measured penetration curves, an exponential correlation model was used ([23] - eqn. 1):
where p is the soil cone resistance (MPa), A and B are the parameters to be calculated, z is the penetration depth (cm).
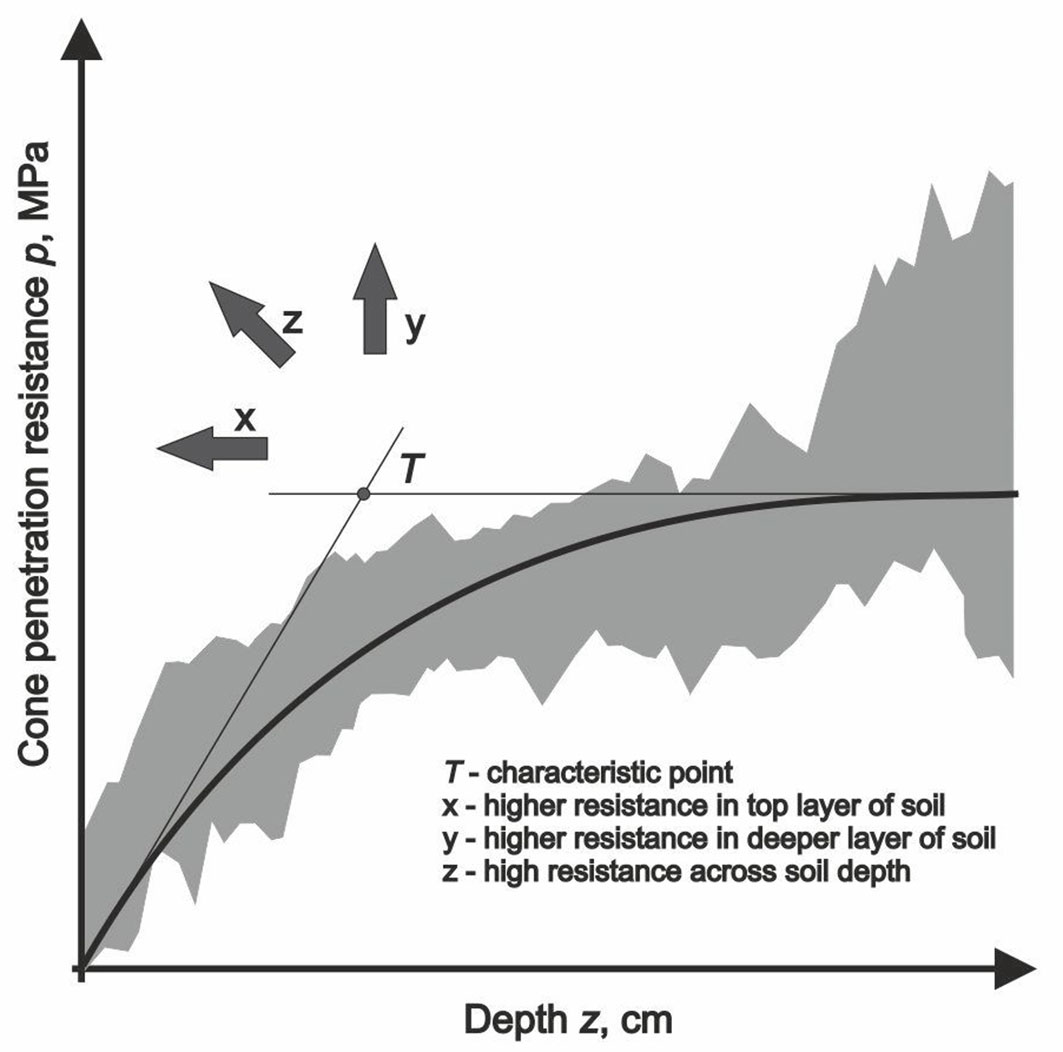
Based on the parameters A and B obtained by this model, the coordinates of the characteristic point T (x, y) defined by the intersection of the horizontal asymptote and the tangent of the curve at the origin of the coordinate system were calculated (Fig. 1). The role of the characteristic point T is the numerical determination and assessment of the bearing capacity of the soil of the entire cone penetrating feature, but also the assessment of soil compaction in the repeated passage of forwarders on the same tracks (eqn. 2, eqn. 3):
The characteristic point T has coordinates (eqn. 4):
Horvat ([23]) showed that the penetration curve can be well described by the above exponential correlation model and stated that the characteristic point T at which the horizontal asymptote and the tangent of the curve intersect at the origin of the coordinate system can be used to numerically determine and assess the penetration characteristics of soil condition.
The shift of the characteristic point T in the y axis upwards represents the compaction of the soil in deeper layers, while its shift in the direction of the x axis towards the origin of the coordinate system represents an increase in the compaction of the surface part of the soil.
Shear strength
The shear strength of the soil was measured with an Eijkelkamp field inspection Vane tester. The dimensions of the probe vane were 20 × 40 mm, and the measuring range varied from 0 to 260 kPa, with a reading accuracy of 2 kPa. The obtained measurement results represent the shear resistance at the moment of its failure. Measurement of shear strength of the soil was performed in the same order as the measurement of soil bearing capacity with a cone penetrometer. In that case, four measurements were made on undisturbed soil on each side of the ruts, eight measurements in the ruts, and two between the ruts. The measurements were performed at two depths in the soil, on the soil surface (soil depth from 0 to 4 cm) and at a depth of 15 cm (depth from 11 to 15 cm).
The purpose of measuring the shear strength on the ground surface is because it has a significant impact on the mobility of the vehicle, that is, on the amount of slippage of the drive wheels, while the shear strength in the subsoil at a depth of 15 cm was measured exclusively due to the influence of the passage of the forwarder wheels on soil compaction and the influence of compaction on the change of soil shear strength.
Ruts depth
Damage to the ground in the form of ruts was determined by measuring the profile and depth of the ruts at the site of repeated passage of the forwarder using a geodetic bar 5 m long placed on two fixed supports located next to the ruts. The measurements were carried out with an intensity of 10 cm along the entire width of the forwarder track between the anchored supports.
Results
Changes in soil parameters
Soil moisture
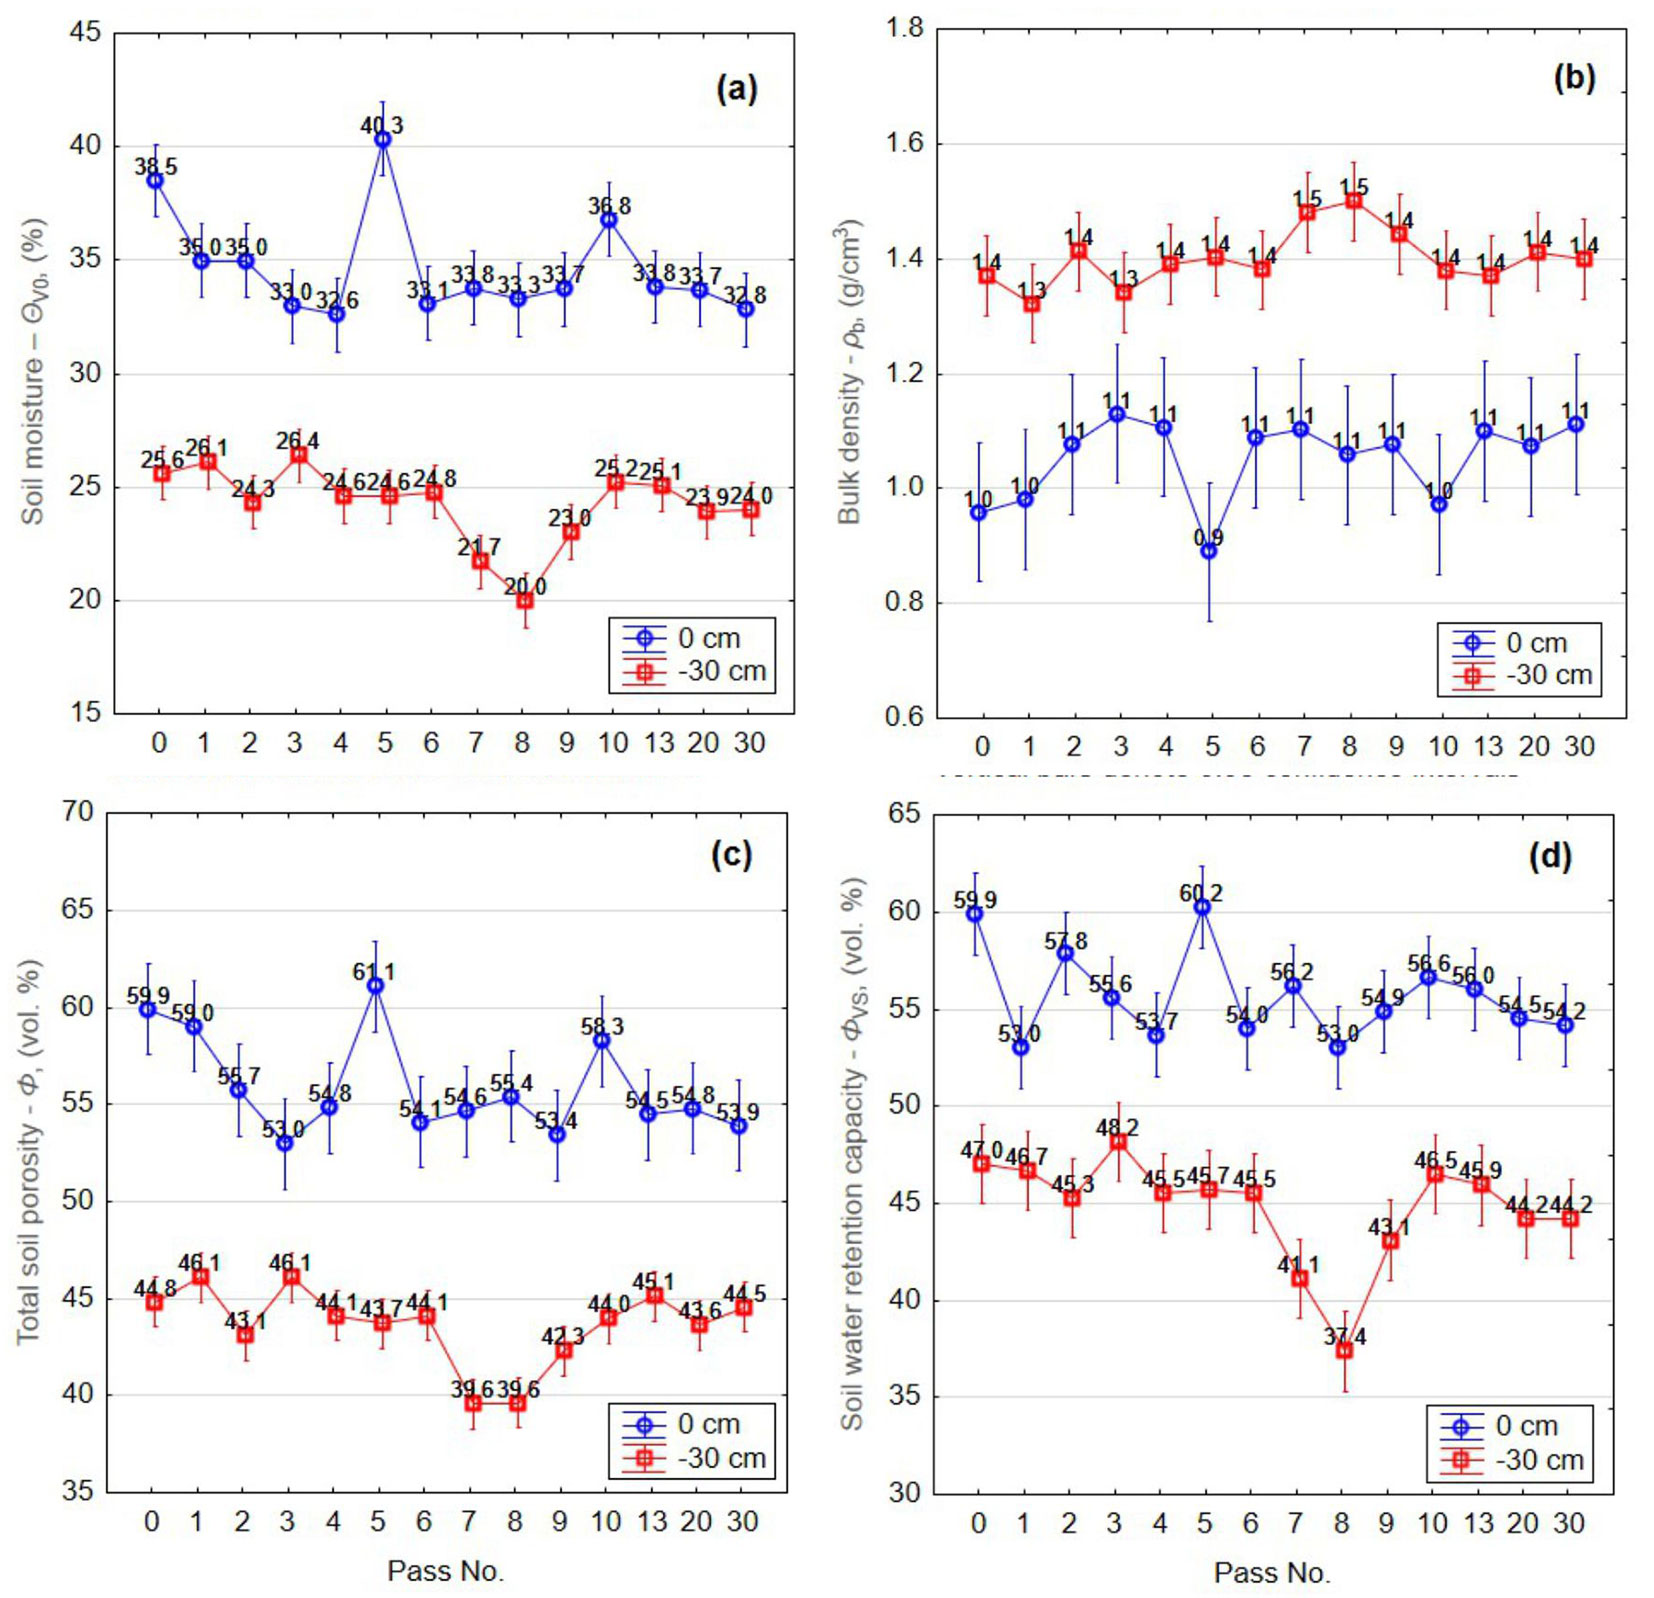
In the surface part of the soil, the moisture (ΘV0, %) ranged between 32.6% and 40.3%, while at a soil depth of 30 cm ranged between 20.0% and 26.4%. One-way ANOVA showed significant differences in measured values of soil moisture between forwarder passes at both soil depth (p < 0.00001 - Fig. 2a). On the surface, after the 5th and 10th pass, a sudden increase in the soil moisture was measured, and a similar situation was happened at a depth of 30 cm after the 9th pass.
Fig. 2 - One-way ANOVA of the soil parameters dependence on the number of forwarder passes. (a) Soil moisture (Wilks λ=0.06785; p<0.0001); (b) bulk density (λ=0.41738; p=0.0329); (c) total soil porosity (λ=0.08107; p<0.0001); (d) soil water retention capacity (λ=0.08342; p<0.0001). Vertical bars denotes 0.95 confidence intervals.
Bulk density
The measured values of bulk density (ρb, g cm-3) were higher at a depth of 30 cm in relation to the surface part of the soil due to the lower content of humus, the share of which decreases with increasing depth. According to Fig. 2b, changes of bulk density in the surface part coincides with the changes in soil moisture shown in Fig. 2a. In the surface part, the bulk density generally had values around 1.1 g cm-3. Bulk density measured at a soil depth of 30 cm shows a slight variation around 1.4 g cm-3. One-way ANOVA showed a significant difference between the number of forwarder passes at both measured soil depth (p = 0.03291).
Particle density
Changes in the values of the particle density (ρp, g cm-3) are associated with changes in bulk density with the same number of forwarder passes, but the impact on these changes is much smaller. The particle density ranged between 2.3 and 2.4 g cm-3 on average on the surface part of soil, while at a soil depth of 30 cm the values were slightly higher and ranged on average around 2.5 g cm-3.
Total soil porosity
With the increase in the number of forwarder passes, the soil became more compacted, while at the same time the interaggregate spaces in the soil, the amount of pores, and the volume of the soil, that is the total soil porosity (Φ, vol. %), decreased. For example, we found that after a certain number of passes of the forwarder (after the 5th and 10th) there was a breakdown of structural aggregates of the soil with an increase in total soil porosity, as displayed in Fig. 2c. One-way ANOVA showed a significant difference in total soil porosity between number of forwarder passes at both measured depth of soil (p < 0.00001).
Soil water retention capacity
According to the diagram in Fig. 2d, we observed a trend of decreasing soil water retention capacity (ΦVS, vol. %) with a larger number of forwarder passes (up to 8 passes) at a soil depth of 30 cm, except in the case when the structural aggregates of the soil are broken, which consequently increases the total soil porosity. With a larger number of passes, soil compaction occurred and the share of micropores in the total soil porosity decreased. Significant differences in measured soil water retention capacity between the number of forwarder passes at both soil depth (p < 0.00001) were found by one-way ANOVA.
Physical-mechanical characteristics changes of soil
Penetration curve and cone index
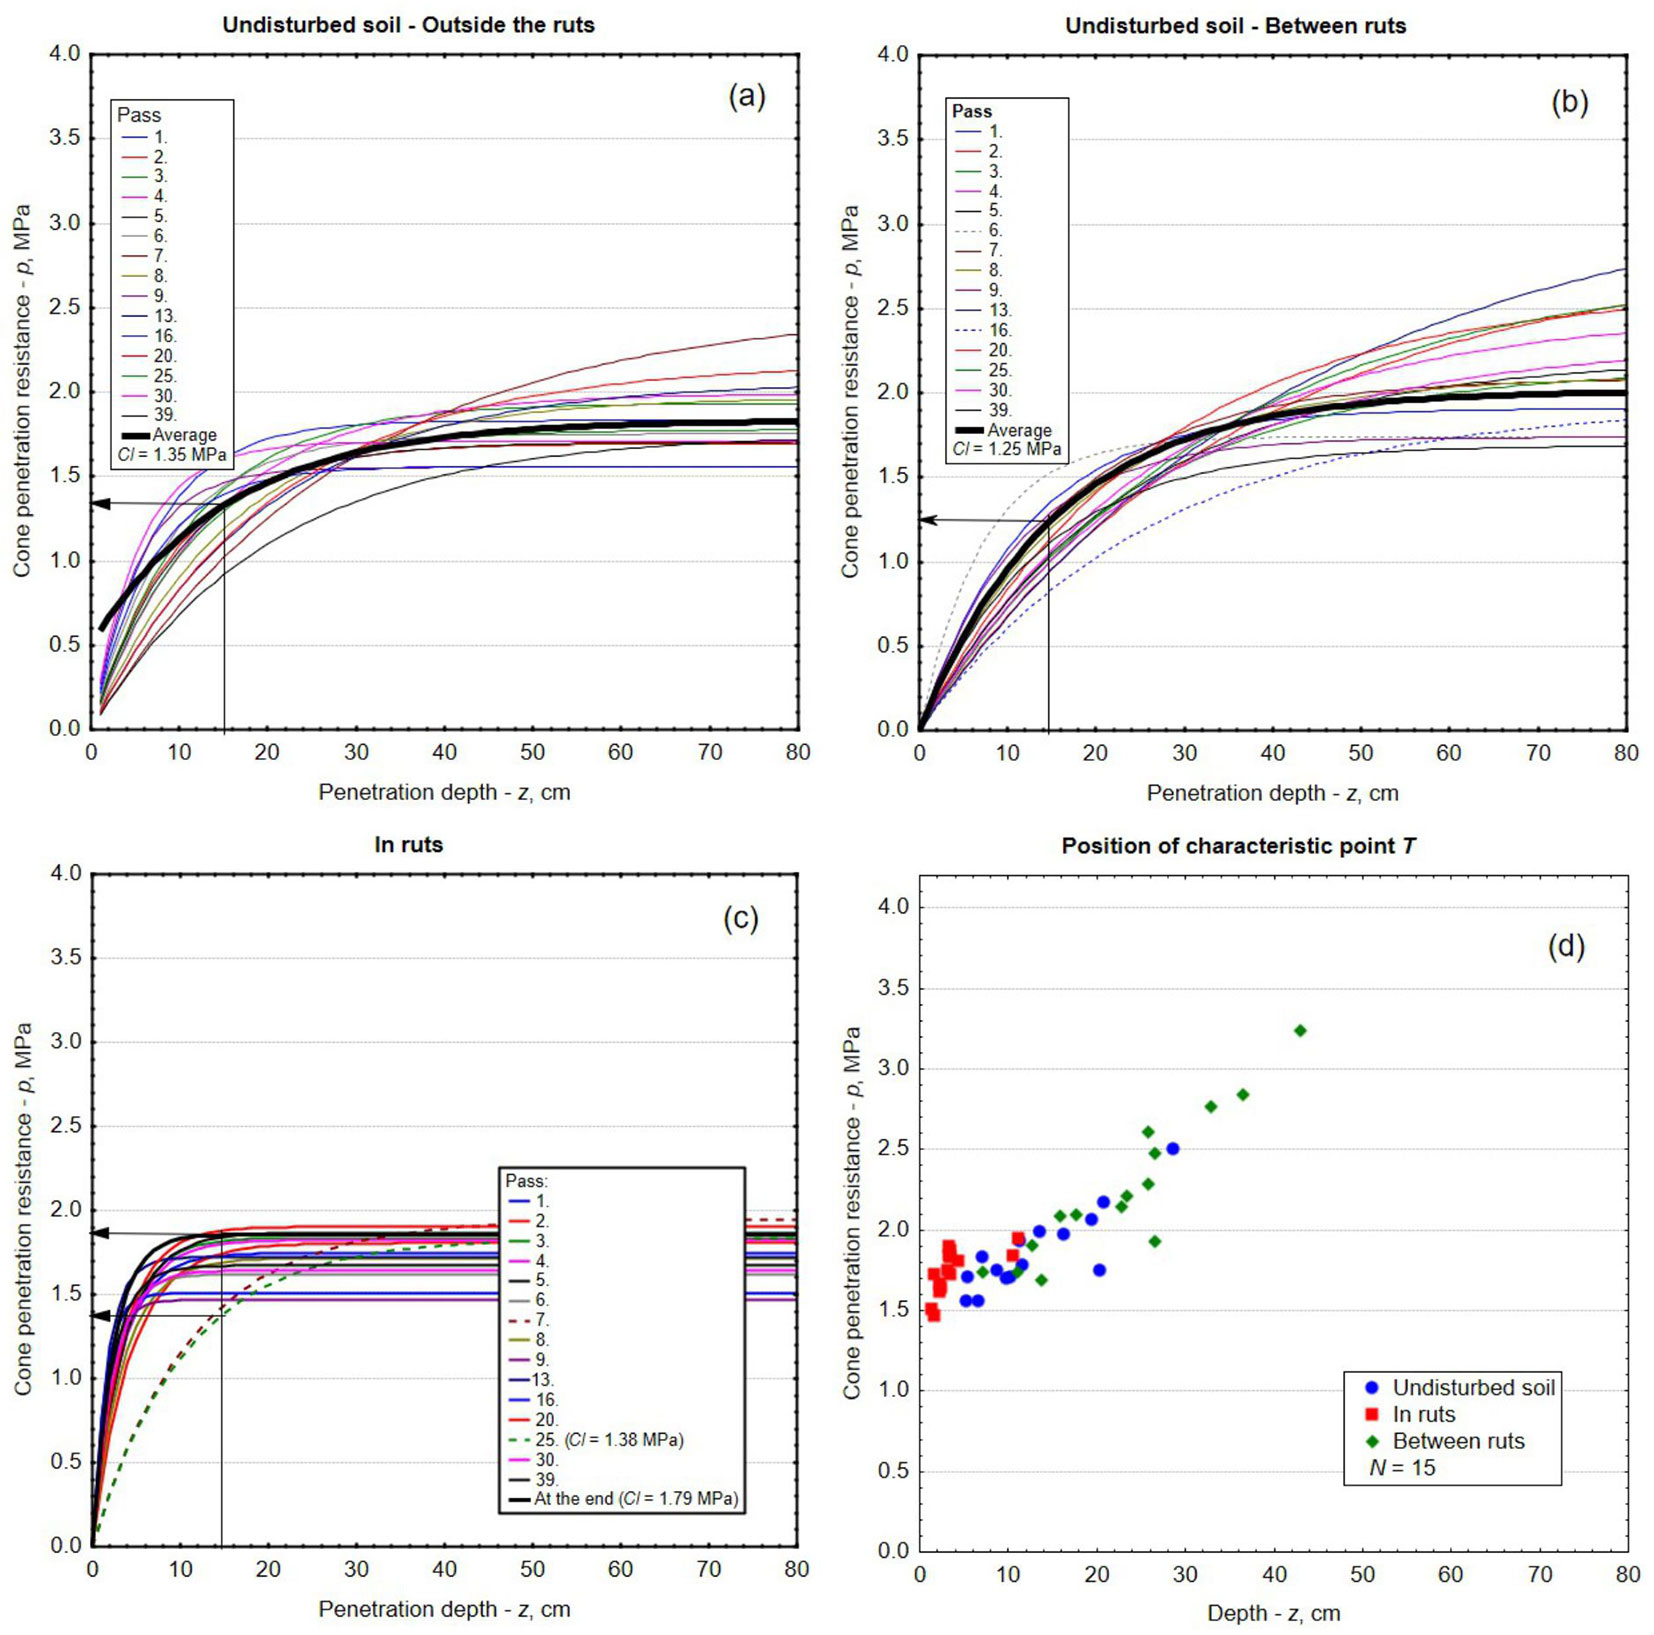
The mean value of the cone index (CI) of undisturbed soil outside the ruts (Fig. 3a) was 1.35 MPa, while it was 1.25 MPa between ruts (Fig. 3b). According to the penetration resistance curves (Fig. 3c), the CI of the soil in ruts ranged between 1.38 and 1.79 MPa.
Fig. 3 - Changes in the penetration resistance curves in the soil outside the ruts (a), between the ruts (b), and in the ruts (c); (d) the position of the characteristic points of the equalization curves in the repeated passage of the forwarder.
The diagram in Fig. 3d shows the overlap of the characteristic points T, but the shift of the group of points of disturbed soil towards the ordinate of the coordinate system is also noticeable. This shift indicates soil compaction in its upper (surface) part. Regarding the ordinate axis, the position of the characteristic points T indicates the lowest compaction of the disturbed soil in the ruts, which should be considered with caution because the tangents of the equalized penetration resistance curves are influenced by the penetration resistance of the cone at greater depths.
The t-test of cone index of undisturbed soil outside and between ruts showed no statistically significant difference between them (p = 0.8489).
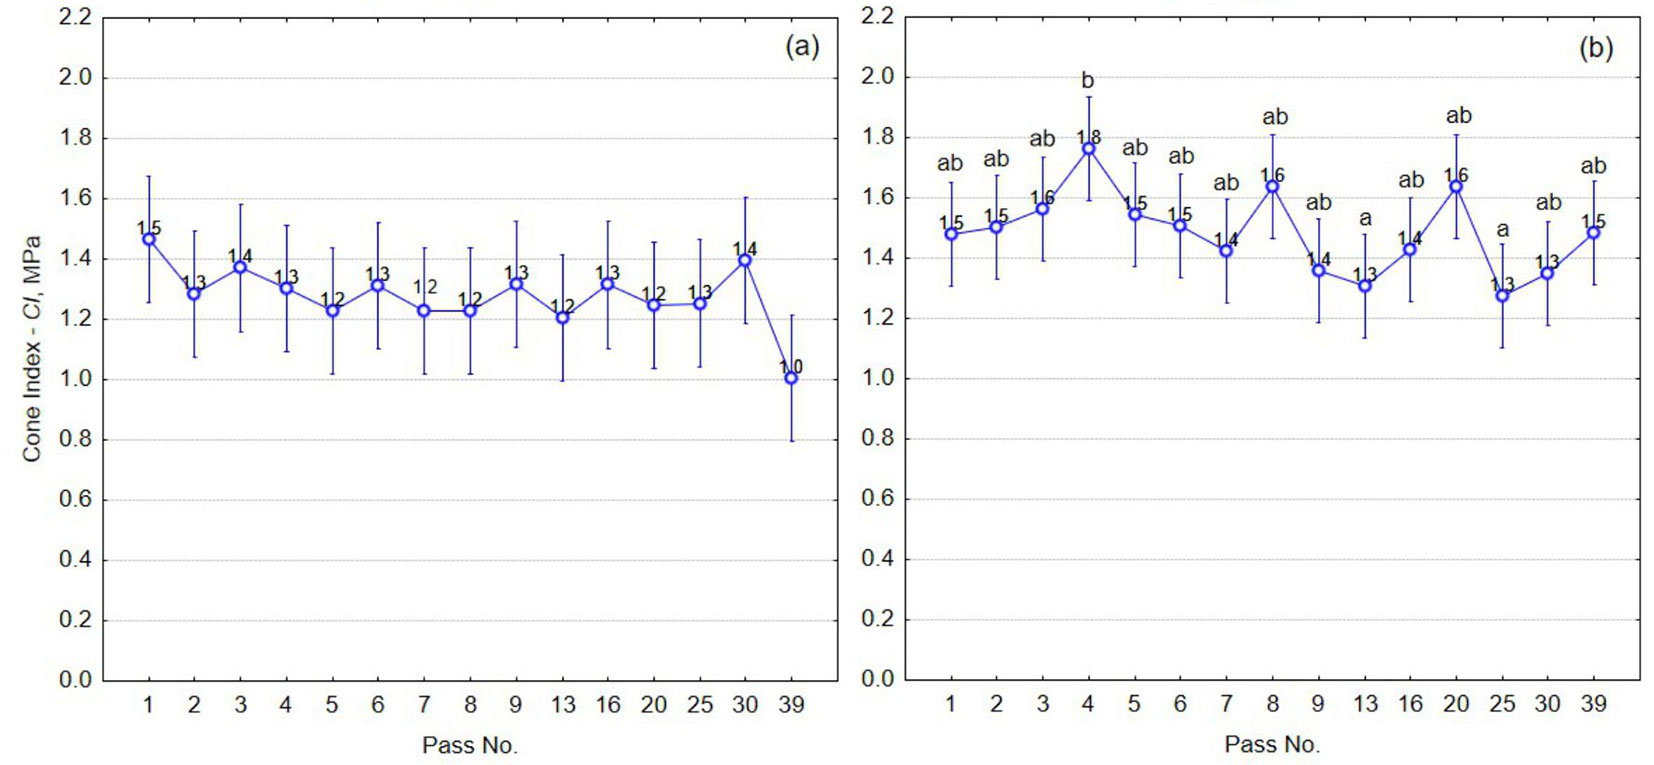
A one-way ANOVA (Fig. 4a) of undisturbed soil outside and between ruts did not reveal any significant difference in measured CI depending on the number of forwarder passes (p = 0.4763).
Fig. 4 - One-way ANOVA of cone index dependence on the number of forwarder passes in undisturbed soil (a - p=0.4764) and disturbed soil in ruts (b - p=0.0107). Vertical bars denotes 0.95 confidence intervals. Different letters above the bars indicate significant (p<0.05) pairwise difference between forwarder passes after Tukey HSD post-hoc test.
According to Fig. 4b, an increase in the amount of CI on disturbed soil can be observed up to the 4th pass, and the trend decreases until the last pass with slight jumps in measured values after the 8th, 20th and 39th pass of the forwarder. Comparing the CI value of disturbed and undisturbed soil (Fig. 4a, Fig. 4b), the higher value of undisturbed soil (0.1 MPa) was measured after the 30th pass of the forwarder.
In the case of disturbed soil in ruts, a one-way ANOVA (Fig. 4b) showed that there was a difference in the measured values of CI depending on the number of passes of the forwarder (p = 0.0107).
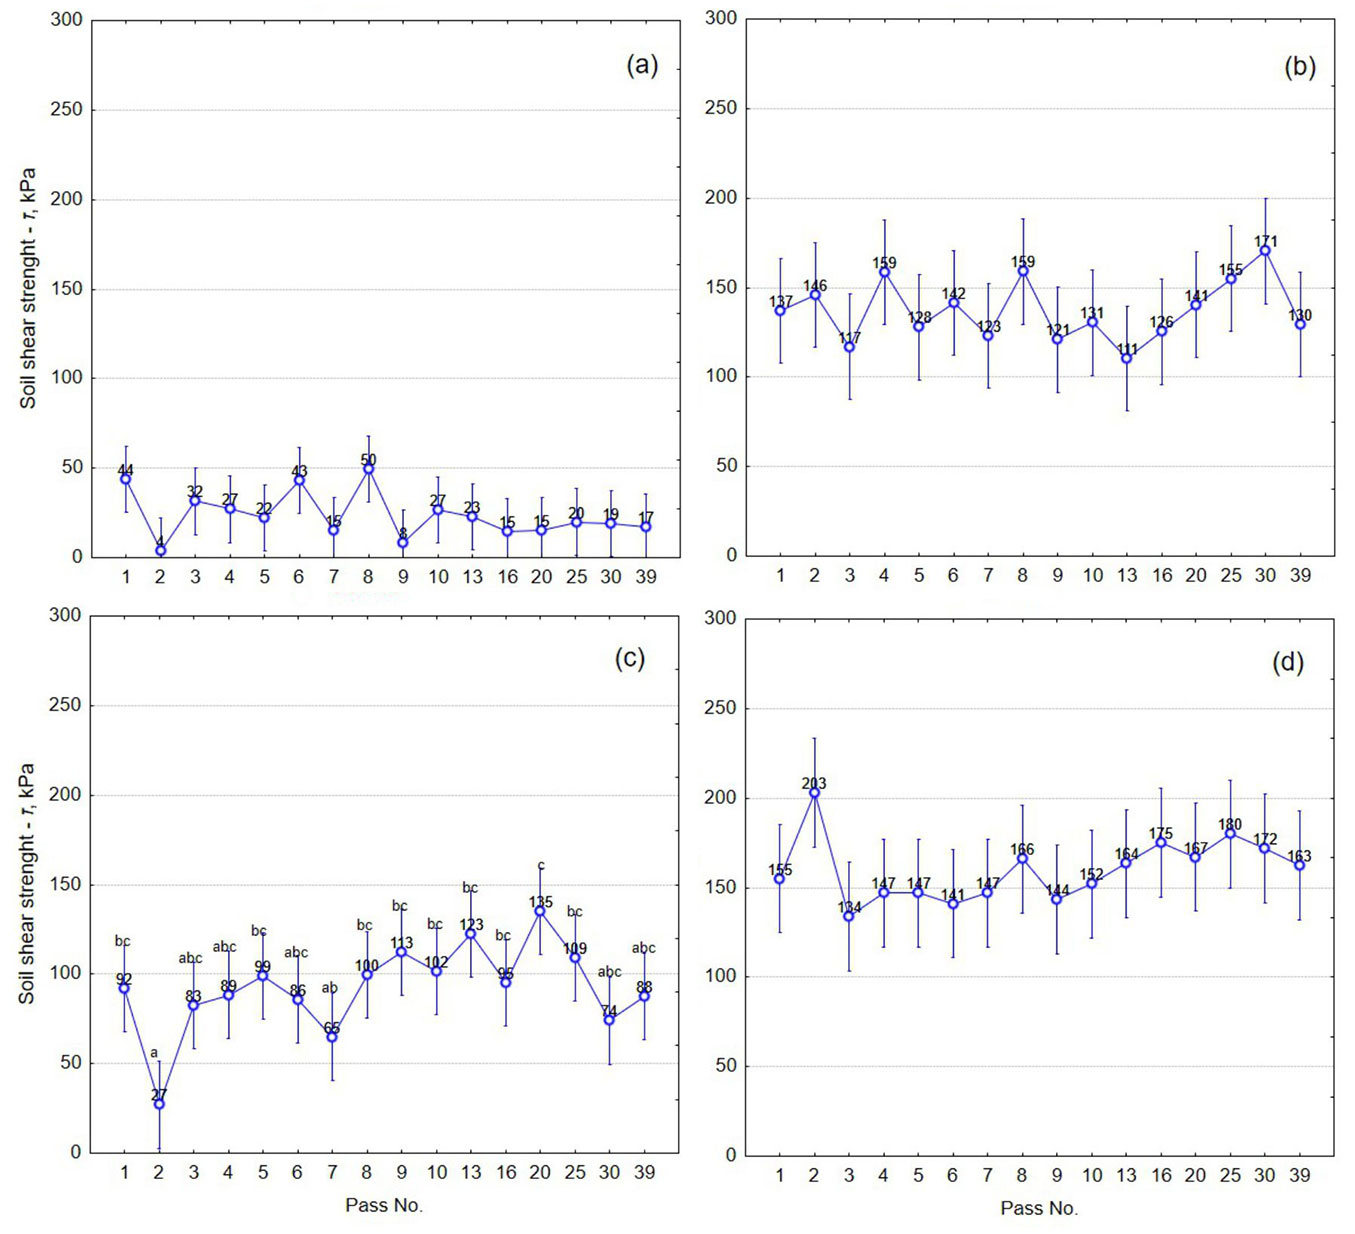
Soil shear strength
No significant difference was found between the soil shear strength measured on undisturbed soil outside and between the ruts on the surface and at a soil depth of 15 cm after t-test (p = 0.6242, p = 0.6213, respectively). The mean values of shear strength of undisturbed soil outside and between the ruts on the surface and at the soil depth of 15 cm were 23 kPa and 136 kPa, respectively. In further analysis, the values of shear strength of undisturbed soil outside and between ruts were used under the term undisturbed soil.
In the surface part of the soil after the second pass, a significant decrease in the soil shear strength was measured not only in the ruts but also outside them (Fig. 5a, Fig. 5b). This was followed by a slight growth trend with small changes until the 25th pass, followed by a decline and again growth after the 39th pass for disturbed soil in the ruts (Fig. 5b).
Fig. 5 - One-way ANOVA of soil shear strength dependence on the number of forwarder passes at two soil depths on undisturbed soil (a, b) and soil in ruts (c, d). (a) Undisturbed soil at 0 cm (p=0.0660); (b) undisturbed soil at -15 cm (p=0.2071); (c) soil in ruts at 0 cm (p=0.0019); (d) soil in ruts at -15 cm (p=0.2094). Vertical bars denotes 0.95 confidence intervals. Different letters above the bars indicate significant (p <0.05) pairwise differences between forwarder passes after Tukey HSD post-hoc test.
At a soil depth of 15 cm, based on the obtained results (Fig. 5d), it cannot be stated with certainty that due to the increase in the number of forwarder passes, there was an increase in the soil shear strength. It is interesting to note that after the second pass, the highest value of the shear strength of the disturbed soil was measured at a depth of 15 cm (Fig. 5d), while at the same time the lowest value was measured on the surface part of the soil (Fig. 5b).
Using one-way ANOVA, significant differences were detected only in the shear strength measured on the soil surface in ruts (p = 0.0019 - Fig. 5c). There was a significant difference between the soil shear strength measured after the second and 20th passes of the forwarder (Fig. 5b).
Diagrams in Fig. 5 show the influence of the number of forwarder passes on the soil shear strength measured at both depths in the soil. Shear strength values in the surface part of the undisturbed soil ranged on average from 1 to 50 kPa, while at a depth of 15 cm these values averaged between 111 and 171 kPa. The reason for the low values in the surface part of undisturbed soil is the thick humus-accumulating horizon of the soil. For this reason, these values are not suitable for soil classification, while values measured at a soil depth of 15 cm are much more suitable for this purpose.
The measured values of shear strength of undisturbed soil at a depth of 15 cm were above 60 kPa, and according to the EcoWood classification ([35]), these soils are classified in the class of strong soils.
At both sampled depths, a large variability of the measured values on undisturbed soil was observed, although there were no significant changes in weather conditions that would affect the change in soil characteristics during the research period. The reason for the high variability of the measured data is mainly the heterogeneous soil structure due to the intertwining of plant roots and its stratification.
Ruts depth
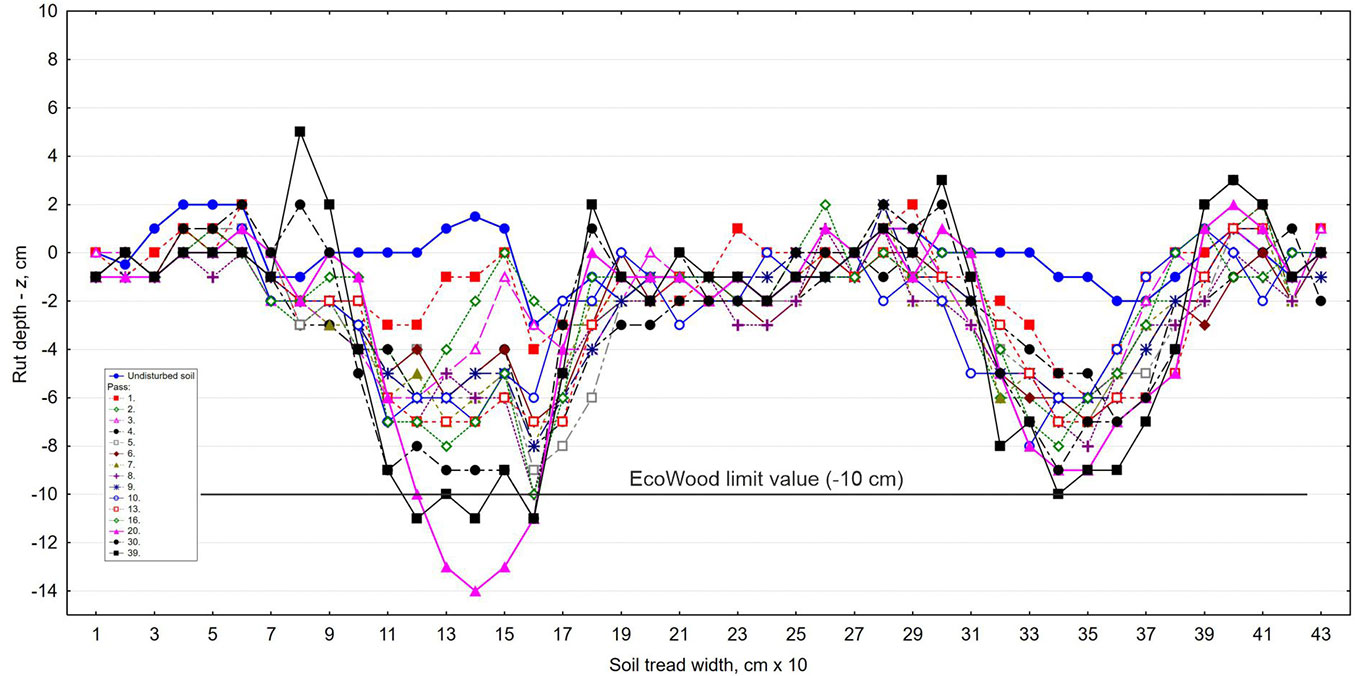
According to the diagram shown in Fig. 6, an increase in the depth of the ruts with the number of passes of the forwarder wheels was found. The largest change in ruts depth occurred after the first pass. The limit value of 10 cm ([35]) was reached after the 20th and at the end of the wood extraction after the 39th forwarder pass. During the research, the soil had good bearing capacity and there was no precipitation which would lead to changes in bearing capacity and soil shear strength. The highest soil distribution was measured from the outside of the left track after the 39th pass and it was 5 cm. The measured ruts depths were slightly above the recommended limit of 10 cm ([35]) after the 20th pass of the forwarder.
Discussion
Soil parameters
The number of forwarder passes negatively affected the change of soil parameter values (soil moisture, ΘV0; bulk density, ρb; particle density, ρp; total soil porosity, Φ; and soil water retention capacity, ΦVS) obtained by laboratory analyses from soil samples taken on the surface and at a soil depth of 30 cm. One-way ANOVA showed significant differences in all soil parameters between number of forwarder passes at both soil sampling depth (Fig. 2a-d). The phenomena occurring in the soil after multiple passes of the forwarder resulted in changes in soil structure, i.e., crushing of soil structural aggregates, and the analysis of soil samples revealed cyclical changes in the values of the analyzed parameters ([2]).
We observed that soil bulk density at a depth of 30 cm on undisturbed soil was 1.37 g cm-3 and changed slightly with the number of passes of forwarder, while on the soil surface it was 0.98 g cm-3 and was more susceptible to changes caused by forwarder passes (Fig. 2b). These results are in accordance with the statement of Powers et al. ([38]) that the soils with initial bulk densities greater than 1.4 g cm-3 are rather resistant to compaction. The investigated soil at the time of sampling was less saturated with water (about 35% on the surface, or about 25% at a depth of 30 cm) and in such soils, the water retention capacity is less sensitive to soil compaction ([37]).
Cone penetration resistance
Soil compaction determined by the cone penetration resistance allowed to derive the characteristic point T of the equalized penetration curve. However, the values of the characteristic point on the y-axis were not sufficient to describe the soil compaction caused by repeated passes of the forwarder in the same place. According to the values of the characteristic points on the x-axis, their shift towards the origin of the coordinate system can be observed as the number of forwarder passes on the disturbed soil increases. This shift indicates greater compaction of the surface part of the soil to a depth of about 15 cm. The compaction process is slower in deeper soil layers compared to the upper soil layer ([45]).
The measured values of CI indicate higher soil compaction in the ruts as compared to undisturbed soil and the soil between the ruts. This parameter did not show an increasing trend with increasing the number of forwarder passes, as it was expected. The explanation for this may be that after a certain number of forwarder passes there was a change in the soil structure, i.e., the crushing of structural aggregates in the soil ([2]), but soils with good bearing capacity are less susceptible to changes due to compaction by repeated vehicle passes.
For medium to fine textured soils (such as silty clay loam in our study), maximal cohesion between soil particles occurs under very dry conditions, leading to negligible compaction and to minimal or no rutting. As the moisture content rises, the cohesion between the soil particles decreases and the soils reach the maximal vulnerability to compaction at an intermediate critical water content. Meanwhile, a growing number of pores are filled with water that cannot be compressed. This means that above the critical water content, machine forces are transformed into profile disturbances and deep rut formations, rather than into soil compaction ([52], [2]).
Shear strenght
The results of shear strength measured at the surface and at a soil depth of 15 cm did not show a constant increase with increasing number of forwarder passes at both sampled depths. Due to changes in soil structure after a certain number of forwarder passes, cyclic changes in shear strength have been observed, as was the case with the cone index. In order to determine why these cyclic changes occur, a higher number of repetitions of measurements is recommended.
According to the measured values of shear strength of undisturbed soil on the surface and at a soil depth of 15 cm, it is recommended to take into account the values measured at a depth of 15 cm due to the lower measurement variability observed. Indeed, at this depth the shear strength values better describe the condition of the soil in relation to the values measured on the soil surface, where the measured values were greatly influenced by the presence and amount of humus - accumulative horizon of undecomposed organic material.
Based on the values of cone index and shear strength of the soil measured at a soil depth of 15 cm, the soil of the investigated site was classified into strong soil class (CI> 0.5 MPa, τ> 60 kPa), according to the EcoWood classification of soil bearing capacity ([35]).
Ruts depth
The intensity of machine traffic (i.e., the number of passes) is a main driving factor of ruts depth, as demonstrated by several authors ([7], [12], [13]), and confirmed by this study (Fig. 6). The largest change in ruts depth was observed after the first pass. The reason for this is that undisturbed soils have a low initial bulk density with many macropores and as such are easily compactable ([20], [45], [6]). When bulk density increases, the macropores become micropores that exert a higher resistance and are thus less prone to compaction. The measured ruts depths were slightly above the recommended limit of 10 cm ([35], [42]) and only after the 20th forwarder pass. The difference between 20th, 30th and 39th pass in soil depth is only because of the top soil layer destruction and influence of the height of tyre ribs. During usual wood extraction, it is rare for the productive soil of the stand to be loaded with so many forwarder passes on the same tracks. Further, from the obtained results it can be concluded that the soil at the study site had good bearing capacity and that the depth of the ruts was acceptable.
Conclusions
The negative consequences of wood extraction with a heavy forwarder at the investigated forest site were very weak due to the low saturation of the soil with water and its very good bearing capacity. Multiple passes of loaded wheels of a heavy forwarder had slightly negative effect on changes in soil parameters at both depth of soil. In order to obtain more relevant data, it is recommended to take more soil samples.
Changes in the bearing capacity of the soil in ruts measured with a cone penetrometer were recorded in the surface part of the soil, while no changes were observed in the deeper layers of soil. The differences in the values of the cone index of undisturbed and disturbed soil in ruts were not large, but statistically significant changes in relation to the number of forwarder passes were observed in the disturbed soil in ruts. Due to the type of soil and its properties in the study period, it was considered that there was a breakdown of structural aggregates of soil and, consequently, changes in its bearing capacity. Similar changes were observed measuring shear strength and other soil parameters, such as bulk density and porosity, but mainly in the surface part of disturbed soil in ruts.
Stress distribution in the subsoil below the ruts did not impact the parameters of soil between the ruts and therefore these showed values similar to those of the undisturbed soil outside the ruts.
To reduce harmful impact on forest soil of heavy forest machinery like forwarders it is recommended to optimize the operational planning according to weather and the conditions of the forest soil. Frozen soil, soil with less water saturation, use of wider tyres and/or bogie tracks to reduce high wheel pressure on the soil, reduce of load in a case of low soil bearing capacity are some of the recommendations. Furthermore, we recommend to carry out some preparatory works at the harvesting site, as marking the extracting lanes and their evenly distribution along the working site, with a distance between them which is equal to twice the reach of the hydraulic crane of the forwarder.
References
Gscholar
Gscholar
Gscholar
Gscholar
Gscholar
Gscholar
Gscholar
Gscholar
Gscholar
Gscholar
Gscholar
Gscholar
Gscholar
Gscholar
Gscholar
Gscholar
Authors’ Info
Authors’ Affiliation
Hrvoje Kopseak
Marijan Šušnjar 0000-0003-3644-1396
Matija Landekić 0000-0002-5776-6811
Mario Šporčić 0000-0003-4933-4661
Marin Bačić 0000-0002-1205-4060
Department of Forest Engineering, Faculty of Forestry and Wood Technology University of Zagreb, Svetošimunska cesta 23, Zagreb (Croatia)
Corresponding author
Paper Info
Citation
Pandur Z, Kopseak H, Šušnjar M, Landekić M, Šporčić M, Bačić M (2022). Effect of forwarder multipassing on forest soil parameters changes. iForest 15: 476-483. - doi: 10.3832/ifor4138-015
Academic Editor
Rodolfo Picchio
Paper history
Received: May 16, 2022
Accepted: Sep 18, 2022
First online: Nov 24, 2022
Publication Date: Dec 31, 2022
Publication Time: 2.23 months
Copyright Information
© SISEF - The Italian Society of Silviculture and Forest Ecology 2022
Open Access
This article is distributed under the terms of the Creative Commons Attribution-Non Commercial 4.0 International (https://creativecommons.org/licenses/by-nc/4.0/), which permits unrestricted use, distribution, and reproduction in any medium, provided you give appropriate credit to the original author(s) and the source, provide a link to the Creative Commons license, and indicate if changes were made.
Web Metrics
Breakdown by View Type
Article Usage
Total Article Views: 25632
(from publication date up to now)
Breakdown by View Type
HTML Page Views: 21522
Abstract Page Views: 2253
PDF Downloads: 1404
Citation/Reference Downloads: 5
XML Downloads: 448
Web Metrics
Days since publication: 1151
Overall contacts: 25632
Avg. contacts per week: 155.89
Article Citations
Article citations are based on data periodically collected from the Clarivate Web of Science web site
(last update: Mar 2025)
Total number of cites (since 2022): 1
Average cites per year: 0.25
Publication Metrics
by Dimensions ©
Articles citing this article
List of the papers citing this article based on CrossRef Cited-by.
Related Contents
iForest Similar Articles
Research Articles
The natural recovery of disturbed soil, plant cover and trees after clear-cutting in the boreal forests, Russia
vol. 13, pp. 531-540 (online: 18 November 2020)
Research Articles
Estimating machine impact on strip roads via close-range photogrammetry and soil parameters: a case study in central Italy
vol. 11, pp. 148-154 (online: 07 February 2018)
Research Articles
Physical and mechanical characteristics of poor-quality wood after heat treatment
vol. 8, pp. 884-891 (online: 22 May 2015)
Research Articles
The physicomechanical and thermal properties of Algerian Aleppo pine (Pinus halepensis) wood as a component of sandwich panels
vol. 15, pp. 106-111 (online: 21 March 2022)
Research Articles
Mechanical and physical properties of Cunninghamia lanceolata wood decayed by brown rot
vol. 12, pp. 317-322 (online: 06 June 2019)
Research Articles
Shear modulus of old timber
vol. 10, pp. 446-450 (online: 24 March 2017)
Research Articles
Impact of wheeled and tracked tractors on soil physical properties in a mixed conifer stand
vol. 9, pp. 89-94 (online: 22 May 2015)
Short Communications
Effect of intensive planting density on tree growth, wood density and fiber properties of maple (Acer velutinum Boiss.)
vol. 9, pp. 325-329 (online: 22 October 2015)
Research Articles
Behavior of pubescent oak (Quercus pubescens Willd.) wood to different thermal treatments
vol. 8, pp. 748-755 (online: 16 February 2015)
Research Articles
Physical, chemical and mechanical properties of Pinus sylvestris wood at five sites in Portugal
vol. 10, pp. 669-679 (online: 11 July 2017)
iForest Database Search
Search By Author
Search By Keyword
Google Scholar Search
Citing Articles
Search By Author
Search By Keywords
PubMed Search
Search By Author
Search By Keyword

