Amazon forest biomass: intra- and interspecific variability in wood density drive divergences in Brazil’s far north
iForest - Biogeosciences and Forestry, Volume 16, Issue 2, Pages 95-104 (2023)
doi: https://doi.org/10.3832/ifor4137-016
Published: Mar 21, 2023 - Copyright © 2023 SISEF
Research Articles
Abstract
Wood density (WD) is an important functional trait of tree species. Understanding spatial WD variability as a function of environmental determinants improves our ability to estimate carbon stocks in the woody biomass of tropical forests. However, the role of each environmental variable affecting the intra- and interspecific variability of WD is not entirely clear for most forest ecosystems. In Amazonia there are recurrent uncertainties in estimates of regional woody biomass. The aim of the study was to investigate the effects of environmental conditions on the intra- and interspecific variability of WD for tree assemblages in forests of the northern Brazilian Amazon. A single sample was extracted from each of 680 individuals (108 species, 82 genera, 38 families; stem diameter ≥10 cm) dispersed among 129 plots distributed along a hydro-edaphic gradient. General community-averaged WD (0.703 ± 0.133 g cm-3; range: 0.203 to 1.102 g cm-3) was high in relation to other Amazonian areas because 62% of the species and 69% of the sampled individuals had high WD values (>0.650 g cm-3). Altitude (a proxy for drainage), clay and soil micronutrient content explained 23% of the spatial variation in WD. Partitioning WD variation into species-substitution (turnover) and intraspecific-variation components slightly increased the explanatory power to 26%. The analysis of interspecific variability showed that forests occurring in seasonally flooded areas are characterized by tree assemblages with species tolerant to P-poor soils, where mean WD (0.742 g cm-3) is about 4% higher than the mean (0.713 g cm-3) for tree assemblages on unflooded uplands where soils have less limitations from nutrient poverty. Our results represent an improvement in the estimates of biomass because they promote adjustments (1.4%-16.3%) to the previous estimates of woody biomass in the northern Brazilian Amazon forests considering different environmental conditions.
Keywords
Basic Density, Maracá, Roraima, Seasonal Forests, Wood Specific Gravity
Introduction
Wood density, also termed specific gravity, is a functional trait strongly associated with interspecific variation in tree growth, architecture, mortality and resistance to water stress ([38], [32]). Basic wood density, here abbreviated as “WD”, refers to oven-dry weight divided by saturated volume, this being the most appropriate density measure for calculating the biomass of trees from estimates of live volume. WD is one of the main variables used in allometric models for indirect calculations of woody biomass to estimate tropical forest carbon stocks ([12], [18]).
While an accurate knowledge of WD variability is recognized as a functional parameter that significantly improves tropical-forest biomass prediction, it is also considered to be one of the main sources of error in the estimates ([2], [11]). The main causes for WD to be a source of error propagation in tropical-forest biomass estimation are associated with (i) difficulties in collecting a sufficiently large number of samples to represent the main species ([22]), (ii) obtaining samples that represent the intra- and inter-intraspecific spatial variability between species and different forest ecosystems ([26]), and (iii) standardization problems in sample collection and methodological analysis ([49]). The difficulty of measuring WD leads most investigations involving tree biomass estimation in tropical forests to use WD values extracted from global repositories ([52]). Although biomass estimates carried out using the WD values from global databases can be considered an advance, this practice can lead to divergences in estimates of carbon stocks ([25]). Overestimation of WD by up to 16% can occur at the level of a species community ([37]).
Amazonia is the world’s most diverse and largest continuous area of tropical forest ([19]). Despite recent advances in carbon and biomass stocks estimation, there are still great uncertainties associated with calculations of biomass loss and accumulation in Amazonia’s different forest ecosystems ([46]). Divergences in the regional spatial patterns of forest dynamics in Amazonia have been attributed to WD variability, where low-WD forests in northwestern Amazonia have high mortality and fast turnover, while northeastern Amazonia has high-WD forests with low mortality ([10]). There is a consensus that environmental variables are the main factors affecting the inter- and intra-specific spatial patterns in WD ([39], [34]). Large environmental variability (e.g., soil type, climatic seasonality, water table deep and flooding periodicity) in Amazonia impacts functional traits of tree species at various levels ([35], [20]). Consequently, environmental heterogeneity generates variations in structural and functional traits, introducing inaccuracies into general allometric models intended for estimating carbon stocks based on forest biomass ([12]).
Some studies in Amazonia have shown that intraspecific variations can reflect phenotypic plasticity of the species caused by edaphic factors ([33]), which affect changes in structure and tree species composition ([26], [15]), where WD values are inversely related to soil fertility ([2]). Flooding periodicity (intermittent drainage) also can affect the wood density, because habitat specific WD is the key to quantifying above-ground woody biomass and carbon differences between flooded and non-flooded forests due to site specificities, such as taxonomic groups and tree dimensions ([7]).
Recent studies have identified a hydro-edaphic gradient acting as an environmental filter that selects tree species, and shapes the ecotone forest’s structure in northern Amazonia ([28], [41]). These ecotone forests occur where there is high environmental heterogeneity that results in a large mosaic of different forest types (ombrophilous, semideciduous and deciduous) ([48]). This results in forests with structure and floristic composition that are distinct from other Amazonian forests. Intra- and interspecific variability in WD is higher in forests that are highly dependent on environmental conditions ([2], [14]). However, for ecotone forests in northern Brazilian Amazonia the effect of the hydro-edaphic gradient on WD variation has not yet been assessed, and there is a paucity of information on the biometric and functional variables needed to estimate regional biomass and carbon stocks in these forests ([4]). Accounting for the different underlying variables driving WD variation is therefore important for understanding and accurate models to estimate biomass and carbon stocks in the ecotone forests in the northern Brazilian Amazonia.
The aim of the present study was to investigate community average WD and its determinants in the tree assemblages of ecotone forests in northern Brazilian Amazon. The specific questions for our investigation were: (i) how does the hydro-edaphic gradient drive the spatial variability of wood density in northern Amazonian forests? and (ii) how do the relative contributions of intra- and interspecific WD variation respond to the hydro-edaphic gradient? The development of a regional database for the wood densities of tree species in northern Amazonian forests will provide a better way to calculate woody biomass and carbon stocks in this poorly studied ecological region where current estimates are based on databases derived from regions where climatic, hydro-edaphic and vegetation conditions are different.
Material and methods
Study area
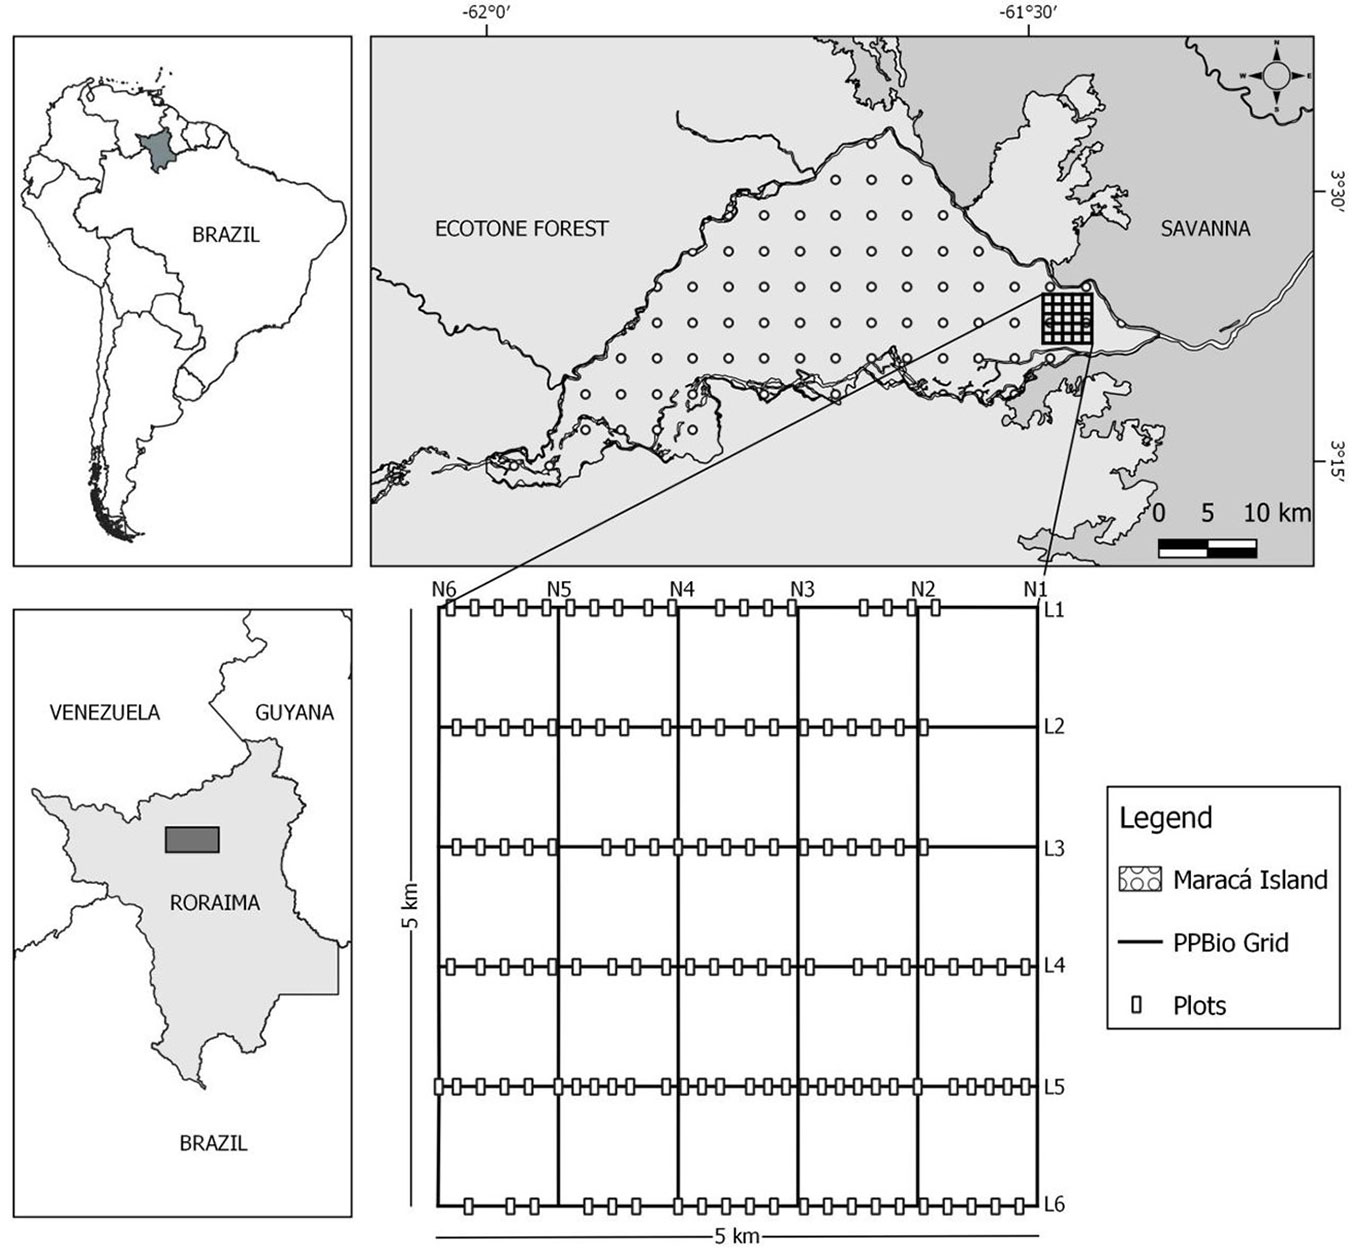
The study was carried out in the PPBio (Biodiversity Research Program) research grid installed in the eastern portion of the Maracá Ecological Station (⇒ https://ppbio.inpa.gov.br/sitios/maraca), a Brazilian protected area located in the northern portion of the state of Roraima (03°15′ - 03°35′ N and 61° 22′ - 61° 58′ W), about 135 km from Boa Vista, the state capital (Fig. 1). The ecological station is formed by Maracá Island and other fluvial islets (hereafter “Maracá”); it is 60 km long and 15-25 km wide and has a total area of ~101.000 ha ([40]). Maracá is located in an area of climatic transition between the Köppen-classification subtypes Aw and Am, where rainfall and average annual temperature are 2086 mm and 26 °C, respectively ([16]). The rainy season (> 300 mm month-1) occurs mainly between May and August, while the driest period is between December and March (< 100 mm month-1 - [9]).
Fig. 1 - Geographic location of the study area: PPBio research grid, Maracá Ecological Station, northern Brazilian Amazon.
The eastern portion of Maracá is an ecotone zone characterized by a savanna-forest contact zone where the forest types are determined by different hydro-edaphic conditions ([28], [48]). The forest mosaic as a whole is an accurate representation of the large ecotone forest area in the Northern Brazilian Amazonia ([4]). The forest types are defined by the Brazilian Vegetation Classification System as ombrophilous and seasonal (semideciduous and deciduous) forests ([6]). The forest formations occur on a variety of different reliefs and soils ranging from Typic Tropaquept (lowland; hydromorphic; seasonally flooded) to Oxic Haplustult and Typic Haplustalf, both well drained ([31]).
Sampling design
Between December 2015 and January 2016, 129 plots (50 × 10 m, 6.45 ha in total) were installed along the six east-west trails of the PPBio grid (Fig. 1). The distance between individual plots was 150 m and was measured using PPBio distance pickets established every 50 m along the trails that cross the PPBio grid; all pickets are georeferenced in UTM coordinates, including altitude (m a.s.l.) as a topographic variable (⇒ https://ppbiodata.inpa.gov.br/metacat/metacat/menger.192.1/default). Aquatic environments (marshes) and savannas were excluded from the sampling because they are not forest ecosystems.
All trees with a stem diameter ≥10 cm in each plot were inventoried and marked with numbered aluminum tags. POM (point of measure) height was adopted as a reference for measuring stem diameter. Most diameters were measured at 1.30 m above the ground, the exceptions being when the tree individual had buttress roots or other problems (e.g., bifurcated trees), making it necessary to reconfigure the POM to 0.5 m above the physical impediment, according to the tree-measurement protocol adopted by the study (⇒ https://ppbio.inpa.gov.br/sites/default/files/Protocolo_estrutura_vegetacao_2014_0.pdf). A diameter tape (model 283D/5m) was used to measure stem diameters. Plots have been censused annually since 2015, and all biometric measures are available through the Mendeley Data repository (⇒ https://data.mendeley.com/datasets/8cdwkhcsy7/2) and the ForestPlots platform (⇒ https://www.forestplots.net/) under the codes ETA, ETB, ETC, ETD, ETE and ETF.
All individuals were morphotyped, and botanical material was collected to enable the taxonomic identification of all trees to the lowest possible taxonomic level. Specimens were prepared and deposited in the INPA, MIRR and UFRR Herbaria (herbarium acronyms follow [47]). Scientific names were verified and corrected through the Brazilian Flora Species list. Family-level circumscriptions followed APG-IV ([1]). The species list for each plot ([40]) can be freely accessed at the Global Biodiversity Information Facility - GBIF (⇒ https://doi.org/10.15468/xa5lrb).
Wood density
Fieldwork was carried out in all 129 plots in two stages: January 2018 (269 samples in the 3rd tree census) and January 2019 (411 samples in the 4th tree census). Both were carried out during the dry season in order to maintain the same weather-pattern data collection. The collection of 680 samples (108 species, 82 genera, 38 families; except palms) was determined randomly considering 25% of the individual trees in each plot, regardless of the diameter class or species. A single sample was removed per stem (at ~1.30 m above the ground) using an increment borer (Haglof Borer Auger - 400 mm in length and 5.15 mm in diameter), as specified in the RAINFOR field manual to measure wood density in tropical forest trees (⇒ http://www.rainfor.org/upload/ManualsEnglish/wood_density_english%5B1%5D.pdf).
Collected samples were packed in plastic bags and kept in a cooler with ice to avoid dehydration. All samples were sent to the laboratory and separated into two segments: (i) core wood (material corresponding to heartwood + sapwood); and (ii) bark (internal + external = material corresponding to the space between the rhytidome and the cambium). The thickness (mm) and the wood densities (g cm-3) of the two segments were measured separately to obtain individual results and normalize the wood density values for each sampled tree applying a weighted average between bark and core wood. We followed this methodological step because the bark is generally an omitted component in wood-density studies ([49]). However, the bark is an important component in Amazon forest trees ([43]), and it should not be neglected in studies of wood density ([29]). The weighted average of the wood densities of the two components (using the radius = thickness of the bark and + core wood length as a single linear representation of the stem cross-sectional) is the most suitable value for use in estimates of woody biomass and carbon. This methodological approach was conceived with the aim of reducing the error associated with the wood-density values used to calculate the biomass and carbon of individuals dispersed in tropical ecosystems with high environmental variability. The weighted average WD values were calculated using the equation below (eqn. 1):
where WDw is the weighted average of the wood density (g cm-3), Barkth is the thickness of the bark (cm), WDbark is the bark wood density (g cm-3), Coreth is the wood core length (cm), WDcore is the core wood density (g cm-3), and Rtree is the tree radius estimated as thickness of the bark (cm) + wood core length (cm).
To calculate wood density (bark and core wood), the ratio of oven-dried mass (g) divided by the saturated (green) volume (g cm-3) was used ([49]). Saturated volume of each sampled segment was estimated using a graduated cylinder with distilled water on a precision balance (0.001 g). Each sampled segment was immersed in water, where its weight was measured by the displaced volume, considering the water density equal to 1 g cm-3, following the methodology indicated by Williamson & Wiemann ([49]). All sampled segments were dried in an oven (100 ± 2 °C) until constant weight was reached. As suggested by Barbosa et al. ([3]), we associated all wood density values using the categories adopted by the Brazilian Institute of the Environment and Renewable Natural Resources (IBAMA-[44]): very-soft wood species (< 0.350 g cm-3), soft (0.351-0.500 g cm-3), medium-soft (0.501-0.650 g cm-3), medium-hard (0.651-0.800 g cm-3), hard (0.801-0.950 g cm-3) and very-hard (> 0.951 g cm-3). This categorical distribution is useful for understanding the tendency of different sites to host species and/or individuals with higher (> 0.650 g cm-3) or lower (≤ 0.650 g cm-3) wood density. The raw dataset obtained in the current study can be freely assessed in international repositories ([21]).
Environmental variables
Soil samples for each plot were obtained by collection of two superficial subsamples (0-20 cm deep). The two sub-samples were homogenized (~500 g), air-dried and sieved (2 mm mesh). Values of edaphic variables were determined: clay content (%), organic matter content (mg kg-1), phosphorus content (mg kg-1), sum of exchangeable bases (K+ + Ca++ + Mg++ - cmol kg-1), sum of micronutrients (Fe, Zn, Mn, Cu and B - mg kg-1), and pH (H2O). Analyses were carried out following the analytical methods in the Brazilian Agricultural Research Corporation soil chemistry analysis manual (Manual de Métodos de Análise de Solo - ⇒ http://ainfo.cnptia.embrapa.br/digital/bitstream/item/104933/1/Manual-de-Mtodos-de-Anilise-de-Solo.pdf). A dataset for chemical and physical soil analyses is freely accessible via Mendeley Data (⇒ https://data.mendeley.com/datasets/gfw5ccbrsz/2). Altitude (m a.s.l., used here as a proxy for drainage) and planimetric coordinates (UTM) were obtained from the PPBio data repository (⇒ https://ppbiodata.inpa.gov.br/metacat/metacat/menger.192.1/default). Plots at ≤ 65 m a.s.l. were considered to be poorly drained (seasonally flooded), while those at > 65 m a.s.l. were considered to be free of flooding, following the criteria adopted by Villacorta et al. ([48]) for the eastern portion of Maracá. These categories correspond, respectively, to forests on shallow (≤ 65 m a.s.l.) and deep (> 65 m a.s.l.) water tables following the topographic classification adopted by Esteban et al. ([20]).
Statistical analysis
Regression models were used to investigate the relationship between the composition of the tree community in terms of wood density and considered environmental variables. Community composition was quantified using the specific average of each plot, here defined as the arithmetic mean of wood density (weighted between bark and core wood) using as reference the values (measured and estimated) of all tree individuals present in each plot. To obtain the specific average of each plot, we took the values of the species sampled for wood density (25% of the individuals) and replicated them for the other individuals of the same species present in the plot that were not sampled for wood density. The wood density of the species not sampled in the plots was resolved using the values obtained for the same species in the dominant forest type (ombrophilous, semideciduous or deciduous). When not available, we adopted the genus or family average - first within the plot and then by the dominant forest type.
The specific average of each plot represents the functional composition of the tree community at the species level. Therefore, differences in this mean between communities mix the effect of differences in species composition with that of intraspecific variation (e.g., due to phenotypic plasticity or local adaptation). To separate these sources of variation, we calculated the fixed average per plot, defined using mean wood densities of the species occurring in one plot, weighted by their respective relative abundances. The fixed average can only vary between plots if the species composition changes, and it thus represents interspecific variation, explaining the effect of species-substitution (turnover). Consequently, the difference between the specific average and the fixed average represents intraspecific variation ([24]), which explains the variation in the wood densities of the sampled individuals of a given species.
The proportion of total variation represented independently by the two community composition components (inter- and intra-specific variation), as well as covariation between them, was estimated using an ANOVA of the median densities recorded for wood ([24]). This only measures the relative contribution of inter- vs. intraspecific variation to changes in average wood density across plots but does not explain why the values of this average change, nor does it indicate how each of these two components responds to environmental variation. Accordingly, each of the two components was used separately as a dependent variable in a multiple-regression model, with environmental variables as predictors: (i) altitude (m a.s.l.); (ii) available phosphorus content; (iii) sum of bases (K + Ca + Mg); (iv) sum of micronutrients (Fe, Zn, Mn, Cu and B); (v) soil clay percentage (%); (vi) soil organic matter content; and (vii) pH. To visualize statistically significant effects, we used conditional graphs that showed variation in the dependent variable in relation to the primary predictor variable, using partial residuals ([8]). All analyses were performed using the R computational platform, ver. 3.6.3 ([36]) taking into account values specified in Tab. S1 (Supplementary material).
Results
Data description
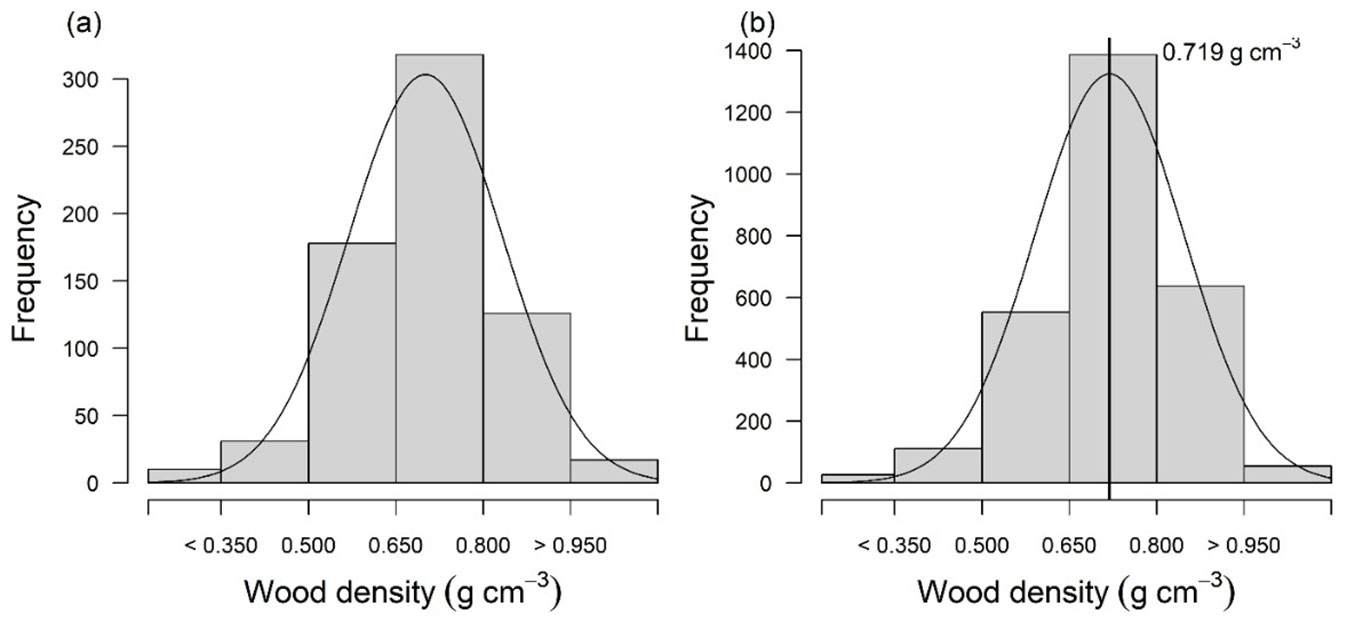
The weighted average wood density (± standard deviation, SD) for the tree assemblage in the ecotone forest in the eastern portion of Maracá was 0.703 ± 0.133 g cm-3 (range: 0.203-1.102 g cm-3 - Tab. 1, Tab. S2 in Supplementary material). The distribution of the wood density values of most of the individuals (69%) that we randomly sampled in the fieldwork was observed for the categories with WD > 0.650 g cm-3 (medium-hard = 315; hard = 134; very-hard = 19 - Fig. 2a). This sample distribution has a direct relation to the distribution of the total population of individuals present in all sampled plots (Fig. 2b).
Tab. 1 - Wood-density values distributed among the Brazilian Institute of the Environment and Renewable Natural Resources (IBAMA) categories: very-soft wood species (< 0.350 g cm-3), soft (0.351-0.500 g cm-3), medium-soft (0.501-0.650 g cm-3), medium-hard (0.651-0.800 g cm-3), hard (0.801-0.950 g cm-3) and very-hard (> 0.951 g cm-3). (Field samples): number of individuals sampled in each category; (Total trees): total trees present in the forest survey (except palms and indeterminate individuals); (Bark WD): bark density; (Core WD): density of sapwood + heartwood; (WD): weighted average between Bark WD and Core WD.
| WD Class | Sample (n) |
Total trees in the plots |
Bark thickness (mm) |
Bark WD (g cm-3) |
Core WD (g cm-3) |
Weighted average WD (g cm-3) |
|---|---|---|---|---|---|---|
| < 0.350 | 10 | 23 | 10.1 ± 5.2 | 0.371 ± 0.084 | 0.295 ± 0.041 | 0.296 ± 0.039 |
| 0.351-0.500 | 31 | 107 | 7.9 ± 4.0 | 0.529 ± 0.177 | 0.431 ± 0.035 | 0.432 ± 0.034 |
| 0.501-0.650 | 171 | 619 | 5.8 ± 3.5 | 0.552 ± 0.194 | 0.595 ± 0.038 | 0.595 ± 0.038 |
| 0.651-0.800 | 315 | 1162 | 5.5 ± 3.1 | 0.620 ± 0.185 | 0.717 ± 0.040 | 0.717 ± 0.040 |
| 0.801-0.950 | 134 | 699 | 4.5 ± 2.4 | 0.719 ± 0.208 | 0.865 ± 0.046 | 0.865 ± 0.046 |
| > 0.951 | 19 | 54 | 5.3 ± 2.0 | 0.675 ± 0.184 | 0.985 ± 0.033 | 0.983 ± 0.034 |
| Total (mean ± SD) | 680 | 2664 | 5.6 ± 3.3 | 0.616 ± 0.201 | 0.704 ± 0.134 | 0.703 ± 0.133 |
Fig. 2 - Frequency distribution of wood density for (a) samples (n = 680) and (b) total individuals (n = 2768).
The species with the lowest wood densities were Schefflera morototoni (Araliaceae, 0.324 ± 0.012 g cm-3) and Apeiba tibourbou (Malvaceae, 0.346 ± 0.111 g cm-3 - Tab. S2), both generally associated with well-drained plots (> 65 m a.s.l.). Peltogyne paniculata (Leguminosae, 0.921 ± 0.032 g cm-3) and Peltogyne gracilipes (Leguminosae, 0.902 ± 0.089 g cm-3) were the species with the highest wood densities, and they almost always occurred in plots located in seasonally flooded environments (≤ 65 m a.s.l.).
Wood density vs. environmental variables
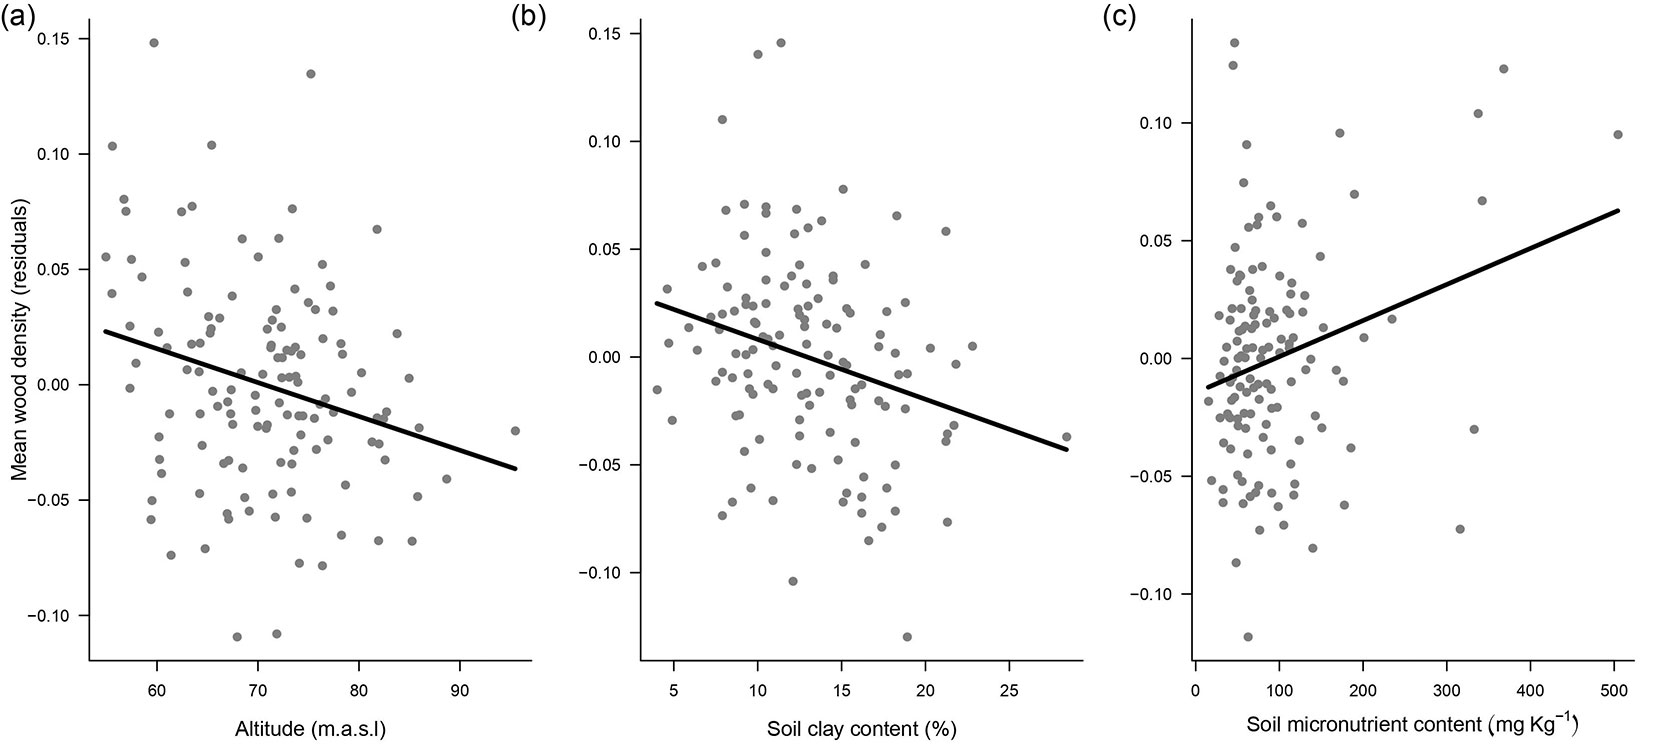
Altitude (a proxy for drainage), clay content and sum of micronutrients in the soil explained 23% of variation in mean wood density at the community level (Tab. 2). Regression models indicate negative relationships with altitude (Fig. 3a) and soil clay content (Fig. 3b), and a positive relationship with the sum of micronutrients (Fig. 3c). Mean wood density in seasonally flooded plots (≤ 65 m a.s.l.; n = 32; 0.742 g cm-3) was higher (t0.05 = 2.018; p = 0.0137) than that for plots in flooding-free areas (> 65 m a.s.l.; n = 97; 0.713 g cm-3). This result indicates that average wood density of tree communities occurring in seasonally flooded areas (low altitude) with low clay content (sandy soils) and high sum of micronutrients (especially those related to flooding periodicity) tend to be higher than for tree communities in flooding-free areas. There was no detectable spatial autocorrelation in the residuals of our models and, thus, no need for more-complex models (Fig. S1 in Supplementary material).
Tab. 2 - Regression models relating the variation in wood density to drainage (altitude), and physical and soil chemical properties in ecotone forests in northern Amazonia (n = 129). (SOM): soil organic matter; (***): p < 0.001; (**): p < 0.01; (*): p < 0.05.
| Response | R² | Predictor | Coefficient | t | P |
|---|---|---|---|---|---|
| Mean wood density | 0.23 | Intercept | 0.8535 | - | - |
| Altitude | -0.0015 | -2.533 | 0.013** | ||
| Clay content | -0.0028 | -2.382 | 0.019** | ||
| pH | -0.0036 | -0.189 | 0.850 | ||
| SOM | 0.0012 | 1.282 | 0.202 | ||
| Available P content | -0.0061 | -1.612 | 0.109 | ||
| Sum of bases | -0.0251 | -1.502 | 0.136 | ||
| Soil micronutrients | 0.0001 | 2.110 | 0.037* | ||
| Mean wood density due to species turnover |
0.26 | Intercept | 0.7856 | - | - |
| Altitude | -0.0015 | -2.816 | 0.006** | ||
| Clay content | -0.0023 | -2.179 | 0.031* | ||
| pH | 0.0139 | 0.805 | 0.422 | ||
| SOM | 0.0008 | 0.989 | 0.325 | ||
| Available P content | -0.0029 | -0.827 | 0.410 | ||
| Sum of bases | -0.0204 | -1.323 | 0.188 | ||
| Soil micronutrients | 0.0002 | 2.685 | 0.008** | ||
| Mean wood density due to intraspecific variation |
0.14 | Intercept | 0.0679 | - | - |
| Altitude | -0.0000 | -0.142 | 0.887 | ||
| Clay content | -0.0004 | -1.018 | 0.310 | ||
| pH | -0.0104 | -1.470 | 0.144 | ||
| SOM | 0.0003 | 0.999 | 0.320 | ||
| Available P content | -0.0032 | -2.278 | 0.024* | ||
| Sum of bases | -0.0048 | -0.767 | 0.445 | ||
| Soil micronutrients | 0.0000 | 0.952 | 0.343 |
Fig. 3 - Mean wood density (n = 129 plots) vs. (a) altitude, (b) clay content and (c) soil micronutrients.
Intra- and inter-specific variability in wood density
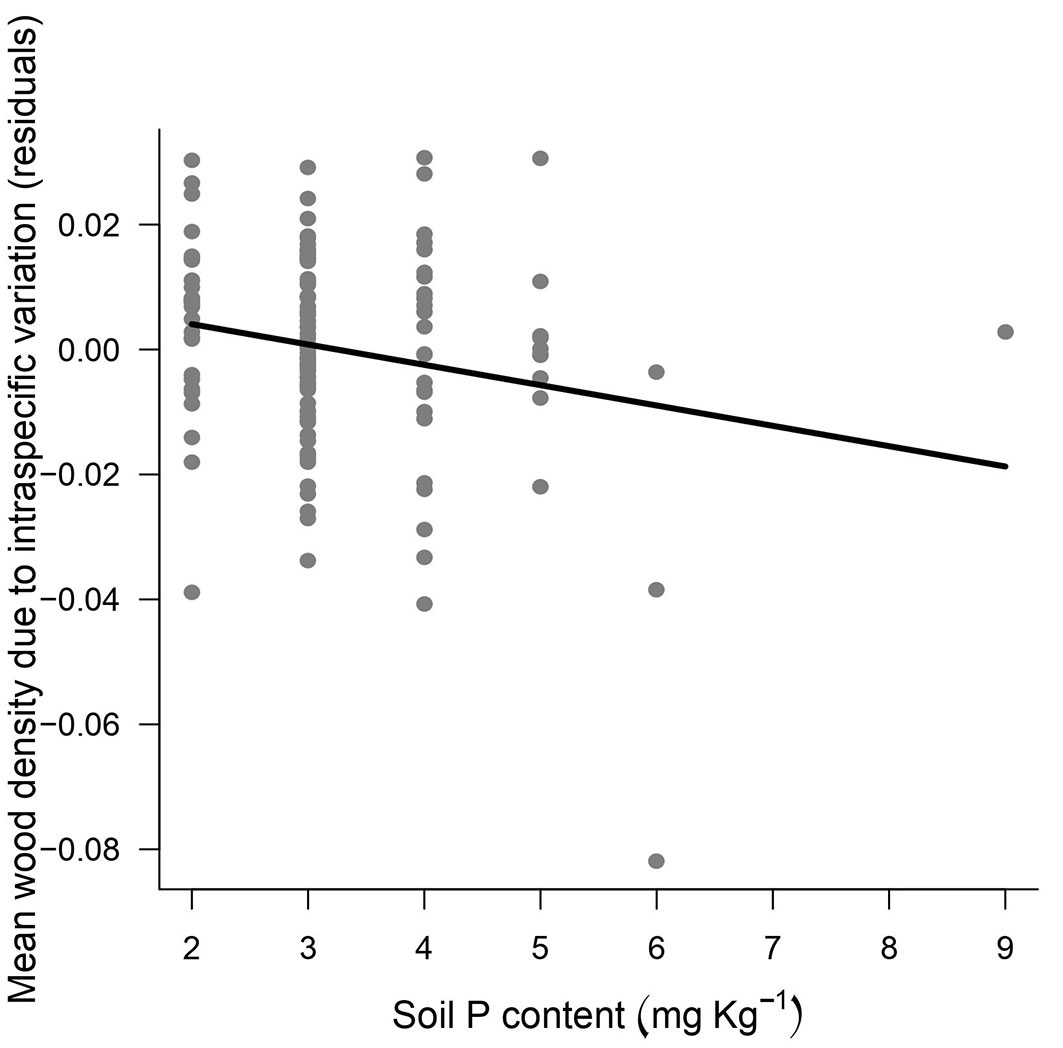
Separation of the variation in wood density into components explained by species-substitution (turnover) and intraspecific variation revealed that substitution explained most of the total variation (86%), with ~13% of the variation attributed to intraspecific variation for the wood densities sampled (Fig. 4). The species-substitution component responded similarly to the patterns previously observed for environmental variables (hydro-edaphic and topographic conditions). Thus, altitude, clay content and sum of micronutrients were slightly better predictors in the case of species substitution and explained 26% of the variation in wood density (Tab. 2). By contrast, phosphorus content explained 15% of the intraspecific variation in wood density (Fig. 5), so that individuals occurring in more phosphorus-rich soils tend to have lower wood density.
Fig. 4 - Decomposition of the variation of wood density into components of species substitution and intraspecific variation.
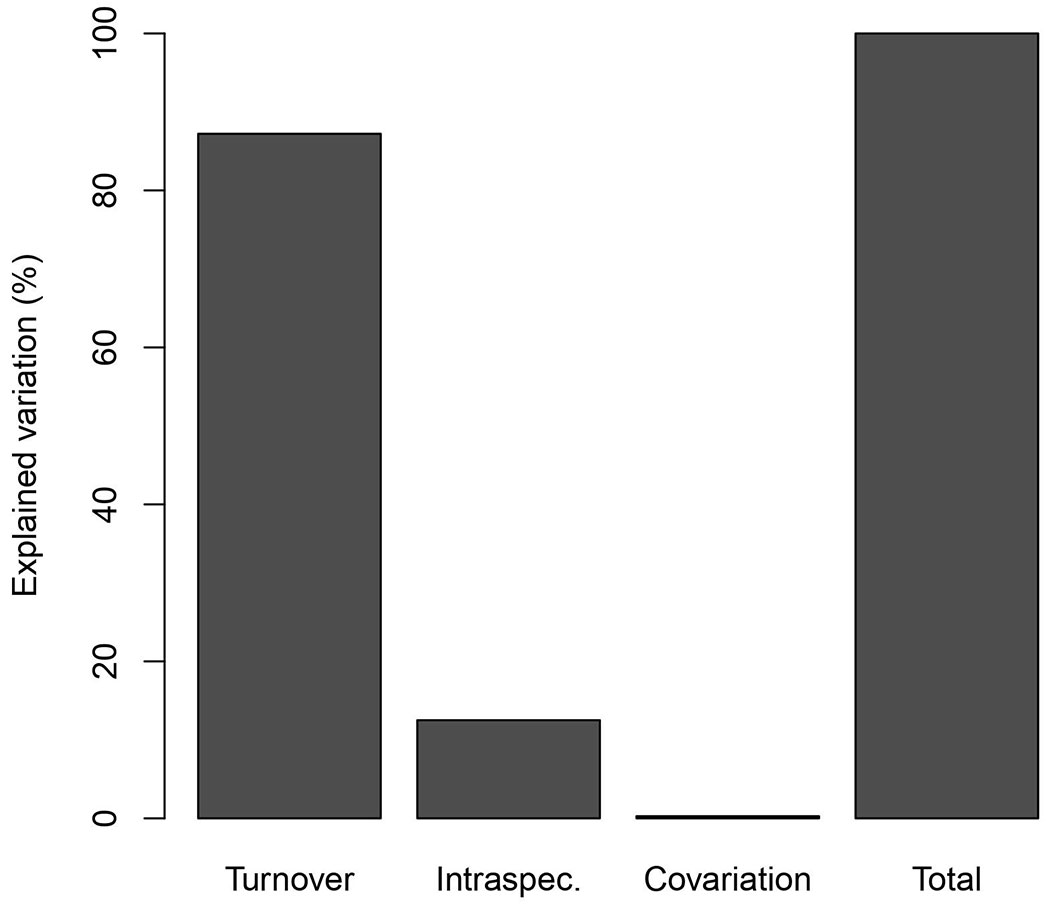
Fig. 5 - Intra-specific variation in wood density versus soil phosphorus content in ecotone forests in the eastern portion of Maracá Island.
Discussion
Biases in wood density estimates
WD estimates are subject to various kinds of biases. In our study we used samples taken at breast height using an increment borer, which allows living trees to be sampled without felling them. Each sample consists of a cylindrical core taken from the bark to the center of the trunk. In our study we separated the bark from the core wood and used a weighted average of their respective densities based on a linear fraction (radius) of the stem cross-sectional represented by each, thus eliminating one of the biases inherent in this method. However, the core wood was not separated into its components (sapwood and heartwood). The heartwood is over-represented in the sample because, being located in the center of the trunk, each centimeter of the core in the heartwood corresponds to a smaller-diameter circle than a centimeter in the sapwood portion of the core. In almost all Amazonian trees the heartwood is denser than the sapwood (in contrast to many temperate-zone trees), resulting in an upward bias in the estimated wood density. A rough estimate of the magnitude is provided by information from other parts of Brazilian Amazonia ([22]). Based on 57 species from sites near Santarém in the state of Pará, an average of 9.7% of the commercial volume is sapwood, and, based on 33 species near Manaus, Amazonas, the density of the sapwood averages 94.7% of the density of the corresponding heartwood; these values together imply a 0.52% upward bias. The amount of bias varies with the diameter distribution of the forest and with forest type, for example between central and southern Amazonia ([30]).
Another bias in the same direction results from the samples being taken only at the DBH height, as wood density decreases along the length of the trunk. For example, based on 12 species near Manaus, the average wood density at the midpoint of the commercial bole (the trunk to the first significant branch) is 7.1% lower than the density at the DBH height ([22]). The relationship between density at the DBH height and that of the entire bole varies with forest type, as between central and southern Amazonia ([30]).
These biases affect virtually all estimates of WD made based on cores from increment borers, such as those from important network of plots surveyed by the Biodiversity Research Program (PPBio: ⇒ https://ppbio.inpa.gov.br/) that includes the Maracá plots used in the present study. These biases affect estimates of carbon stocks and of greenhouse-gas emissions from deforestation that are based on WD data from increment-borer cores but do not affect our conclusions on the importance of intra- and inter-specific variability in driving the divergences in woody biomass.
Wood density vs. environmental variables
Our study relating environmental conditions to intra- and inter-specific spatial variation in WD is the first to deal with tree species assemblages that occur in ecotone forests in the northern Brazilian Amazon. The results indicate that average WD of tree communities occurring in seasonally flooded areas (shallow water table) with low clay content (sandy soils) and high sum of micronutrients (especially those related to flooding periodicity) tend to be higher than those tree communities in flooding-free habitats. Our investigation revealed that environmental characteristics explain differences between intra- and inter-species values, as previously observed in other regions of the Amazon ([2], [26], [11], [34]). However, we also separated community-based spatial variation in WD into categories of species substitution and intraspecific variation, revealing their divergent responses to environmental variation, and suggesting the presence of overlooked patterns in tree adaptive response to hydro-edaphic variation. This integrated analytical approach helps improve understanding of how variation in WD occurs spatially, reducing the degree of uncertainty in an especially important variable for calculating carbon and biomass stocks in Amazonian forest ecosystems.
In general, the values we determined for each species (range: 0.203-1.102 g cm-3) lay within the ranges of values cited in databases for tropical-forest species ([11], [52]). However, our community-averaged mean wood density (0.719 cm-3) is 12% higher when compared with the general average value presented by Nogueira et al. ([29]) for forests in the Brazil’s “arc of deforestation” (0.642 cm-3), or 7.3% (0.67 g cm-3) to 23.9% (0.58 g cm-3) higher when compared to the results obtained by Baker et al. ([2]) in different Amazonian regions. These differences indicate a relation to the intrinsic characteristics of the studied ecotone forests, especially the higher hydro-edaphic restrictions that characterize some lowlands areas on the eastern portion of Maracá. Most of these areas are seasonally flooded (shallow water table) where poor sandy soils (low clay content) associated with large sums of Fe, Zn, Mn and Cu predominate. Limitation of forest productivity from toxicity caused by either micronutrient deficiency or by excessively high concentrations of micronutrients is not common in tropical soils ([5]). However, higher availability of micronutrients associated with waterlogged tropical soils can reach toxic levels for some plants, conferring more restricted aspects to the habitat ([17]). In addition, areas in the eastern portion of Maracá with higher environmental restrictions are generally populated by Peltogyne gracilipes ([28], [48]), a monodominant species characterized by high wood density (0.901 g cm-3).
The relationship between WD and more/less restricted environmental characteristics has already been commented on for other regions of the Amazon ([33], [2], [50]). This relationship also holds in the case of Maracá, since the species with highest abundances in the locality (P. gracilipes, Ecclinusa guianensis and Lecythis corrugata - see [40]) have high WD values and occur preferably in ecotone-forest areas with strong environmental restrictions. Our results are different from those of Costa et al. ([15]), who reported that lower WD values are characteristic of environments with shallow water tables (seasonally flooded). However, our findings were similar to those reported by Souza ([42]) in the Viruá National Park (Roraima), a forest formed by contact between seasonally flooded oligotrophic ecosystems and open forests with poor soils, where a set of sampled trees had a higher mean WD (0.700 g cm-3) when compared with other Amazonian regions. This environmental conditioning, where drier regions in northern Brazilian Amazonia can transform seasonally flooded areas into zones with enough moisture to support a strong dry season and induce plant production with slow growth, can promote species with higher wood density values (e.g., P. gracilipes). Our findings imply that, in ecotone forest areas with high environmental restrictions in northern Amazonia, a group of a few species with both higher WD and higher abundance can lead to a higher community-averaged WD, considering the entire tree assemblage.
Intra- and inter-specific variability in wood density
Our results showed that, in tree assemblages occurring in ecotone forests in the eastern portion of Maracá, environmental variables such as altitude, clay content and soil micronutrients determined most of the variation in wood density, with about 13% of the explained variation being attributed to intraspecific variation in wood density. The negative relationship between the altitudinal gradient and wood density differs from results in the central Amazon region reported by Cosme et al. ([14]). These authors found that altitude controls the availability of water in the soil, and, in response to water stress, plants develop physiological adaptations (e.g., smaller average stem diameter, smaller average stem area and less sapwood area), resulting in high-density wood for improved hydraulic tolerance at higher altitudes ([23], [32]). However, in our study area the physical and soil chemical properties are acting in the opposite way.
We found species with the highest wood density values in seasonally flooded areas with strong hydro-edaphic restrictions (e.g., poorly drained soils with temporary anoxia), indicating that habitat heterogeneity is selecting species with phenotypic traits adapted to local environmental conditions ([26], [45]). This result indicates that most tree species adapted to seasonally flooded areas (temporary anoxia) in the ecotone forests of Maracá tend to have lower growth rates due to an environment characterized by stressful edaphic conditions, which explains their higher wood-density values. The relation between temporal anoxia, lower growth rates and higher wood density values cannot be applied in a general way to other types of forests in the Amazon that have environmental characteristics similar to those analyzed in the eastern portion of Maracá. This could produce errors in biomass and carbon calculations that would be difficult to correct.
Most of the between-plot variation was due to changes in species composition, where plots located on seasonally flooded areas have mean wood density 4% (0.742 g cm-3) higher than those in flooding-free areas (0.713 g cm-3). In addition, when we isolated only intraspecific variation, wood density appears to depend on soil phosphorus levels. Condit et al. ([13]) indicated that phosphorus availability in soils, which is a limiting resource in Amazonian forests, is primarily responsible for the distribution of species on environmental gradients. Species that have a wide distribution along the phosphorus gradient may have genetically specialized populations in P-poor habitats as part of an evolutionary strategy to improve the plant’s hydraulic architecture and increase stem longevity ([32]). On the other hand, Zalamea et al. ([51]) suggested that phosphorus-dependent growth rates provide an additional explanation for the distribution of pioneer tree species with high phosphorus demand; these are species that naturally have lower wood density. The results at Maracá agree with this logical tendency, where the most-restricted habitats have trees that grow more slowly and produce denser wood. At Maracá the habitats with hydro-edaphic restrictions (seasonally flooded areas) also have poor soils characterized by low levels of phosphorus, and the main species in this habitat (P. gracilipes) has high wood density and a slow growth rate.
Finally, our study advances the understanding of factors determining wood-density variability in ecotone forests in the northern Brazilian Amazon, allowing to improve estimates of woody biomass and carbon stocks in this poorly studied region. For example, we recalculated the above-ground live biomass estimated in Maracá by Nascimento et al. ([27]) using our wood-density dataset ([21]) instead of the data used by the authors from global repositories ([52]). We calculated that the above-ground live biomass values presented by these authors were underestimated by from 1.4% to 16.3% for the main forest types occurring in Maracá (Tab. 3). This local example shows that, despite the recent advances related to data on wood density, it is still necessary intensify our understanding of how environmental filters determine spatial patterns of wood density in the forests of the northern Brazilian Amazon. This advance is needed to improve the current estimates of carbon and biomass stocks in the Amazon because, in general, wood-density data are derived from databases generated in the eastern, western, or central Amazon or in other tropical regions of the world. Biomass is proportional to wood density, and, because of the vast areas of Amazonian forests, small percentage differences in these estimates correspond to very large amounts of carbon.
Tab. 3 - Differences in the aboveground live biomass (Mg ha-1) in ecotone forests of the eastern portion of Maracá Island considering new wood density values for the study area. (FWP): forest without Peltogyne (flooding-free areas located on flat relief); (PPF): Peltogyne-poor forest (slopes occasionally covered by rocky fragments); (PRF): Peltogyne-rich forest (poorly drained soils - seasonally flooded), following previous values and definitions of Nascimento et al. ([27]).
| Types | Previous values ([27]) |
Current values (this study) |
Change in stand biomass (%) |
|---|---|---|---|
| FWP | 363.35 | 368.29 | + 1.36 |
| PPF | 433.88 | 462.65 | + 6.63 |
| PRF | 422.97 | 492.14 | + 16.35 |
Conclusion
Wood density variation between tree communities in ecotone forests studied in Maracá Island is partially driven by hydro-edaphic conditions. Overall, our results indicate that most of the between-plot variation in wood density was due to changes in species composition. Analysis of interspecific variability indicates that forests occurring in environments with higher hydro-edaphic restrictions (e.g., seasonally flooded soils) contain species with higher wood density than those environments with lesser restrictions (e.g., non-flooded soils). Our study advances the understanding of factors determining the variability of tree wood density in regional ecotone forests, allowing improvement of estimates of the woody biomass and carbon stocks in the forests of the northern Brazilian Amazon.
Acknowledgments
HLSF helped to draft the manuscript and carried out the field and laboratory measurements; PACLP performed the statistical analysis; WRS and LCSC helped the field measurements; VFM conceptualized the soil analysis; ROP performed the taxonomic identification; PMF translated the text to the English language and helped to draft the manuscript; RIB conceived the study and helped to draft the manuscript.
Financial support was provided by Conselho Nacional de Desenvolvimento Científico e Tecnológico (CNPq - Grant 403591/ 2016-3; project “Tree growth and mortality in Roraima ecotone forests: effects of environmental conditions and climate variability”). The Coordenação de Aperfeiçoamento de Pessoal de Nível Superior (CAPES) provided a postdoctoral fellowship for PACLP, while PELD Roraima (CNPq/CAPES/FAPs/BC-Fundo Newton: 441575/2016-1) provided PhD fellowships for HLSF and WRS. CNPq provided research fellowships for RIB (304204/2015-3) and PMF (311103/2015-4, 312450/2021-4) and a PhD scholarship for ROP (142243/2015- 9). The Instituto Nacional de Ciência e Tecnologia dos Serviços Ambientais da Amazônia (INCT-ServAmb), and the Biodiversity Research Program (PPBio), both financed by the Brazilian Ministry of Science, Technology and Innovation (MCTI), provided technical support. The Instituto Chico Mendes de Conservação da Biodiversidade (ICMBio) authorized the work in the Maracá Ecological Station (SISBIO no. 52017).
References
CrossRef | Gscholar
CrossRef | Gscholar
Gscholar
CrossRef | Gscholar
CrossRef | Gscholar
CrossRef | Gscholar
CrossRef | Gscholar
CrossRef | Gscholar
CrossRef | Gscholar
CrossRef | Gscholar
Gscholar
Gscholar
Authors’ Info
Authors’ Affiliation
Pedro Aurélio Costa Lima Pequeno 0000-0001-7350-0485
Williamar Rodrigues Silva 0000-0001-7025-9374
Universidade Federal de Roraima - UFRR, Programa de Pós-graduação em Recursos Naturais - PRONAT, Campus Paricarana, Boa Vista, Roraima (Brazil)
Universidade Federal de Roraima - UFRR, Departamento de Solos e Engenharia Agrícola, Campus Cauamé, Boa Vista, Roraima (Brazil)
University of Exeter, Prince of Wales Road, Exeter, Devon, EX4 4SB (UK)
Instituto Nacional de Pesquisas da Amazônia - INPA, Programa de Pós-graduação em Botnica - PPGBOT, Manaus, Amazonas (Brazil)
Reinaldo Imbrozio Barbosa 0000-0002-7482-346x
Instituto Nacional de Pesquisas da Amazônia - INPA, Núcleo de Pesquisas de Roraima -NPRR, Boa Vista, Roraima (Brazil)
Instituto Nacional de Pesquisas da Amazônia - INPA, Coordenação de Dinmica Ambiental - CODAM, Manaus, Amazonas (Brazil)
Corresponding author
Paper Info
Citation
Farias HLS, Pequeno PACL, Silva WR, Melo VF, Carvalho LCDS, Perdiz RDO, Citó AC, Fearnside PM, Barbosa RI (2023). Amazon forest biomass: intra- and interspecific variability in wood density drive divergences in Brazil’s far north. iForest 16: 95-104. - doi: 10.3832/ifor4137-016
Academic Editor
Chris Eastaugh
Paper history
Received: May 13, 2022
Accepted: Jan 13, 2023
First online: Mar 21, 2023
Publication Date: Apr 30, 2023
Publication Time: 2.23 months
Copyright Information
© SISEF - The Italian Society of Silviculture and Forest Ecology 2023
Open Access
This article is distributed under the terms of the Creative Commons Attribution-Non Commercial 4.0 International (https://creativecommons.org/licenses/by-nc/4.0/), which permits unrestricted use, distribution, and reproduction in any medium, provided you give appropriate credit to the original author(s) and the source, provide a link to the Creative Commons license, and indicate if changes were made.

Web Metrics
Breakdown by View Type
Article Usage
Total Article Views: 27655
(from publication date up to now)
Breakdown by View Type
HTML Page Views: 21553
Abstract Page Views: 3461
PDF Downloads: 2218
Citation/Reference Downloads: 3
XML Downloads: 420
Web Metrics
Days since publication: 1228
Overall contacts: 27655
Avg. contacts per week: 157.64
Article Citations
Article citations are based on data periodically collected from the Clarivate Web of Science web site
(last update: Jul 2026)
(No citations were found up to date. Please come back later)
Publication Metrics
by Dimensions ©
Articles citing this article
List of the papers citing this article based on CrossRef Cited-by.
Related Contents
iForest Similar Articles
Research Articles
The potential of using xylarium wood samples for wood density calculations: a comparison of approaches for volume measurement
vol. 4, pp. 150-159 (online: 11 August 2011)
Research Articles
Validation of models using near-infrared spectroscopy to estimate basic density and chemical composition of Eucalyptus wood
vol. 17, pp. 338-345 (online: 03 November 2024)
Research Articles
Variation of wood and bark density and production in coppiced Eucalyptus globulus trees in a second rotation
vol. 9, pp. 270-275 (online: 08 September 2015)
Short Communications
Effect of intensive planting density on tree growth, wood density and fiber properties of maple (Acer velutinum Boiss.)
vol. 9, pp. 325-329 (online: 22 October 2015)
Research Articles
Physical, chemical and mechanical properties of Pinus sylvestris wood at five sites in Portugal
vol. 10, pp. 669-679 (online: 11 July 2017)
Research Articles
Earlywood vessel features in Quercus faginea: relationship between ring width and wood density at two sites in Portugal
vol. 8, pp. 866-873 (online: 27 April 2015)
Technical Advances
Technical properties of beech wood from aged coppices in central Italy
vol. 8, pp. 82-88 (online: 04 June 2014)
Research Articles
Interaction between planting spacing and wood properties of Eucalyptus clones grown in short rotation
vol. 14, pp. 12-17 (online: 02 January 2021)
Review Papers
Pathways to increase supply of sustainable wood from planted forests and trees to address bioeconomy needs: a review
vol. 19, pp. 168-185 (online: 12 May 2026)
Research Articles
The effects of forest management on biodiversity in the Czech Republic: an overview of biologists’ opinions
vol. 15, pp. 187-196 (online: 19 May 2022)
iForest Database Search
Search By Author
Search By Keyword
Google Scholar Search
Citing Articles
Search By Author
Search By Keywords
PubMed Search
Search By Author
Search By Keyword


