Impact of climate change on radial growth of Siberian spruce and Scots pine in North-western Russia
iForest - Biogeosciences and Forestry, Volume 1, Issue 1, Pages 13-21 (2008)
doi: https://doi.org/10.3832/ifor0447-0010013
Published: Feb 28, 2008 - Copyright © 2008 SISEF
Research Articles
Abstract
When adapting forest management practices to a changing environment, it is very important to understand the response of an unmanaged natural forest to climate change. The method used to identify major climatic factors influencing radial growth of Siberian spruce and Scots pine along a latitudinal gradient in north-western Russia is dendroclimatic analysis. A clear increasing long-term trend was identified in air temperature and precipitation. During the last 20 years, all meteorological stations experienced temperature increases, and 40 years ago precipitation began to increase. This is shown by the radial increment of Siberian spruce and Scots pine. Therefore, climate change could partly explain the increased forest productivity. The total variance explained by temperature varied from 22% to 41% and precipitation from 19% to 38%. The significant climatic parameters for radial increment in Komi Republic were identified, and the relation between temperature and precipitation in explained variance changes over time for Siberian spruce.
Keywords
Climate change, Growth trends, Pinus sylvestris L., Picea obovata Ledeb., Dendrochronology
Introduction
Climatic changes including a lengthening growing season ([31]), increasing CO2 and nitrogen deposition ([29], [39], [40], [41]) are assumed to cause increased forest growth. Climate change has been defined at global and local scales ([8], [22], [30], [32], [34]). Predictions of the future development of forest resources cannot be made without studying the response of trees to climate change.
Previous results indicate that northern forest ecosystems are among the regions at greatest risk from the impacts of climate change ([14]). According to IPCC ([14]), warming trends have already started and in the future will increase. Most studies attribute the warming trends to accumulation of greenhouse gas ([14]).
In Europe, most forests are managed, except for those in north-western Russia, where there is a dominance of old-growth natural forests. It is important to understand the response of unmanaged natural forest to changing climate because it is possible to adapt forest management practices to a changing environment ([28]). Dendroclimatic analysis can be used to identify the major climatic factors that influence radial growth of tree species.
The largest administrative region of North-western Russia (forest area of Komi Republic is 33% of total North-western Russia’s forest area) was selected for the assessment of long-term forest growth trends. Komi is situated at the eastern boundary of the European part of Russia, in the boreal region where large areas of natural forest still exist. Borehole temperature measurements in Komi Republic indicate strong subsurface warming, reflecting changes in the trends of both surface air temperature and solid precipitation ([36]).
The main objective of this research is to investigate the effect of climate change on radial growth of Siberian spruce (Picea obovata Ledeb.) and Scots pine (Pinus sylvestris L.) in north-western Russia (Komi Republic).
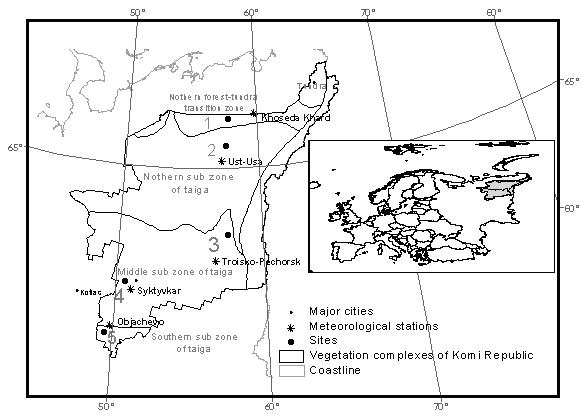
Climatically, Komi (Fig. 1) lies within the Arctic, Atlantic-Arctic and Atlantic-Continental provinces ([42]). Annual mean temperature varies between +1° C in the southern part of the republic and -6° C in the northern part, with the lengths of the growing season (days with mean temperature above +10° C) being 10 - 45 days. Annual rainfall decreases from 700 mm in the south to 450 mm in the north. Characteristic for the winter period, which lasts 130 - 200 days is accumulation of a thick snow cover (70-80 cm - [10]). The territory of Komi is characterized by surplus moisture. Mean annual evapotranspiration is significantly lower than annual rainfall (Tab. 1).
Tab. 1 - Climatic characteristics in different taiga sub zones in Komi ([10]).
| Sub zone of taiga boreal forest | Vegetation period, days | Precipitation, mm | Annual evapotranspiration, mm | |
|---|---|---|---|---|
| May - October | October - April | |||
| Northern forest - tundra transition zone | 117 | 235 | 190 | 125 |
| Northern taiga | 143 | 290 | 190 | 175 |
| Middle taiga | 158 | 330 | 260 | 200-250 |
| South taiga | 177 | 370 | 250 | 300 |
The vegetation cover of Komi is dominated by Middle and Northern taiga forests, with the exception of mountainous parts of the republic where forest-tundra and tundra ecosystems have developed ([24]). Boreal vegetation is dominated by Scots pine (Pinus sylvestris L.), Siberian spruce (Picea obovata Ledeb.) and Siberian fir (Abies sibirica Ledeb.). Downy birch (Betula pubescens Ehrh.) forests are the first stages of post-fire succession, frequently with abundant aspen (Populus tremula L.).
Forests with Siberian spruce in Komi reach 16 mln. ha, i.e., 60% of the whole forest area. Siberian spruce in optimal conditions could reach a height of 35-40 meters and 90-110 cm diameter at breast height. Scots pine is distributed on 24% of the forest area and represents 23% of the total growing stock. The forest stands with high productivity are concentrated in the middle boreal zone of Komi. The mean heights are about 22-24 m, and the mean diameter is 28-30 cm with a growing stock of 160-190 m3 ha-1 ([23]).
Komi is the most forest-rich region in north-western Russia. The forested area includes about 300 000 km2, making up 4.1% of Russian forested areas. The total stock of wood in the forests of Komi reaches 2855.8 mln. m3. The mean volume of wood is about 80-100 m3 ha-1. In southern regions the mean standing volume is 300 m3 ha-1.
Material and methods
Selection of sites and trees
The material was collected along a transect from the south of Komi (south taiga sub-zone of boreal forests) to the Arctic spruce timberline. The sampled stands were at similar altitudes. The study stands were grouped into “sub-zones” according to their geographical position in the taiga sub-zones of boreal forests. Totally 261 trees were collected in 5 sub-zones of taiga forests in Komi (Fig. 1, Tab. 2) and 696.929 tree rings were measured.
Tab. 2 - Tree ring data collected in Komi Republic in 2003-2005. (§) The Scots pine trees not found in forest-tundra transition zone.
| Site | Forest zone | Location coordinates | Siberian spruce | Scots pine | Distance to meteo- station, km | Meteo-station, analysed period | ||||
|---|---|---|---|---|---|---|---|---|---|---|
| n trees | Time Span | Min-Max Mean | n trees | Time Span | Min-Max Mean | |||||
| 1 | Forest - tundra transition zone(§) | 66°41’260” N 56°49’142” E | 16 | 1812 2005 | 71-192 115.6 | - | - | - | 125 | Khoseda - Khard, 1933-1995 |
| 2 | Northern taiga zone | 65°59’697” N 57°48’820” E | 16 | 1878 2005 | 37-126 75.3 | 20 | 1924 2005 | 52-80 69.3 | 42 | Ust-Usa, 1936-2003 |
| 3 | Middle taiga zone (west) | 61°44’834” N 50°34’910” E | 40 | 1779 2005 | 38-225 104.3 | 45 | 1786 2005 | 34-218 93.6 | 30 | Syktyvkar, 1896-2004 |
| 4 | Middle taiga zone (east) | 63°25’294” N 57°57’597” E | 51 | 1826 2005 | 27-176 91.3 | 21 | 1842 2005 | 142-163 152 | 130 | Troitsko-Pechersk, 1893-2004 |
| 5 | South taiga zone | 60°33’615” N 49°26’945” E | 30 | 1917 2005 | 18-89 52.8 | 22 | 1877 2005 | 28-127 73 | 38 | Objachevo, 1944-2004 |
| Total: | 153 | - | - | 108 | - | - | Mean 73 | - | ||
The sites were selected using GIS datasets of forest management units, old forest inventory maps and satellite images TERRA ASTER (scene size 60x60 km) with a spatial resolution of 15 m. In the procedure for site selection the main aim was to find the most common site types and at the same time exclude possible forest management or any other human impact from the past. Sites with a low productivity index (5 class, according to the classification system for Russian forest productivity) represents 70% of the forest area of Komi Republic ([23]). The sites were selected to minimize the differences in exposure, soil properties, topography or vegetation development. To obtain information about changes in site productivity trees of different ages and comparable sites were selected. The trees were randomly sampled on sites of low fertility.
The stands were selected according the following criteria for site conditions:
- spruce or pine dominating species;
- low site index (5 class, according to the Russian forest productivity classification system ([47]);
- multistoried mature stands represented by trees of 3-5 different age classes.
In most of the regions in Komi the forest stands are multistoried. Therefore the sample trees were chosen from among trees not dominated by older trees but rather located in openings within the stand. The sample trees were expected to reveal homogeneity in their tree-ring pattern; they showed no obvious signs of near-neighbour competition or forest management. Trees were chosen from different diameter classes, healthy looking with straight, unbroken stems and regularly shaped crown. Mature dominant trees without visible signs of damage were selected as sample trees. The sample trees in the stands were expected to have a common growth trend, which was influenced by a large portion of the climatic effects and other factors which differ among individuals and from site to site. At each site an averaging process, during building chronology, helped to minimize the influence of other factors.
Prior to felling, for visual assessment of the tree ring pattern, a core from each tree was extracted with an increment borer. This allowed exclusion of those trees affected by competition in the past. Siberian spruces and Scots pines were sampled at breast height (1.3 m above the ground). In most cases, discs were cut using a chain saw. If it was difficult to cut discs, cores were extracted from trees with the increment borer from two radii per tree (the first one oriented to the north, the others at 90°-120° to the first). Geographical coordinates of sample trees were measured using GPS.
Meteorological data
Monthly precipitation sums and air temperature means from 5 climate stations (WMO numbers 22996, 23804, 23711, 23412, 23219) were obtained from the Center of Meteorology and Environment Monitoring of Komi Republic (Fig. 1, Tab. 2) and the public archives ([38] [44]). Climate records were checked for consistency and homogeneity ([38]). Meteorological data were used for identification of dendroclimatic relationships and long-term trends in climate change. To identify long-term trends in climate, the deviations in absolute units from the long-term mean were calculated for the common period. The deviations were then smoothed with a 30-year running mean.
Chronology development
Radial increments were measured to an accuracy of 0.01 mm. During the process of measurement, the raw measurements of tree rings were cross-dated using visual control, by comparing the series graphically. Cross-dating and data quality were assessed using the computer program COFECHA ([11], [13]).
To maximize the climatic signals in tree ring series, other factors should be minimized. For example, a typical sample might display exponentially declining growth with age, the classic biological growth curve. Standardizing the sample using a spline curve results in data values that represent a departure from the “expected” value for a given year. This departure from the expected mean value is then used to interpret a proxy environmental signal in the data. The above-mentioned procedure usually is an attempt to remove the growth trends due to normal physiological ageing processes and changes in the surrounding forest community. Therefore individual ring-width series were indexed using spline curves of 60 years with a frequency response of 50%. This approach was selected due to the high amount of variance in the dataset because of using the trees from different age cohorts for chronology building.
The common interval (1954 - 2003) adjusted for order of the pooled autoregressive model was used for analysis of climate-growth relationships. Indices were further prewhitened using Box Jenkins methods of autoregressive and moving average time series modelling (ARMA - [3], [6], [35]). The order of the autoregressive-moving mean process was determined by Akaike Information Criteria ([1], [6]). Prewhitening allows us to transform autocorrelated series into a series of independent observations by extracting residuals from the modelled process. Chronologies were produced by averaging the annual values of indices. The software ARSTAN ([11], [13]) was used to calculate chronologies from tree-ring measurement series by detrending and indexing (standardizing) the series, then applying a robust estimator of the mean value function to remove the effects of endogenous stand disturbances.
Residual ARSTAN chronologies containing high frequency variation were used to examine climate-growth relationships on an interannual basis.
Chronology confidence was determined using statistics of Expressed Population Signal (EPS - [46]). EPS was computed as a function of mean inter-tree correlation and sample size. In general, it can be assumed that values of EPS equal to or greater than 0.85 are indicators of reliable chronology ([7]). Here EPS was computed over the time window of 50 years (1954-2003).
Statistical analysis of growth-climate relationships
Response function analysis ([7]) was applied to determine which monthly weather variables significantly affected high frequency variation in radial increment of Scots pine and Siberian spruce. The monthly mean air temperature and monthly sums of precipitation were used to analyse the response of trees to current and previous years. The DENDROCLIM2002 software was applied for the analysis, using bootstrapped confidence intervals to estimate the significance of both correlation and response function coefficients and testing their significance at the 0.05 level. The temporal stability of dendroclimatic relationships was illustrated using correlation coefficients of significant (p < 0.05) climate variables and tree-ring chronologies for running 25-year periods. The amount of variance in tree-ring chronologies explained by climatic parameters was calculated using the software PRECON. The DENDROCLIM2002 software was used for computation of the response function coefficients instead of PRECON due to the difference in the way in which final coefficients are estimated (mean in PRECON, median in DENDROCLIM2002). The response function coefficients were calculated for the common interval of the current year and the year prior to growth from May to August.
Results
Site chronologies
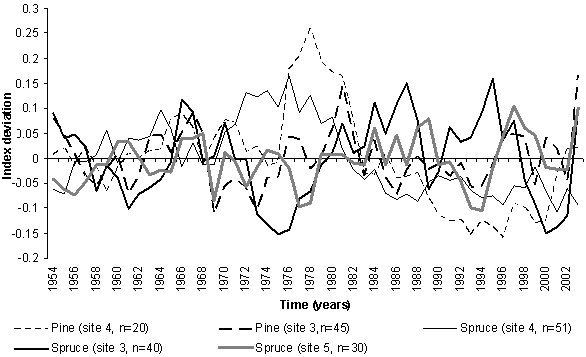
Using collected samples 9 site chronologies of Scots pine and Siberian spruce radial increments were constructed for 5 sites. The expressed population signal (EPS) of chronologies was calculated for the common interval (1954 - 2003). Five of nine chronologies (Tab. 3) are within the well-accepted EPS threshold of 0.85 ([7]). However some of the chronologies are covering longer time interval, starting from 1786, and this time interval cannot be used for the extraction of common climatic signal due to the fact that prior 1954 EPS statistics were worse. Therefore the only 5 site chronologies (Fig. 2), that are representative of the true population during the common period, were selected for the dendroclimatic analysis.
Tab. 3 - Expressed population signal of chronologies for the period 1954 - 2003.
| Site | Forest zone | Siberian spruce | Scots pine |
|---|---|---|---|
| 1 | Forest - tundra transition zone | 0.41 | - |
| 2 | Northern limit of the Northern taiga zone | 0.63 | 0.71 |
| 3 | Middle taiga zone (east) | 0.85 | 0.85 |
| 4 | Middle taiga zone (west) | 0.86 | 0.85 |
| 5 | South taiga zone | 0.85 | 0.61 |
Fig. 2 - Standardized tree-ring chronologies of Siberian spruces smoothed with a 10-year moving average, shown as a deviations from the mean (n = number of trees).
Responses to mean monthly temperatures and monthly precipitations sums
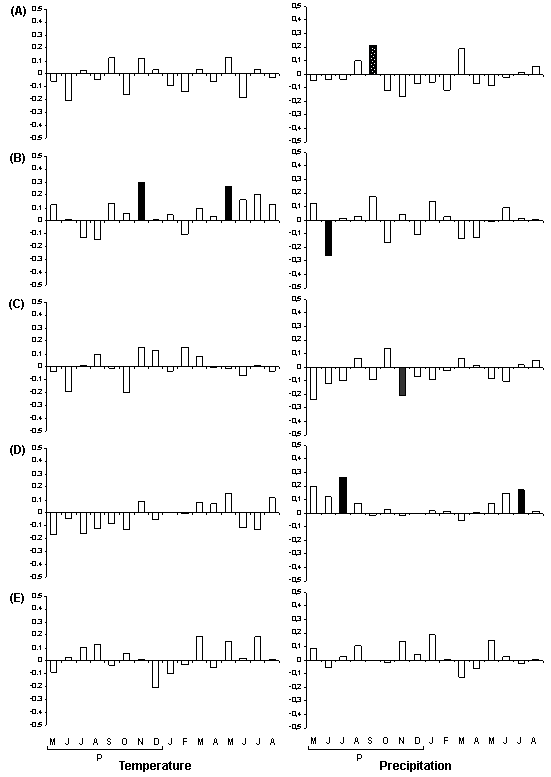
In western part of Middle taiga zone the statistically significant positive response of Scots pine to the monthly mean temperatures of November year prior to growth and May of the current growth season was found (Fig. 3B). There was no other significant response to temperature (Fig. 3A, C, D, E).
Fig. 3 - Response function analysis tree-ring chronologies for common interval 1954-2003. Lower case “p” denotes months in the year previous to the current year growth season. Filled bars of response function coefficients are significant at p < 0.05. A: Scots pine in Middle taiga zone (east); B: Scots pine in Middle taiga zone (west); C: Siberian spruce in Middle taiga zone (east); D: Siberian spruce in Middle taiga zone (west); E: Siberian spruce in Southern taiga zone.
Response function analysis showed positive (Fig. 3A, D) and negative (Fig. 3B, C) response of the radial increment to the monthly sums of precipitation. Radial increment of Siberian spruce was influenced by November precipitations of the year prior to growth in eastern part of Middle taiga zone (Tab. 2, site 4) and June precipitations in eastern part of Middle taiga zone. Radial increment of Scots pine was influenced by September precipitations of the year prior to growth in eastern part of Middle taiga zone and June precipitations in eastern part of Middle taiga zone (Tab. 2, site 4). In western part of Middle taiga zone (Tab. 2, site 3) the response of Scots pine and Siberian spruce to the precipitations was opposite (Fig. 3 B, D).The increase in precipitation positively affected the radial increment of Spruce and negatively the radial increment of Pine. The similar difference between Pine and Spruce in response to the monthly sums of the autumn precipitations of the year prior to growth was found in eastern part of Middle taiga zone (Fig. 3A, C). The difference in response to the monthly sums of precipitations within the Middle taiga zone is explained by the geographical position of the sites (Fig. 1).
No statistically significant responses to temperatures and precipitations were found for Scots pine in Southern taiga zone (Fig. 3E). The lengths of growing season and annual evapotranspiration (Tab. 1) is longer here, comparing with Middle taiga zone. This is also confirmed by the smallest amount of variance explained by climate (Tab. 4).
Tab. 4 - Amount of variance (R2) explained by temperature (T) and precipitations (P) for the period 1954-2003.
| Site | Forest zone | Siberian spruce | Scots pine | ||||
|---|---|---|---|---|---|---|---|
| P | T | P and T | P | T | P and T | ||
| 3 | Middle taiga zone (east) | 0.416 | 0.390 | 0.641 | 0.446 | 0.484 | 0.646 |
| 4 | Middle taiga zone (west) | 0.402 | 0.413 | 0.652 | 0.220 | 0.386 | 0.702 |
| 5 | South taiga zone | 0.220 | 0.264 | 0.435 | - | - | - |
The variance explained by the mean monthly temperature varied from 26% to 48% (Tab. 4). The highest explained variance by temperature is in most northern site chronology of Scots pine, the lowest in Southern taiga. The variance explained by the monthly sums of precipitations varied from 26% to 44%. The variation of radial increment explained by the precipitations is highest for both species in eastern part of the Middle taiga zone. There is a clear gradient of increasing amount of variance explained by monthly precipitation sums from south to north (Tab. 4). The total amount of variance in radial increment explained by climate varied from 43% to 70%.
Temporal stability of growth-climate relationships
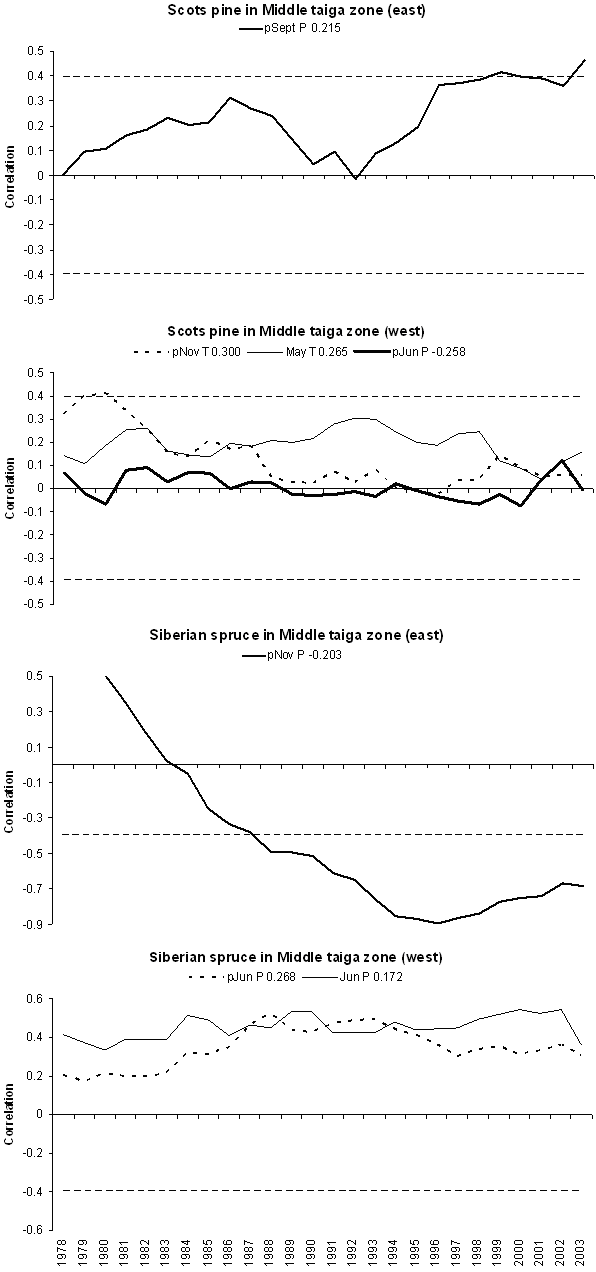
The variables identified in dendroclimatic analysis as significant for the radial increment of Scots pine and Siberian spruce in Middle taiga zone were retested for the temporal stability of the relationships using 25-year window correlation. In this step we were looking to disprove (p>0.05) a correlation between a monthly climate parameters and ring-width chronologies for a given 25-year period if r < |0.396| (for n = 25, the correlation is considered significant at the 5% significance level if its coefficient is greater than 0.396 in absolute value).
The statistically significant changes in correlations between climate variables and radial increment were identified for Siberian spruce (Fig. 4). In eastern part of the Middle taiga zone the correlation between precipitations of November year prior growth changed since 1987 and was significantly non stable years after 1987. The relations to temperature of June also changed in the western part of Middle taiga zone in 1987. The dendroclimatic relationships of Scots pine were also changing over the time, but those changes were statistically not significant.
Fig. 4 - Temporal stability of dendroclimatic relationships estimated for the common interval of 50 years (1954-2003). Lower case “p” denotes months in the year previous to the current year growth season. Upper case “T” and “P” denotes temperature and precipitation of the months. Confidence intervals are showed with dashed lines.
The amount of variance of radial increment explained by the monthly mean temperatures and monthly precipitation sums changed over the period 25 years from 14% to 20% (Tab. 5). In western part for Siberian spruce and eastern part of Middle taiga zone for Scots pine the amount of explained variance increased on 7% and 14%. But other 3 chronologies showed decrease in explained amount of variance from 2% to 20%. Therefore using those ring-width chronologies and monthly climate data for the period from 1954 to 2003 it is not possible to make conclusion on changes in dependency of the radial increment from climate.
Tab. 5 - Temporal stability of the amount of variance (R2) explained by temperature and precipitations for 2 subsequent 25-years periods.
| Forest zone | Time span | Siberian spruce | Scots pine |
|---|---|---|---|
| Middle taiga zone (east) | 1954-1978 | 0.649 | 0.574 |
| 1979-2003 | 0.727 | 0.388 | |
| Middle taiga zone (west) | 1954-1978 | 0.309 | 0.228 |
| 1979-2003 | 0.292 | 0.370 | |
| South taiga zone | 1954-1978 | 0.639 | - |
| 1979-2003 | 0.420 | - |
Climate change analysis
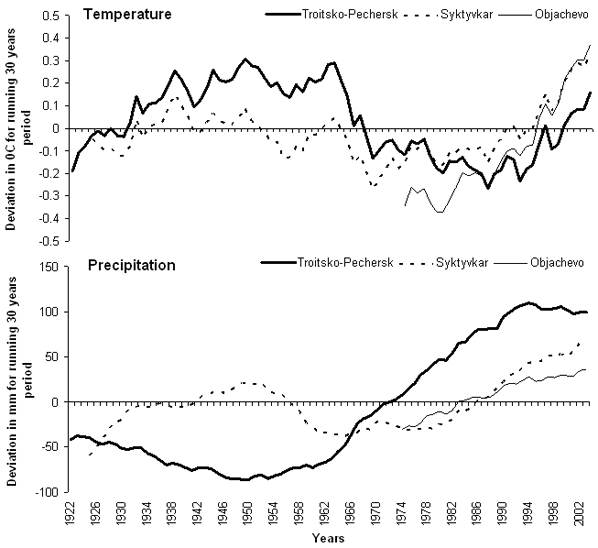
Fig. 5 shows the deviation in degrees C from the long-term mean (70 years) temperature and in millimetres from the mean annual sum of precipitation at the 3 meteorological stations included here with the longest period of observation. There is clear evidence during recent decades that the climate in the Komi Republic has changed. During the last 20 years the mean annual air temperature has increased, and over the last 40 years the annual precipitation sum at meteorological stations has also increased. But the impact of each month on the annual result differs over time (Fig. 6).
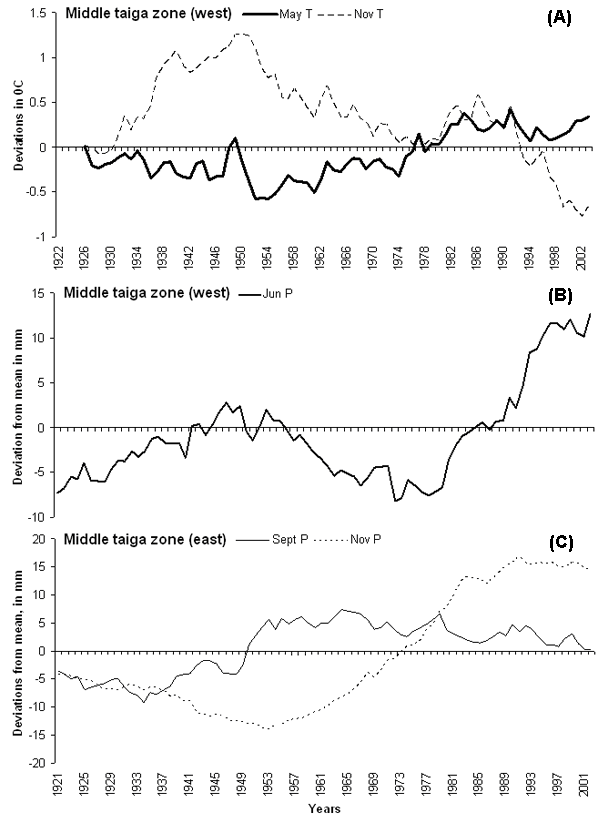
Fig. 6 - Absolute deviations from long-term means for mean monthly temperature (A) and monthly sums of precipitations (B, C) that are significant for radial increment of pine and spruce in Komi smoothed with the 30-years running mean.
In some months the trends are positive, and others have some negative trends. As shown above for the boreal zone, the radial growth of trees could be attributed to certain months. Deviations from means in temperature, which are significant for radial increment of pine and spruce in Komi, are shown on Fig. 6. In our study the significance of those climatic parameters for radial increment was identified by response function analysis. The decrease in temperature of May in western part of the Middle taiga zone most probably was compensated by increase of temperature in November of the year prior to growth and increase in precipitations of June (Fig. 6). The positive response of Siberian spruce in the western part of Middle taiga zone to the precipitations of June was reflected in tree ring width (Fig. 5, Fig. 6).
Fig. 5 - Deviation in degrees C from long-term mean annual temperature and in mm from mean long-term annual sum of precipitation on analysed meteorological stations, smoothed using 30-year running mean.
Discussion
The limit of this study is its spatial representativeness of the selected stands for different sub zones of taiga ([28]). It is important to understand changes in forest productivity not only on a temporal scale, but also in spatial terms. Currently, due to the low accessibility and huge size of the territory, it is impossible to create systematic sample plots in Komi Republic. Therefore, to make conclusions about spatial response distributions other methodological approaches need to be used.
Another limit of this study for the climate reconstruction is the potential bias due to the different ages of the sampled trees. It was shown that the climatic signal is maximized in older trees and the higher amount of noise present in younger trees ([5]). But from the standpoint of forest management, for the purpose of understanding factors influencing radial increment of trees in the forest, represented by different age classes, this bias is not important.
The statistical relationships of Siberian spruce growth to climate in Middle taiga zone of Komi have changed over the last century. This is due to changes in temperature and precipitation or to changes in the sensitivity of trees to climate. The changes in tree-ring sensitivity could be attributed to ultraviolet radiation ([4]), increased atmospheric CO2, nitrogen deposition ([18], [17], [19], [20]), ozone exposure ([2], [45]), pollution, and cycles in sunspot activity ([37]).
The method of analysing the factors influencing growth trends through the building chronology with standardization of raw tree ring measurements for the whole sub zone of taiga contains some limiting factors. At present it is impossible to find an ideal curve that removes variation in the radial increment caused by ageing, competition, stand dynamics and other factors reflected in tree rings and at the same time preserving the long-term growth trend. Furthermore, it is even more difficult to find an individual curve for each separate factor. However, the method could be used in case of a large number of sampled trees, and those limits could be minimized due to the process of averaging. In this study the low-frequency variation caused by the above-mentioned factors was removed, but with the understanding that standardization partly removes long-term growth trends, which belong to low- and medium-frequency growth variation, i.e., periods more than 30 years.
In Boreal forests, the climate change scenarios imply a great rise in temperature and in precipitation, especially in winter. Higher precipitation in summer may compensate for the enhanced evapotranspiration, making sufficient amounts of water available for forests. Longer growing seasons reduce the soil frost. In northern Europe under warmer conditions the Siberian spruce and Scots pine are likely to invade the tundra region and higher elevations ([14]). Therefore, it is probable that climatic warming will stimulate early initiation of photosynthesis in spring, resulting in better utilization of solar radiation and increased productivity.
On most of the studied sites there are increasing long-term trends in total monthly precipitation and mean monthly air temperatures that are important for radial growth. This increase could be attributed to a factor that causes increasing site productivity in Komi. But due to the big difference in climate conditions through the Komi Republic, there is no one single or clearly identified group of monthly climate parameters that affected the growth at all sites.
The analysis of the variables for the other months showed the increase in temperature and precipitation was due to the trends in months that are significant for radial increment. The importance for radial increment months with positive trends is higher.
The absence of statistically significant response (p < 0.05) of chronologies (Fig. 4A, C, D, E) in dendroclimatic analysis to the air temperature does not show the absence of relation between radial increment and temperature, because relatively big amount of variance could be explained by the monthly temperature (Tab. 4). The absence of response in several chronologies testes using DENDROCLIM2002 could be due to the possible non-linear relationships between temperature and radial increment or relatively short period (50 years) used for calculation response function coefficients.
The amount of variance explained by the temperature is larger than the amount explained by precipitations (Tab. 4) except for Siberian spruce in the eastern part of Middle taiga zone. However, the territory of Komi is characterized by surplus moisture; mean annual evapotranspiration is significantly lower than annual rainfall (Tab. 1). It was shown on pine growth in Sweden ([15]) that response of ring-width to this parameter might be non-linear and therefore might be difficult to evaluate using methods assuming a linear weather-growth relationship (as for example, response function analysis - [9]). In boreal regions the potential impact of precipitation is related to temperature.
The difference in response of spruce growth in different sub-zones is explained by the difference in climatic parameters, climate change trends and differences in the ecological characteristics of different provenances. The changes in air temperatures in Komi Republic are not distributed equally over the territory. The response to the temperatures in the western part of Middle taiga zone could be attributed to the increasing length of the growing season due to increasing temperature in May and November. We are assuming that during the recent decades cambial activity already started at the first weeks of May, because the temperature in this period was often above + 5°C.
The response of high frequency variation in radial increment of pine to summer temperatures was reported for different sites in Northern Europe ([12], [16], [21], [25], [26], [27], [33]). This pattern was also found in our study (i.e., Scots pine in western part of Middle taiga zone), but without the strongest response to the July temperature. The possible explanations are the selection of sites in multistoried forests and the influence of continental climate. In the Komi Republic there is a continental climate (Tab. 1) with more extreme climate conditions than those in Finland, Sweden and Norway, which are greatly influenced by the Gulf Stream.
The general decrease in amount of variance explained by climate is in accord with the findings on reduced correlations between growth and temperature in subarctic Eurasia ([43]).
Conclusions
A clear long-term trend in climate change was identified. At all meteorological stations the air temperature increased during the last 20 years, and total precipitation started to increase 40 years ago. This is reflected in the radial growth increment of Siberian spruce and Scots pine. Thus, climate change could partly explain the increased site productivity.
The total variance explained by temperature varies from 26% to 48% and precipitation from 26% to 44%. The climate factors influencing increased radial increment of Siberian spruce differ from those in Scots pine. The higher temperatures allow enhancement of evapotranspiration, which is why both temperature and precipitation affected radial increment positively. The temporal stability of dendroclimatic relationships has changed for radial growth of Siberian spruces in western and eastern parts of Middle taiga zone. The statistically significant climatic parameters influencing radial increment of spruce and pine in Komi were identified. The increased radial increment of spruce and pine in Komi is attributed primarily to the increase in temperature. But the correlation of precipitation sums and air temperature with radial increment of Siberian spruce in Middle taiga zone changes over the time. Climate change is causing increasing site productivity, but its direct influence, identified by means of response function analysis, explains only part of the high frequency variations in radial increment. Taking into account the correlation with climate variables and their temporal stability, it is possible to simulate the future development of forest resources in Komi under the changing climate. For purposes of forest management, new climate-sensitive growth models should be developed.
Acknowledgements
This study was supported by a CIMO fellowship grant TM-04-2734, NorFA grant “Network for Dendrochronological Research in Northern Europe”, travelling grants from the Graduate School in Forest Sciences (University of Joensuu), the project Intensification of forest management and improvement of wood harvesting in North West Russia in the research programme Russia in flux funded by the Academy of Finland, Russian Foundation for Basic Research (project 06-04-48792). Thanks to Dr. Hans-Peter Kahle for critical comments that helped to improve this manuscript. Mekrijarvi Research Station provided excellent facilities for measuring the discs and cores from Russia. Dr. Bruce Miche helped improve the language of the manuscript.
References
Gscholar
Gscholar
Gscholar
Gscholar
Gscholar
Gscholar
Gscholar
Gscholar
Gscholar
Gscholar
Gscholar
Gscholar
Gscholar
Gscholar
Gscholar
Gscholar
Gscholar
Gscholar
Gscholar
Gscholar
CrossRef | Gscholar
Gscholar
Gscholar
Gscholar
Gscholar
Authors’ Info
Authors’ Affiliation
University of Joensuu, Faculty of Forestry, P.O. Box 111, FI-80101, Joensuu (Finland)
Mekrijärvi Research Station, University of Joensuu, Yliopistontie 4, FI-82900, Ilomantsi (Finland)
Institute of Biology, Komi Scientific Center, Russian Academy of Sciences, Kommunisticheskaya str. 28, 167000, Syktyvkar (Russia)
Institute for Forest Growth, University of Freiburg, Tennenbacherstr. 4, D-79085 Freiburg (Germany)
Corresponding author
Paper Info
Citation
Lopatin E, Kolström T, Spiecker H (2008). Impact of climate change on radial growth of Siberian spruce and Scots pine in North-western Russia. iForest 1: 13-21. - doi: 10.3832/ifor0447-0010013
Paper history
Received: Jan 24, 2008
Accepted: Feb 01, 2008
First online: Feb 28, 2008
Publication Date: Feb 28, 2008
Publication Time: 0.90 months
Copyright Information
© SISEF - The Italian Society of Silviculture and Forest Ecology 2008
Open Access
This article is distributed under the terms of the Creative Commons Attribution-Non Commercial 4.0 International (https://creativecommons.org/licenses/by-nc/4.0/), which permits unrestricted use, distribution, and reproduction in any medium, provided you give appropriate credit to the original author(s) and the source, provide a link to the Creative Commons license, and indicate if changes were made.
Web Metrics
Breakdown by View Type
Article Usage
Total Article Views: 64955
(from publication date up to now)
Breakdown by View Type
HTML Page Views: 52784
Abstract Page Views: 3673
PDF Downloads: 7137
Citation/Reference Downloads: 57
XML Downloads: 1304
Web Metrics
Days since publication: 6544
Overall contacts: 64955
Avg. contacts per week: 69.48
Article Citations
Article citations are based on data periodically collected from the Clarivate Web of Science web site
(last update: Mar 2025)
Total number of cites (since 2008): 4
Average cites per year: 0.22
Publication Metrics
by Dimensions ©
Articles citing this article
List of the papers citing this article based on CrossRef Cited-by.
Related Contents
iForest Similar Articles
Short Communications
Climate effects on growth differ according to height and diameter along the stem in Pinus pinaster Ait.
vol. 11, pp. 237-242 (online: 12 March 2018)
Research Articles
Is Pinus pinea growth affected by climate change in western Anatolia?
vol. 18, pp. 93-101 (online: 28 April 2025)
Review Papers
Impacts of climate change on the establishment, distribution, growth and mortality of Swiss stone pine (Pinus cembra L.)
vol. 3, pp. 82-85 (online: 15 July 2010)
Research Articles
Seeing, believing, acting: climate change attitudes and adaptation of Hungarian forest managers
vol. 15, pp. 509-518 (online: 14 December 2022)
Research Articles
Potential impacts of regional climate change on site productivity of Larix olgensis plantations in northeast China
vol. 8, pp. 642-651 (online: 02 March 2015)
Research Articles
Influence of tree density on climate-growth relationships in a Pinus pinaster Ait. forest in the northern mountains of Sardinia (Italy)
vol. 8, pp. 456-463 (online: 19 October 2014)
Research Articles
Response to climate and influence of ocean-atmosphere phenomena on annual radial increments of Pinus oocarpa Schiede ex Schltdl. & Cham in the Lagunas de Montebello National Park, Chiapas, Mexico
vol. 16, pp. 174-181 (online: 30 June 2023)
Research Articles
Predicting the effect of climate change on tree species abundance and distribution at a regional scale
vol. 1, pp. 132-139 (online: 27 August 2008)
Research Articles
Approaches to classifying and restoring degraded tropical forests for the anticipated REDD+ climate change mitigation mechanism
vol. 4, pp. 1-6 (online: 27 January 2011)
Research Articles
An assessment of climate change impacts on the tropical forests of Central America using the Holdridge Life Zone (HLZ) land classification system
vol. 6, pp. 183-189 (online: 08 May 2013)
iForest Database Search
Search By Author
Search By Keyword
Google Scholar Search
Citing Articles
Search By Author
Search By Keywords
PubMed Search
Search By Author
Search By Keyword

