Tree-ring-based reconstruction of larch budmoth outbreaks in the Central Italian Alps since 1774 CE
iForest - Biogeosciences and Forestry, Volume 12, Issue 3, Pages 289-296 (2019)
doi: https://doi.org/10.3832/ifor2533-012
Published: May 27, 2019 - Copyright © 2019 SISEF
Research Articles
Abstract
The larch budmoth (Zeiraphera diniana Gn. - LBM) offers a unique example of cyclic fluctuations in insect populations. During regular LBM mass outbreaks, defoliation of European larch (Larix decidua Mill.) subalpine trees results in distinct ring-width reductions in the host trees. Although several observations, reconstructions and models suggest that LBM outbreaks travel from the southwest to the northeast along the Alpine arc, gaps in the underlying data still hamper our mechanistic understanding of the spatio-temporal system dynamics. Evidence of historical LBM outbreaks before 1964 is generally associated with uncertainty and is particularly scarce for the Central Italian Alps. Here, we introduce four new larch ring-width chronologies from Val di Sole in the Central Italian Alps and use time-series analyses and comparisons with non-host trees (Picea abies Karst.) to reconstruct LBM mass outbreaks. We identify distinct fingerprints of 15 spatially-synchronized LBM events that occurred between 1774 and 1964 CE. Our results are important for improving qualitative space-time models to simulate travelling wave dynamics of insect populations, and for correcting ring-width-based summer temperature reconstructions from this part of the Alpine arc.
Keywords
European Larch, Insect Outbreaks, Larch Bud Moth, Tree-rings, Zeiraphera diniana Gn.
Introduction
Tree growth at high-latitude and high-elevation sites is mainly limited by low summer temperatures. Tree-ring width (TRW) series from such sites have therefore been used to reconstruct temperature changes over different spatio-temporal scales ([30], [28], [27]). However, forest natural disturbances, such as wildfires, windstorms and geomorphological events and processes, as well as biotic attacks, such as insect outbreaks and fungal diseases, may also influence tree growth ([43]). European larch (Larix decidua Mill.) is one of the most commonly used species for dendroclimatic reconstructions in the Alps ([16], [17], [19], [29], [24]), although larch tree-ring patterns are affected by cyclic outbreaks of the larch bud moth (Zeiraphera diniana Gn., LBM hereafter - [48], [3], [26], [18]). The spatio-temporal identification of past LBM outbreaks is necessary to interpret the climatic signal of tree-ring chronologies.
The LBM, a moth belonging to Lepidoptera and characterized by periodic cyclic population fluctuations ([25]), has been studied since the early 1960s in the Engadin valley (Switzerland), and reports of outbreaks in several Alpine areas date back to 1815 ([3]). LBM population cycles are driven by trophic and non-trophic factors, such as host-parasite interactions, food quality, maternal effect, population density and climate ([2], [32], [10], [46]). The diet of LBM larvae is based on the raw fiber and protein in new larch foliage ([1], [10], [46]). The first effect of larvae feeding is defoliation. In the following two to three years, reduced needle length and a lower nitrogen content are typically observed ([4]). The decrease in crown mass reduces photosynthetic rates, and the related lower carbohydrate production and accumulation decrease TRW and maximum latewood density, leaving a typical fingerprint in the tree-ring series ([4]). LBM population dynamics are influenced by site characteristics, and a clear periodicity of outbreaks every 8-10 years is typically observed within the LBM optimum elevation belt between 1700 and 2000 m a.s.l. ([3], [37]). In the French Alps, the history of LBM outbreaks from 1750 to 1994 was reconstructed ([41]) and compared with climate ([42]) and land use changes ([7]). Tree-ring analyses conducted at the border between the Italian and French Alps were used to reconstruct LBM outbreaks that occurred from 1760 to 1999 ([39]), and in the Lötschental, Switzerland, a 1200-year tree-ring density chronology was used to reconstruct LBM outbreaks well back into medieval times ([26]).
While the presence of LBM was found to be synchronous at the valley scale, a wave pattern from west to east with a calculated velocity of 219.8 km · year-1 along the Alpine arc was described ([12], [36], [37]). Temporal and spatial data are essential to understand the dynamics of the LBM populations and to develop outbreak wave models. However, in some regions, such as the Central Italian Alps, LBM data from before 1964 are generally lacking ([3]).
Here, we develop four new TRW chronologies from high-elevation sites in the Central Italian Alps and use statistical approaches to analyze them in order to highlight the years characterized by anomalous growth. The aim is to reconstruct LBM outbreaks that occurred in this area in the past centuries, thus contributing to knowledge of the LBM cycle at locations above the ecological optimum elevation.
Materials and methods
Study area and sampling design
The study area is located in the Central Italian Alps, in the Adamello-Presanella and Ortles-Cevedale groups of the Central Italian Alps (46° 05′ 19″ N, 10° 22′ 45″ E). Where geomorphological processes enable the development of soils, associations of podzols, histosols and umbrisols, or of umbrisols, cambisols and podzols, were found depending on the slope aspect ([31]).
The climate of the study area is inner-alpine, with cold winters and temperate summers. The mean annual temperature of 0 °C is found at 2540 m a.s.l. Baroni et al. ([5]) calculated a mean vertical temperature gradient of 0.59 °C / 100 m elevation. The total amount of precipitation in the area spans from 810 mm to 1504 mm and is positively correlated with elevation and negatively correlated with latitude ([5]).
The valley floors of the study area are dominated by Norway spruce (Picea abies [L.] Karst.) forests, which transition to mixed forest stands (with European larch) above 1500 m a.s.l. Above 1900 m a.s.l. European larch becomes the dominant species and is associated with green alder (Alnus viridis [Chaix] D.C.). The sampling sites are located between 1900 and 2200 m a.s.l. in treeline ecotones, characterized by ericaceous species (Rhododendron ferrugineum L. and Vaccinium spp.) and Festuca scabriculmis (Hack.) K. Richt., where scattered larches and, in some cases, individual Swiss stone pine (Pinus cembra L.) trees grow ([6], [23], [20], [21]).
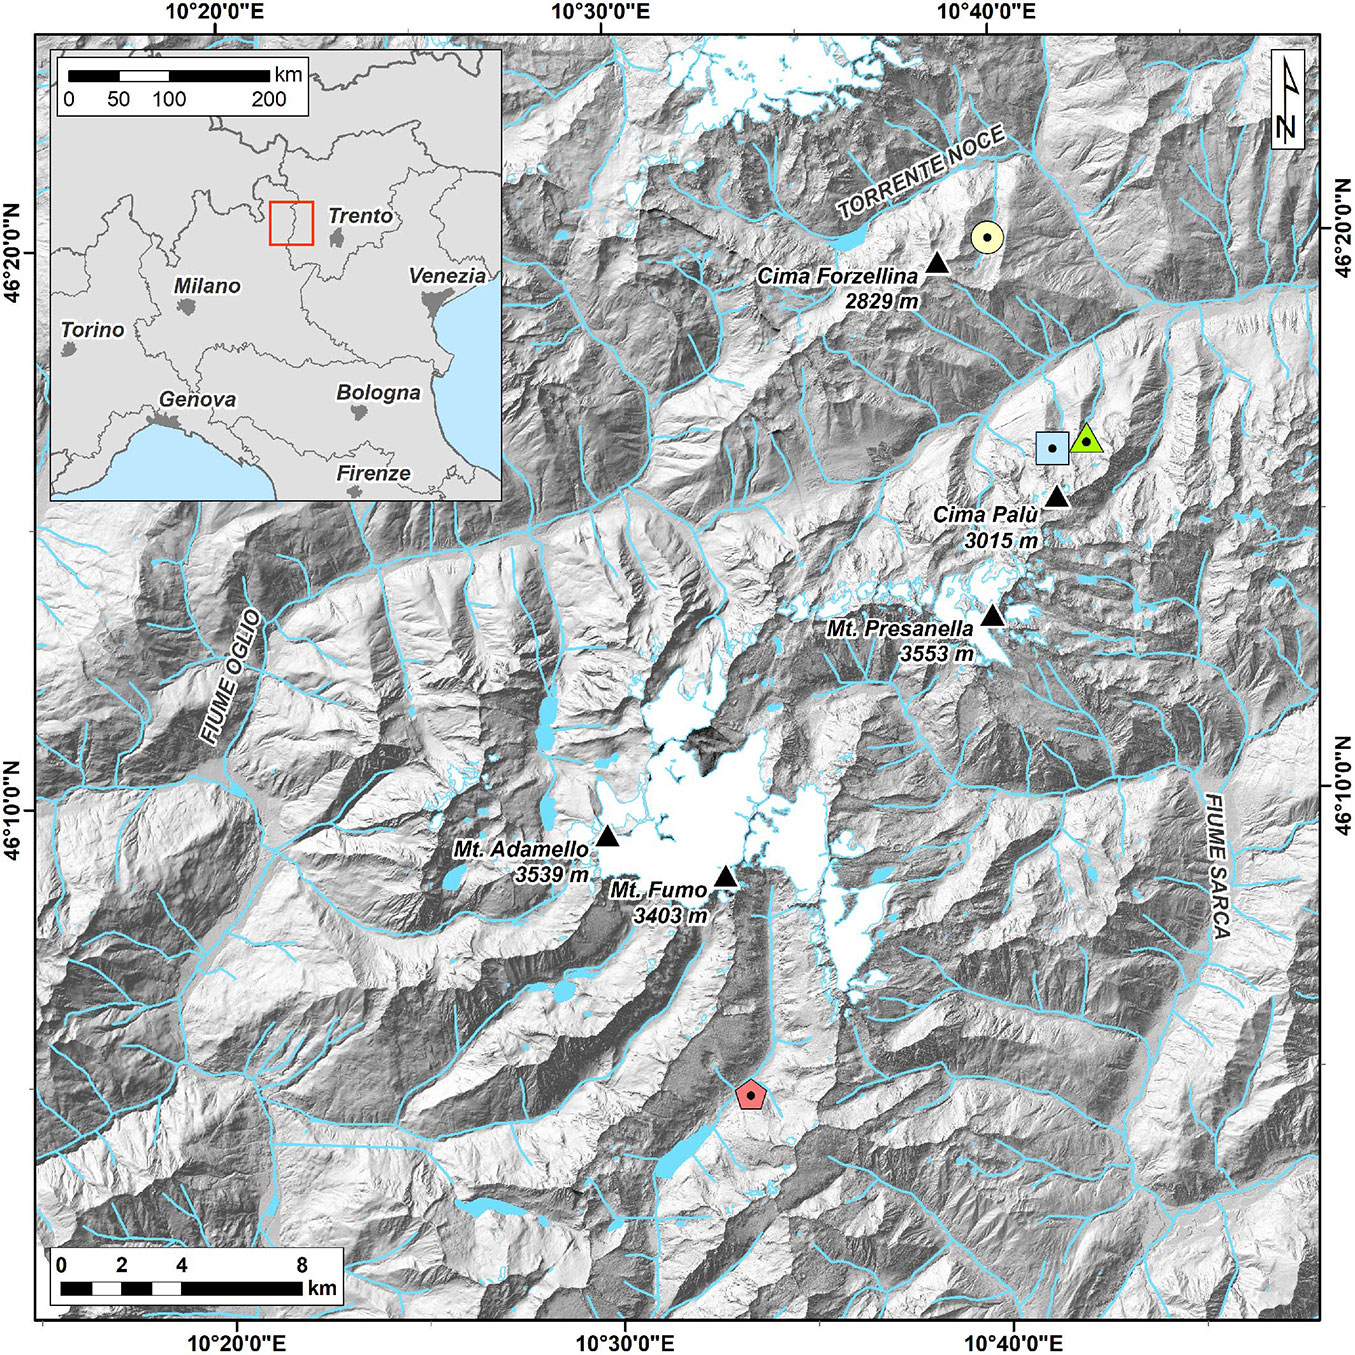
A total of 105 larch trees were sampled in four different valleys: “Val di Barco” (BARC hereafter) and “Val Palù di Vermiglio” (PALP) on the northern part of the Adamello-Presanella massif, “Val di Fumo” (FUMO) on the southern part of the same massif, and “Val Comasine” (ANBO) on the southern part of the Ortles-Cevedale group (Fig. 1). All valleys are N-S oriented. Two cores (five mm in diameter) were collected from each individual using an increment borer (Haglöf, Sweden). All trees were cored at breast height, perpendicular to the slope direction, to minimize the occurrence of reaction wood in the samples ([43]). Trees showing scars caused by mechanical disturbances, such as debris flows and avalanches, or other injuries were avoided.
Fig. 1 - Location map of the study area. The dotted circle, triangle, square and pentagon represent ANBO, BARC, PALP and FUMO, respectively.
Sample preparation and chronology development
The cores were sanded with progressively finer sand paper (P80, P150, P240, P400, P800 and P2000) to highlight the annual ring boundaries. TRW was measured using a sliding table (LINTAB™ mod. 3, RINNTECH®, Heidelberg, Germany), with a resolution of 0.01 mm, and TSAPWin Scientific 4.69h software (RINNTECH®). The individual TRW series were then visually compared and cross-dated, also against a published larch reference chronology ([8]). The visual cross-dating was additionally verified using the COFECHA program ([33]) and the “dplR” package in R ([15], [40]).
The raw TRW series were power transformed in order to attenuate the variance, and standardized indexes were then calculated as a ratio using a cubic smoothing spline with a 50% frequency cut-off at 32 years ([22]). Four site standard chronologies were formed as a bi-weighted mean of standard index series, and residual chronologies were formed using pre-whitening. These splines enabled the removal of medium and low frequencies due to age and long-term climatic trends while preserving the signal related to the pattern of LBM outbreaks, which was characterized by high-frequency rap- id growth variations ([22]). Owing to the uneven sample depth, the analyses were performed on the portion of the chronology that presented an Expressed Population Signal (EPS) value higher than 0.85 ([49], [22]).
Identification of pointer years
The years for which a group of well cross-dated tree-ring series indicated the occurrence of an event year, i.e., when a particularly narrow or large ring was formed, were identified as pointer years (PYs - [44]). The pointer year analysis was conducted using five methods described below, and only those years identified by at least two methods were considered as PYs and thus evaluated as possible LBM outbreaks.
(1) Be94: the TRW raw series were tested with the method proposed by ([9]). The mean sensitivity ([30]) of each series was multiplied by 0.85 (approximately equal to the lowest twentieth percentile) and used as the threshold for the mean growth variation. In each series a year was identified as PY if its growth variation is greater than the calculated threshold. A year was identified as PY if at least 75% of the series present a significant growth variation.
(2) HS96: all TRW standard series and the four standard chronologies were compared with a Norway spruce (Picea abies [L.] Karst.) chronology, following the methods I and IV described in Büntgen et al. ([18]) - [45], [11], [41]). To avoid a sensitivity bias ([29]), we used Norway spruce series from a forest stand located in Switzerland, about 100 km north-westerly from the sampling stands ([11]), rather than the Swiss stone pine series of a nearby valley ([21]). A 313 years long Norway spruce chronology was developed applying the same standardization applied to larch series. The obtained Norway spruce chronology, resulted sensitive to June-August mean summer temperatures as well as the larches in the study area ([20]), differently from the Swiss stone pine that shows a sensitivity to the May-September mean temperatures ([21]).
(3) No06: PYs were highlighted using the ring-width standard indexes (RWI), the RWI mean and the RWI standard deviation. PYs were identified as those years that satisfied both of the following conditions: (i) the RWI was lower than the RWI mean minus the RWI standard deviation multiplied by 0.85; and (ii) the RWI was lower than 0.6 of the RWI of the previous year ([39]).
(4) Ne07: the TRW raw series were filtered with a 13-year-long low-pass filter and then analyzed for PYs according to Schweingruber et al. ([44]) and Neuwirth et al. ([38]) using the function “pointer.norm” of the “pointRes” package in R ([47]). Following methods from Neuwirth et al. ([38]), standard deviation thresholds were set to 1.000, 1.280 and 1.645 to identify weak, strong and extreme events. The window of analysis was set to seven years and the number of series threshold was set to 75%.
(5) Ce19: site-specific calculated temperature anomalies ([13], [14]) were used to identify potential PYs. Moreover, the years that present mean summer temperature anomalies (June to August) below 1.28, 1.64 and 2.32 standard deviation thresholds (corresponding to the lowest 10th, 5th and 1st percentile) were considered particularly cold and thus as cause of climatically induced PYs. The climatic sensitivity of the standardized series and TRW chronologies was verified, and only those series showing a correlation index r > 0.224 with summer temperature were considered. The series were regressed using indexes calculated with the temperature series from the summer month that showed the highest correlation value and then subtracted from the temperature series. The standard deviation of the differences was calculated for each series and chronology. Years that included at least 25% of the series or a chronology difference value lower than the standard deviation multiplied by 1.96 were identified as PYs.
The analyses were performed for the years between 1774 and 1999, the maximum time interval covered by all the datasets.
To assess the presence of a cyclical function that could be ascribed to recurrent LBM outbreaks, wavelet analysis was conducted on the TRW standard chronologies using the “morlet” function of the “dplR” package. The spectra were analyzed considering the period between 20 and 28, using a significance level of 0.95.
Results
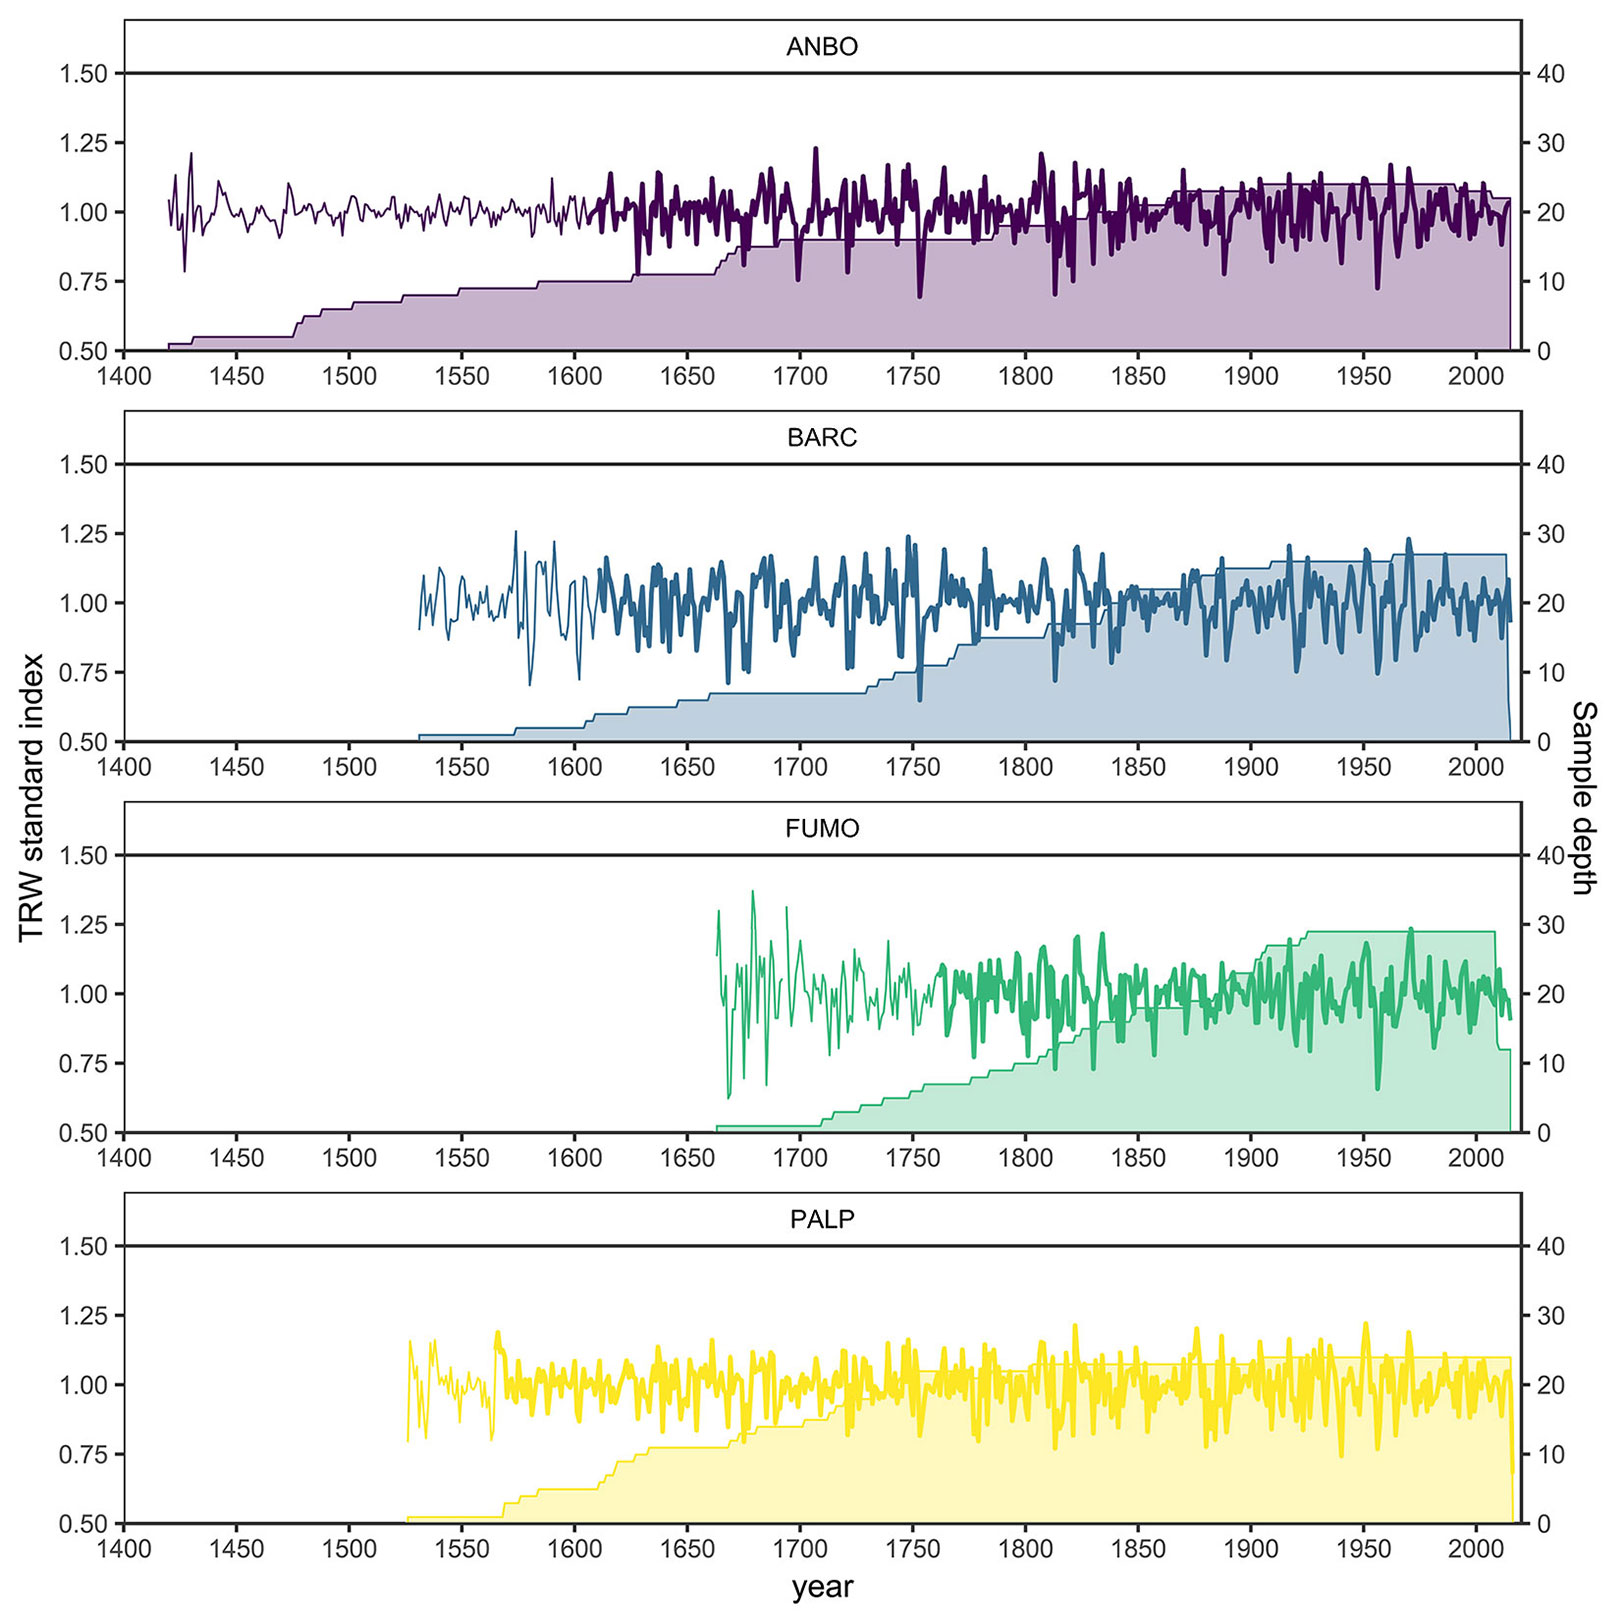
Four larch chronologies from high-elevation sites were developed and analyzed (Fig. 2, Tab. 1). The descriptive statistics of each of the mean standard chronologies are reported in Tab. 2. The portions of the chronologies with an EPS > 0.85 span from 257 years (1759-2015 - FUMO) to 437 years (1579-2015 - PALP). All chronologies show a strong inter-series correlation (r = 0.44 ± 0.08), which indicates the presence of a common signal.
Fig. 2 - Chronologies (lines) and sample depth (area) from the four study sites. Bold lines represent the portion of the chronologies with an EPS > 0.85.
Tab. 1 - Characteristics of the four investigated sites.
| Site name (code) |
Vegetation | Elevation (m a.s.l.) |
Latitude (°N) |
Longitude (°E) |
Soil type |
|---|---|---|---|---|---|
| Val Comasine (ANBO) |
Larix decidua | 2167 ± 37 | 46.3326 | 10.6632 | Podzol |
| Val di Barco (BARC) |
Larix decidua / Picea abies / Alnus viridis | 1987 ± 95 | 46.2718 | 10.7070 | Podzol |
| Val di Fumo (FUMO) |
Larix decidua / Pinus cembra | 2024 ± 61 | 46.0772 | 10.5537 | Podzol |
| Val Palù di Vermiglio (PALP) |
Larix decidua / Picea abies | 2149 ± 24 | 46.2697 | 10.6891 | Podzol |
Tab. 2 - Descriptive statistics of the four larch chronologies. (EPS): Expressed Population Signal; (rbt): mean inter-series correlation.
| Site (Code) | N° trees (cores) |
Time span (length) [EPS > 0.85 (length)] |
r bt |
|---|---|---|---|
| Val Comasine (ANBO) |
24 (48) |
1420-2015 (596) [1658-2015 (358)] |
0.34 ± 0.05 |
| Val di Barco (BARC) |
27 (54) |
1531-2015 (485) [1737-2014 (279)] |
0.47 ± 0.10 |
| Val di Fumo (FUMO) |
29 (58) |
1663-2015 (353) [1759-2015 (257)] |
0.40 ± 0.08 |
| Val Palù di Vermiglio (PALP) |
25 (50) |
1526-2016 (491) [1579-2015 (437)] |
0.53 ± 0.07 |
| Mean | - | - | 0.44 ± 0.08 |
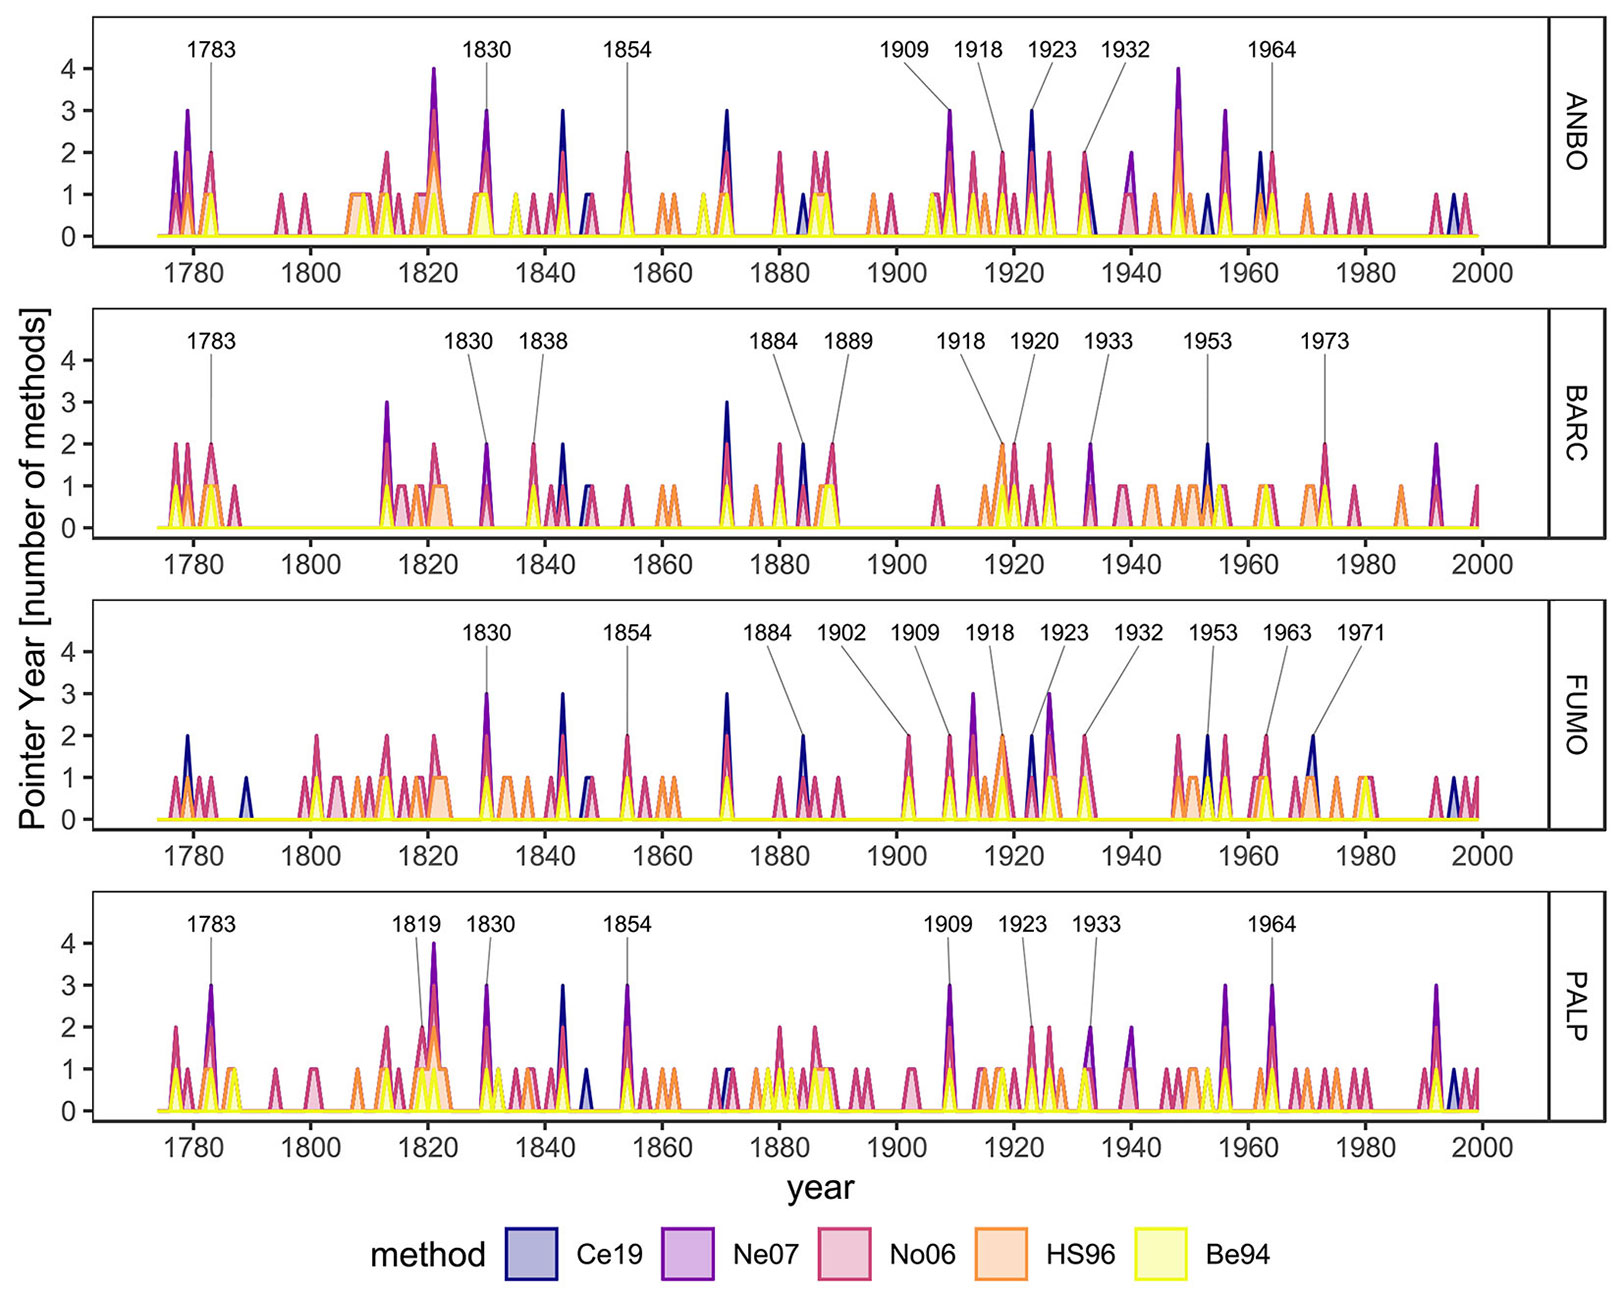
The performed analyses enabled the identification of 116 PYs between 1774 and 1999. Of these, 36 years were highlighted by at least two methods and thus investigated as years in which an LBM outbreak could have taken place. The largest number of potential LBM outbreaks was reported for ANBO, with 23 occurrences, followed by FUMO (21), BARC (19) and PALP (18 - Fig. 3). Moreover, of the 36 highlighted years characterized by a potential LBM outbreak, 25 occurred synchronously in more than one chronology (Tab. 3). Ten of the synchronous PYs were highlighted in two different chronologies, ten in three chronologies and five (1813, 1821, 1830, 1843, 1926) in all the analyzed chronologies (Fig. 3, Tab. 3). Of the non-synchronous PYs, most were identified in equal number in BARC and FUMO (four out of 11), while two came from ANBO and one from PALP (Tab. 3).
Fig. 3 - Identified PYs plotted for single valley. Different colors identify the applied methods. Numbers underline years characterized by LBM outbreak.
Tab. 3 - Pointer years (PYs) identified with at least two methods in each valley. Daggered (†) values identify years classified as PYs in only one valley; starred (*) values identify climatic induced PYs according to meteorological data ([13], [14]), the letter that follow the star (a, b, c) identifies the significant level of the temperature anomalies outliers (90%, 95% and 99% respectively); double daggered (‡) values identify climatically induced PYs in Western Alps ([41]). Values between round brackets identify the number of PYs not climatically induced.
| Valley | Year of potential LMB outbreak | Total | |||||||
|---|---|---|---|---|---|---|---|---|---|
| ANBO | 1777*a | 1779*a | 1783 | 1813*c,‡ | 1821*a | 1830 | 1843*b,‡ | 1854 | 23 (8) |
| 1871*a | 1880‡ | 1886‡ | 1888†,‡ | 1909 | 1913*a | 1918 | 1923 | ||
| 1926*a | 1932 | 1940*b,‡ | 1948*b,‡ | 1956*a | 1962†,‡ | 1964 | - | ||
| BARC | 1777*a | 1779*a | 1783 | 1813*c,‡ | 1821*a | 1830 | 1838† | 1843*b,‡ | 19 (10) |
| 1871*a | 1880‡ | 1884 | 1889† | 1918 | 1920† | 1926*a | 1933 | ||
| 1953 | 1973† | 1992‡ | - | - | - | - | - | ||
| FUMO | 1779*a | 1801*a, † | 1813*c,‡ | 1821*a | 1830 | 1843*b,‡ | 1854 | 1871*a | 21 (11) |
| 1884 | 1902† | 1909 | 1913*a | 1918 | 1923 | 1926*a | 1932 | ||
| 1948*b, ‡ | 1953 | 1956*a | 1963† | 1971† | - | - | - | ||
| PALP | 1777*a | 1783 | 1813*c,‡ | 1819† | 1821*a | 1830 | 1843*b,‡ | 1854 | 18 (8) |
| 1880‡ | 1886‡ | 1909 | 1923 | 1926*a | 1933 | 1940*b,‡ | 1956*a | ||
| 1964 | 1992‡ | - | - | - | - | - | - | ||
All the chronologies showed similar results from the wavelet analysis, with a significant return period of approximately 9-years occurring around the middle 20th century. On the same time span, a secondary peak significant at 95% was observed in BARC and FUMO on a period around 20-years. Considering the first half of the 19th century, ANBO, BARC and PALP report a significant peak on a return period around 20-years whereas FUMO showed a significant peak around a period of 13-years (Fig. 4). Despite these peaks constrained in time, the only chronology showing a period whose mean presented values above the significant threshold of 95% was BARC. In fact, two main peaks representing the mean of a 9-years and 20-years periods were identifiable, though they were due more likely to particular high values in the recent portion of the chronology than to the general high values along all the chronology (Fig. 4).
Fig. 4 - Wavelet analysis results for the standard chronologies and spectral analysis. Left column: Black contours identify the portions of the spectra significant at 95%; white shaded areas identify the cone of influence of the analysis. Right column: Black line identifies the mean power spectra over the same period, gray dashed line identifies the significance threshold of 95%.
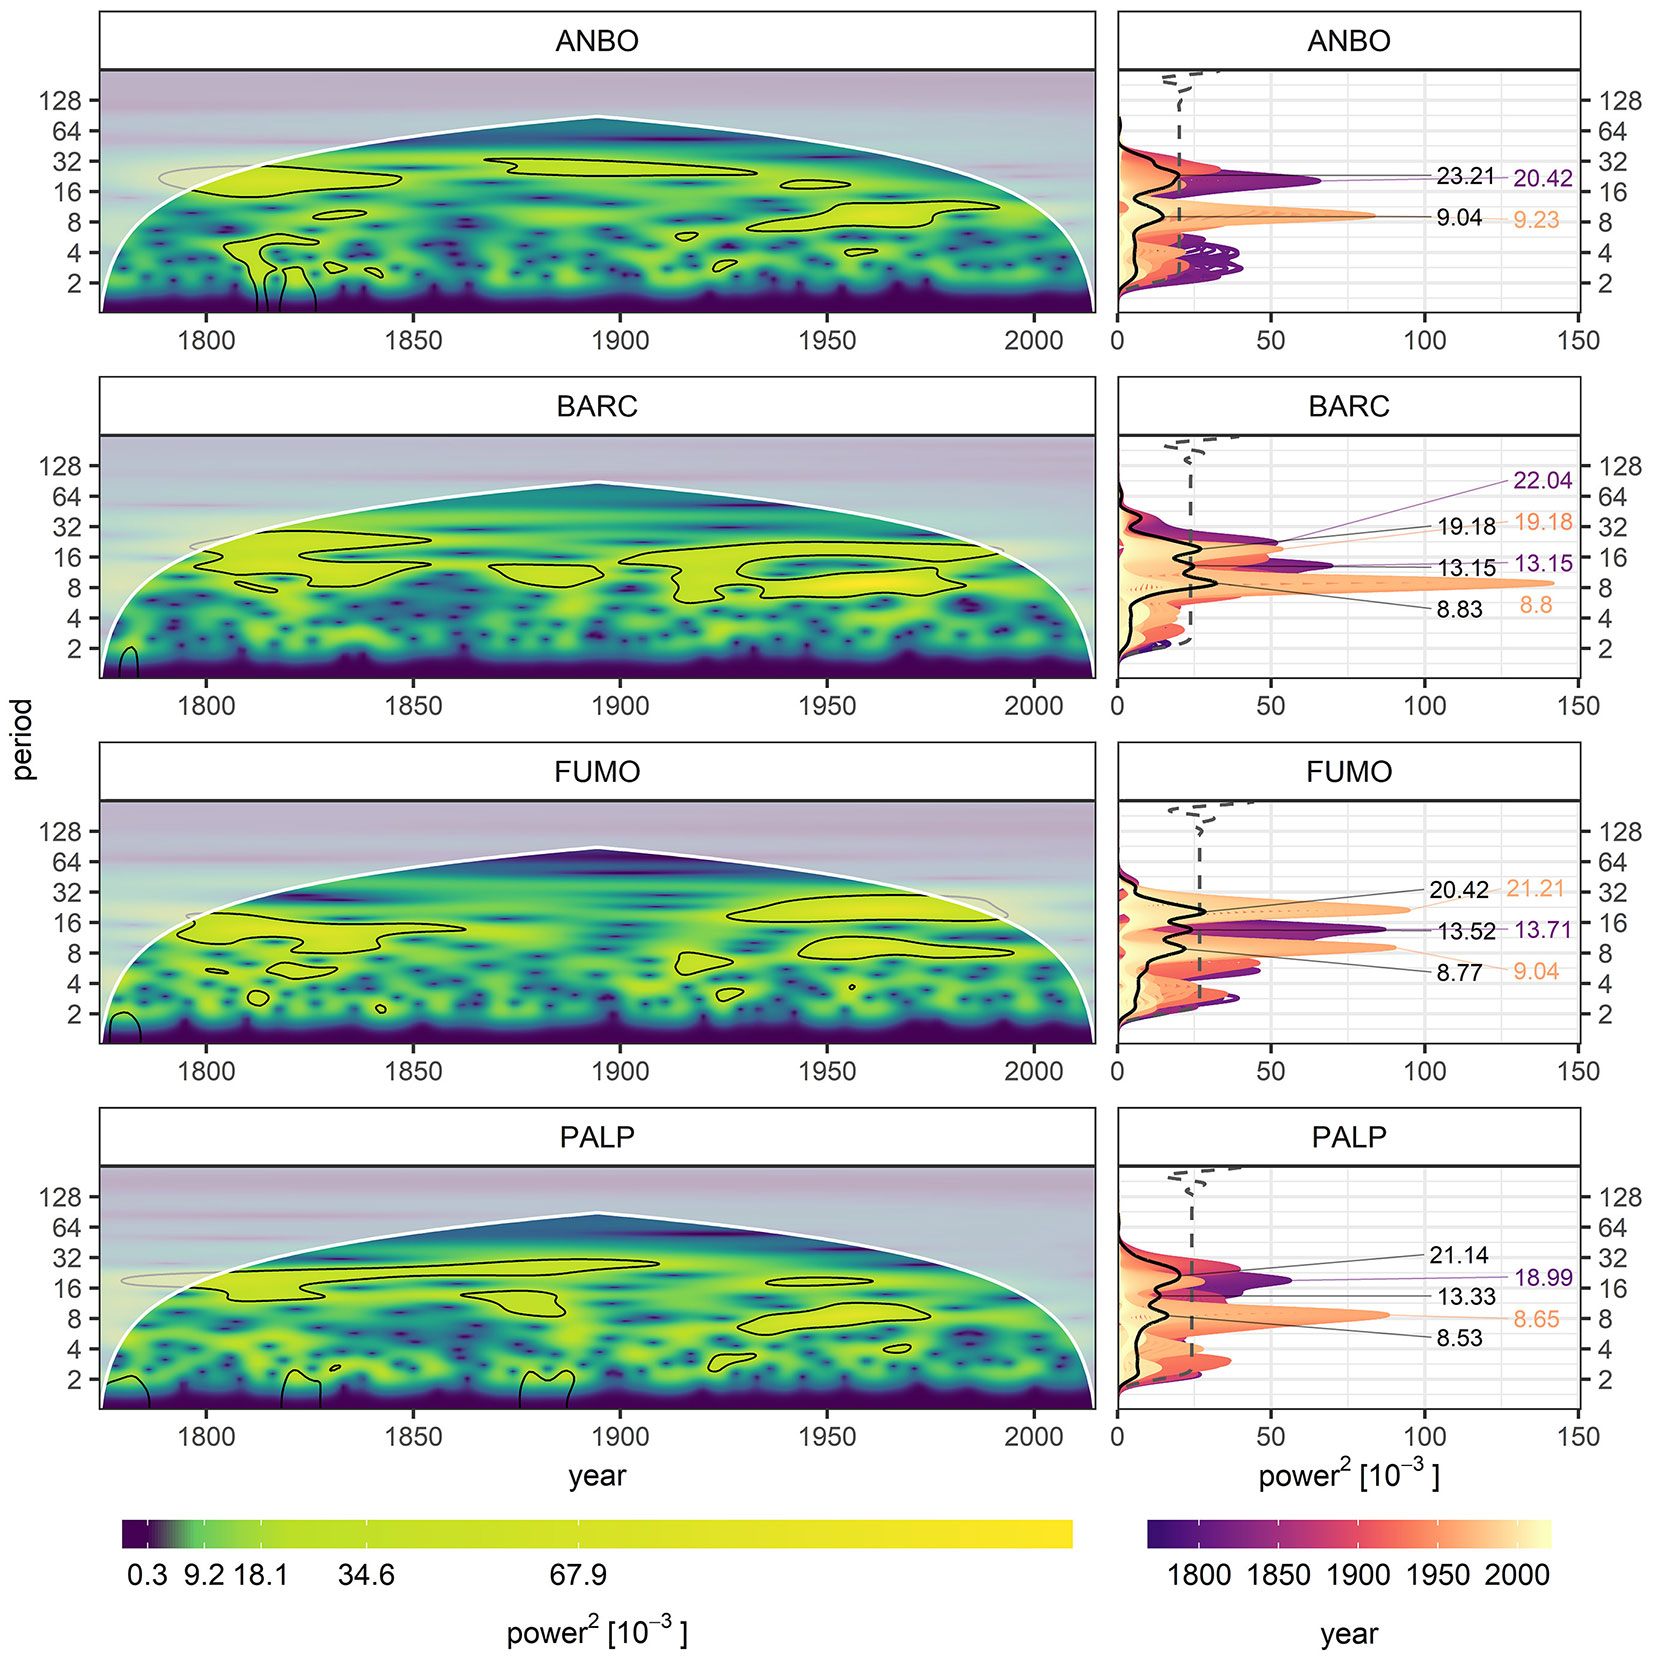
The results from the wavelet analysis are in good accordance with the statistical output from each chronology, highlighting a general lack of a regular cyclicity in time, cyclicity that is not inferable neither from the analysis of the PYs alone.
Discussion
In this study, five different statistical approaches were applied to identify LBM outbreaks in four high-elevation larch chronologies from the Central Italian Alps between 1774 and 1999, the maximum time-span covered by all the involved datasets. The different statistical methods highlight different properties of the analyzed series, resulting in heterogeneous results depending on the parameters considered ([35]). This indicates that it is necessary to use several methods to identify LBM outbreaks with accuracy, as demonstrated in a previous study ([18]).
The statistical approaches Be94 ([9]), HS96 ([45], [34]) and No06 ([39]) provided a larger number of PYs than Ne07 ([38]) and Ce19 (this study). However, there is no specific threshold or method that can be used to identify LBM outbreaks definitively, even when a non-host chronology is used as a reference ([39]). In fact, different species could be characterized by different response to the same climatic conditions ([29]). Larch and spruce in the study area are known to have a similar response to climate ([29], [17], [23]). Although both spruce and larch chronologies showed a strong correlation with June temperature (up to mean r = 0.40) and in general with June-August mean summer temperature (mean r = 0.34 for larch chronologies and mean r = 0.37 for Norway spruce), correlation between the chronologies of the two different species was low and not significant (mean r = 0.15), suggesting a rather distinct response to environmental factors by the two species.
Moreover, all the statistical methods applied, excluding Ce19, considered tree growth as a parameter for identifying years in which growth is statistically different from the norm. Thus, they cannot distinguish between a climatically induced reduction in tree growth and a signal caused by an LBM outbreak. The synchronicity between the hatching of LBM eggs and larch needle sprouting is fundamental for the development of the larvae, and the survival of LBM eggs is negatively related to winter and early spring temperatures ([37], [42]). However, low spring and summer temperatures also induce narrow rings in larch, which could be interpreted as LBM outbreaks by statistical methods. When the highlighted PYs are compared with the temperature anomaly outliers (α = 0.90), 12 out of 36 PYs (Tab. 3) correspond to particularly cold summers in the area ([13], [14]). Climatically induced PYs have also been observed in the Western Alps, where other years characterized by cold summers were reported ([41], [7]). Of the 19 PYs identified as being climatically induced, 1813 and 1843 were particularly cold years (classified as outliers at 99% and 95%, respectively), and they were synchronously highlighted across all the analyzed chronologies. Beyond these years, also 1821 and 1926 were classified as cold years at 90% and both were highlighted as PYs in all chronologies as well as the more cold years (Tab. 3).
The 17 remaining statistically detected PYs (Tab. 4) that were classified as possible LBM outbreaks show high synchronicity among stands, especially between ANBO and both FUMO and PALP (Tab. 4). These chronologies share most of the ANBO highlighted PYs (six and seven out of eight, respectively), probably because the stands have a similar elevation, higher than BARC (Tab. 1). Moreover, all PYs reported for ANBO are synchronous with at least one other chronology, denoting a good synchronicity of the PYs of this stand with the LBM outbreaks highlighted in the area. A good synchronicity is observed also between FUMO and PALP, sharing six of the respectively highlighted PYs, whereas, probably due to the lower elevation, BARC present the lower synchronicity among all the considered chronologies and also the higher number of PYs highlighted in a single valley (four out of seven - Tab. 4). Most of the possible LBM outbreaks identified in this study are coherent with previous analyses, being synchronous with both weakly and strongly detected LBM outbreaks in the area ([3], [18], [42]). This synchronicity indicates that no time lag of LBM outbreaks between the stands occurred ([12], [36]). However, two of the PYs were identified for the first time in this study: 1884 (BARC, FUMO and PALP) and 1918 (ANBO, BARC and FUMO). In the first case, a high-elevation outbreak probably occurred in the area after a series of very strong outbreaks recorded during the preceding four years in nearby valleys ([18]). The 1918, instead, is synchronous with a weak outbreak recorded in two sites located slightly northmost in comparison to the study area. Thus, the high elevation sites act as LBM refugia before the massive outbreak that occurred in 1920, 1921 and 1923 in the area ([18]).
Tab. 4 - Newly identified potential LBM outbreaks (+) at the study sites. (PYs): pointer years.
| PYs | ANBO | BARC | FUMO | PALP |
|---|---|---|---|---|
| 1783 | + | + | - | + |
| 1819 | - | - | - | + |
| 1830 | + | + | + | + |
| 1838 | - | + | - | - |
| 1854 | + | - | + | + |
| 1884 | - | + | + | - |
| 1889 | - | + | - | - |
| 1902 | - | - | + | - |
| 1909 | + | - | + | + |
| 1918 | + | + | + | - |
| 1920 | - | + | - | - |
| 1923 | + | - | + | + |
| 1932/33 | + | + | + | + |
| 1953 | - | + | + | - |
| 1963/64 | + | - | + | + |
| 1971 | - | - | + | - |
| 1973 | - | + | - | - |
Although several PYs were highlighted in the four chronologies, it is impossible to identify numerically a clear cyclicity in their occurrences. The absence of a clear cyclicity is in accordance with the recognized optimum for LBM between 1700 and 2000 m a.s.l., beyond which the outbreak occurrences tend to be sporadic and random ([3], [4]). However, the wavelet analysis highlights the presence of significant cycles with a return period around 20-years in the first half of the 19th century (ANBO, BARC and PALP), decreasing to around 9-years period in the second half of the 20th century (Fig. 4). The 20-years return period is hardly ascribable to the LBM or at least to an LBM regular cycle and is coherent with the PYs analysis results that show random intervals between outbreaks in the first half of the chronologies (Fig. 4, Tab. 3). Nevertheless, the relevant 9-years period peaks recorded in the second half of the 20th century, quite synchronous in all the analyzed valleys, is totally comparable with a normal LBM cycle ([3], [41], [39]). The presence of a return period ascribable to LBM in the last fifty years of the 20th century within chronologies that before do not show evidence of regular population fluctuation of this insect, can be related to climatic changes affecting the area in the last two centuries, as reported in the Western Alps ([42]). The first half of the 19th century was characterized by low temperatures with the coldest conditions occurred around the 1850s. In fact, in the Italian Central Alps, the 1850s is identified as the period during which the last phase of the Little Ice Age (LIA) occurred. The lower temperatures could have caused the synchronicity between larch needle sprouting and LBM egg hatching at lower elevation, and thus only massive LBM outbreaks could have influenced the high-elevation stands ([37], [42]). After the LIA, the increasing temperatures shifted the optimum belt of the LBM toward higher elevations. This shift can explain the significant return period of almost 9 years, observed in high-elevation stand chronologies until the 1990s (Fig. 4). Since the 1990s, the continuous increasing in mean summer temperature is considered one of the main factor that contribute to disrupt the LBM regular cycle in the Alps ([4], [37], [42]).
The comparison of the results provided by five different methods of PYs identification, enabled us to recognize 17 LBM outbreaks in the Central Italian Alps, 14 of which occurred before 1964. Moreover, two new outbreak years (1884 and 1918) were identified for the first time in the study region, and they corresponded to the timing of outbreaks already reported in the Eastern Alps ([3], [18]). Our results increase the knowledge about LBM population cycles at high-elevation sites in this part of the Alps. Further, they provide information that is useful for interpreting and correcting dendroclimatic reconstructions for this key area, from a climatic and glaciological point of view, and for a deeper understanding of the LBM population dynamic in the whole Alpine region.
Authors’ contributions statement
The study was conducted with contributions from all authors. RC and AC performed laboratory work and participated in field activities. CB and MCS contributed to the definition of the geomorphological context and conducted field sampling. RC and PC shaped the structure of the scientific design, and RC carried out data analysis. All authors contributed in an equal manner to the discussion and interpretation of the results. The text was written by RC and AC and revised by PC, UB, MCS and CB. The project was founded, directed and coordinated by CB.
Acknowledgments
This work was financially supported by the Italian MIUR Project (PRIN 2010-11): “Response of morphoclimatic system dynamics to global changes and related geomorphological hazards” (national and local coordinator: C. Baroni) and by the project of strategic interest NEXTDATA (PNR National Research Programme 2011-2013; project coordinator: A. Provenzale CNR-IGG, WP 1.6, leader: C. Baroni UNIPI and CNR-IGG). U. Büntgen received a grant from “SustES - Adaptation strategies for sustainable ecosystem services and food security under adverse environmental conditions” (CZ.02.1.01/0.0/0.0/ 16_019/0000797). We thank the Erasmus Programme Consortia Placement traineeship program for financial support. We are also very grateful to Dr. Gino Delpero, Luca Colato and Custodi Forestali from Comune di Vermiglio (Trento, Italy) for help with field activities and sampling. We thank Dr. Fabio Angeli, who is responsible for the Ufficio Distrettuale Forestale of Malè (Trento) for his support and sampling permissions. Finally, we thank PhD Melissa A. Dawes (WSL Swiss Federal Research Institute, Birmensdorf, Switzerland) for English grammar and spell editing. The authors are grateful to three anonymous reviewers for their valuable comments to this work.
Conflict of Interest
The authors declare that they have no conflict of interest.
References
Gscholar
Gscholar
CrossRef | Gscholar
Gscholar
Authors’ Info
Authors’ Affiliation
Anna Coppola
Maria Cristina Salvatore
Carlo Baroni 0000-0001-5905-4650
Dipartimento di Scienze della Terra, University of Pisa, Pisa (Italy)
Ulf Büntgen 0000-0002-3821-0818
WSL Swiss Federal Research Institute, Birmensdorf (Switzerland)
Department of Forest and Nature Conservation, Faculty of Forestry, University of British Columbia, Vancouver BC (Canada)
Carlo Baroni 0000-0001-5905-4650
CNR-IGG, National Research Council - Institute of Geosciences and Earth Resources, Pisa (Italy)
Corresponding author
Paper Info
Citation
Cerrato R, Cherubini P, Büntgen U, Coppola A, Salvatore MC, Baroni C (2019). Tree-ring-based reconstruction of larch budmoth outbreaks in the Central Italian Alps since 1774 CE. iForest 12: 289-296. - doi: 10.3832/ifor2533-012
Academic Editor
Emanuele Lingua
Paper history
Received: Jun 23, 2017
Accepted: Apr 02, 2019
First online: May 27, 2019
Publication Date: Jun 30, 2019
Publication Time: 1.83 months
Copyright Information
© SISEF - The Italian Society of Silviculture and Forest Ecology 2019
Open Access
This article is distributed under the terms of the Creative Commons Attribution-Non Commercial 4.0 International (https://creativecommons.org/licenses/by-nc/4.0/), which permits unrestricted use, distribution, and reproduction in any medium, provided you give appropriate credit to the original author(s) and the source, provide a link to the Creative Commons license, and indicate if changes were made.

Web Metrics
Breakdown by View Type
Article Usage
Total Article Views: 47216
(from publication date up to now)
Breakdown by View Type
HTML Page Views: 33826
Abstract Page Views: 4290
PDF Downloads: 3651
Citation/Reference Downloads: 41
XML Downloads: 5408
Web Metrics
Days since publication: 2613
Overall contacts: 47216
Avg. contacts per week: 126.49
Article Citations
Article citations are based on data periodically collected from the Clarivate Web of Science web site
(last update: Mar 2025)
Total number of cites (since 2019): 6
Average cites per year: 0.86
Publication Metrics
by Dimensions ©
Articles citing this article
List of the papers citing this article based on CrossRef Cited-by.
Related Contents
iForest Similar Articles
Research Articles
Decomposition of Norway spruce and European larch coarse woody debris (CWD) in relation to different elevation and exposure in an Alpine setting
vol. 9, pp. 154-164 (online: 28 August 2015)
Research Articles
The effect of provenance of historical timber on tree-ring based temperature reconstructions in the Western Central Alps
vol. 13, pp. 351-359 (online: 25 August 2020)
Research Articles
Effects of nitrogen loading under low and high phosphorus conditions on above- and below-ground growth of hybrid larch F1 seedlings
vol. 11, pp. 32-40 (online: 09 January 2018)
Research Articles
Impact of thinning on carbon storage of dead organic matter across larch and oak stands in South Korea
vol. 9, pp. 593-598 (online: 01 March 2016)
Research Articles
Contrasted growth response of hybrid larch (Larix × marschlinsii), jack pine (Pinus banksiana) and white spruce (Picea glauca) to wood ash application in northwestern Quebec, Canada
vol. 14, pp. 155-165 (online: 06 April 2021)
Review Papers
Forests and climate change - lessons from insects
vol. 1, pp. 1-5 (online: 28 February 2008)
Review Papers
Forest health under climate change: impact of insect pests
vol. 17, pp. 295-299 (online: 30 September 2024)
Research Articles
The effects of fire on Pinus sylvestris L. as determined by dendroecological analysis (Sierra de Gredos, Spain)
vol. 15, pp. 171-178 (online: 09 May 2022)
Research Articles
Variation of major elements and heavy metals occurrence in hybrid aspen (Populus tremuloides Michx. × P. tremula L.) tree rings in marginal land
vol. 13, pp. 24-32 (online: 15 January 2020)
Research Articles
Carbohydrate metabolism during new root growth in transplanted Larix olgensis seedlings: post-transplant response to nursery-applied inorganic fertilizer and organic amendment
vol. 10, pp. 15-22 (online: 22 September 2016)
iForest Database Search
Search By Author
Search By Keyword
Google Scholar Search
Citing Articles
Search By Author
Search By Keywords
PubMed Search
Search By Author
Search By Keyword


