Effects of mild drought on the morphology of sun and shade needles in 20-year-old Norway spruce trees
iForest - Biogeosciences and Forestry, Volume 12, Issue 1, Pages 27-34 (2019)
doi: https://doi.org/10.3832/ifor2809-011
Published: Jan 10, 2019 - Copyright © 2019 SISEF
Research Articles
Abstract
Several studies have looked at how individual environmental factors influence needle morphology in conifer trees, but interacting effects between drought and canopy position have received little attention. In this study, we characterized morphological responses to experimentally induced drought stress in sun exposed and shaded current-year Norway spruce needles. In the drought plot trees were suffering mild drought stress, with an average soil water potential at 50 cm depth of -0.4 MPa. In general, morphological needle traits had greater values in sun needles in the upper canopy than in shaded needles in the lower canopy. Needle morphology 15 months after the onset of drought was determined by canopy position, as only sun needle morphology was affected by drought. Thus, canopy position was a stronger morphogenic factor determining needle structure than was water availability. The largest influence of mild drought was observed for needle length, projected needle area and total needle area, which all were reduced by ~27% relative to control trees. Needle thickness and needle width showed contrasting sensitivity to drought, as drought only affected needle thickness (10% reduction). Needle dry mass, leaf mass per area and needle density were not affected 15 months after the onset of mild drought. Our results highlight the importance of considering canopy position as well as water availability when comparing needle structure or function between conifer species. More knowledge about how different canopy parts of Norway spruce adapt to drought is important to understand forest productivity under changing environmental conditions.
Keywords
Canopy Position, Drought, Crown Light Gradient, Needle Structure, Picea abies, Transpiration
Introduction
Trees are constantly adapting to shifting environmental conditions such as light and water availability by modifying their physiology and morphology. Norway spruce (Picea abies [L.] Karst.), which is the most important commercial tree species in many European countries, is relatively sensitive to drought ([45]). Indeed, drought is suggested to be the driving factor behind the ongoing dieback of Norway spruce in many places in Europe ([16]), highlighting the need for more knowledge about how Norway spruce responds to environmental changes.
A tree’s ability to survive drought depends on different anatomical, morphological, and physiological factors. Several reports of Norway spruce responses to drought have focused on transpiration ([41]), stomatal function ([23]), tree growth ([40]), monoterpenes ([43]), xylem embolism ([6]), fine roots ([19]) or cell organelles ([47]). However, very few studies have focused on the structural response of Norway spruce needles to drought, even though needles are the key organ for photosynthesis and transpiration. One of the few existing studies on Norway spruce needles found that drought reduced needle tracheid dimensions, needle cross-sectional area, and needle xylem area ([11]). In another study, drought was found to increase the area of the needle vascular cylinder ([18]), but Gebauer et al. ([11]) observed negligible changes in this trait.
Light availability is another important factor modifying needle development, and even within a single tree the needles have different structure and function accord- ing to light gradients within the canopy ([46]). Photosynthetically active radiation (PAR) displays steep vertical gradients within Norway spruce crowns ([22]), and this favors the differentiation of typical sun and shade adapted needles ([42]). Relative to shade adapted needles, sun needles are generally shorter ([21]) and have higher density ([27]), more tracheids ([11]), larger xylem area ([11]), higher leaf mass per area ([27]), greater surface area of mesophyll ([26]) and rounder cross-sections ([21]). Under natural conditions drought episodes often increase light availability inside the canopy, because drought-stressed trees often shed some foliage or whole branches die off.
A few studies have described the interacting effects of drought and light intensity on seedling growth ([17], [1]). However, to our knowledge, studies of interacting effects of drought and light intensity (i.e., canopy position) are limited to our recent study on needle xylem/phloem area, needle cross-sectional area and tracheid dimensions in Norway spruce ([11]). Increased knowledge about needle development in response to interacting effects of drought and canopy position is crucial to understand forest productivity and for ecosystem modelling ([27]).
In this study we aim to characterize morphological responses to drought stress of sun-exposed and shaded current-year needles in young (~20 years old) Norway spruce trees. We test the following three hypotheses: (H1) canopy position will strongly influence needle morphology; (H2) drought will alter the morphology of sun and shade needles as a result of water shortage during cell division and development; and (H3) the interaction between drought and canopy position will result in stronger morphological reductions in sun adapted needles as compared to shade adapted needles.
Material and methods
Study site and experimental design
This study follows up previous studies in the same experimental stand (see [10], [11]) and we sampled needles from the same trees used in these studies. Further details about the study site and experimental design can be found in Gebauer et al. ([10]). Briefly, we used ~20-year-old Norway spruce trees that had been planted in a 1 × 1 m grid on former agricultural soil in 1990 in Ås, south-eastern Norway. Soil type was classified as albeluvisol. The mean annual precipitation is 785 mm and mean annual temperature 5.3 °C, according to data from the meteorological station in Ås, 3.9 km from the study site ([15]). Mean stand height, stand density and basal area were 8.5 ± 1.4 m, 10,000 trees ha-1, and about 50 m2 ha-1, respectively. Fine roots were abundant down to a soil depth of 60 cm in October 2010 ([4]). Two study plots, about 150 m2 each and situated ~15 m apart, were established within the stand. In each plot, we selected three individual trees, each from a different full-sib family (both plots had the same full-sib families - see [10] for data on stem and crown dimensions of each tree). Trees standing along the edges of the plots were not selected. One plot received natural rainfall and served as the control plot. On the other plot (drought plot) the three selected trees were standing in one row and the two rows of trees flanking the experimental trees were removed in August 2008. In May 2009, a plastic roof covering the entire drought plot was set up under the tree crowns. Thus, light quantities and qualities within the tree crowns were not influenced by the plastic roof. The roof was sealed onto the stems using silicone putty to prevent precipitation run-off along the stem from reaching the soil. A 30 cm deep trench was dug around the plot to intercept the precipitation and soil water. The trench was dug outside the flanking tree rows to avoid damaging the roots of the experimental trees. On 4 July 2009, trees flanking the control trees were removed to create similar tree density and light condition as in the drought plot.
Meteorology, soil water potential, light intensity and sap flow measurement
A climatic station was set up on an open field 100 m from the experimental plots to measure global radiation, air temperature and relative air humidity using EMS11 and EMS33 (EMS Brno, Czech Republic), as well as precipitation and wind speed (MetOne Instruments, Grants Pass, OR, USA). Soil water potential (SWP) was monitored in triplicate measurements on both plots at 10, 30 and 50 cm soil depth using gypsum blocks (Delmhorst Inc., Towaco, NJ, USA). All these measurements were carried out from the beginning of the vegetation period until needles were sampled (i.e., from 17 May to 7 August 2010). The amount of PAR (photosynthetically active radiation) in the two stands was measured under cloudless conditions on 4 August 2010 at 12:00 and 17:00 and compared to the PAR at an open plot nearby. At each canopy height, 100 independent PAR measurements were taken within five minutes using an EMS12® sensor (EMS Brno, Czech Republic). Sap flow was monitored from 17 May to the end of August 2010 in all six experimental trees, using EMS51® sap flow meters (EMS Brno, Czech Republic) working under the trunk heat balance principle ([7]). Sap flow was measured at 1.3 m height on the north-facing side of each tree. Tree sap flow was standardized as per unit crown projected area and expressed in millimeters (i.e., liters per m2). We considered sap flow to equal transpiration over the season. Shoot water potential was measured on excised sun exposed shoots from the upper 1-2 m of the crown of each tree on 4 August 2010 at 2:00 pm using a Scholander pressure chamber. See Gebauer et al. ([11]) for a more detailed description of measurements of sap flow, PAR, and tree and soil characteristics.
Plant material
From each of the three experimental trees per treatment, five current-year shoots were collected near the top of the tree (sun needles: upper 1-2 m of the crown) and five current-year shoots were collected at the bottom of the crown (shade needles: 3.8-4.2 m above ground) on 7 August 2010, i.e., 15 months after roof installation. The mean length of the living crown in the six experimental trees was 5.7 m. Shoots were sampled from the outer part of the southern side of the crown to minimize the effect of any microclimatic differences within the stand or canopy ([25]). Samples were fixed in FAA solution (90 ml of 70% ethanol, 5 ml of acetic acid, and 5 ml of 40% formaldehyde).
Needle analysis
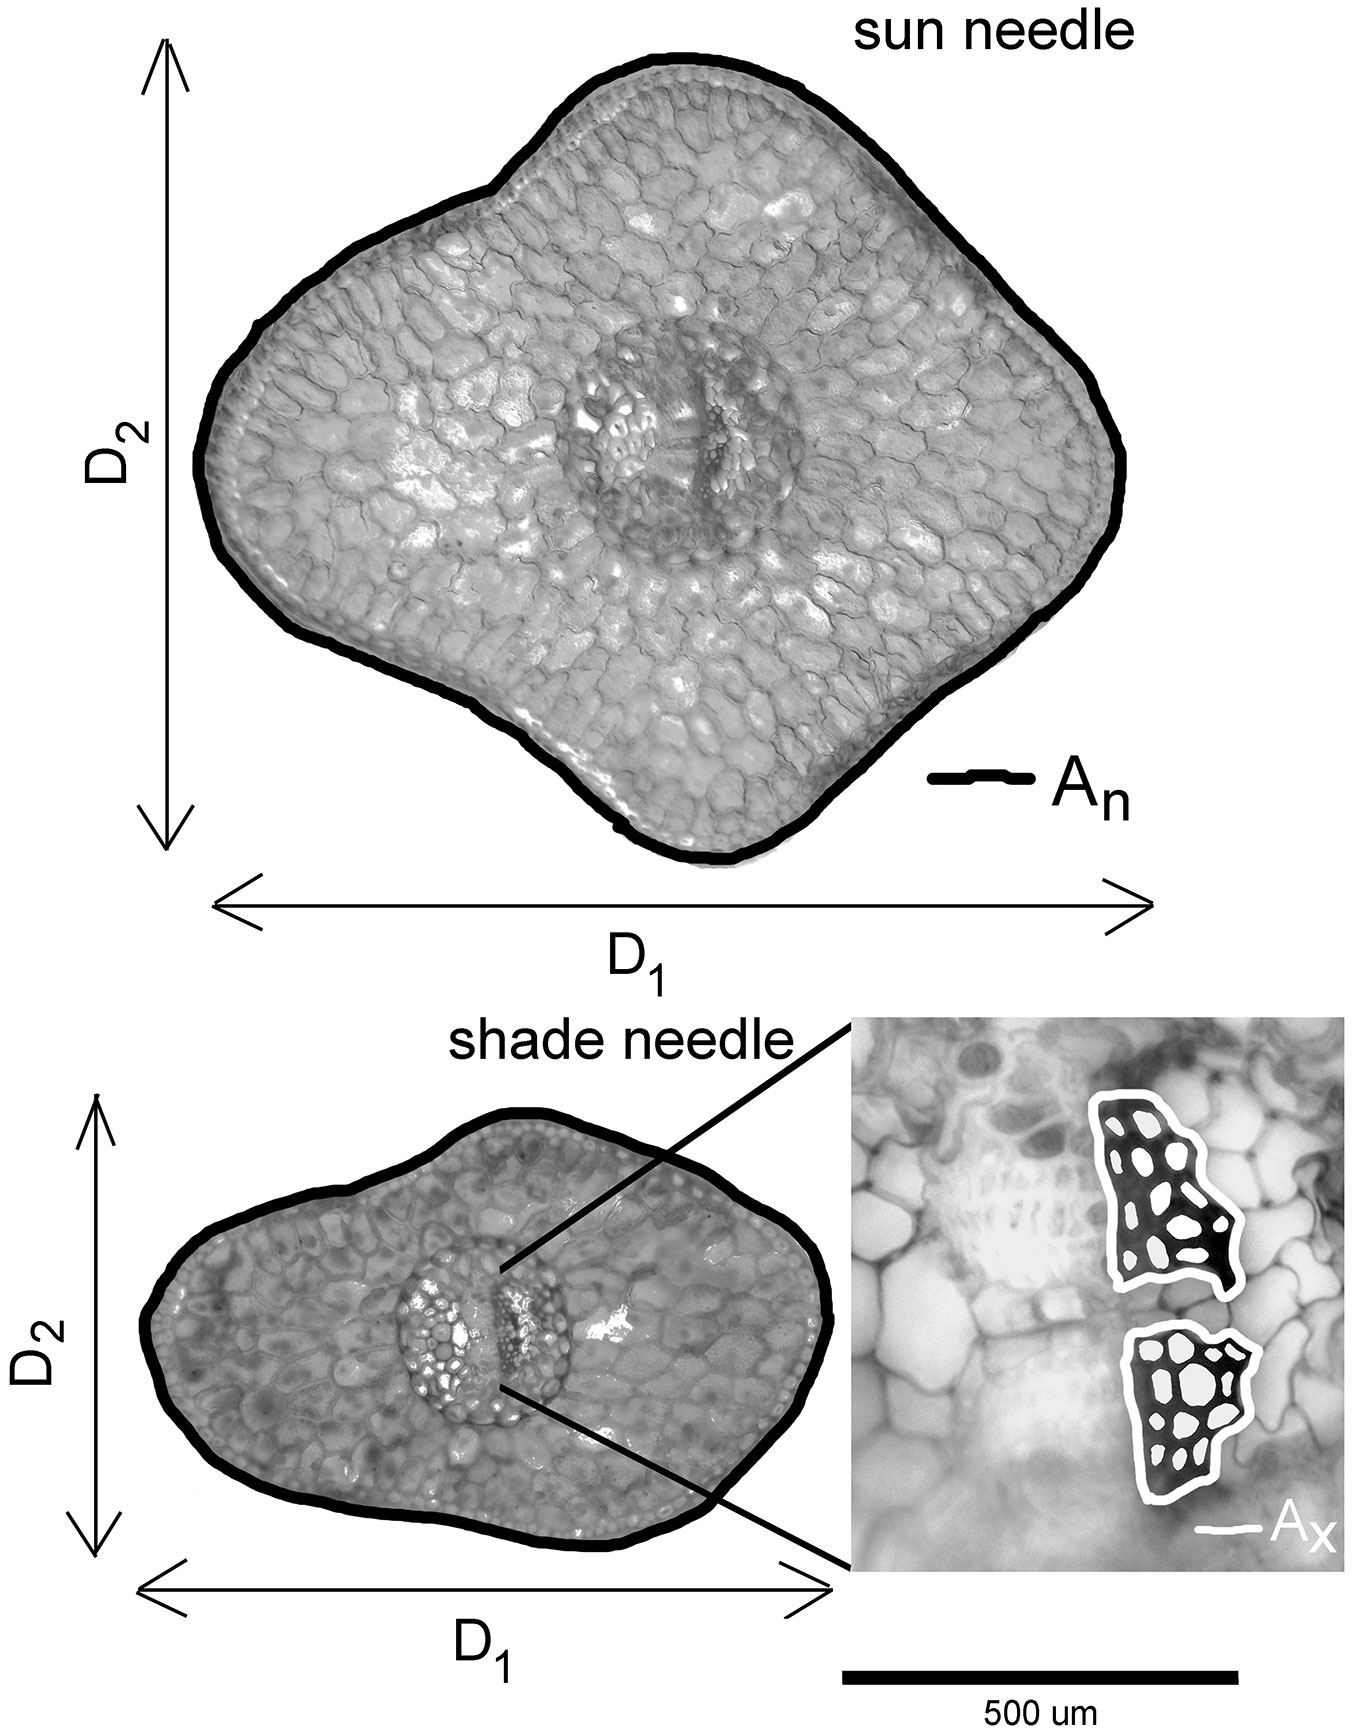
From each sampled shoot we selected seven needles for morphological characterization. Needles were collected at regular intervals along the shoot axis to cover possible within-shoot heterogeneity in needle morphology. Altogether 35 needles from each tree canopy position were analyzed (7 needles × 5 shoots). Needle cross-sections were taken near the needle base. All needle cross-sections were examined under a light microscope (Olympus BX51®, Olympus Czech Group), and photographed using a digital camera (Olympus E-330®, Olympus Czech Group) connected to a computer by the software QuickPhotomicro® ver. 2.3 (Promicra, Czech Republic). Needle thickness (D1) and needle width (D2) were determined from the sections using ImageJ ver. 1.45 analyzing software (The University of Texas Health Science Center, San Antonio, TX, USA - Fig. 1). Needle cross-sectional shape (i.e., needle flatness Fn) was calculated as the ratio D1/D2. A needle with a round or square cross-section will have Fn close to 1, and larger Fn characterizes more flattened needles.
Fig. 1 - Micrograph of a typical sun and shade needle from Norway spruce family 15 (control plot) showing measurement of needle thickness (D1), needle width (D2), cross-sectional needle area (An, black line), and xylem area (Ax, white line on the enlarged central part of the shade needle). White areas within the xylem area show tracheid lumen area (Alum).
Tab. 1 - Norway spruce needle traits, their abbreviations and units used in the study. (*): Traits in italics are anatomical traits taken from Gebauer et al. ([11]).
| Trait* | Explanation | Units |
|---|---|---|
| A lum | tracheid lumen area | µm2 |
| A n | cross-sectional needle area (Fig. 1) | mm2 |
| A x | xylem area (Fig. 1) | µm2 |
| D1 | needle thickness (Fig. 1) | mm |
| D2 | needle width (Fig. 1) | mm |
| DM | mean needle dry mass | mg |
| Fn | needle flatness (D1/D2) | - |
| Ln | needle length | mm |
| LMA | leaf mass per area (DM/PLA) | g m-2 |
| N t | number of tracheids in needle | - |
| PLA | mean needle projected area | mm2 |
| TDn | needle tissue density (eqn. 1) | g cm-3 |
| TLA | total needle area (eqn. 2) | mm2 |
In this study, we also included four anatomical needle traits described in a previous paper ([11]) to determine their relationships with different measured and calculated morphological needle traits (summarized in Tab. 1). The four anatomical traits (Alum: tracheid lumen area; An: cross-sectional needle area; Ax: xylem area; Nt: number of tracheids - see Fig. 1) were measured from the same needles used in measuring D1 and D2. To evaluate Alum and Nt, tracheid lumina were manually coloured using Adobe Photoshop® ver. 9.0 (Adobe Systems, San Jose, CA, USA) before Alum, Nt and other anatomical needle traits were determined using ImageJ analysing software (see [11] for more details). To determine leaf mass per area (LMA) and associated needle traits, 10 randomly selected sun needles and 10 shaded needles were taken from the same five sun and shade shoots sampled from each tree on 7 August 2010. The needles were first scanned to determine projected leaf area (PLA) and needle length (Ln) and then dried at 85 °C for 48 hours to determine needle dry matter (DM). PLA and Ln were determined using the software ImageJ. LMA was calculated as the ratio DM/PLA. Needle density (TDn - eqn. 1) and total needle area (TLA - eqn. 2) were calculated according to Sellin ([37]):
where r = 0.75 is the proportion of total needle length that is made up by the rectangular part of the needle projection ([37]).
Statistical analysis
We analyzed differences in monthly and seasonally accumulated sap flow between control trees and trees subjected to drought using a two-sample two-tailed t-test at the 0.05 significance level. For analysis of needle morphological traits, we used linear mixed effect models (LME -[48]). LME were used because of our hierarchical sampling strategy, where needles were collected from different trees (three trees per treatment) and from five different shoots on each tree and canopy position. LME allowed to consider variation among and within trees and shoots by specifying individual shoots within trees as a random effect. Some needle traits (DM, Ln, LMA, PLA, TDn, TLA and TLA/PLA - Tab. 1) were determined not on an individual needle level, but as the average of 10 sun or shade needles per tree. For these traits, tree was specified as a random effect and the explanatory variables canopy position (sun/shade) and drought treatment (control/drought) were set as fixed effects. In the statistical analyses, a model for each needle trait was first fitted with each of the explanatory variables. In a subsequent model, both canopy position and drought were included, and then also the interaction canopy position × drought was added. To test for the significance of canopy position and drought and obtain appropriate p-values we adopted the approach described by Zuur et al. ([48]). Briefly, we used likelihood ratio tests to compare each simpler model (incorporating either canopy position or drought) with the more complex model (incorporating canopy position, drought, and their interaction). To summarize our sampling design, we had 3 trees per treatment (6 trees in total), 2 canopy positions per tree (sun needles, shade needles), 5 shoots per canopy position, and 7 needles per shoot. Needle traits were determined either at the individual needle level or at the canopy position level (Tab. 2).
Tab. 2 - Mean values and 95% confidence intervals fitted by linear mixed effect models (LME) for morphological traits of sun and shade needles from Norway spruce trees subjected to drought stress and control trees receiving natural rainfall. For each needle trait the model with the lowest AIC* value is considered better. For an explanation of the different needle traits, see Tab. 1. (*): Akaike Information Criterion; (**): effect of drought was significant only for sun needles.
| Needle trait |
Shade needles | Sun needles | Model | AIC* | P-value | ||
|---|---|---|---|---|---|---|---|
| Control | Drought | Control | Drought | ||||
| D1 | 0.89 | 0.89 | 1.19 | 1.07 | canopy position | 4618 | <0.001 |
| (0.80-0.99) | (0.79-0.99) | (1.10-1.28) | (0.98-1.17) | drought | 5000 | 0.19 | |
| - | - | - | - | drought × canopy position** | 4585 | <0.001 | |
| D2 | 0.55 | 0.55 | 0.98 | 0.94 | canopy position | 4614 | <0.001 |
| (0.49-0.62) | (0.48-0.61) | (0.92-1.05) | (0.87-1.00) | drought | 5296 | 0.59 | |
| - | - | - | - | drought × canopy position | 4613 | 0.09 | |
| DM | 1.14 | 1.02 | 2.77 | 2.14 | canopy position | 18 | <0.001 |
| (0.67-1.61) | (0.55-1.50) | (2.29-3.24) | (1.67-2.61) | drought | 35 | 0.34 | |
| - | - | - | - | drought × canopy position | 16 | 0.14 | |
| Fn | 1.63 | 1.69 | 1.22 | 1.15 | canopy position | -124 | <0.001 |
| (1.46-1.79) | (1.52-1.85) | (1.06-1.38) | (0.99-1.32) | drought | 219 | 0.87 | |
| - | - | - | - | drought × canopy position** | -130 | 0.01 | |
| Ln | 9 | 8.1 | 13.3 | 10 | canopy position | -303 | <0.001 |
| (7.6-10.3) | (6.7-9.4) | (11.9-14.6) | (8.8-11.5) | drought | -138 | 0.17 | |
| - | - | - | - | drought × canopy position** | -420 | <0.001 | |
| LMA | 140 | 140 | 201 | 195 | canopy position | 113 | <0.001 |
| (109-171) | (109-171) | (170-232) | (164-226) | drought | 127 | 0.88 | |
| - | - | - | - | drought × canopy position | 117 | 0.9 | |
| PLA | 8.2 | 7.3 | 13.7 | 10.9 | canopy position | -59 | <0.001 |
| (6.5-10.0) | (5.5-9.0) | (12.0-15.5) | (9.2-12.7) | drought | -46 | 0.22 | |
| - | - | - | - | drought + canopy position | -63 | 0.014 | |
| TDn | 0.18 | 0.19 | 0.22 | 0.24 | canopy position | -43 | 0.02 |
| (0.14-0.23) | (0.15-0.24) | (0.17-0.26) | (0.20-0.29) | drought | -38 | 0.42 | |
| - | - | - | - | drought × canopy position | -41 | 0.45 | |
| TLA | 33 | 32 | 77 | 51 | canopy position | -12 | <0.001 |
| (25-41) | (23-40) | (69-86) | (42-59) | drought | 0.6 | 0.18 | |
| - | - | - | - | drought × canopy position** | -26 | <0.001 | |
| TLA/PLA | 3.98 | 4.46 | 5.65 | 4.81 | canopy position | 33 | 0.02 |
| (3.00-4.96) | (3.48-5.44) | (4.67-6.63) | (3.82-5.79) | drought | 38 | 0.71 | |
| - | - | - | - | drought × canopy position | 34 | 0.19 | |
To evaluate the relationships between selected morphological (D1, D2, DM, TDn, Ln, LMA) and anatomical (Alum, An, Ax, Nt) needle traits we used a similar approach as described above for analysis of needle anatomical traits. We used LME and specified one trait as the variable to be explained and the other as the explanatory variable (fixed effect). We also included the synergistic (fixed) effect of canopy position, as this was found to be important in our previous analysis. Tree was used as a random effect for models with DM, TDn and LMA. For models with other variables (analysed on shoot level), tree and shoot were used as random effects. For shoot-level traits we used the within-subject centering approach ([44]) to separate between- and within-shoot effects (only between-shoot effects are reported).
All statistical analyses were carried out in the R software environment ([33]) using the packages “lme4” ver. 1.1-7 ([2]) for LME calculations and “lmerTest” ver. 2.0-25 ([24]) for calculation of 95% confidence intervals of population means for fixed effects.
Results
Meteorology, soil water potential, light intensity and sap flow
Total precipitation during the experimental period from 17 May to 7 August 2010 (the day of needle sampling) was 232 mm, Penman-Monteith-based reference evapotranspiration 313 mm, mean air temperature 14.8 °C, and mean vapor pressure deficit 359 Pa. Total precipitation in the year preceding the needle sampling (8 August 2009-7 August 2010) was 768 mm and mean air temperature was 4.9 °C. This was below the long-term average (by 17 mm and 0.4 °C). The soil in the control plot was almost constantly wet, with only one short period of drought in late July. Mean SWP in the control plot varied from -1.1 to -0.02 MPa at different depths from early May to late August. In contrast, SWP in the upper soil layers of the drought plot was always below -1.1 MPa, the lower limit that could be measured by the gypsum blocks. However, average SWP at 50 cm soil depth in the drought plot was -0.42 ± 0.06 MPa, indicating that some water was available in deeper soil layers.
In the drought plot light availability at the sampling position in the lower canopy varied from 16 ± 1.7% (mean ± SE) of the PAR in the open area around noon (289 ± 32 vs. 1858 µmol m-2 s-1 in canopy vs. open area) to 1.6 ± 0.07% in the late afternoon (12.5 ± 0.5 vs. 782 µmol m-2 s-1). In the control plot light availability in the lower canopy varied from 14 ± 0.6% (mean ± SE) of the PAR in the open area around noon (258 ± 11.4 vs. 1896 µmol m-2 s-1) to 1.6 ± 0.07% in the late afternoon (12.5 ± 0.5 vs. 792 µmol m-2 s-1 - [11]). Light availability at the sampling position in the upper canopy was probably similar to that in the open area since needles were collected from the tips of unshaded, south-facing branches.
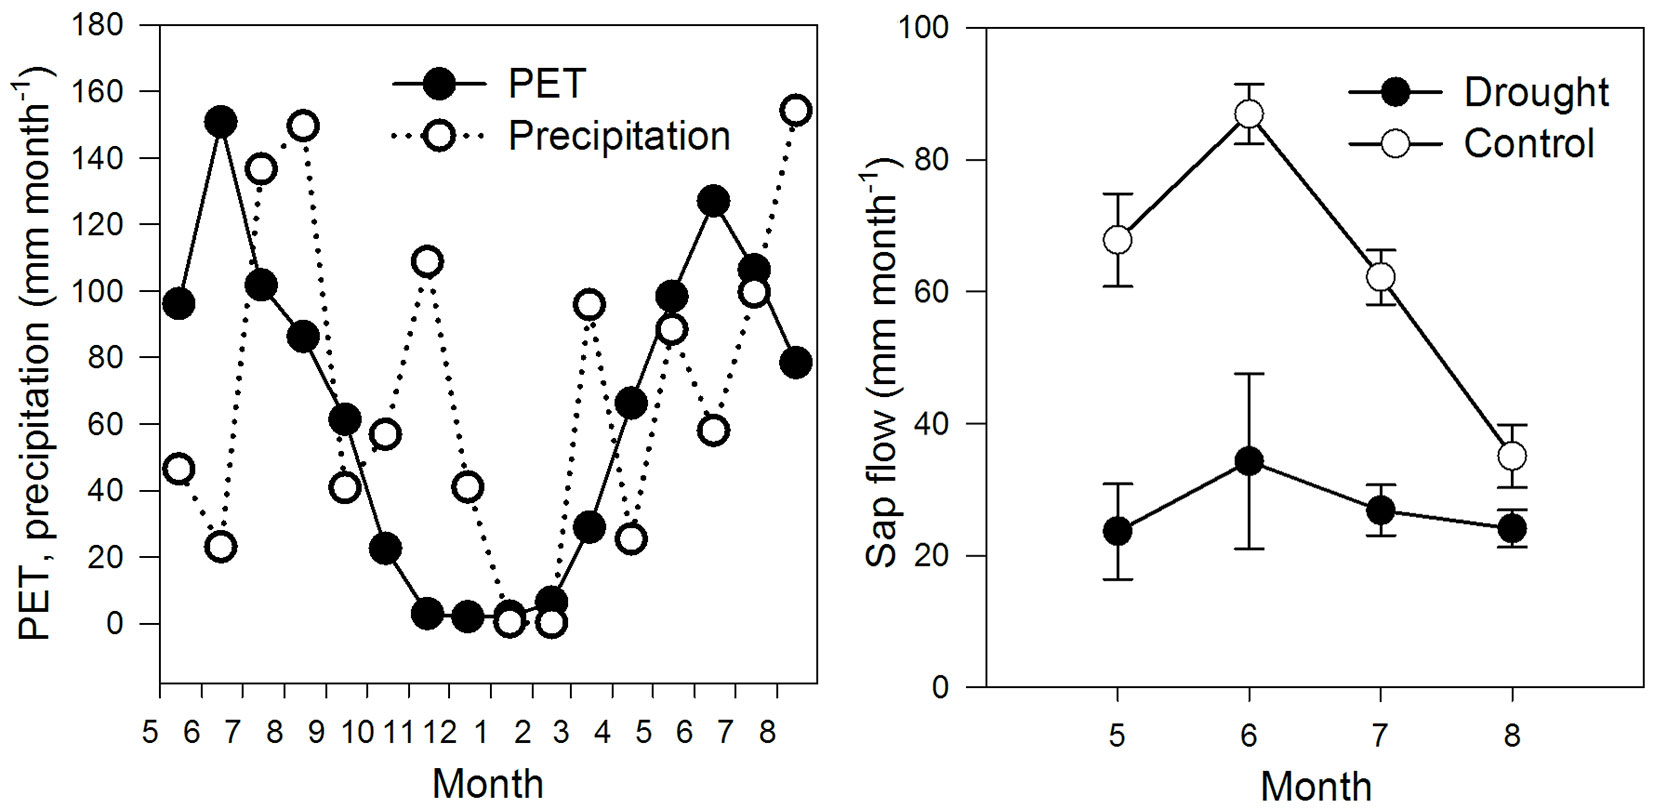
Mean cumulative sap flow in the control plot was 198 ± 21 mm (mean ± SE) from 17 May to 7 August 2010. This was 2.28 times higher than the sap flow in the drought plot (87 ± 51 mm, p = 0.011). In June 2010, when the needle growth rate normally is at its maximum, mean cumulative sap flow was 87 ± 5 mm and 34 ± 13 mm in the control and drought plot, respectively (Fig. 2). Midday shoot water potential on 4 August 2010 averaged -1.65 ± 0.12 MPa (mean ± SEM) and -1.80 ± 0.0 MPa in the control and drought-stressed trees, respectively, with no significant difference between treatments. The average transpiration of the same day was 2.03 and 1.09 mm in control and drought-stressed trees, respectively.
Fig. 2 - (Left): monthly sums of precipitation and Penman-Monteith based reference evapo-transpiration (PET) from May 2009 to August 2010. (Right): sap flow-based transpiration of drought stressed and control Norway spruce trees from May to August 2010 (monthly sums ± SE, n=3).
Effects of canopy position on needle morphology
For all studied needle traits we found significant differences between shade and sun needles (Tab. 2). In general, needle traits had greater values in the upper canopy than in the lower canopy (Tab. 2, Fig. 3). The only exception was Fn, which was greater in the lower canopy on both plots (Tab. 2, Fig. 3). Sun needles had ~40%, ~70% and ~130% larger LMA, D2 and DM, respectively, than shade needles on both plots (Tab. 2). For these traits, there was no significant interaction between drought and canopy position. TDn and TLA/PLA were least influenced by canopy position, although for these traits the difference between sun and shade needles was still high (~20%). The greater TDn of sun needles compared to shade needles was mostly caused by DM, which varied more than D1, D2 or PLA (i.e., the other traits used to calculate TDn). The TLA/PLA ratio showed that TLA was 5.2-fold and 4.2-fold greater than PLA for sun and shade needles, respectively, on both plots (Tab. 2). In general, differences between shade and sun needles needle morphological traits were reduced by 12% (calculated from all studied traits) in trees subject to drought compared to control trees.
Fig. 3 - Effect of drought (C = control plot; D = drought plot) and canopy position on morphological needle traits in three full-sib Norway spruce families. Only traits with a significant interaction between drought and canopy position are shown. Bars show 95% confidence intervals around the mean and different letters show significant differences at p ≤ 0.05.

Early morphological responses to mild drought in sun and shade needles
Drought alone had no significant effect on any of the studied needle traits (Tab. 2). For many traits, this was partly due to the fact that shade and sun needles differ in their early morphological responses to drought. For five of the 10 studied needle traits (D1, Fn, Ln, PLA and TLA) the drought × canopy position interaction was significant (Tab. 2, Fig. 3), and in-depth analysis of this interaction revealed that only sun needles were affected by drought (Tab. 2). The greatest influence of drought on sun needles was observed for Ln, PLA and TLA, which were reduced by 27, 10 and 32%, respectively, relative to control trees (Tab. 2). The drought × canopy position interaction was non-significant for D2, DM, LMA, TDn and the TLA/PLA ratio (Tab. 2). D1 and D2 showed different sensitivity to drought, as only the thickness of sun needles was reduced by drought (10% reduction). The reduced thickness of sun needles in response to drought corresponded with the observed decrease in sun needle flatness in the drought plot (Tab. 2).
Relationships among morphological and anatomical needle traits
The morphological traits measured at the individual needle level (D1, D2, Ln) showed a significant relationship with most of the selected anatomical and morphological needle traits (Tab. 3). For needle traits measured at the canopy position level (DM, LMA, TDn), half of the tested relationships were significant for DM and LMA, whereas only one significant relationship was found for TDn (Tab. 3). All the significant relationships found among needle traits were positive (Tab. 3). Canopy position tended to have little effect on the relationship between traits, as only six of 26 tested relationships were significant (Tab. 3).
Tab. 3 - Relationship between anatomical and morphological traits of sun and shade needles from Norway spruce trees subjected to drought and control trees receiving natural rainfall. For an explanation of the different needle traits, see Tab. 1 and Methods. (*): Traits in italics are anatomical traits taken from Gebauer et al. ([11]).
| Needle traits | P-value for needle trait | Regression slope | P-value for canopy position |
Needle traits | P-value for needle trait | Regression slope | P-value for canopy position | ||
|---|---|---|---|---|---|---|---|---|---|
| D1 | D2 | <0.001 | 0.5900 | 0.520 | Ln | D1 | <0.001 | 0.0012 | 0.760 |
| A lum | 0.001 | 36.5600 | 0.060 | D2 | 0.220 | 0.0005 | 0.620 | ||
| A n | <0.001 | 0.0009 | 0.790 | A lum | 0.150 | 0.0275 | 0.990 | ||
| A x | <0.001 | 0.3010 | 0.330 | A n | 0.030 | 9.32·10-7 | 0.940 | ||
| N t | <0.001 | 14.2000 | 0.950 | A x | <0.001 | 6.00·10-5 | 0.220 | ||
| D2 | A lum | 0.030 | 23.5700 | 0.001 | N t | <0.001 | 0.0400 | 0.320 | |
| A n | <0.001 | 0.0012 | <0.001 | LMA | D1 | 0.844 | 0.0169 | 0.051 | |
| A x | <0.001 | 0.2500 | 0.010 | D2 | 0.028 | 0.1840 | 0.559 | ||
| N t | 0.001 | 12.4200 | 0.560 | TDn | 0.001 | 609.0000 | 0.011 | ||
| DM | D1 | 0.029 | 0.0031 | 0.123 | A x | 0.655 | 0.0096 | 0.069 | |
| D2 | 0.007 | 0.0042 | 0.473 | TDn | D1 | 0.206 | -0.0002 | 0.036 | |
| TDn | 0.623 | 2.1000 | 0.002 | D2 | 0.142 | 0.0002 | 0.512 | ||
| A x | 0.108 | 0.0007 | 0.089 | A x | 0.983 | 6.7·10-7 | 0.247 | ||
Discussion
Effects of canopy position on needle morphology
Previous studies have shown that needle development within tree canopies is mostly influenced by long-term light availability, which leads to anatomical ([11]) and morphological changes ([9], [31]). This was also supported by our study, as we found that shade needles in the lower canopy had significantly smaller values for morphological traits compared to sun needles in the upper canopy. Thus our first hypothesis was supported.
The lower LMA of shade needles compared to sun needles reflects the higher efficiency with which these needles capture light relative to the biomass invested. The pattern of LMA variation found within tree canopies also enhances the foliage’s capacity for photosynthesis under conditions of high light intensities and their light harvesting efficiency under low light intensities ([29]). The range of LMA values found in our study (115-223 g m-2) was broad but falls within the range found by others for Norway spruce trees ([13], [20]). The variation in LMA that we observed within Norway spruce crowns were mostly attributed to changes in needle width (D2) and needle tissue density (TDn).
Sun needles were longer and had larger projected needle area than shade needles, reflecting their increased capacity for light capture. Needle length was also positively correlated with needle xylem area and tracheid number (Ax and Nt), consistent with a higher water transport capacity of the longer sun needles. Although the xylem in Norway spruce needles consists of thick-walled tracheids, we found no strong relationship between TDn and Ax. This is probably because the xylem makes up a very small proportion of total needle cross-sectional area in Norway spruce (0.3% according to [11]).
In our study, TDn was higher in sun needles in the upper canopy than in shade needles in the lower canopy. A similar trend was also found for Tsuga heterophylla (Raf.) Sarg. ([34]) and Pinus radiata D. Don ([31]). Nevertheless, an extensive review of the literature has shown that a wide range of relationships exists between TDn and light intensity (equivalent to canopy position) among conifers ([28]). This review concluded that TDn is determined by other environmental factors that inherently accompany light gradients. Moreover, a positive relationship exists between TDn and needle carbon content per needle dry mass, and higher needle carbon content may be attributed to increased thickening and lignification of needle cell walls ([28]). This assumption is supported by our finding that TDn was more influenced by needle dry mass (DM) than by D1 or PLA (i.e., the other traits used to calculate TDn). The higher TDn of sun needles means that sun needles require a higher energy investment than shade needles, but the net effect on the tree’s energy budget is probably outweighed by their higher photosynthetic activity ([29]).
In Norway spruce needle thickness (D1) tends to become larger and less variable than needle width (D2) going from the lower to the upper canopy ([27], [28]) and our data replicated this pattern. However, the relationship between D1 and D2 was still highly significant and positive. Both D1 and D2 were also positively correlated with all the studied anatomical needle traits (Alum, An, Ax and Nt). In an ecological context, it may be advantageous for the trees to increase the thickness of sun needles, as it increases the needle mesophyll area per surface area which in turn increases the diffusive conductance of the mesophyll to CO2 ([27], [26]). Moreover, thick needles are expected to have greater light absorbance than thin needles due to increasing path length ([32]). The higher sensitivity of D2 to canopy position compared to D1 results in variation in needle flatness (Fn) within Norway spruce crowns. The different sensitivity of D1 and D2 to canopy position is also influencing the TLA/PLA ratio, as smaller ratios are characteristic of more flattened needles.
Early morphological responses to mild drought in shade needles
In our study, the morphology of shade needles developing under mild drought conditions was very similar to that of shade needles in the control trees. Thus, our second hypothesis was not supported for shade needles. Part of the reason for this may be that shade needles experienced less drought stress than sun needles. In Norway spruce, shade needles have significantly higher water potential than sun needles ([36], [39]). Also, shade needles have low overall transpiration rates ([36], [39]). Transpiration rates would be low for shade needles in both drought-stressed trees and control trees because the lower light intensities and wind speeds typically found at the bottom of the canopy reduce water vaporization. Another reason for the weak drought response of shade needles could be that these needles are already physiologically constrained and operate close to their survival threshold ([39]). Because of their small size and reduced photosynthesis ([3]) and hydraulic conductivity ([11]), further structure reductions in shade needles might lead to needle mortality, nee- dle shedding and eventually death of branches.
We should emphasize that the trees in our drought plot still received some water from deeper soil layers. This allowed them to maintain 44% of the transpiration level of the control trees. The moderate soil water potential measured in deeper soil layers (-0.42 MPa) indicated that our experimental trees were experiencing mild drought stress. The minimum water potential of -1.8 MPa indicated that trees subject to drought stress were far from the water potential inducing 50% loss of xylem hydraulic conductivity. This threshold has been found to be -2.5 MPa for 24-year-old Norway spruce in Sweden ([35]) and -4 MPa for young Norway spruce in southern Poland ([6]). The minimum water potential in our study was also higher than the typical turgor loss point for Norway spruce of about -3 MPa ([12]). The relatively mild drought stress experienced by our experimental trees clearly does not kill the trees in a short time, but even mild drought stress with a minimum water potential of -1.8 MPa affected tree anatomy and physiology (i.e., transpiration, stomatal conductance, and photosynthesis). Such effects may persist for several weeks and even after re-watering ([6]).
Early morphological responses to mild drought in sun needles
Smaller cell dimensions are a typical outcome when drought stress occurs during tree development, due to reduced turgor in the cell elongation phase ([5]). Our observations fit with this pattern, as drought reduced five of the ten studied sun needle traits by 6 to 34%. Thus, our second hypothesis was supported for sun needles. This also means that drought had a higher impact on sun needles than on shade needles, thus supporting our third hypothesis. The extensive morphological plasticity we observed in sun needles 15 months after the onset of drought also confirms that needles are among the tree parts that are most sensitive to environmental changes ([8]). Mild drought stress is known to cause much less pronounced structural modification of needles than severe drought ([8]). Consequently, the increase in LMA and TDn observed in several studies of severe drought stress ([30], [14]) was not observed in our study. However, we cannot rule out that mild but prolonged drought stress would result in stronger morphological needle plasticity. Although we observed extensive plasticity of sun needle morphology to drought in this study, we found even stronger reductions in anatomical needle traits at the cellular level in a previous study (10 to 45% reductions - [11]).
Conclusion
Canopy position influenced all the morphological needle traits we studied. Our results also showed that early morphological responses to drought differ between sun and shade needles: sun needles underwent pronounced morphological changes, while no such plastic responses were observed in shade needles. The interactive effect of drought and canopy position resulted in smaller morphological differences between needle types in trees subject to drought stress vs. control trees, as sun adapted needles in the upper crown were more affected by drought than shade adapted needles at the bottom of the crown.
Our results demonstrate that canopy position and water availability may modify the morphology of Norway spruce needles in diverse ways. We propose that unaccounted differences in water availability could explain some of the inter-specific variability reported for conifers in the relationship between needle morphology and light intensity. However, the generality of our results needs to be confirmed by further replication of our morphological studies across Norway spruce genotypes and different soil and environmental conditions.
Acknowledgments
This work was funded by the project “Indicators of Tree Vitality” (Reg. No. CZ.1.07/ 2.3.00/20.0265) co-financed by the European Social Fund and the Czech Republic, by Iceland, Liechtenstein and Norway through the EEA Financial Mechanism (grant no. A/CZ0046/2/0009), by the Ministry of Education, Youth and Sports of the Czech Republic (Grant INTER-TRANSFER LTT17033), and by Mendel University in Brno (grant no. IGA 73/2013). We would also like to acknowledge the contribution of the COST Action FP1106, STReESS. We are grateful to Jaromíra Dreslerová, Alžbeta Malotínová and Darina Smerekovská for laboratory work. We would like to thank several anonymous reviewers for their constructive comments, which improved the manuscript.
Conflict of interest
The authors declare that they have no conflict of interest.
References
Gscholar
Gscholar
CrossRef | Gscholar
CrossRef | Gscholar
CrossRef | Gscholar
CrossRef | Gscholar
Gscholar
Authors’ Info
Authors’ Affiliation
Daniel Volarík
Josef Urban
Department of Forest Botany, Dendrology and Geobiocoenology, Mendel University in Brno, Zemedelská 3, 61300 Brno (Czech Republic)
Siberian Federal University, Krasnoyarsk (Russia)
Nina Elisabeth Nagy
Toril Drabløs Eldhuset
Paal Krokene
Norwegian Institute of Bioeconomy Research, PO Box 115, N-1431 Ås (Norway)
Corresponding author
Paper Info
Citation
Gebauer R, Volarík D, Urban J, Børja I, Nagy NE, Eldhuset TD, Krokene P (2019). Effects of mild drought on the morphology of sun and shade needles in 20-year-old Norway spruce trees. iForest 12: 27-34. - doi: 10.3832/ifor2809-011
Academic Editor
Tamir Klein
Paper history
Received: Apr 10, 2018
Accepted: Oct 30, 2018
First online: Jan 10, 2019
Publication Date: Feb 28, 2019
Publication Time: 2.40 months
Copyright Information
© SISEF - The Italian Society of Silviculture and Forest Ecology 2019
Open Access
This article is distributed under the terms of the Creative Commons Attribution-Non Commercial 4.0 International (https://creativecommons.org/licenses/by-nc/4.0/), which permits unrestricted use, distribution, and reproduction in any medium, provided you give appropriate credit to the original author(s) and the source, provide a link to the Creative Commons license, and indicate if changes were made.

Web Metrics
Breakdown by View Type
Article Usage
Total Article Views: 48598
(from publication date up to now)
Breakdown by View Type
HTML Page Views: 39274
Abstract Page Views: 5058
PDF Downloads: 3320
Citation/Reference Downloads: 8
XML Downloads: 938
Web Metrics
Days since publication: 2729
Overall contacts: 48598
Avg. contacts per week: 124.66
Article Citations
Article citations are based on data periodically collected from the Clarivate Web of Science web site
(last update: Mar 2025)
Total number of cites (since 2019): 7
Average cites per year: 1.00
Publication Metrics
by Dimensions ©
Articles citing this article
List of the papers citing this article based on CrossRef Cited-by.
Related Contents
iForest Similar Articles
Research Articles
Developing stand transpiration model relating canopy conductance to stand sapwood area in a Korean pine plantation
vol. 14, pp. 186-194 (online: 14 April 2021)
Research Articles
Leaf transpiration of drought tolerant plant can be captured by hyperspectral reflectance using PLSR analysis
vol. 9, pp. 30-37 (online: 05 October 2015)
Research Articles
Effect of family, crown position, number of winter buds, fresh weight and the length of needle on rooting ability of Pinus thunbergii Parl. cuttings
vol. 9, pp. 370-374 (online: 11 January 2016)
Research Articles
Oak sprouts grow better than seedlings under drought stress
vol. 9, pp. 529-535 (online: 17 March 2016)
Research Articles
Response of juvenile progeny of seven forest tree species and their populations to simulated climate change-related stressors, heat, elevated humidity and drought
vol. 11, pp. 374-388 (online: 15 May 2018)
Research Articles
The influence of age and crown position on growth efficiency along a Scots pine chronosequence
vol. 12, pp. 474-479 (online: 14 October 2019)
Research Articles
Needle traits of understory Silver fir, Norway spruce, and Scots pine in response to increased canopy openness in a birch-dominated stand
vol. 18, pp. 273-282 (online: 14 October 2025)
Research Articles
Links between phenology and ecophysiology in a European beech forest
vol. 8, pp. 438-447 (online: 15 December 2014)
Research Articles
Sap flow, leaf-level gas exchange and spectral responses to drought in Pinus sylvestris, Pinus pinea and Pinus halepensis
vol. 10, pp. 204-214 (online: 01 November 2016)
Research Articles
Canopy temperature variability in a tropical rainforest, subtropical evergreen forest, and savanna forest in Southwest China
vol. 10, pp. 611-617 (online: 17 May 2017)
iForest Database Search
Search By Author
Search By Keyword
Google Scholar Search
Citing Articles
Search By Author
Search By Keywords
PubMed Search
Search By Author
Search By Keyword


