Hydrological simulation of a small forested catchment under different land use and forest management
iForest - Biogeosciences and Forestry, Volume 13, Issue 4, Pages 301-308 (2020)
doi: https://doi.org/10.3832/ifor3221-013
Published: Jul 10, 2020 - Copyright © 2020 SISEF
Research Articles
Abstract
This paper describes the assessment of the SWAT hydrological model to reproduce continuous daily streamflow and simulate scenarios of forest management for a small catchment under tropical climate in Aracruz, Brazil. The main land use of the catchment consisted of eucalyptus cultivation. The SWAT parameters were calibrated and validated using daily hydrologic and meteorological data from 1997 to 2004. The statistical indices of SWAT validation (NS = 0.74, PBIAS = -14.34%, RSR = 0.51) show that SWAT performance was satisfactory in this application. Different land use and forest management scenarios were simulated with the aim of assessing their influence over the streamflow. The scenarios were: catchment under eucalyptus cultivation with three different forest managements and catchment under the native forest (Atlantic Rainforest). The scenarios simulations did not show significant changes in the long-term average streamflow. Minimum, maximum, and average annual streamflows were higher for eucalyptus scenarios compared to the native forest scenario. These results should be carefully applied to other watersheds as they reflect soil, landscape, and climate characteristics, as well as the geographic location, size, and use of water of the plantings and other vegetation.
Keywords
Hydrological Modeling, Soil and Water Assessment Tool (SWAT), Atlantic Rainforest, Eucalyptus
Introduction
The alteration of landscapes by humans has led to a gradual increase in the scarcity of water and degradation of its quality ([24]). Over the last decades, there has been a growing consensus that the interaction between water and land use should be approached effectively in the pursuit of water sustainability, integrating territorial planning with the watershed scale management ([36]).
The maintenance of water resources is intimately related to the proper use of the soil and the land cover from a natural mechanism of dynamic equilibrium. There is a delicate interrelation between land use, soil, and water. When some interference occurs in that dynamic, the effects affect the system as a whole. The alteration of land use modifies the environmental equilibrium affecting the hydrological processes in watersheds ([30], [16]).
The influence of land use on quantitative and qualitative aspects of water is difficult to quantify, especially in the long term and on a large scale, such as in a regional watershed, where complex interactions occur ([15]). In that sense, the characterization of the hydrological behavior of the watersheds due to land-use changes, in many cases, becomes unfeasible due to the complexity of the hydrological cycle processes.
When speaking about water quantity and quality, we often associate forests with water yield. Brazil is a forested country, with 494 million hectares (58% of its territory) of natural and planted forests, which represents one of the largest areas of forests on the planet ([20]). Within the Brazilian forest sector, 98.5% are natural forests, while 1.5% are forest plantations. The planted forests are gaining more and more space in Brazil, and the concern about the development of forestry is related to the consequences of possible impacts from forestry activity on water availability and quality. These impacts are caused mainly by the export of nutrients and sediments by surface runoff and water consumption by the trees ([13]).
Hydrological modeling is an essential tool that allows understanding water dynamics at catchments and foresees impacts of land-use changes over catchment hydrology ([10]). The results of modeling experiments would help to establish environmental impact assessment procedures and adopt techniques that allow ensuring an increase in forest productivity, and an optimization of water use as well ([14]). Among the hydrological models, the Soil and Water Assessment Tool (SWAT) has been applied worldwide, with satisfactory results in many catchments in Brazil ([18], [10], [28]). However, SWAT performance to simulate the hydrology of small forested catchments still needs to be assessed.
This paper has as the following objectives: (i) to assess the applicability of SWAT for the estimation of streamflow in a small tropical catchment (drainage area of 2.84 km2) where the primary land use is the cultivation of eucalyptus; (ii) to evaluate the impacts of different land use and forest management systems over the catchment streamflow.
Material and methods
Case study
The case study was a small experimental catchment located in the city of Aracruz, State of Espirito Santo, Brazil, between the coordinates 19° 51′ 16″ S to 19° 52′ 18″ S, and 40° 11′ 44″ W to 40° 13′ 15″ W (Fig. 1). The Aracruz Experimental Small Catchment (AESC) has a drainage area of 2.84 km2, and its altitudes vary between 15 to 53 meters above the sea level. The local climate is Aw (Tropical savanna climate with dry-winter), according to the Köppen classification, with annual precipitation between 1000 and 1300 mm year-1 and mean annual temperature between 22° and 24° C.
Fig. 1 - Location of the AESC at Aracruz county, Brazil.
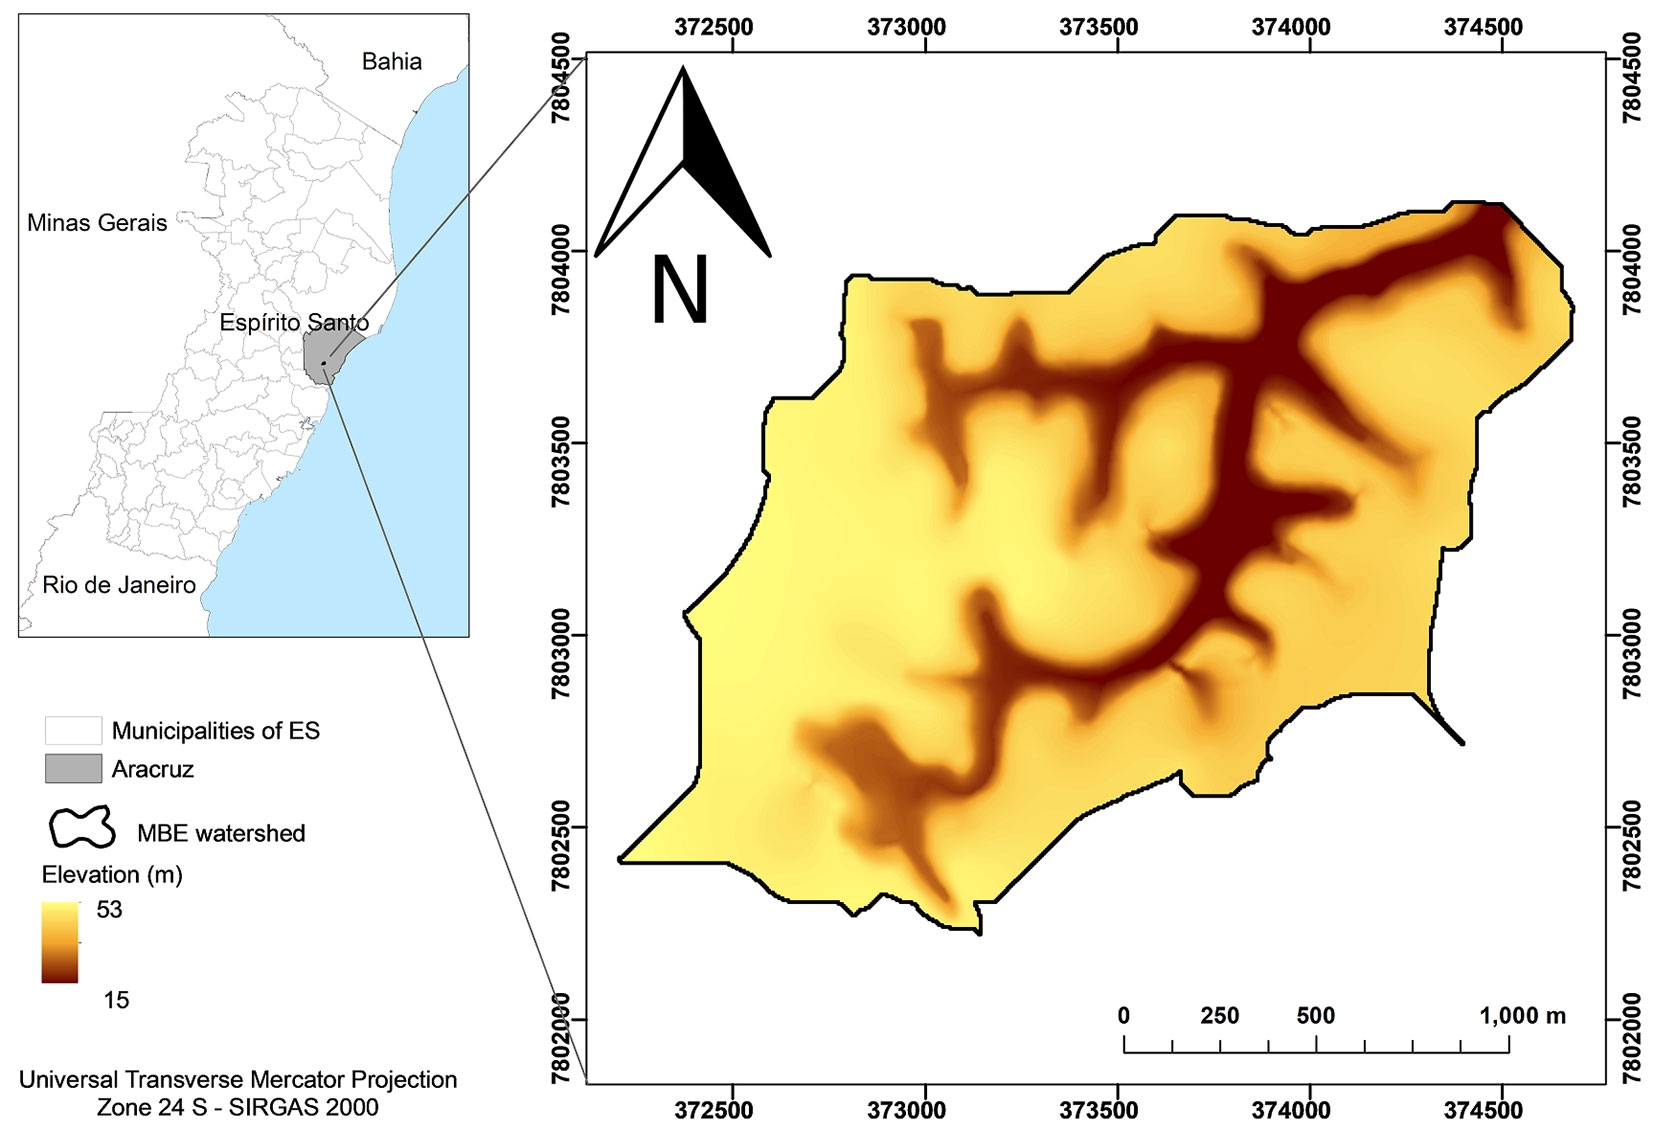
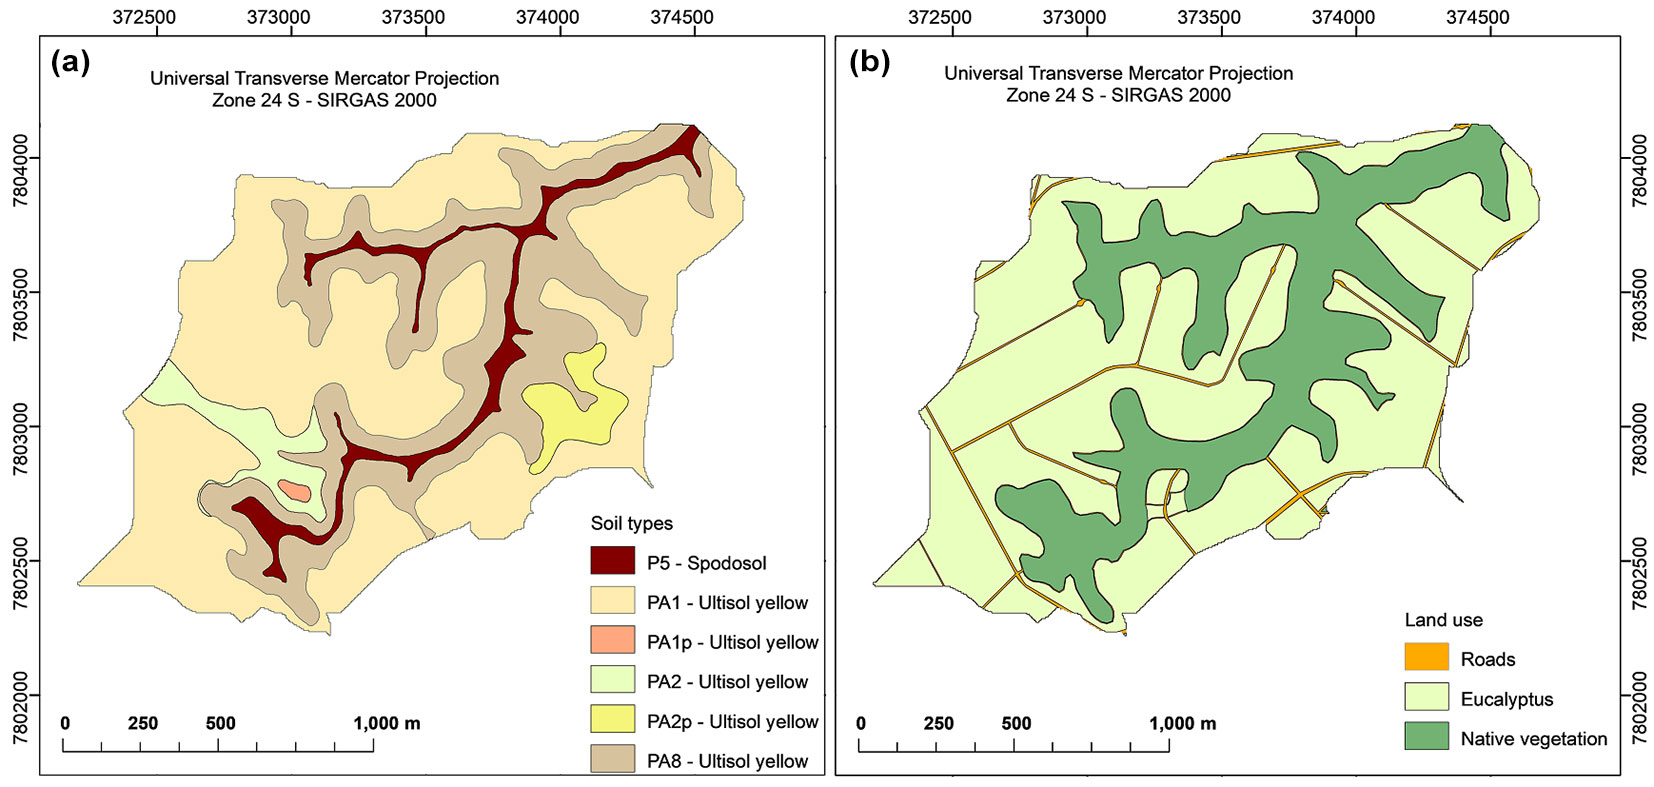
The predominant types of soils are the Argisols and the Spodosols (Fig. 2a). In terms of soil cover (Fig. 2b), the vegetation is composed of eucalyptus plantations and native vegetation. Approximately 66% of the basin area is occupied by eucalyptus, with a production cycle of about 7 years, 30% by native vegetation in advanced and medium stages of regeneration, and 4% were ground roads to meet the needs of management of eucalyptus. In the areas of eucalyptus planting, gentle topography predominates, whereas in the native vegetation, steeper slopes are present. The areas of native vegetation configure the areas under permanent preservation (APP) around the streams.
Fig. 2 - Map of soil types (a) and land use (b) of the AESC.
SWAT model
SWAT is a hydrological model developed to assess the impacts of changes in land use and land occupation on the hydrological cycle, sediment yield, and water quality in watersheds ([6]). The model spatially simulates soil water content, surface runoff, soil erosion, nutrient cycling, crop growth, and management practices for each Hydrological Response Unit (HRU) with similar characteristics of topography, land use, and type of soil.
SWAT requires input data that includes daily meteorological data with information on precipitation, solar radiation, wind speed, relative humidity, and maximum and minimum temperatures. Input data is incorporated into the model using tables that contain information about the weather stations, soil, and land use. Based on these input data, SWAT establishes the water balance of each HRU and summarizes it for the whole catchment.
Input data
The SWAT input data, such as the digital elevation model (DEM) with 5 m of spatial resolution, soil map, land use map, and meteorological data, were obtained from the instrumentation and experiments in the AESC for hydrological analyzes and made available by the company Fibria Celulose S.A. The information about relief, land use, and soil types were processed using the software QGIS ver. 3.10 to create thematic images as input files required by the model. The sub-basins delineation and slope maps were derived from the DEM by SWAT processing.
Meteorological elements and streamflow on the outlet of AESC were determined on a daily scale from 1994 to 2004. For the meteorological measures, one automatic station was installed above the canopy, measuring precipitation, global radiation, wind speed, air temperature, and relative humidity. The streamflow was monitored by the use of a triangular weir equipped with an automatic water level sensor (pressure transducer).
The soil and land use maps (Fig. 2) were used as SWAT input. The soil physical and hydrological parameters necessary for the application of SWAT model were previously determined ([32]). The 35 vegetation parameters were obtained from the SWAT database, except the eucalyptus’ parameters that were adapted according to Tab. 1.
Tab. 1 - Eucalyptus input parameters modified in the SWAT crop growth database. Sources: (1) [32]; (2) [37]; (3) [2]; (4) Personal communication with researchers of the company Fibria Celulose S. A.
| Abbreviation | Description | Value |
|---|---|---|
| HVSTI | Harvest index for optimal growing conditions | 0.9 (4) |
| BLAI | Maximum potential leaf area index | 5 (2) |
| CHTMX | Maximum canopy height (m) | 20 (4) |
| RDMX | Maximum root depth (m) | 3 (4) |
| TOPT | Optimal temperature for plant growth (°C) | 25 (4) |
| TBASE | Minimum (base) temperature for plant growth (°C) | 8 (4) |
| GSIC | Maximum stomatal conductance at high solar radiation and low vapor pressure deficit (m s-1) | 0.009 (1) |
| ALAIMIN | Minimum leaf area index for plant during the dormant period (m2 m-2) | 1.5 (4) |
| BIOLEAF | Fraction of tree biomass accumulated each year that is converted to residue during dormancy | 0.15 (4) |
| MAT_YRS | Number of years required for tree species to reach full development (years) | 7 (4) |
| EXT_COEF | Light extinction coefficient | 0.8 (3) |
| BMDIEOFF | Biomass dieoff fraction | 0.05 (4) |
The eucalyptus forest areas featuring different management practices were delineated according to personal communication with researchers at Fibria Celulose S.A. company, with areas for pulp production (7-year production cycle) and wood production for timber wood (14-year production cycle). The eucalyptus management for AESC was edited based on planting, fertilization, and harvesting operations. In this step, the curve number parameter (CN) has been updated for each management operation.
Calibration and validation of the SWAT model
The meteorological and hydrological data sets were separated into two different periods, one for the SWAT calibration (1994-2000) and the other for SWAT validation (2001-2004). SWAT-CUP software was used for sensitivity and automatic calibration analysis. SWAT-CUP algorithm accounts for the uncertainties by a measure known as the P-factor, which is the percentage of observed data within 95% of uncertainty prediction (95PPU). Later, manual calibration of the parameters that did not respond well to automatic calibration was performed.
The ability of the SWAT model to reproduce daily streamflow was assessed by the use of some statistical indices as well as by graphical analysis. The following statistical indices ([19], [9]) were calculated: Nash and Sutcliffe efficiency (NS - eqn. 1), percent bias (PBIAS - eqn. 2), and ratio of mean squared error to the standard deviation of the measured data (RSR - eqn. 3):
where n is the number of daily streamflow data; Oi is the observed daily streamflow; Si is the simulated daily streamflow; Πis the average of the observed streamflow.
Simulation of streamflows considering different land use and forest management scenarios
As a next step, simulations considering four different land use and forest management scenarios were run at SWAT. The scenarios consisted in: (i) NF - native forest: the whole catchment area covered with native vegetation (Atlantic Rainforest); (ii) CE - cellulose eucalyptus: the whole AESC area covered with eucalyptus plantation with management destined to the production of cellulose; (iii) TE - timber eucalyptus: the whole AESC area covered with eucalyptus plantation with management destined for timber wood; (iv) ME - mixed eucalyptus: reproduces the same forest management used in the calibration and validation of SWAT, in which the eucalyptus areas are managed for pulp production (7 years cycle) and timber wood (14 years cycle).
In all the scenarios, the areas under permanent preservation (APP) along the stream remained occupied by native vegetation, as preconized by Brazilian Forest Code.
The simulations of the scenarios occurred continuously for 35 years, using a synthetic series obtained by the statistics of the WGN Generator. Of the 35 years, 7 years were used to the model warm-up, and 28 years for the evaluation of the simulations. The purpose of this separation was to obtain cycles of approximately 7 years for the production of wood destined for cellulose and approximately 14 years for timber.
In the simulated period in each scenario, the following reference streamflows were determined: long-term average streamflow (Qmean), minimum streamflow that is exceeded 90% of the time (Q90), and maximum streamflow with a return period of 10 years (Qmax). These three reference flows were chosen due to its usage in most of the Brazilian Laws concerning the Water Resources Management. The Tukey test (α = 0.01) was applied to infer if the Qmean calculated for the scenarios were different from each other.
Results
Calibration and validation of the SWAT model
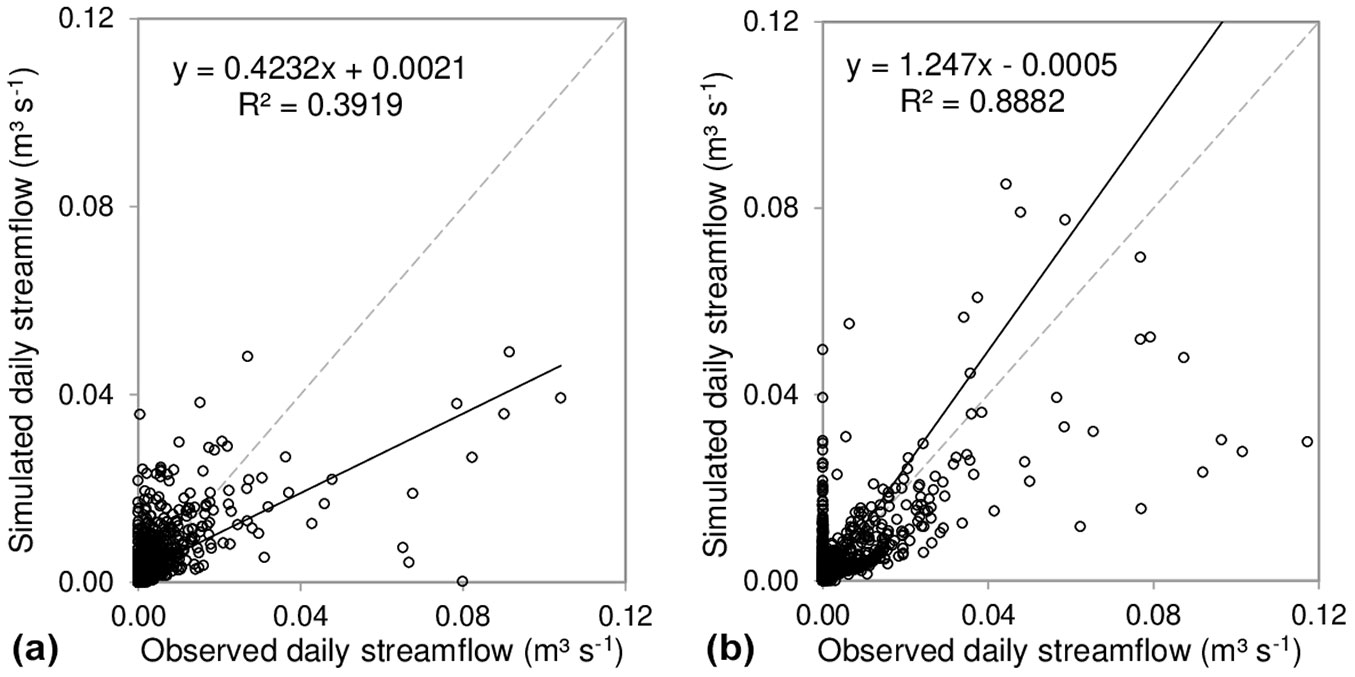
Tab. 2 shows the values of the SWAT calibrated parameters for the simulation of AESC daily streamflow. Tab. 3 presents the calculated statistical indices for the streamflow simulation, before and after calibration, as well as for the validation period. Fig. 3 shows the measured and simulated daily streamflows for the calibration (1997-2000) and validation (2001-2004) periods. Fig. 4 brings the comparison between the simulated and observed values of the daily streamflows, considering the calibration and validation periods.
Tab. 2 - Values of the parameters used in the SWAT model calibration with the respective lower and upper limits, and the calibrated value. (*): Mean value, as the CN2 values vary depending of the soil type and land use; (1): [3]; (2): Micro-watershed Project Report.
| Parameters | Limits | Initial value | Calibrated value | |
|---|---|---|---|---|
| CN2 (dimensionless) | ± 50% | 35-59 | (-18%*) | |
| CANMX (mm) (1) | Forest | 0-100 | 12 | 12 |
| Eucalyptus | 0-100 | 24 | 24 | |
| ALPHA_BF (days) | 0-1 | 0.048 | 0.67 | |
| GWQMN (mm) | 0-5.000 | 500 | 357.81 | |
| GW_DELAY (days) (2) | 0-500 | 31 | 15 | |
| GW_REVAP (dimensionless) | 0.02-0.2 | 0.05 | 0.12 | |
| REVAPMN (mm) | 0-5000 | 1000 | 2923.44 | |
| RCHRG_DP (fraction) | 0-1 | 0.05 | 0.95 | |
| SOL_AWC (mm H2O mm soil-1) | ± 50% | 0.05-0.14 | (+17.34%) | |
| SOL_K (mm h-1) | ± 50% | 0.01-40 | (-19.53%) | |
| ESCO (dimensionless) | 0.01-1 | 0.7 | 0.82 | |
| SURLAG (dimensionless) | 1-24 | 4 | 15.87 | |
| CNCOEF (dimensionless) | 0.5-2 | 0.5 | 0.85 | |
| FFCB (fraction) | 0-1 | 0.8 | 0.21 | |
| EPCO (dimensionless) | 0.01-1 | 1 | 0.28 | |
| CH_N2 (dimensionless) | 0.025-0.15 | 0.014 | 0.087 | |
| CH_K2 (mm h-1) | 0-130 | 0 | 11.25 | |
Tab. 3 - Statistical indices of calibration (before and after) and validation phases of the SWAT to AESC.
| Statistical index | Before calibration |
After calibration |
Validation |
|---|---|---|---|
| Nash-Sutcliffe efficiency (NS) | -3.68 | 0.39 | 0.74 |
| Percent Bias (PBIAS, ×100) | -2.51 | -0.18 | -0.14 |
| Ratio of the mean squared error to the standard deviation of the measured data (RSR) |
6.74 | 2.44 | 0.51 |
Fig. 3 - Hydrographs of the daily streamflow observed and simulated by SWAT for AESC. (a) Calibration period (example of year 1999); (b) validation period (example of year 2001).
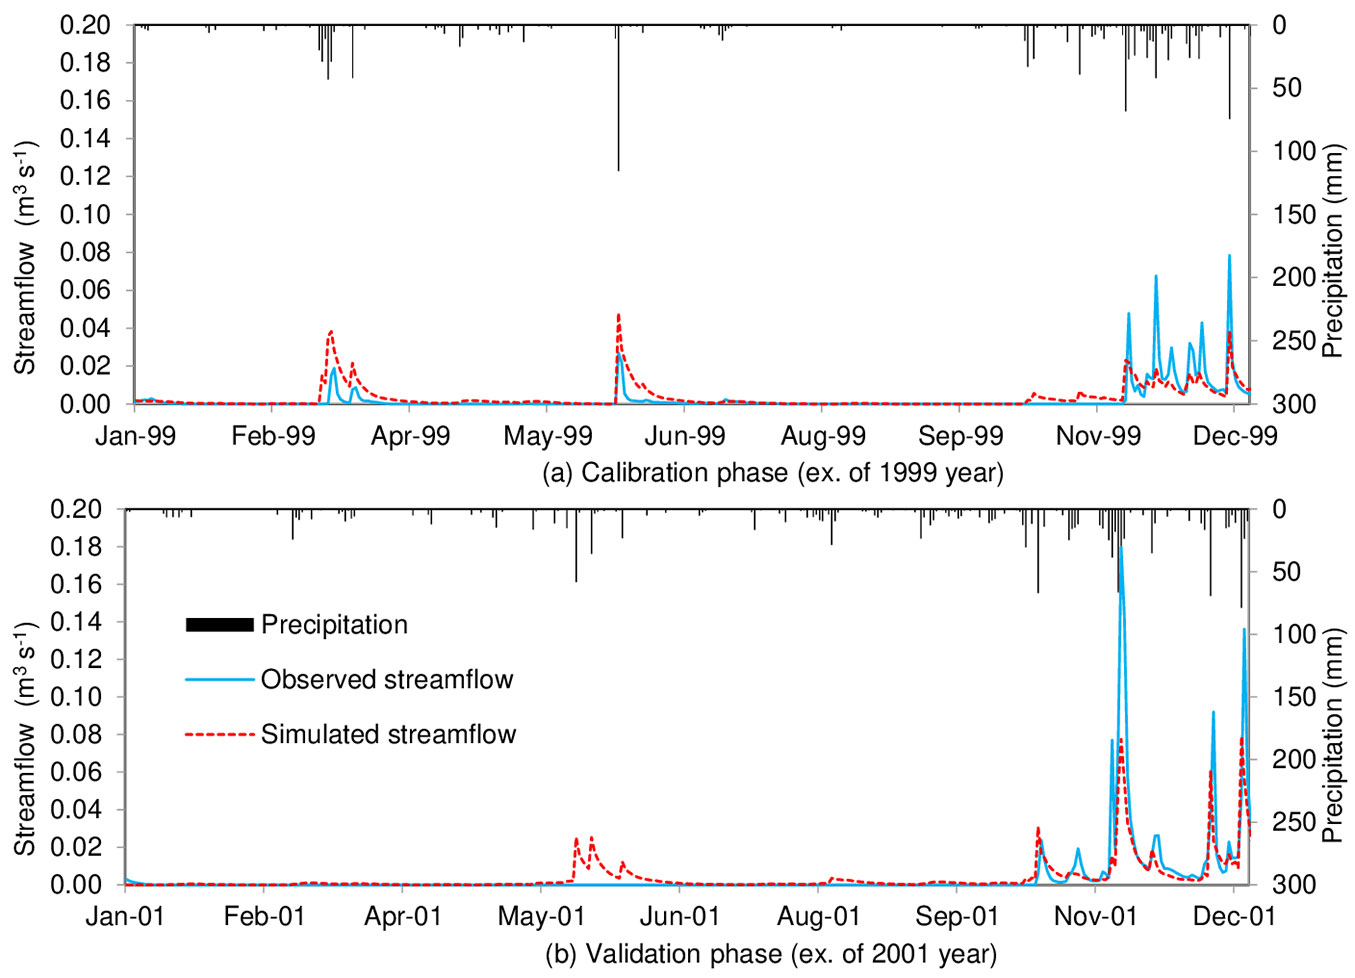
Fig. 4 - Relationship between the daily streamflow observed and simulated by SWAT for AESC for the calibration (a) and validation (b) periods.
Effects of land use and forest management on streamflow
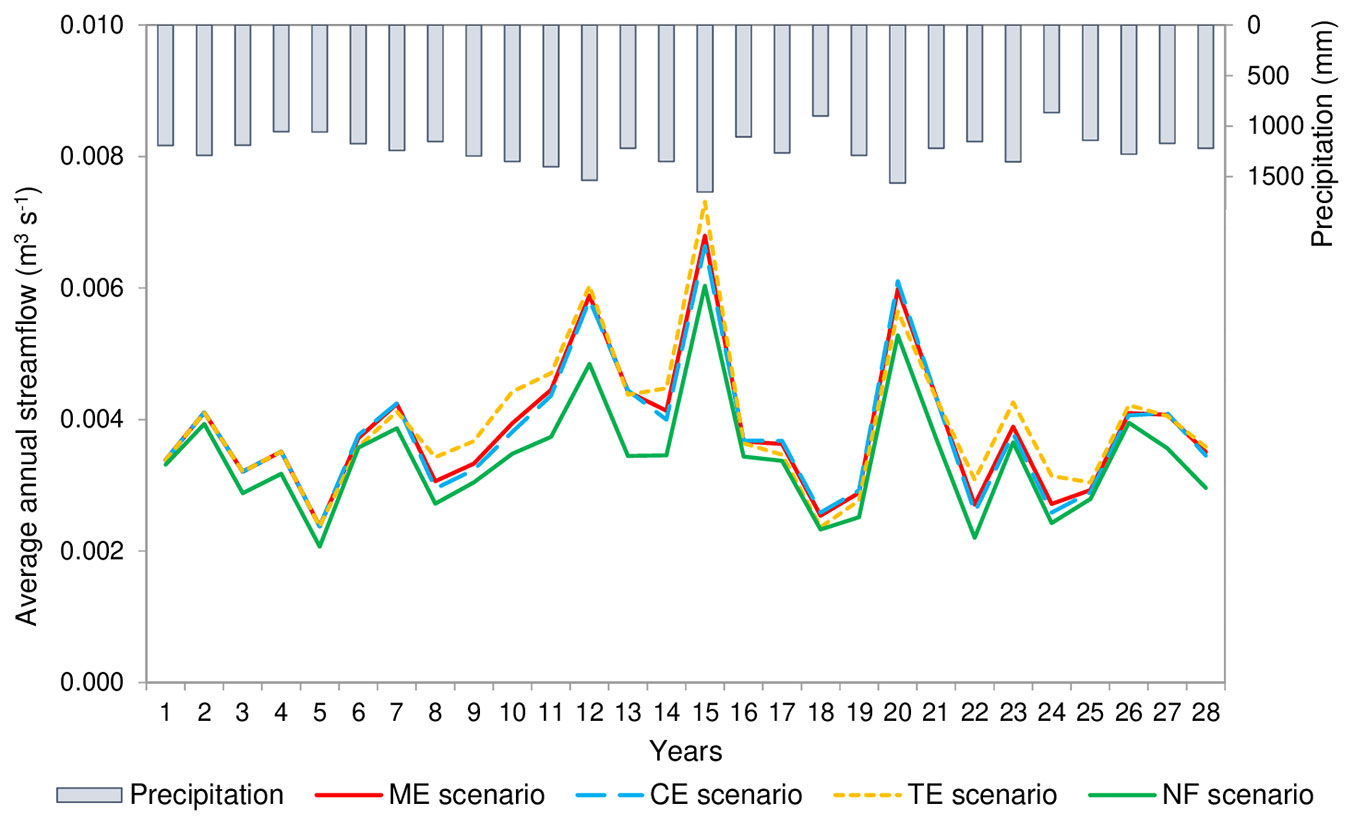
The scenarios were elaborated to estimate the changes in streamflows due to land use and forest management modifications for 28 years, considering the calibrated parameters of the model, since the calibration and validation results were satisfactory. The hydrographs in Fig. 5 show the simulated average annual streamflows series. For each scenario, the mean, maximum, and minimum streamflows were calculated and presented in Tab. 4.
Fig. 5 - Hydrographs of average annual streamflow simulated for the scenarios of land use and forest management: mixed eucalyptus (ME), cellulose (CE), timber (TE) e native forest (NF).
Tab. 4 - Reference streamflows simulated by the SWAT model at each land use and forest management scenario at AESC. Means followed by the same letter do not differ (p ≥ 0.05) from each other after Tukey test. (Qmean): long-term average streamflow; (Q90): minimum streamflow that is exceeded 90% of the time; (Qmax): maximum streamflow with a return period of 10 years.
| Simulated scenario | Qmean (m3 s-1) |
Q90 (m3 s-1) |
Qmax (m3 s-1) |
|---|---|---|---|
| Mixed eucalyptus (ME) | 0.0038 a | 0.0007 | 0.102 |
| Cellulose eucalyptus (CE) | 0.0037 a | 0.0007 | 0.106 |
| Timber eucalyptus (TE) | 0.0039 a | 0.0008 | 0.096 |
| Native forest (NF) | 0.0034 a | 0.0005 | 0.085 |
Discussion
Calibration and validation of the SWAT model
The CN2 parameter was calibrated to each soil type, and land use was reduced by about 18% (Tab. 2). This reduction occurred due to the physical properties of the soil and soil management that are not reflected by the SWAT standard CN2 values ([17]). Similar reductions of CN2 from 9 to 50% were also observed in other Brazilian catchments ([5], [9], [33], [17], [26], [12]).
The CANMX parameter, which controls the removal of water from the system by interception, was increased and, consequently, the evapotranspiration also increased. The calibrated value for the CANMX contributed to the increase in the initial abstractions and reduced the surface runoff and the peak streamflow. These values were close to those reported by other modeling studies using SWAT ([11], [12]).
The ESCO and SOL_K parameters, related to the groundwater dynamics, were also modified. The value of SOL_K was decreased by 19.53%, aiming to reduce the water streamflow for lower layers of the soil profile, reducing percolation and baseflow. With a lower amount of water in the deeper layers of the soil, the value of the ESCO parameter (soil evaporation compensation factor) was increased to 0.82, close to values presented in other modeling efforts of Brazilian basins ([9], [33], [12]).
The available water capacity in the soil (SOL_AWC) was increased by 17.34%, as similarly observed to Brazilian catchments ([28]). This augmentation leads the soil profile to increase its ability to store water, reducing runoff and baseflow ([9]). The variation of the calibrated values can be considered small, taking into account the results found in other modeling studies carried out in Brazilian basins, varying from 40 to 90% ([5], [17], [26], [12]).
Other calibrated parameters were: GWQMN, the water depth limit between the shallow aquifer and the surface; ALPHA_BF, recession constant of the base streamflow; and RCHRG-DP, the fraction of percolated water; all related to groundwater. All these parameters were increased, being the GWQMN modified to adjust the shallow aquifer limit depth, in which the water found below this limit starts to contribute to the base streamflow, and the ALPHA_BF increased to allow a faster recession, with values close to those found in other works in Brazilian watersheds ([9], [33]). The parameter RCHRG-DP was increased so that more water of the base streamflow would be available for the aquifer recharge.
In addition, the GW_REVAP and REVAPMN parameters, related to the shallow aquifer, were also increased. The value adopted for GW_REVAP, equal to 0.12, was close to those found in other studies in Brazil ([17], [12]), representing a more substantial fraction of water from the shallow aquifer to the root zone, which may reflect on increased soil evaporation and transpiration of plants. Because of these increases, more water was available in the soil, which contributed to the increase in lateral subsurface streamflow, which is the major contributor to the final streamflow of the watercourses. The only parameter related to groundwater that had its value reduced was GW_DELAY (groundwater delay time), altered to the value of 15 days ([2], [31]) in order to represent a faster response of groundwater to river discharge.
SWAT calibration and validation performance
The magnitude of the statistic shown in Tab. 3 indicates that SWAT changed from a non-recommended model (NS < 0) to a model with satisfactory performance due to the calibration and validation of statistical indexes.
The simulation of the monthly streamflow series can be judged as satisfactory if NS > 0.50 and RSR ≤ 0.70, and if PBIAS < ±25% ([27]). However, modeling efforts with the SWAT shows that the worst results occurred for daily prediction ([18]). Some of the factors that could affect the SWAT performance of the model can be attributed to the fact that the calibration for small catchments does not allow the compensation of errors due to its rapid response to rainfall events. Therefore, when the hydrological models are evaluated on a daily scale, such as in the present paper, the limits of the statistical indexes can be less rigorous. In this context, SWAT considers that daily simulation can be taken as acceptable if NS > 0.33 for small catchments ([19]), as occurred in the present study.
The negative value of the PBIAS (Tab. 3) shows that the model overestimated the simulated streamflow during the calibration and validation periods, as shown in Fig. 3 and Fig. 4. The RSR value was larger than recommended after calibration; however, its value is acceptable for the validation phase. Thereby, with a lower RSR value, lower will be the standard error, and better will be the simulation, as evidenced by the hydrographs (Fig. 3).
The validation phase indexes were better than those obtained in the calibration phase, as also observed in other modeling studies ([35]). During the validation period (Fig. 3), it can be observed a large number of days without streamflow. This amount of days with very low or null surface runoff can increase the efficiency of the model since the errors associated with low values of streamflow tend to be lower than those related to high streamflow ([22]). Andrade et al. ([5]) also observed that differences in the precipitations between the validation and calibration period of the SWAT model affect the NS statistical result. In the present study, the rainy period of the validation did not present the same rainfall concentration recorded during the calibration period ([23]).
SWAT model tended to overestimate the minimum streamflow in the dry seasons and underestimate the larger streamflows observed in the rainy seasons. Other modeling efforts ([17]) also showed that the SWAT model has difficulties in reconciling dry and rainy season simulations.
Effects of land use and forest management on streamflow
We observed that the variation in the simulated streamflow strictly reflect the characteristics of the land use and forest management, which are input variables and composed the model databases. The results presented here should be seen as an initial assessment of the potential impact of land use and forest management on the streamflow of small catchments. As shown in Tab. 4, the simulations carried out with the four different scenarios did not show statistically significant changes in the Qmean, as also observed in other Atlantic Forest watersheds ([25]). The difference of Qmean among the scenarios (NF compared to eucalyptus scenarios) was not superior to 15%. Other studies ([4]) reported a decrease by about 2 to 8% in Qmean due to the conversion of native to planted forests. The impact of forest cover variation on Qmean is almost null when native forest suppression occurs over less than 50% of the basin ([12]). In the present study, due to the presence of APP in all the scenarios, native forest suppression (comparing NF to the other scenarios) affected about 66% of the catchment, justifying the small change in Qmean. It also corroborates the evidence that forest management in catchments containing APP close to the stream might have little impact on streamflows ([31]).
It also can be seen that Q90 (minimum streamflow of reference) reached very low values for all the scenarios (Tab. 4). The eucalyptus scenarios presented higher Q90 (40 to 60%) than the native forest scenario (NF). The Brazilian public policies have consolidated the idea that forests always increase the minimum streamflow due to the recovery of the hydrological functions of the soils under forests. However, many experimental data demonstrated the reduction of minimum streamflow when basins are forested with eucalyptus ([7]) or native forests ([34]).
Only little differences in Qmax were observed among the results of the different simulated scenarios. The NF scenario showed the lowest Qmax (Tab. 4), due to the higher rainfall interception provided by the Atlantic Rainforest ([34], [7]) and the periods with less protection of the soil, right after the cutting and planting operations ([21]). Contrastingly, Eucalyptus scenarios presented Qmax from 13 to 25% higher than NF. According to some researches ([21], [8]), Qmax can be increased from 32% to 100% due to harvesting of planted forests, depending on topographic, geological and rainfall characteristics. Among the eucalyptus scenarios, TE provided the lower Qmax. Higher maximum streamflow occurs in the eucalyptus managed for cellulose (CE), due to the shorter production cycle time and the longer exposure of the soil compared to ME and TE scenarios.
A lower average annual streamflows for the NF scenario is noticeable from Fig. 5. The native forest area improves the physical conditions of the soil and promotes the infiltration of water in the soil, thus favoring the recharge of groundwater and the reduction of the surface runoff. However, the native vegetation has a higher leaf area index and rainfall interception than eucalyptus plantations ([2]), thus increasing the evapotranspiration in the areas under the native forest ([30]).
The hydrographs of the eucalyptus scenarios (ME, CE, and TE - Fig. 5) show an increase of the average streamflows in the years of harvest and in the subsequent year (7/8, 14/15, 21/22, and 27/28). The increase of discharges for 1-2 years after the eucalyptus harvest was also observed in other studies in Brazil ([1]). Moreover, the rise of average annual streamflow due to harvesting of planted forests can reach 110% of the Qmean ([21], [1]). Forest harvesting decreases soil infiltration, leading to increased runoff (consequently increasing Qmax) and sediment to streams ([29]). In addition, harvesting also reduces the evapotranspiration and, consequently, promotes the increase in the streamflows ([1]). Meanwhile, during the years of eucalyptus growth, the annual average streamflow decreases.
Finally, these results should be carefully applied to other watersheds because they depend on local soil, landscape, and climate characteristics, as well as on the geographic location, size, and use of water of the plantings and other vegetation.
Conclusions
SWAT showed a satisfactory simulation of the streamflows of Aracruz small catchment, presenting the following statistical indexes associated with the validation of the model: NS = 0.74; PBIAS = -14%; and RSR = 0.51. The lowest streamflows were better simulated than the peak flows. Therefore, the SWAT model can be a useful tool also in modeling the streamflow of small forested catchments.
About the forest management scenarios simulated, differences in the long-term average streamflow due to changes in the land use and forest management were not statistically significant. Minimum streamflow (Q90) and maximum streamflow (Qmax) were higher for the eucalyptus management scenarios compared with the native forest scenario. Native forest scenario presented lower annual streamflow than all the eucalyptus forest scenarios.
Acknowledgements
This study was financed in part by the Coordenação de Aperfeiçoamento de Pessoal de Nível Superior - Brasil (CAPES) - Finance Code 001; and Conselho Nacional de Desenvolvimento Científico e Tecnológico - Brasil (CNPq) - Finance Code 304916/2017-0.
References
CrossRef | Gscholar
CrossRef | Gscholar
Gscholar
Gscholar
Gscholar
Gscholar
Authors’ Info
Authors’ Affiliation
Postgraduate Program in Forestry Sciences, UFES - Federal University of Espirito Santo, Vitória, ES (Brazil)
Sidney Sára Zanetti
Department of Forestry and Wood Sciences, UFES - Federal University of Espirito Santo, Vitória, ES (Brazil)
Department of Hydraulic and Sanitation, EESC-USP - School of Engineering of São Carlos, University of São Paulo, SP (Brazil)
Departments of Ecosystem Sciences and Management and Biological and Agricultural Engineering, Texas A&M University, College Station, Texas (USA)
Corresponding author
Paper Info
Citation
Oliveira LT, Cecílio RA, Zanetti SS, Loos RA, Bressiani DA, Srinivasan R (2020). Hydrological simulation of a small forested catchment under different land use and forest management. iForest 13: 301-308. - doi: 10.3832/ifor3221-013
Academic Editor
Agostino Ferrara
Paper history
Received: Aug 27, 2019
Accepted: May 23, 2020
First online: Jul 10, 2020
Publication Date: Aug 31, 2020
Publication Time: 1.60 months
Copyright Information
© SISEF - The Italian Society of Silviculture and Forest Ecology 2020
Open Access
This article is distributed under the terms of the Creative Commons Attribution-Non Commercial 4.0 International (https://creativecommons.org/licenses/by-nc/4.0/), which permits unrestricted use, distribution, and reproduction in any medium, provided you give appropriate credit to the original author(s) and the source, provide a link to the Creative Commons license, and indicate if changes were made.

Web Metrics
Breakdown by View Type
Article Usage
Total Article Views: 41896
(from publication date up to now)
Breakdown by View Type
HTML Page Views: 35102
Abstract Page Views: 3512
PDF Downloads: 2546
Citation/Reference Downloads: 4
XML Downloads: 732
Web Metrics
Days since publication: 2185
Overall contacts: 41896
Avg. contacts per week: 134.22
Article Citations
Article citations are based on data periodically collected from the Clarivate Web of Science web site
(last update: Mar 2025)
Total number of cites (since 2020): 3
Average cites per year: 0.50
Publication Metrics
by Dimensions ©
Articles citing this article
List of the papers citing this article based on CrossRef Cited-by.
Related Contents
iForest Similar Articles
Research Articles
Quantitative assessment of past and future tropical forest transition and its dynamic to streamflow of the catchment, Malaysia
vol. 17, pp. 181-191 (online: 30 June 2024)
Research Articles
Method for classifying sites to Atlantic Rainforest restoration aiming to increase basin’s streamflows
vol. 14, pp. 86-94 (online: 19 February 2021)
Research Articles
Strong relationships between soil and vegetation in reference ecosystems of a riparian Atlantic rainforest in the upper Doce River watershed, southeastern Brazil
vol. 16, pp. 226-233 (online: 17 August 2023)
Research Articles
Hydrological properties of litter layers in mixed forests in Mt. Qinling, China
vol. 11, pp. 243-250 (online: 12 March 2018)
Research Articles
Soil chemical and physical status in semideciduous Atlantic Forest fragments affected by atmospheric deposition in central-eastern São Paulo State, Brazil
vol. 8, pp. 798-808 (online: 22 April 2015)
Research Articles
Spatial heterogeneity of soil respiration in a seasonal rainforest with complex terrain
vol. 6, pp. 65-72 (online: 07 February 2013)
Research Articles
Soil water deficit as a tool to measure water stress and inform silvicultural management in the Cape Forest Regions, South Africa
vol. 13, pp. 473-481 (online: 01 November 2020)
Research Articles
Is cork oak (Quercus suber L.) woodland loss driven by eucalyptus plantation? A case-study in southwestern Portugal
vol. 7, pp. 193-203 (online: 17 February 2014)
Research Articles
Evaluation of hydrological and erosive effects at the basin scale in relation to the severity of forest fires
vol. 12, pp. 427-434 (online: 01 September 2019)
Review Papers
Recent insights in soil nutrient cycling: perspectives from Pinus and Eucalyptus forest studies around the world
vol. 17, pp. 394-404 (online: 20 December 2024)
iForest Database Search
Search By Author
Search By Keyword
Google Scholar Search
Citing Articles
Search By Author
Search By Keywords
PubMed Search
Search By Author
Search By Keyword


