Quantitative assessment of past and future tropical forest transition and its dynamic to streamflow of the catchment, Malaysia
iForest - Biogeosciences and Forestry, Volume 17, Issue 3, Pages 181-191 (2024)
doi: https://doi.org/10.3832/ifor4339-017
Published: Jun 30, 2024 - Copyright © 2024 SISEF
Research Articles
Abstract
The consequences of human interventions on land use have been empirically demonstrated to affect substantially hydrological processes and ecosystem services within watershed environments. Since 1970, Malaysia has faced deforestation, driven mainly by logging and agricultural expansion, aligning with its developmental goals by 2020. From 1970 to 2000, deforestation led to a 25.5% decline in forested land, causing a significant 10.2% rise in excess runoff. Moreover from 2001 to 2021, the nation lost 17% of its total land to deforestation. These trends emphasize the need for a thorough investigation of sustainable conservation efforts in Malaysia. This study focuses on the Langat basin in Malaysia, evaluating past and future land use changes and their effects on the basin’s hydrological response. The study employed key informant reports, population growth data, observed land use change, field survey and agricultural land availability considered for developing change scenarios. We emphasized the significance of integrating diverse modeling methods to analyze LULC changes effectively. The use of a semi-distributed hydrological model, SWAT, in combination with Markov chain and Multi-Layer Perceptron (MLP) model and Geographic Information Systems (GIS) techniques proved to be an integrated and suitable tool for comprehensive change analysis and modeling of land use. Markov chain modeling is valuable for predicting land use changes over time, providing input scenarios for SWAT simulations. MLP is a powerful algorithm to capture non-linear relationships and complex patterns in the data, enhancing the modeling accuracy. The simulation results, based on historic land use data (1984-2006-2010) and projected future land use maps (2030-2050-2080), revealed a consistent pattern of urban expansion and deforestation leading to increased streamflow. Projections indicated a substantial rise in streamflow by 20%, 61%, and 71% for the 2030s, 2050s, and 2080s, respectively. To mitigate potential flood and sediment loss, it is crucial to involve local stakeholders such as local communities, government bodies, environmental organizations, and businesses. Such analysis facilitates understanding their perspectives and concerns regarding afforestation and urban expansion control, informing future development programs and land use planning effectively.
Keywords
Land Use Conversion, Hydrological Processes, Land Use Scenarios, Markov Chain, SWAT
Introduction
Understanding the intricate relationship between forests, land use/land cover (LULC) changes, and their impact on carbon storage capacity (CS) in forest ecosystems is crucial in the context of tropical watersheds. Forests play a vital role in combating climate change by storing and sequestering CO2 from the atmosphere ([22]). However, human activities such as urbanization, deforestation, and poor agricultural practices have significantly altered natural LULC patterns worldwide. These changes have profoundly affected the hydrological regime of watersheds, particularly in tropical regions where LULC alterations significantly influence streamflow dynamics. The assessment of such alterations poses a substantial challenge but is essential for the sustainable watershed management and the mitigation of climate-related impacts on water resources, making it a matter of concern for environmental planners and water resources managers globally ([31], [7]).
Tropical rainforests are the predominant land cover in tropical regions, where the high intensity of rainfall is a crucial climatic characteristic. The conversion of tropical rainforests to agriculture or other land uses can significantly impact the water balance of watersheds. In Malaysia, the forest cover has been decreasing since 1990, with most of the primary forest being cut down for logging purposes and transformed into agricultural land such as oil palm, rubber, and rice. This trend is expected to continue towards the year 2030, which is the target for Malaysia to become a fully developed country. In 2012, the Malaysian Second National Communication ([32]) reported that the forest covered 56% of Malaysia’s total land area in 2000, but the percentage decreased to 55% in 2007, while the rate of urbanization increased from 62% in 2000 to 63% in 2005, 63.8% in 2010 and 75.1% in 2020. Rahaman et al. ([34]) analyzed land use changes between 2005 and 2020 in Penang, Malaysia, reporting a noteworthy transformation in the region. The authors found a substantial rise in built-up areas that increased by 15.56%. This expansion was concurrent with a decline in forest coverage by 5.57%, agricultural land by 8.41%, and waterbody by 1.58%. However, the hydrologic effects of land use change on water cycle are controversial among researchers. Bruijnzeel ([13]) stated that when the forest is converted to agricultural land use, land surface runoff and streamflow significantly increases. Another study conducted by Kafy et al. ([20]) analyzed land use changes from 1999 to 2019 in Rajshahi, Bangladesh. Projections for 2029 and 2039 indicated a 16% increase in urban areas, resulting in a reduction of vegetation (19%) and water bodies (4%), and leading to an average rise of land surface temperature by 9.83 °C over the last two decades. Furthermore, Kafy et al. ([21]) in a subsequent research focused on the impact of human pressures on the carbon chain and ecosystem resilience in Cumilla, Eastern India, during 1994-2019. The expansion of urban areas significantly contributes to the loss of vegetation cover, accelerating carbon emissions, increasing land surface temperature, and exacerbating global warming. These studies emphasize the critical interaction between urban expansion, land use changes, and environmental consequences, highlighting the urgent need for sustainable urban development strategies. In a related study carried out in Nigeria between 1991 and 2021, Taiwo et al. ([40]) showed an increase in built-up areas and bare land by 15% and 14%, respectively, while vegetation cover declined by 19%. Projections for 2031 anticipate an 11% reduction in vegetation and a 19% expansion in built-up areas compared to 1991, thus intensifying drought and water shortage. Abdul Kader et al. ([2]) demonstrated that the land use and cover in Malaysia have undergone significant changes due to urbanization, deforestation, and other activities that alter the physical properties of soil such as infiltration rate and moisture content. The consequent change of soil surface from porous to impervious can affect the seasonal and annual distribution of streamflow in the basins, according to Yasin et al. ([44]), Ayub et al. ([11]) and Shafie et al. ([37]).
Kleinhans & Gerold ([25]) conducted a study on the effects of deforestation on the water balance in a small tropical catchment in Central Sulawesi, Indonesia. They concluded that deforestation could lead to an increase in low water discharge and a significant increase in peak flow. They also suggested that it is important to consider both drying and wetting conditions to thoroughly analyze the impact of land use change on water resources. In that regard, Wang et al. ([41]) applied Cellular Automata-Artificial Neural Network (CA-ANN) to assess urban growth impact on Land Surface Temperature (LST) and carbon storage in Guangzhou from 1989 to 2021. Their results showed a 63% rise in urban areas, expanding high LST regions by 652 km² and reducing carbon storage over this period. According to Li et al. ([28]), converting grassland into woodland could decrease runoff, whereas converting woodland into urban land could increase runoff. Mao & Cherkauer ([30]) investigated the impacts of land use change on hydrologic responses in the Great Lakes region of the USA. Their findings showed that simulated changes in land use had spatial and seasonal variations. Conversion of deciduous forest to agricultural crop land in central areas can lead to a decrease in evapotranspiration (ET) by 5-15% and an increase in total runoff by 10-30%.
To reduce the negative environmental impact caused by changes in land use, it is important to develop reliable models that integrate hydrological and land use data with GIS and remote sensing techniques ([23]). This is essential to accurately quantify the impact of such changes on hydrological variables and their frequency and magnitude ([6], [46], [39]). The selection of the appropriate LULC model is crucial, as it can have a significant impact on modeling outcomes, especially in situations where land use conversions play a significant role ([14]). In this study, we analyzed land use changes over time and designed various future land use scenarios using Land Change Modeler (LCM) and Markov Chain. Then the semi-distributed hydrological model SWAT was used to simulate the basin’s hydrology based on historical land use data from 1984-2006-2010 and future land use maps for 2030-2050-2080. This research suggested a significant connection between land use/land cover change and streamflow of the catchment. The study uniquely mapped spatiotemporal changes in land use and their effects on hydrology of watershed. The use of innovative techniques and approaches offer valuable tools applicable to watershed of various sizes, enabling precise estimation and projection of streamflow in specific land use.
Materials and methods
Study area
The Langat River basin is located in the western part of Peninsular Malaysia, between 02° 40′ 152″ to 03° 16′ 15″ N and 101° 19′ 20″ to 102° 01′ 10″ E, covering an area of 1319 km2 and with a main river course length of around 141 km. The basin is divided into four sub-basins based on the availability of hydrometric stations (Fig. 1). The climate of the study area is classified as hot and humid tropical rainforest, influenced by two monsoons: North-East (NE) monsoon from December to February and South-West (SW) monsoon from May to September. The Langat River basin has nine major land uses according to the land use map of 2010, with permanent crops and forests being the dominant types, comprising approximately 70% of the entire basin ([19], [18]).
Fig. 1 - Location of the Langat Basin and hydrometeorological stations used in this study.
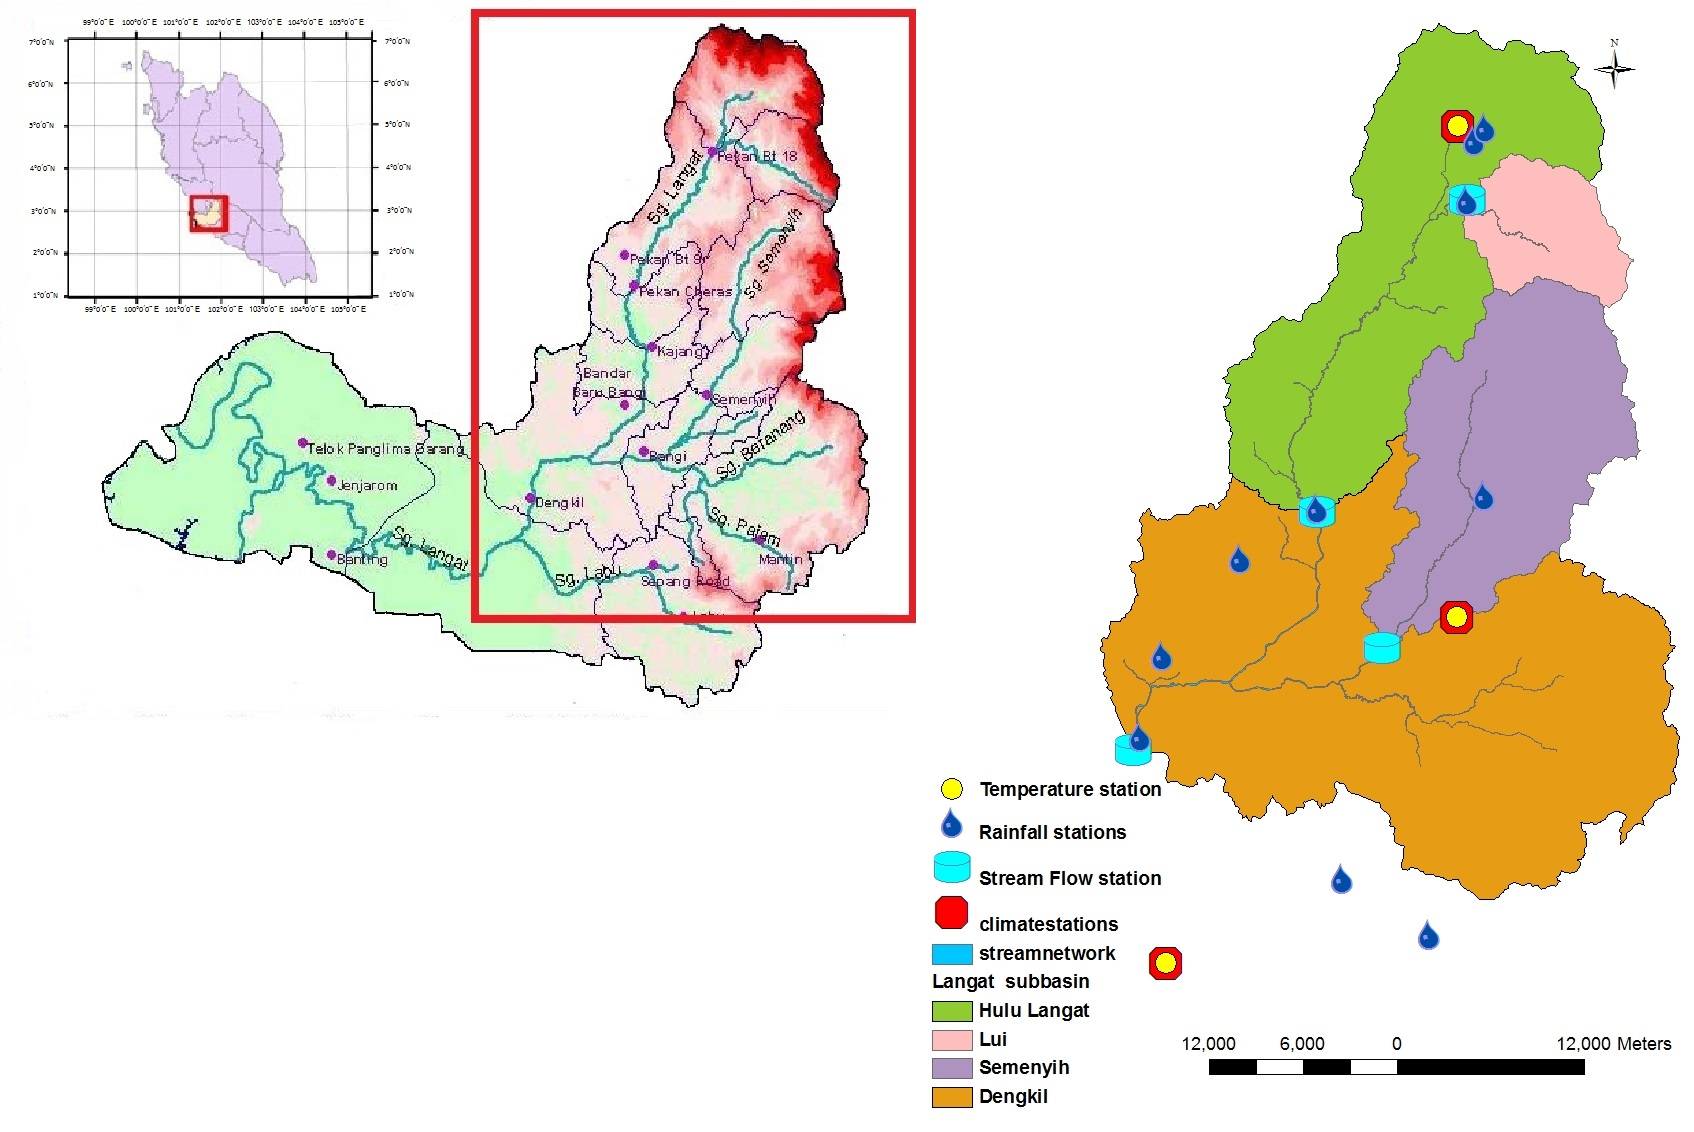
The area under consideration includes forested land with primary and secondary rainforest, as well as national parks and wildlife reserves that receive high rainfall. These are followed by agricultural lands, which are further divided into two categories: permanent and short-term crops. Permanent crops are made up of orchards and plantations such as oil palm, rubber, coconut, and cocoa, while short-term crops include general crops such as sweet potato, watermelon, sweet corn, and paddy fields of varying sizes. The difference between the two above categories is based on the fact that annual crops undergo a yearly cycle, leaving the land barren for part of the year. About 25% of the basin is occupied by urban land, which encompasses residential, transportation, settlement, and industrial areas, as well as horticultural areas cultivated for fruits and vegetables, and small villages. Idle grasslands are natural grasslands with low productivity and poor forage quality that are used for communal livestock grazing by smallholders. Improved permanent pastures, on the other hand, are exploited for commercial livestock ranching by governmental and private sectors. Finally, the swamp area consists of mangroves, while the water body includes rivers, lakes, and marshlands.
The Department of Irrigation and Drainage (DID) of Malaysia provided daily streamflow data from four hydrometric stations situated in the Dengkil, Kajang, Semenyih, and Lui sub-basins for a period of 26 years from 1980 to 2011. Moreover, the Malaysian Meteorological Department (MMD) provided daily rainfall data from 10 gauging stations and daily air temperature data from 3 gauging stations for the period between 1984 to 2010. The data was aggregated to derive the mean monthly, quarterly, and annual (mean, maximum, and minimum) time series.
Data sources and pre-processing
The Department of Agriculture, Malaysia provided three shape file maps of Langat River basin for the years 1984, 2006, and 2010, with a scale of 1:50.000. The choice of the maps was driven by the need to establish a historical trend in land use changes from 1984 onwards and detected significant changes between 2000 and 2012. Notably, during this period, Malaysia experienced the highest deforestation rate globally, as reported in a global forest map developed in collaboration with Google Maps®. The availability of these maps allows for a comprehensive analysis of land use changes. In addition, considering projection of different scenarios for land use changes, this specific timeframe division was more appropriate based on our objectives.
To simplify the analysis in LCM, which cannot handle maps with more than 15 categories, the land use subcategories were combined into nine general categories: Forest, Horticultural, Idle Grassland, Short-term crops, Swamp, Permanent crops, Animal husbandry, Urban (built-up) areas, and Water bodies. The shape files were converted into rasters with a 30 m cell resolution using ArcGIS®, and then imported into IDRISI for further analysis. The land use change in the study area was projected and simulated using the 2010 land use map as the base map.
Land use change analysis and transition potentials
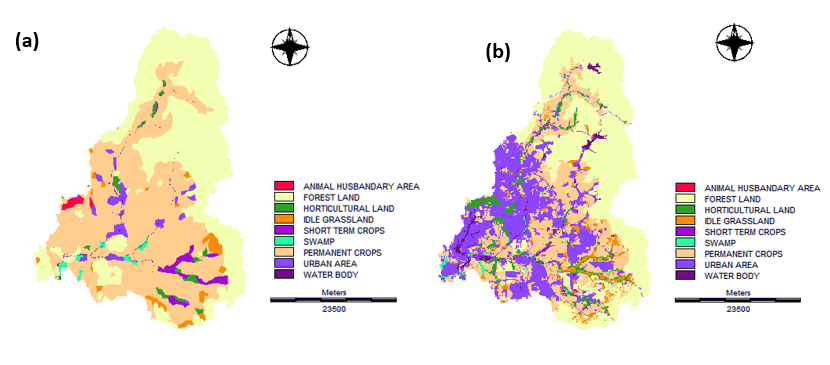
The LCM model was used to compare the land use maps of 1984 and 2006, as shown in Fig. 2a and Fig. 2b, in order to generate the transition probability matrix and transition areas matrix using the Markov Chain module. The LCM model also includes the transition potential tab which produces transition potential maps with acceptable accuracy range to perform the actual modeling. The model classifies transitions into sub-models and examines the potential explanatory variables. These variables can be either static or dynamic, and constraints may also be applied to limit the expansion of specific land uses. Physical constraints include water bodies, built-up areas, and road networks, while factors are more flexible and allow to determine the degree of suitability from low to high. We developed constraints and factor maps based on the DEM, aspect, slope, and distance from major roads network.
Fig. 2 - Land use map of 2006 (a) and 2010 (b) for the Langat River basin.
The LCM model uses three algorithms to model selected transition variables, namely Multi-Layer Perceptron (MLP) neural network, SimWeight, and logistic regression. Among these, MLP neural network is capable of modeling complex, non-linear relationships between input variables, making them well-suited for capturing complex patterns. Given the intricate nature of land use changes and their impact on streamflow, MLP networks are suited for handling such complexities ([45]). MLP networks are also versatile and can handle various types of data, including both quantitative and categorical variables. When the dataset includes diverse types of land use data, MLP can effectively integrate and process this information ([27]). MLP also outperforms in pattern recognition and identification of trends and correlations within data. This is particularly crucial when studying the dynamic relationships between tropical forest transitions and streamflow in a catchment area ([16]). Additionally, MLP is endowed with an automatic mode that does not need user intervention. These characteristics of MLP neural networks make them particularly suited for comprehensive analyses in the context of land cover modeling.
Using the transition probability matrix, the probability of changes in land use classes into other categories were determined, while the transition areas matrix reflected the extent of land use change in simulated scenarios. Transitions and exchanges of land use that had occurred between different categories during the years were obtained. The Markov Chain module was used to simulate the land use map of 2010 based on the produced land use map, and this map was used to evaluate the accuracy of LCM model in predicting land use changes. Finally, the simulated land use map of 2010 was compared with the observed land use map of 2010 to validate the LCM model.
Validation
To evaluate the accuracy and quality of the LCM model output, the Kappa statistic was used to measure the agreement between the predicted and observed land use maps of 2010. Additionally, a cross classification was performed to compare two qualitative maps of different dates and understand whether the classification assigns the same value to each class on both maps or if there has been a change to a new class. The output is a new map based on all the unique combinations of values from the two maps, and a cross tabulation table is generated to analyze the results. This method was used to validate the LCM model in this study ([17]).
Land use change scenario development
To study the impact of land use and land cover (LULC) changes on streamflow in Langat River, a land use scenario was developed. The process of developing the scenario was influenced by several factors, such as the research objectives, model used, spatial scale, natural and socio-economic characteristics, observed land use change, availability of appropriate land for agriculture and constraints of the study area. To ensure that the scenarios were realistic and aligned with the current trends of LULC changes in Langat River, we referred to several previous studies ([15], [29], [43]).
Two hypothetical scenarios for land use change (i.e., land use projection scenarios and land use sensitivity scenario) were developed in this study. Land use projection scenarios are defined to provide probable future changes to land use and land use sensitivity scenarios (“what-if”), and were developed to quantify the effects of each land use type on hydrological response. The key factor in development of likely future projection of land use is the probable changes that may occur in the future according to the observed changes in the past. Based on the rational assumptions and information obtained from past and current observed changes in land use, the likely future projection of land use types was developed for 2020, 2050, and 2080.
To develop the land use change sensitivity scenario, those land use types that experienced an increase or decrease in their total area during the past decades (e.g., forestlands, agricultural lands and built-up/urban area) were taken into account. Local observed trend of urban area development, agricultural land (mostly permanent crops) and forestland conversion were considered the key drivers in the development of land use sensitivity scenarios in this study. This included an analysis of literature on agriculture and forest change and a comparison of land use between 1984, 2006, and 2010 land use maps ([3], [4]). The first scenario assumed that observed trends in the basin would continue, while the second scenario simulated the possible magnitudes of the effect of LULC changes on the hydrological response in the Langat River basin.
The sensitivity scenarios development for land use involved three land use classes: forest, urban, and agricultural land, while keeping the other categories constant. Six land use change scenarios were created based on the percentage of forest land conversion into agricultural and residential areas: (i) scenario “L” (Low) - 20% forest land converted to agricultural land; (ii) scenario “M” (Medium) - 40% forest land converted to agricultural land and 30% build-up area, and 10% residential area; (iii) scenario “H” (High) - 40% of degraded forest land allocated to agricultural land and 20% to residential area). Additionally, three extreme scenarios were defined for land use sensitivity: (iv) scenario “E1” (Extreme-1) - 50% of forest land converted equally to agricultural and residential areas); (v) scenario “E2” (Extreme-2) - 100% of forest land converted to agricultural land); and (vi) scenario “E3” (Extreme-3) - 100% deforestation and conversion into residential area). The latter scenarios were based either on complete deforestation of the basin or the replacement of all forest cover with agricultural land, including permanent and short-term crops, and urban area (Tab. S1 in Supplementary material).
Analysing the impact of land use change on streamflow
To assess the impact of land use change on hydrological processes, SWAT model was used to simulate alternative land use distributions, which in turn affected all the other processes of the watershed. The impact of these simulations under different scenarios on streamflow of the catchment was then analyzed.
SWAT Model
The SWAT hydrological model operates on daily time intervals and employs a spatially and semi-distributed approach, allowing for continuous simulation based on various management scenarios ([8], [10], [1]). It can be applied in diverse conditions across extensive periods within watersheds of varying complexity, segmented into hydrological response units (HRUs) determined by factors like elevation, soil composition, and land use. Various data and maps including DEM, soil map, land use maps, climatic (rainfall and temperature) and hydrologic (streamflow) data are needed to set up the SWAT model parameters. Those data were used as input for model’s simulation, calibration and validation.
Model calibration and validation
SWAT model involves a large number of parameters, and the identification of its sensitive parameters is necessary to improve the calibration efficiency ([1]). To this end, sensitivity analysis was carried out prior to the model calibration to determine which parameters mainly affect streamflow ([5]). Twenty-two parameters were identified as major drivers of streamflow in the watershed ([9]). Afterwards, calibration was carried out using monthly observed streamflow data. The SWAT-CUP software (available at ⇒ https://www.2w2e.com/home/SwatCup) was used by applying the Sequential Uncertainty Fitting (SUFI-2) algorithm ([1]) integrated in the SWAT-Calibration Uncertainty Program (CUP). This program makes faster the time-consuming calibration using standardized calibration operations ([1]), linking GLUE, Parasol, SUFI-2 and MCMC procedures to SWAT. Among those methods, the Sequential Uncertainty Fitting (SUFI-2) program is frequently utilized for calibration and uncertainty analysis ([1], [29], [33]).
The optimization process employed the Nash-Sutcliffe coefficient of efficiency (NS) as the objective function. The SUFI-2 model was run for the 1985-2002 monthly streamflow data in combination with land use map of 2002 for model calibration, with the first two years (1985-1987) as a warm-up period. In addition, monthly observed streamflow data of 2003-2011 along with land use map of 2010 were utilized for model validation. After calibrating and validating SWAT, simulations for alternative land use distribution scenarios were conducted. The baseline model was the simulated streamflow for the 2000-2009 decade with the land use map of 2010. The impact of these simulations under different scenarios on streamflow were assessed by simulating different projection scenarios for the years 2010, 2030, 2050, and 2080, while keeping the climate variables constant for the period of 2000-2009. These scenarios included L (Low), M (Medium), H (High), E1 (Extreme-1), E2 (Extreme-2), and E3 (Extreme-3).
Results
Land use change analysis
Tab. 1 shows the changes in land use types between 1984 and 2006, including the area and percentage change. The Langat basin was dominated by permanent crop and forest, which made up about 78% of the entire basin (90.7% and 65.2% in 1984 and 2006, respectively). The results indicate significant changes in land use types in the basin over 22 years. In 2006, the area of dominant land use types was 28% lower than in 1984, while the total area of urban and residential areas increased by 880%. The areas of animal husbandry, forest, short-term and permanent crops decreased notably between 1984 and 2006, with the area of permanent crop being 48.5% lower in 2006 than in 1984 (Tab. 1). Overall, increasing and decreasing trend in land use types in the Langat Basin during the study period showed a significant increase of the urban area, while a decreasing trends was detected in the area of forest land, permanent and short-term crops, and animal husbandry (Fig. S1 in Supplementary material).
Tab. 1 - Summary statistic of land use change between 1984 and 2006 in the Langat basin.
| Land Use Class | Year 1984 | Year 2006 | Changes 1984-2006 | |||
|---|---|---|---|---|---|---|
| area (ha) | % of watershed | area (ha) | % of watershed | area (ha) | % | |
| Animal Husbandry | 658.65 | 0.53 | 249.49 | 0.20 | -409.16 | -62.12 |
| Forest land | 51587.31 | 40.80 | 49281.52 | 39.53 | -1586.75 | -3.12 |
| Horticulture Land | 1738.94 | 1.39 | 5032.19 | 4.04 | 3293.25 | 189.38 |
| Idle Grassland | 2499.88 | 2.01 | 4041.72 | 3.24 | 1541.84 | 61.68 |
| Short-term crops | 2168.06 | 1.74 | 676.11 | 0.54 | -1491.94 | -68.81 |
| Swamp | 933.09 | 0.75 | 997.96 | 0.80 | 64.87 | 6.95 |
| Permanent crops | 62152.65 | 49.86 | 31981.97 | 25.65 | -30170.68 | -48.54 |
| Urban area | 3086.18 | 2.48 | 30247.49 | 24.27 | 27161.31 | 880.08 |
| Water bodies | 558.85 | 0.45 | 2155.58 | 1.73 | 1596.73 | 285.71 |
Land use change detection
The use of LCM has enabled the detection of changes in land use based on the gains and losses of various categories. The study found that forest land, permanent crops, short-term crops, and animal husbandry experienced losses in their respective areas between 1984 and 2006 in the Langat River basin. Conversely, other categories such as urban areas, grassland, horticultural land, and water bodies have shown an increase during the same period. Specifically, permanent crops have experienced a net loss of 40.22%, with 57.39% being lost and 17.7% being gained. Meanwhile, urban areas have undergone a net increase of 62.32%, with a loss of 30.56% and a gain of 92.92% between 1984 and 2006 (Tab. S2 in Supplementary material).
During the period of study (1984-2006), the urban area had the most significant increase in its overall area. To determine the contribution of other land use categories to this net change, the percentages of each land use class converted to urban area were calculated. Permanent crop accounted for the majority of the total increase in urban area (81.5%), which represented approximately 18.4% of the entire study area. Forest land was the second most frequently converted land use class to urban area (13%) during the same period in the Langat Basin. In addition, horticultural land (1.1%), idle grassland (1.5%), and other land use types were also partially converted to urban and residential areas. The findings also indicated that urban area predominantly emerged on permanent crop areas (81.5%), followed by forest land (13.34%). In other words, about 73.79% of the total converted permanent crop land was transformed into urban area (Tab. S3 and Fig. S2 in Supplementary material).
Land use change prediction
The state of land use in the future (time t2) can be predicted by modeling, based on the previous state of land use (time t1) using a Markov chain. The Markov chain uses a transition probabilities matrix to simulate the change from the current state to the next state. Essentially, predicting future land use is solely based on the preceding state of land use, and the probabilities matrix serves as a basis to create a future land use map. To predict the land use of 2010 in the Langat Basin, a Markov analysis was conducted using land use maps from 1984-2006. This generated a transition probability matrix, a transition area matrix, and nine conditional probability maps by analyzing two qualitative land use maps from 1984 and 2006. The transition probability matrix shows the probability of each land use category changing to every other land use category in the projected land use map of 2010, with rows representing older land use categories and columns representing newer categories.
The transition area matrix shows the expected number of cells that will change from one land use category to another in 2010. This matrix was created by multiplying each column in the transition probability matrix by the number of cells of the corresponding land use type in the 2006 land use map. The prediction of the 2010 land use was accomplished using an MLP neural network and 1000 iterations were used to run the data for all conversion types. A visual comparison of the existing land use map with the predicted land use map (Fig. S3 in Supplementary material) shows that they are similar, but accuracy assessment is needed to confirm this ([12]).
The probability of forest land remaining as forest area in 2010 is high, with a probability of 90.5% which indicates stability. Similarly, the probability of urban area remaining as urban is 79.5% for the same period. There is a 30% probability of permanent crop, 12% probability of swamp, and 19% probability of animal husbandry being converted to urban areas. Additionally, forest land is expected to have a 3.9% probability of changing to permanent crops and a 3.2% probability of changing to urban areas. The probability of short-term crops changing to horticultural land, grassland and permanent crops is 26%, 37% and 33%, respectively (Fig. S3, Tab. S4 - Supplementary material).
Accuracy assessment
To determine the accuracy of the predicted land use map of 2010 generated from the Markov Chain, a comparison was made between this map and the documented (existing) map of 2010, which served as a reference map. The goal was to assess the accuracy of each class. The comparison resulted in an overall Kappa index of agreement (KIA) of 0.82, indicating a high level of agreement between the predicted and documented land use maps of 2010 ([35]). Based on this, a high-accuracy land use map of 2010 was created (Tab. 2).
Tab. 2 - Value of Kappa index of agreement (KIA) for the comparison of documented and predicted land use map of 2010 in the Langat River basin. Kappa for no information (Kno) was 0.8609; Kappa for grid-cell level location (K Location) was 0.8704; Kappa for stratum-level location (K Location Strata) was 0.8704; and overall KIA (K standard) was 0.8266.
| Land use category | KIA |
|---|---|
| Animal husbandry area | 0.1257 |
| Forest land | 0.9246 |
| Horticultural land | 0.8229 |
| Idle grassland | 0.5893 |
| Short term crops | 0.2654 |
| Swamp | 0.8716 |
| Permanent crops | 0.7705 |
| Urban area | 0.8944 |
| Water body | 0.8370 |
| Overall | 0.8266 |
The CROSSTAB module was used to create an error matrix for the land use maps of 2010 (predicted and documented) to evaluate the prediction accuracy (Tab. S5 in Supplementary material). The overall accuracy between land use categories in the predicted map and the reference map was found to be 49%. The lowest producer’s accuracy was observed for the animal husbandry class at 10.75%, which may be due to some sites being identified as urban areas in the reference map. The highest producer’s accuracy was for the forest land class at 94.83%, followed by permanent crop area at 90%, and urban area at 78.68%.
Projections of future land use
As the Markov Chain model yielded satisfactory outcomes with great accuracy, it was employed to predict the forthcoming land use changes for the years 2030, 2050, and 2080 (Fig. S4 in Supplementary material). To generate future land use maps, the Markov Chain model was utilized. The identical procedures followed in simulating the land use maps of 2010 were repeated to forecast the maps of future scenarios. The initial land use maps for the prediction were the 1984 and 2006 land use maps.
Following the projection of land use maps, an analysis was conducted to examine changes in each land use category between 2010 and 2030, 2050, and 2080. The results of this analysis are presented in Tab. 3, which illustrate the transitions and changes in land use categories in terms of gains and losses (see also Fig. S5). The projected maps indicate significant transitions and changes among different land uses throughout the simulation period, particularly among urban areas, permanent crops, and forest land. Tab. 3 provides statistics regarding the land use projections for each of the three simulated years. A comparison of the percentages of land use categories between 2010 and the simulated years reveal dramatic changes in the areas of different classes.
Tab. 3 - Changes in the area of land use categories between 2010 and 2030, 2050, 2080 in the Langat Basin.
| Year | Land Use Category | Year 2010 | Projection | Changes | |||
|---|---|---|---|---|---|---|---|
| area (ha) | % of watershed | area (ha) | % of watershed | Area (ha) | (%) | ||
| 2030 | Animal husbandry | 197.09 | 0.16 | 259.47 | 0.21 | 62.38 | 31.65 |
| Forest land | 47879.39 | 38.41 | 46058.13 | 36.95 | -1821.26 | -3.80 | |
| Horticultural land | 5431.37 | 4.36 | 6419.35 | 5.15 | 987.98 | 18.19 | |
| Idle grassland | 4428.46 | 3.55 | 4438.41 | 3.56 | 9.95 | 0.22 | |
| Short term crops | 616.23 | 0.49 | 825.81 | 0.66 | 209.58 | 34.01 | |
| Swamp | 878.20 | 0.70 | 1167.61 | 0.94 | 289.41 | 32.95 | |
| Permanent crops | 32643.11 | 26.18 | 18352.40 | 14.72 | -14290.71 | -43.78 | |
| Urban area | 30427.65 | 24.41 | 43099.19 | 34.57 | 12671.54 | 41.64 | |
| Water body | 2163.06 | 1.74 | 4044.21 | 3.24 | 1881.15 | 86.97 | |
| 2050 | Animal husbandry | 197.09 | 0.16 | 309.3661 | 0.25 | 112.28 | 56.97 |
| Forest land | 47879.39 | 38.41 | 44374.08 | 35.59 | -3505.31 | -7.32 | |
| Horticultural land | 5431.37 | 4.36 | 6658.856 | 5.34 | 1227.49 | 22.60 | |
| Idle grassland | 4428.46 | 3.55 | 4568.14 | 3.66 | 139.68 | 3.15 | |
| Short term crops | 616.23 | 0.49 | 853.2517 | 0.68 | 237.02 | 38.46 | |
| Swamp | 878.20 | 0.70 | 1187.567 | 0.95 | 309.37 | 35.23 | |
| Permanent crops | 32643.11 | 26.18 | 18477.14 | 14.82 | -14165.97 | -43.40 | |
| Urban area | 30427.65 | 24.41 | 44114.61 | 35.39 | 13686.96 | 44.98 | |
| Water body | 2163.06 | 1.74 | 4121.555 | 3.31 | 1958.49 | 90.54 | |
| 2080 | Animal husbandry | 197.09 | 0.16 | 314.35 | 0.25 | 117.27 | 59.50 |
| Forest land | 47879.39 | 38.41 | 44201.93 | 35.46 | -3677.46 | -7.68 | |
| Horticultural land | 5431.37 | 4.36 | 6691.29 | 5.37 | 1259.92 | 23.20 | |
| Idle grassland | 4428.46 | 3.55 | 4585.604 | 3.68 | 157.14 | 3.55 | |
| Short term crops | 616.23 | 0.49 | 850.7568 | 0.68 | 234.53 | 38.06 | |
| Swamp | 878.20 | 0.70 | 1195.051 | 0.96 | 316.85 | 36.08 | |
| Permanent crops | 32643.11 | 26.18 | 18494.6 | 14.84 | -14148.51 | -43.34 | |
| Urban area | 30427.65 | 24.41 | 44206.92 | 35.46 | 13779.27 | 45.29 | |
| Water body | 2163.06 | 1.74 | 4124.05 | 3.31 | 1960.99 | 90.66 | |
Our results indicate that there will be significant changes in the Langat Basin’s land use categories from 2010 to 2030. The urban area is projected to have the highest increase (41.6%), followed by water bodies (86%). Although the percentage change in water bodies is higher than that of urban areas, it is important to note that water bodies only account for a small portion (1.7%) of the total land area in the Langat Basin. Therefore, the percentage change in the urban area is more important, despite its lower value compared to water bodies. Conversely, the area of permanent crops is projected to have the highest decrease (43.7%), followed by forestland (3.8%).
According to the results reported in Tab. 3, the Langat Basin is expected to experience a significant increase in land use categories by 2050, with the conversion of permanent crops and forest land areas contributing the most to this increase. The largest increases in land use types are expected in water bodies (90.5%), animal husbandry (56.9%), and urban areas (44.9%). Conversely, the largest decreases in land use categories are expected in permanent cropland (43.4%) and forestland (7.3%). The results for 2080 show similar trends in land use changes compared to those in 2050, indicating that there may be no significant changes in these land use categories between 2050 and 2080. The highest increasing change in land use types of the Langat Basin is expected to occur in water bodies (90.6%), followed by animal husbandry (59.5%) and urban areas (45.2%), while the highest decreasing change will take place in permanent crops (43.3%) and forestland (7.6%). Fig. S5 (Supplementary material) reports in detail the gains and losses for each land use category concerning other land uses between 2010 and 2030, as well as between 2050 and 2080.
Land use scenarios
To analyze how changes in land use and land cover affect the flow of Langat River, different scenarios of land use were created and examined. These scenarios were designed by modifying the land cover to study the impact of forest cover on the discharge of the Langat Basin. In order to achieve this, the current land use activities in the basin were taken into account, and the effects of these activities on land use changes relative to the land use in 2006 (which serves as the baseline for the control run) were examined. Scenarios E1, E2, and E3 involved replacing all of the existing forest cover with agriculture, urban, or both, to simulate a situation where there is no forest cover left in the watershed.
As mentioned earlier, the Langat Basin is currently experiencing massive land use changes, mainly in agricultural land (including short-term and permanent crops), urban areas, and forestland. Therefore, the scenarios developed for this study aimed to reflect these ongoing trends in land use conversions in the basin. The reasons for selecting these scenarios are explained below.
In the past decades and earlier, land use change has been recorded in the Langat Basin. The trend was the replacement of forest land with agriculture, particularly rubber and mixed-agriculture. This was done under the country’s agricultural development program in the early 1960s. In the same years or even earlier, large tracts of forest were used to tin extraction. By the early 1970s, vast areas of forest were cleared for oil palm plantations. In the 1990s, the country began urbanization and industrialization, leading to the clearing of large forest areas for industrial and residential development. According to Shaharudin et al. ([38]) and Krishnapillay et al. ([26]), the forest cover has decreased due to these activities. The ADB ([4]) reported that Southeast Asia’s primary forest had decreased by approximately 27% between 1990 and 2005 due to forest conversion into agricultural areas. It predicts a growth in Malaysia’s agricultural area in the future, reaching 4.92 million hectares in East Malaysia by 2030. However, the availability of suitable land for new oil palm plantations is limited due to past land conversions. Despite this, the population of Malaysia is expected to increase from 28.4 million in 2010 to 40.6 million in 2030 ([42]), requiring more forest areas to be transformed into agricultural land to meet the growing demand for food. Additionally, industrialization and urbanization are currently taking place in Malaysia, particularly along the western coast of the peninsula, which will also lead to more forests being converted into built-up areas. Ultimately, the land use/land cover changes of the Langat basin were produced based on the land use change scenarios created for the future (Fig. S6 in Supplementary material). The resulting the area and percentage of each land use category in the Langat basin for all six scenarios are presented in Tab. 4.
Tab. 4 - Areal coverage of land use (in ha) and percentages (in brackets) in the Langat basin under different scenarios of future land use change. (L): low; (M): medium; (H): high; (E1): extreme-1; (E2): extreme-1; (E3): extreme-3.
| Land use category | Observed | Scenario (in ha, % in brackets) | |||||
|---|---|---|---|---|---|---|---|
| L | M | H | E1 | E2 | E3 | ||
| Animal husbandry | 249.49 (0.2) | 249.49 (0.2) | 249.48 (0.02) | 249.49 (0.2) | 249.48 (0.2) | 249.49 (0.2) | 249.49 (0.2) |
| Forest land | 49640.78 (39.59) | 39726.1 (31.68) | 30175.67 (24.07) | 20121.27 (16.05) | 0 (0) | 0 (0) | 0 (0) |
| Horticulture | 5032.19 (4.01) | 8245.6 (6.58) | 9774.971 (7.8) | 11740.94 (9.36) | 13443.93 (10.72) | 21867.12 (17.44) | 5034.68 (4.02) |
| Idle grassland | 4041.72 (3.22) | 4041.72 (3.22) | 4041.718 (3.22) | 4041.72 (3.22) | 4041.72 (3.22) | 4041.72 (3.22) | 4041.72 (3.22) |
| Short term crops | 678.61 (0.54) | 681.11 (0.54) | 676.1146 (0.54) | 676.11 (0.54) | 677.29 (0.54) | 686.13 (0.55) | 676.11 (0.54) |
| Swamp | 1012.92 (0.81) | 1012.92 (0.81) | 1012.924 (0.81) | 1012.92 (0.81) | 1012.41 (0.81) | 1062.65 (0.85) | 1012.92 (0.81) |
| Permanent crops | 32189.04 (25.67) | 38890.3 (31.02) | 41949.04 (33.46) | 45075.14 (35.95) | 48546.13 (38.72) | 64940.16 (51.79) | 32184.06 (25.67) |
| Urban area | 30380.25 (24.23) | 30380.2 (24.23) | 35347.57 (28.19) | 40309.91 (32.15) | 55256.54 (44.07) | 30380.24 (24.23) | 80028.53 (63.83) |
| Water body | 2153.58 (1.72) | 2153.09 (1.72) | 2153.088 (1.72) | 2153.09 (1.72) | 2153.09 (1.72) | 2153.09 (1.72) | 2153.09 (1.72) |
| Total | 125380.6 (100) | 125380.6 (100) | 125380.6 (100) | 125380.6 (100) | 125380.6 (100) | 125380.6 (100) | 125380.6 (100) |
Impact of land use change on streamflow
Various studies have reported that rainfall-runoff relationships are influenced by different land use patterns. The reduction of forest cover and the expansion of built-up areas are examples of land use changes that can affect the quantity and quality of water resources. Such changes often result in an increase in surface runoff and streamflow ([24], [36]).
Sensitivity analysis, calibration and validation
The result of sensitivity analysis procedure showed that CN2 (soil conservation service curve number), SLSUBBSN (Average slope length), ESCO (Soil evaporation compensation factor), SOL_AWC (available water capacity of the soil layer), ALPHA_BF (maximum canopy storage - CANMX, baseflow alpha factor), GW_DELAY (Groundwater delay time), GWQMN (threshold depth of water in the shallow aquifer required for return flow to occur), and OV_N (Manning’s “n” value for overland flow) were more sensitive parameters to streamflow changes than other parameters. Therefore, these eight important parameters were selected for model calibration and parameterization process in the Langat watershed.
The SWAT model was calibrated well to the observed monthly streamflow. The result of observed and simulated monthly streamflow displays an R2 value of 0.842. The observed and simulated monthly streamflow during the calibration period (1985-2002) were 7.88 and 7.98 m3 s-1, respectively. The NSE and R2 for the calibration period were 0.80 and 0.82, respectively.
The result of validation showed an R2 value of 0.789 for the relationship between observed and simulated monthly streamflow. The recorded and simulated average-monthly streamflow during the validation period (2003-2011) were 10.70 and 9.85 m3 s-1, respectively. The comparison of monthly measured and simulated streamflow exhibits that the SWAT model can well simulate the streamflow during both calibration and validation periods. Both NSE and R2 were 0.74 for the validation period.
The Fig. 3 and Fig. 4 show the observed and simulated monthly streamflow due to future land use change in the Langat River basin. For this analysis, the climatic variables of temperature and precipitation from 2000 to 2009, along with the land use in 2010, were used as the baseline period. The sensitivity of streamflow to future projected land use changes (2030, 2050, 2080, Low, Medium, High, E1, E2, and E3) was simulated while keeping the climatic variables constant (Fig. 3, Fig. 4).
Fig. 3 - Sensitivity of monthly streamflow for projected land use change impact (a) with difference change in each type of land use (b) and the percent of existed landuse in the study area (c).
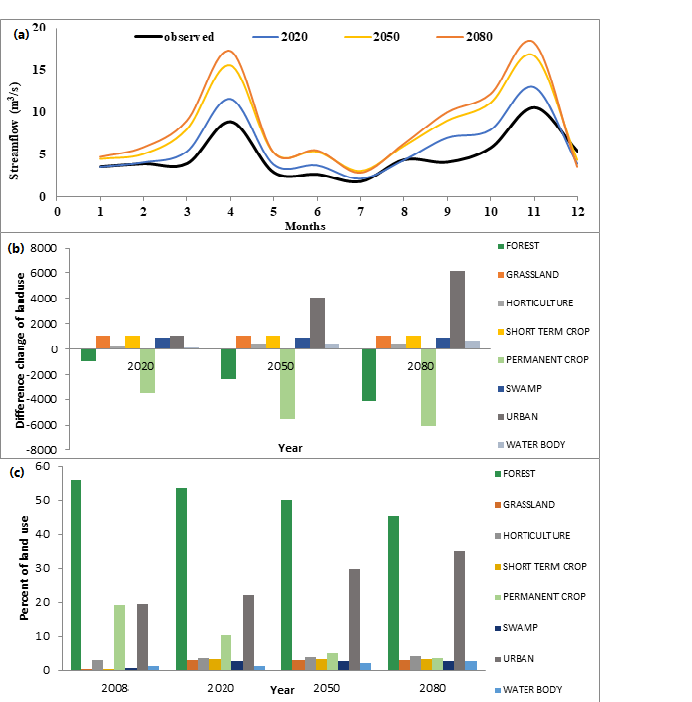
Fig. 4 - Simulation of monthly streamflow for future land use change scenarios (a), with percent change in each type of land use (b) and the percent of existed land use in basin (c).
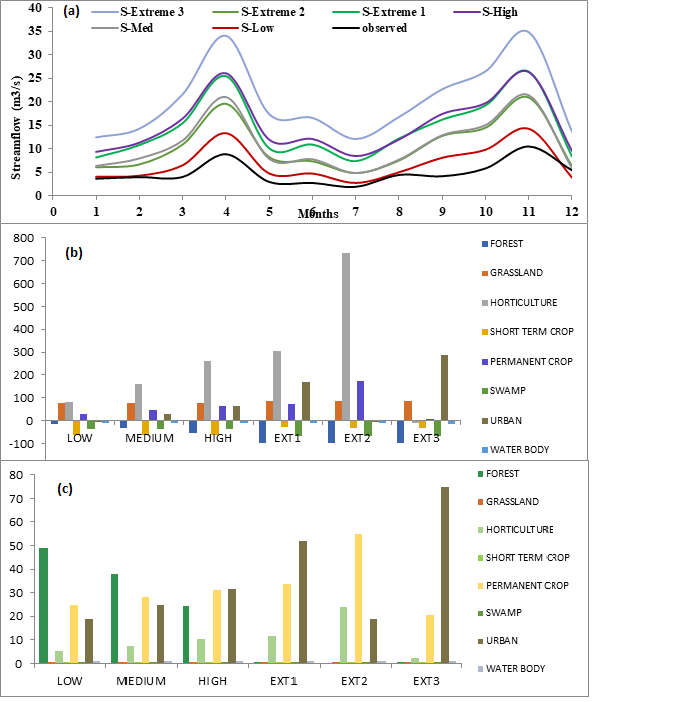
Fig. 3a shows that the mean monthly streamflow in the Langat basin is expected to increase due to land use change, as compared to the baseline (2010) scenario, as indicated by the comparison of different land use change scenarios. The increase is mainly observed in peak flow, low flow, and flow volume, while the effect on low flow is less prominent than that on peak flow. The hydrograph exhibits a time-dependent pattern with the rising limb aligning with the wet season (middle of September to April) and the recession limb corresponding to the dry season (May to September). The highest increase in streamflow is predicted in November, while the lowest in July. The simulated streamflow for the dry season is similar to the observed flow, but there is a noticeable difference between the observed and simulated flows in the wet season. In conclusion, the impact of land use change on streamflow is expected to be more significant in the wet season than in the dry season in the future.
The impact of land use change on streamflow is shown in Fig. 3, which indicated that the change in land use scenarios (2030, 2050, and 2080) only affected the magnitude of streamflow. The intensive anthropogenic activities that occurred since the 1980s, such as deforestation for agricultural and built-up areas, were responsible for the increase in streamflow ([2]). However, the expansion of impervious and concrete areas for industrial and residential purposes, rather than agricultural area expansion, played a more significant role in this increase. The reduction in pervious lands, such as cultivated and natural vegetation cover, leads to greater runoff due to lower soil infiltration rates and lower potential evapotranspiration. Serpa et al. ([36]) also stated that under projected land use changes, an increase in impervious area can lead to higher runoff and lower potential evapotranspiration, which in turn leads to an increase in streamflow. This means that deforestation can have a negative impact on the amount of rainfall absorbed by the canopy cover and used in the evapotranspiration process.
The results of simulation for monthly streamflow under all land use change scenarios shows an increase in flow (as depicted in Fig. 4), but the percent changes were different relative to the recorded streamflow (see Fig. 5 and Tab. 5). For instance, in the low scenario (S-Low), 2860 ha of forestland, equivalent to 7.3% of the basin area, was converted to agricultural land use. This resulted in a 43.5% increase in monthly streamflow on average annually, with the highest increase occurring in September (94.5%) and the lowest increase in February and December (6.5%). In the medium scenario (S-Med), approximately 7174 ha of forestland, equivalent to 18.3% of the watershed total area, was converted to other land use types, with 30% becoming agricultural land and 10% transforming into urban areas. The monthly flow increased by 132% on average annually, with the highest increase in September (211%) and the lowest increase in December (8.6%). Under the high scenario (S-High), about 12.332 ha of forestland, equivalent to 31.4% of the basin area, was transformed to other land use types, with 40% becoming agricultural land and 20% transforming into urban areas. The monthly flow increased by 234% on average annually, with the highest increase occurring in July (354%) and the lowest increase in December (75.3%).
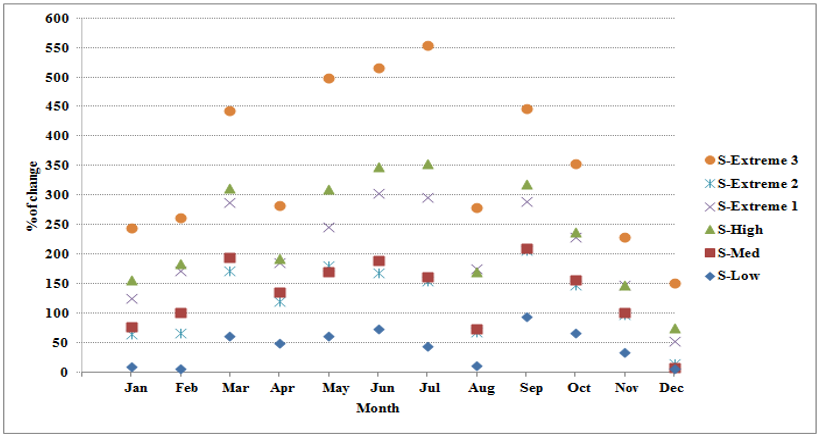
Fig. 5 - Percent of change in monthly streamflow for future land use change scenarios compared with observed streamflow.
Tab. 5 - Simulated monthly streamflow (m3/s) for future land use change scenarios.
| Month | Observed | S-Low | S-Med | S-High | S-Extreme 1 | S-Extreme 2 | S-Extreme 3 |
|---|---|---|---|---|---|---|---|
| Jan | 3.62 | 3.99 | 6.40 | 9.34 | 8.17 | 5.97 | 12.51 |
| Feb | 3.97 | 4.23 | 7.98 | 11.32 | 10.83 | 6.61 | 14.36 |
| Mar | 3.99 | 6.47 | 11.79 | 16.46 | 15.47 | 10.87 | 21.67 |
| Apr | 8.92 | 13.34 | 20.99 | 26.13 | 25.46 | 19.60 | 34.12 |
| May | 2.91 | 4.69 | 7.91 | 11.95 | 10.11 | 8.17 | 17.45 |
| Jun | 2.70 | 4.69 | 7.81 | 12.09 | 10.91 | 7.26 | 16.65 |
| Jul | 1.86 | 2.68 | 4.88 | 8.45 | 7.39 | 4.76 | 12.16 |
| Aug | 4.43 | 4.97 | 7.73 | 11.98 | 12.20 | 7.44 | 16.84 |
| Sep | 4.15 | 8.08 | 12.92 | 17.45 | 16.21 | 12.72 | 22.74 |
| Oct | 5.84 | 9.79 | 15.05 | 19.75 | 19.25 | 14.46 | 26.55 |
| Nov | 10.60 | 14.28 | 21.36 | 26.37 | 26.40 | 20.94 | 34.86 |
| Dec | 5.43 | 5.78 | 5.90 | 9.52 | 8.36 | 6.22 | 13.68 |
Fig. 5 displays the percentage change in streamflow for each scenario, demonstrating that the monthly streamflow rates follow a consistent pattern. The largest increases in both peak flow and volume were observed in the scenario E3 (extreme 3), with the E1 and E2 scenarios showing slightly lower increases. Notably, changes in flow volume were less significant compared to peak flow. In other words, the increase in peak flow was more pronounced than the increase in flow volume.
To summarize, our findings indicate that the decrease in forest coverage and increase in built-up areas have a substantial influence on streamflow, with changes in agricultural land being less impactful. The three scenarios analyzed all indicated a quick rate of land use change projected for the 2030s.
Our models predicted that the urban area in the Langat basin could continue to increase in the 2080s, while the rate of increase in forest and agricultural land could be less than in the 2030s and 2050s. As a result, the streamflow in the Langat basin in the 2080s could be much higher than in the earlier periods. This suggests that policymakers should carefully consider future built-up development in the Langat River basin to prevent an increase in flooding potential due to land use conversion.
The predicted increase in urban areas, coupled with slower growth rates in forest and agricultural lands, indicates a shifting landscape in the Langat basin. These changes are critical to address due to their potential influence on streamflow and consequently, flooding risks. The methodology and predictions in this study are grounded in robust data analysis and modeling techniques, making the findings reliable and valuable for future planning.
Discussion
The Langat Basin has undergone significant changes in land use, particularly in the built-up and urban areas which have seen a considerable increase in residential, industrial, and other developments. This transformation has occurred as a result of changes in forest and agricultural land use. The conversion of forest land into agriculture has been a common trend in the Langat Basin since the early 1960s, with most of the forests being converted into agricultural land for rubber and mixed-agriculture under the country’s agricultural development program. Furthermore, in recent decades, almost 60% of the agricultural land has been converted into built-up areas, and this trend is expected to continue in the future.
To assess current land use patterns and project future changes for sustainable development, decision makers require detailed maps. However, modeling land use changes is challenging, especially in rapidly growing areas, as many socio-economic drivers must be considered. Therefore, we made assumptions about certain constant drivers to develop and apply different land use change scenarios, which covered a broad range of possibilities. The existing trends were used as the primary drivers, and the data was deemed sufficiently suitable for this context. Such research is beneficial for designing the city’s urban form in a planned manner and highlights the need for sustainable urban planning, emphasizing the importance of considering the impact on hydrological systems and potential flooding risks.
The examination of land use change scenarios yielded some interesting findings. The upstream area of the Langat watershed showed the least amount of forest-to-agricultural land conversion based on the land use change map. This suggests that land use change may have a greater impact on hydrological response in downstream areas than changes in rainfall. The 2030s scenario showed that the reduction of forest and its conversion to urban and agricultural land had a greater impact on streamflow than changes in rainfall and temperature. The sensitivity analysis of land use scenarios investigated the impact of different land use types on hydrological processes in the basin. The transformation of forest into urban land was found to have the most significant effect on streamflow, followed by the transformation of forest into urban and agricultural land combined. It is important to note that forest cover plays a critical role in reducing surface runoff through increased rainfall transpiration and interception compared to crop land, thanks to a greater leaf coverage and deeper root systems that allow for more rainfall to be absorbed into deep soil layers. Conversely, urban areas have high surface runoff due to the high proportion of impervious surfaces, which results in a smaller amount of rainfall being absorbed into the soil layers.
Various models have been introduced to forecast spatial land use changes, such as What-if and LULC software, which are considered suitable and reliable. However, these models require extensive datasets on topography, physical restrictions of the study area, population growth projections, estimates of residential demand, residential density, and residential vacancy rates. These models are not appropriate, especially for developing countries, due to a lack of data. Therefore, the LCM model in IDRISI software was utilized in this study to predict land use maps for 2030, 2050, and 2080, as well as to design land use change scenarios for the Langat basin. The study focused on three land use categories, which included a reduction in forested area, an increase in urban area, and an increase in agricultural land. The scenarios were chosen based on previous analyses showing that these three types of land use dominated the study area. However, using different scenarios may provide policy makers with a better understanding of the potential changes to the catchment’s natural behavior, and the extent and impact of future land use changes on streamflow. By analyzing past land use trends, we may also gain better insights into future land use patterns. While this study demonstrated how land use changes can impact streamflow in the Langat basin, it is important to note that the models do not predict actual streamflow amounts. Rather, the results provide decision makers with guidance on the types of data and information required for effective water management and land use planning, with some level of uncertainty in the projections. Moreover, given the predicted increase in streamflow, the findings align with global concerns about climate change and its impact on hydrological patterns. Malaysia, like many other countries, faces the challenge of adapting to changing climate conditions. Stakeholders and decision-makers can use land use scenario techniques to plan and develop future land use and assess the resulting hydrological impacts. Policymakers can also use appropriate adaptive strategies to reduce risks associated with increased streamflow and flooding potentials.
As water resources become more variable due to changing land use patterns and climate, policymakers can use the outcome of this research to implement adaptive water management strategies. These strategies could include the development of reservoirs, groundwater recharge initiatives, and improved flood control measures.
Acknowledgements
Both authors were involved in designing and planning the research, collecting data, creating models, drafting the manuscript, and approving the final article. ME developed the theoretical framework, conducting analytical calculations, and performing numerical simulations. AAN supervised the overall project.
References
Gscholar
Gscholar
Gscholar
Gscholar
Gscholar
Gscholar
Gscholar
CrossRef | Gscholar
Gscholar
Gscholar
CrossRef | Gscholar
CrossRef | Gscholar
Gscholar
CrossRef | Gscholar
Gscholar
Gscholar
Gscholar
Authors’ Info
Authors’ Affiliation
Department of Water Resources Management, Research Institute of Hamoon International Wetland, Zabol Research Institute, Zabol (Iran)
Faculty of Forestry, Universiti Putra Malaysia, 43400 UPM Serdang, Selangor (Malaysia)
Corresponding author
Paper Info
Citation
Ebrahimian M, Nurruddin AA (2024). Quantitative assessment of past and future tropical forest transition and its dynamic to streamflow of the catchment, Malaysia. iForest 17: 181-191. - doi: 10.3832/ifor4339-017
Academic Editor
Luigi Saulino
Paper history
Received: Mar 01, 2023
Accepted: Jun 26, 2024
First online: Jun 30, 2024
Publication Date: Jun 30, 2024
Publication Time: 0.13 months
Copyright Information
© SISEF - The Italian Society of Silviculture and Forest Ecology 2024
Open Access
This article is distributed under the terms of the Creative Commons Attribution-Non Commercial 4.0 International (https://creativecommons.org/licenses/by-nc/4.0/), which permits unrestricted use, distribution, and reproduction in any medium, provided you give appropriate credit to the original author(s) and the source, provide a link to the Creative Commons license, and indicate if changes were made.

Web Metrics
Breakdown by View Type
Article Usage
Total Article Views: 15596
(from publication date up to now)
Breakdown by View Type
HTML Page Views: 10705
Abstract Page Views: 2395
PDF Downloads: 2114
Citation/Reference Downloads: 2
XML Downloads: 380
Web Metrics
Days since publication: 734
Overall contacts: 15596
Avg. contacts per week: 148.74
Article Citations
Article citations are based on data periodically collected from the Clarivate Web of Science web site
(last update: Mar 2025)
(No citations were found up to date. Please come back later)
Publication Metrics
by Dimensions ©
Articles citing this article
List of the papers citing this article based on CrossRef Cited-by.
Related Contents
iForest Similar Articles
Research Articles
Hydrological simulation of a small forested catchment under different land use and forest management
vol. 13, pp. 301-308 (online: 10 July 2020)
Research Articles
Future land use and food security scenarios for the Guyuan district of remote western China
vol. 7, pp. 372-384 (online: 19 May 2014)
Technical Reports
Deforestation, land conversion and illegal logging in Bangladesh: the case of the Sal (Shorea robusta) forests
vol. 5, pp. 171-178 (online: 25 June 2012)
Research Articles
Land use inventory as framework for environmental accounting: an application in Italy
vol. 5, pp. 204-209 (online: 12 August 2012)
Research Articles
Confronting international research topics with stakeholders on multifunctional land use: the case of Inner Mongolia, China
vol. 7, pp. 403-413 (online: 19 May 2014)
Research Articles
Wildfire incidence in Spanish Natura 2000 sites is largely explained by forest land cover
vol. 19, pp. 195-200 (online: 04 June 2026)
Technical Notes
The feasibility of implementing cross-border land-use management strategies: a report from three Upper Silesian Euroregions
vol. 7, pp. 396-402 (online: 19 May 2014)
Research Articles
Reforestation and land use change in a drainage basin of southern Italy
vol. 6, pp. 175-182 (online: 08 May 2013)
Review Papers
Soil fungal communities across land use types
vol. 13, pp. 548-558 (online: 23 November 2020)
Research Articles
Comparing land use registry and sample based inventory to estimate forest area in Podlaskie, Poland
vol. 10, pp. 315-321 (online: 23 February 2017)
iForest Database Search
Search By Author
Search By Keyword
Google Scholar Search
Citing Articles
Search By Author
Search By Keywords
PubMed Search
Search By Author
Search By Keyword


