Runoff reconstruction and climatic influence with tree rings, in the Mayo river basin, Sonora, Mexico
iForest - Biogeosciences and Forestry, Volume 13, Issue 2, Pages 98-106 (2020)
doi: https://doi.org/10.3832/ifor3190-013
Published: Mar 11, 2020 - Copyright © 2020 SISEF
Research Articles
Abstract
Dendrochronological series are reliable sources of information to analyze past hydrological and climatological variation that provides useful information for the management of water resources within basins. We analyzed dendrochronological series obtained from the upper Mayo River Basin using principal components analysis to determine a common climatic signal. Although the complete series extended for over 350 years, the representative period common to all series was from 1750 to 2014 (265 years) with an expressed population signal of over 0.85. Climate data (precipitation and temperature) were collected from the North American Land Data Assimilation System 2 model of the Land Data Assimilation System and hydrometrics records were obtained from the National Commission of Water in Mexico. The results of the response function showed an association of mean monthly temperature with the ring width series for the months of December of the previous year, May and October of the year of growth, and seasonally from January to July (r = -0.75, n = 36, p < 0.05). A significant response to rainfall of earlywood growth was observed for June, November, and December of the previous year, January and February of the growth year, and seasonally, from October of previous year to May of the current growth year (r = 0.70, n = 35, p < 0.05). Significant association also was found between earlywood and the accumulated runoff from October of the previous year to May of the growth year, which was used for reconstruction of the runoff flow between 1750 and 2014, which showed evidence of decadal drought. Significant correlation was found between the reconstructed runoff series, and the Southern Oscillation index (r = -0.42, n = 228, p < 0.05), but not significant with the Pacific Decadal Oscillation index (r = 0.16, n = 115, p < 0.05). We also observed significant (p < 0.05) associations with the drought indices Palmer Drought Severity Index and Standardized Precipitation Evapotranspiration Index (r = 0.56, r = 0.41, respectively). Our study demonstrated the potential of assimilated data for dendroclimatic reconstructions and the feasibility of generating hydroclimatic information of extreme events that have not been recorded in the available climatic and hydrological instrumental records.
Keywords
Introduction
A serious problem for studying regional hydroclimatic variation is the limited time period of records, usually not exceeding 70 years of data, and the lack of adequate climatic and hydrometric information ([9]). The climate databases presently offered by international institutions are optional sources of climate data, are available for a large part of North America, and are based on observed data and modelling of the Earth’s surface. Therefore, they provide a range of opportunities to obtain environmental variables of spatial and temporal relevance that describe large scale interactions of climate dynamics and cycles that regulate local and regional conditions ([56]). One example of a dataset reconstructed through modelling is the North American Land Data Assimilation System 2 (NLDAS-2), which provides relevant information for the calculation of water balances, drought incidence, precipitation-runoff ratios, and other parameters ([17]).
The understanding of the historical behavior of hydroclimatic variability is essential to determine trends and fluctuations through time, which in turn can provide information for the design of optimal and integrated natural resource management plans and forecasts, such as determining water volumes for agriculture, anticipating the frequency of wildfires due to temperature fluctuations, or developing climate models with a high predictive capability. All this knowledge is essential to implement strategies for adaptation to climate variability and for the mitigation of its impacts ([34], [49]).
Tree growth rings are one of several existing proxies to infer or reconstruct historical patterns of environmental variables because their growth is influenced by the environmental conditions occurring during their formation, they have annual resolution, and their temporal coverage is several centuries, which allows a better understanding of ancestral climate ([30]). Several historical reconstructions of climatic and hydrological variables have recently been made in northern and central Mexico, which have provided a better understanding of past climate and how general atmospheric circulatory patterns influence precipitation ([7], [52]) and runoff ([54]). The upper watershed of the Sierra Madre Occidental is a zone of influence for several global atmospheric circulation patterns that largely determine the hydroclimatic variability of the region ([31]). However, the available information for the state of Sonora continues to be scarce and is nonexistent for the MRB region.
The objective in this study was to develop a response function between dendrochronological series from the upper MRB and climate variables (precipitation and temperature) from the assimilated data in the NLDAS-2 model, and to reconstruct historical runoff volumes to determine past water availability, the occurrence of extreme hydroclimatic events, and the influence of general atmospheric circulatory patterns.
Methods
Study site
The Mayo River Basin (MRB), located in the southern portion of Sonora, Mexico, is ecologically and economically important due to its orographic, biological, and hydrological characteristics. It is a biological corridor that harbors a rich biodiversity which varies with the altitudinal gradient. It is also a zone of surface water and groundwater production that supplies the Mayo River 038 Irrigation District, which irrigates 96,914 ha ([28]). The MRB is the source of water for aquaculture, agriculture, livestock, urban consumption, and other industries, which consume 97% of the available water, mostly supplied by runoff. However, deforestation in the upper part of the basin threatens the economic vitality of the region by causing soil erosion and sediment accumulation in the lower part of the rivers where economic activities take place ([41]). The National Commission of Water has transferred the agricultural water infrastructure to the users, which increased its efficiency by up to 61% ([11]).
The MRB has an area of 27,541 km2 extending within the Southern Sonora region (from 28° 26′ 01.21″ to 26° 39′ 12.9″ N, and from 109° 56′ 23.05″ to 107° 57′ 25.42″ W), and forms part of the Hydrological Region 9 (Fig. 1). The Mayo River flows 350 km from its headwaters in the Basaseachic Falls in the state of Chihuahua to its mouth in the Gulf of California in Sonora ([25]).
Fig. 1 - Geographic location of Mayo river basin, dendrochronological series (COB: Barrancas del Cobre; CDO: Cebadillas de Ocampo; TUT: Tutuaca; BIS: Bisaloachic), and hydrometric station San Bernardo in Sonora, Mexico.
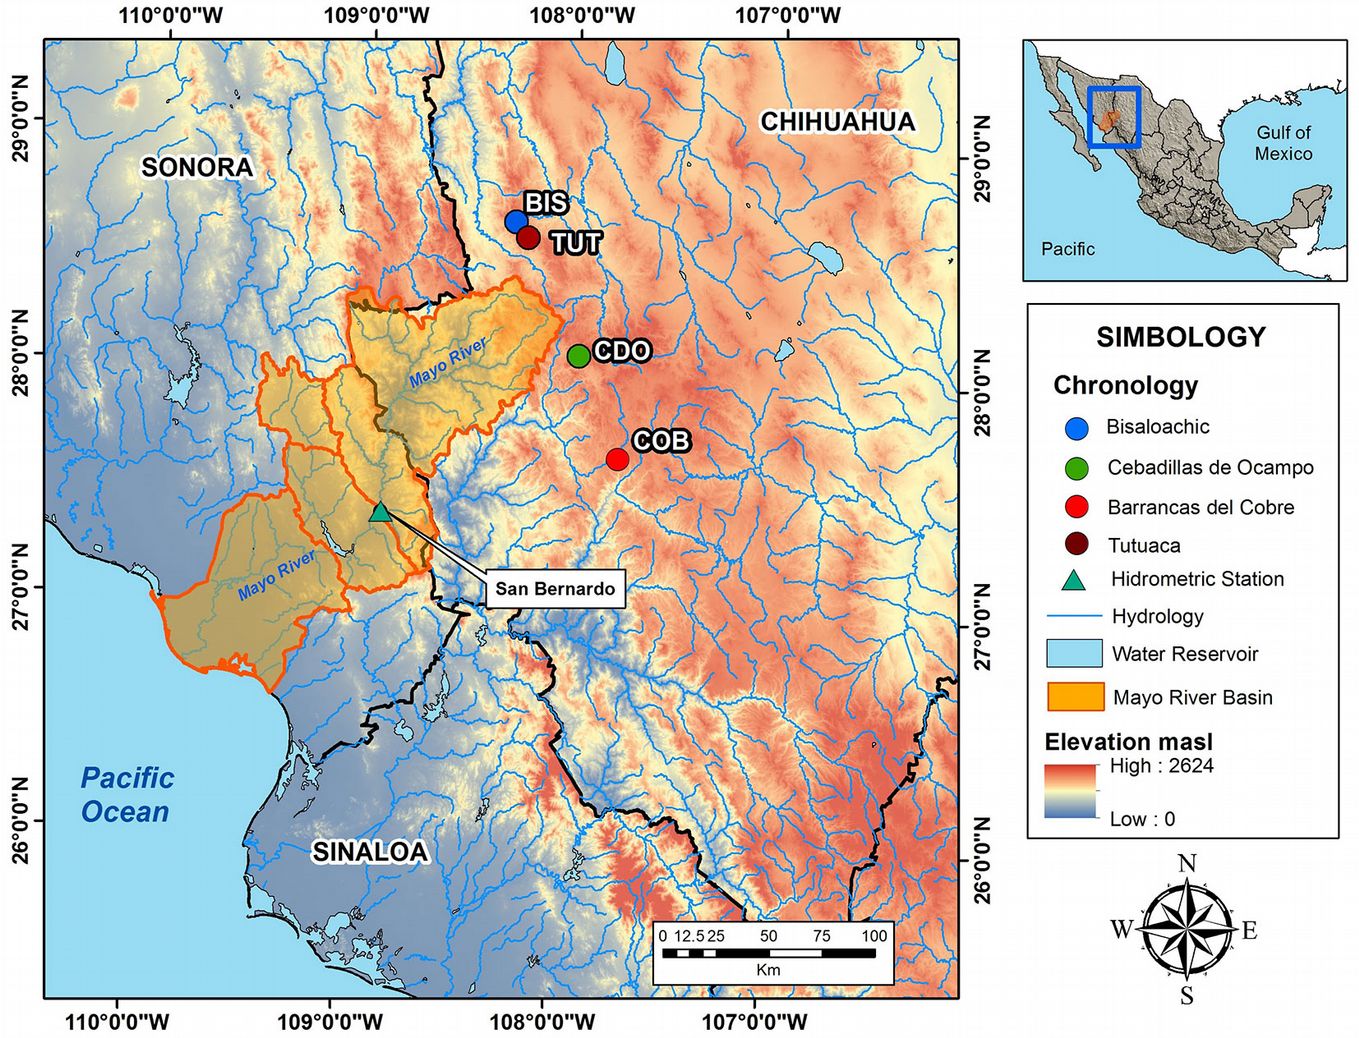
The predominant climate in the basin varies from arid to semi-arid and from warm to temperate dry ([20]). The mean annual temperature ranges between 20 and 22 °C. The mean annual precipitation in the lower elevations of the basin fluctuates from 200 to 400 mm and up to 750 mm in the higher areas. The runoff in the MRB originates in the watershed of the Sierra Madre Occidental, where most rainfall occurs in the summer months from July to September and is controlled by the North American Monsoon System and the incidence of tropical cyclones ([48]).
The vegetation communities in the MRB are distributed along the altitudinal gradient between the coast and the mountains and include coastal dunes, mangrove thickets, mesquite scrub, riparian vegetation, tropical low deciduous forest, induced grassland, and in the higher elevations, oak and pine forests ([26]). According to gauge records of the hydrometric station number 9067 San Bernardo (27° 24′ 45″ N, 108° 52′ 54.84″ W) from the years 1960 to 2014, the mean annual volume of the Mayo River was 946 million m3. The runoff from the river is retained by the Adolfo Ruiz Cortines (Mocúzari) Dam built between 1952 and 1955 to regulate river flow ([10]).
Data aquisition
The runoff volumes were obtained from the San Bernardo hydrometric station, located upstream from the Adolfo Ruiz Cortines Dam; there are more hydrometric stations inside the MRB watershed, but the San Bernardo hydrometric station was selected because it has complete data from 1960 to 2014, and the location is near the natural flow of the Mayo River for more accurate reconstruction.
The dendrochronological series for the MRB were downloaded from the International Tree-Ring Data Bank (⇒ http://gis.ncdc.noaa.gov/kml/paleo_tree.kmz - [36]). The series are located within the limits of the MRB or nearby basins, represent the species Pseudotsuga menziesii (Mirb.) and Pinus arizonica (Engelm.), and have standard (std), residual (res), and arstan (ars) versions of each series (Fig. 1).
To obtain a regional series representative of the dominant climate conditions in the basin, we used principal components analysis (PCA) for the four dendrochronological series ([18]). The analysis was performed for all versions of the series (std, res, and ars) and the best version (according to PCS results) was selected in order to reflect the variability of the climatic response.
The mean temperature (°C) and precipitation (mm per month) values were downloaded from the NLDAS-2 model as National Oceanic and Atmospheric Administration meteorological data in gridded binary format, which is based on a numerical meteorological prediction model of the Global Forecast System. The spatial resolution of the data is 0.125° and covers the years 1979 to the present. However, the spatial extent of the data is limited and only covers a part of northern Mexico that includes the MRB.
The climate variables of the NLDAS-2 model were downloaded in gridded binary format and the monthly data were extracted using ArcGIS® ver. 10.3 (ESRI, Redlands, CA, USA). The mean monthly precipitation and temperature values were overlaid onto the layer with the study area and the pixels converted to points (vector) to generate a grid and extract the data.
Climatic response analysis
The association of the variables runoff, precipitation, and temperature was established by simple correlations ([18]) and a transference equation was made for the total number of years (55) with available runoff volume data. The results of these analyses were used to develop dendroclimatic reconstruction throughout the entire dendrochronological series, and similarly, a spectral analysis of the reconstructed series was made to identify significant peaks, interpreted as dominant frequencies due to atmospheric circulation phenomena ([52]). Analyses were made with the software R ver. 3.4 using the “dplR” time series analysis library ([4]).
Hydrological drought analysis
The analysis of drought severity was made using the median hydrological reconstructions of the Mayo River (50% probability of occurrence), considering dry years as those with runoff values below the median. From the hydrological perspective, there are two parameters for categorizing droughts, their duration and their severity ([2]).
The duration of drought (D) is the consecutive number of years below the median, given by (eqn. 1):
where ti (adimensional) is the year with water below of the median, i (adimensional) is the number of years index, and n (adimensional) is the number of years with record. The severity (S) is the shortfall volume accumulated in the drought period (103 m3) calculated as (eqn. 2):
where Xi (103 m3) is the contribution of water in the year i, and Xm (103 m3) is the median contribution of water. Based on drought severity, the occurrence in a basin of consecutive periods of dry events can be defined as extraordinary hydrological droughts, thus establishing the concept of relative severity (Sr), by which droughts can be classified into light (0.01-0.25), intense (0.26-0.99), and extraordinary (1.0) according to Ortega-Gaucin ([38]) as follows (eqn. 3):
where Sj (103 m3) is the drought severity, j (adimensional) is the drought index and Smax (103 m3) is the maximum severity.
Influence of general atmospheric circulatory patterns and drought index analysis
The resulting reconstruction was associated with general atmospheric circulation phenomena by comparing it to the El Niño-Southern Oscillation (ENSO) index through the Southern Oscillation Index (SOI - [43]) - the ENSO having more effects in the study region during the winter ([8]) - to determine its influence in the region’s hydroclimatic variability. The above-mentioned association was also made with the Pacific Decadal Oscillation (PDO) index ([33]).
The reconstructed dendrochronological series were correlated with drought indices to understand how historic data influenced meteorological variables in the series. The indices used were obtained from the North American Drought Atlas self-calibrated Palmer Drought Severity Index (scPDSI, instrumental summer calibration - [12]) and the Standardized Precipitation Evapotranspiration Index (SPEI obtained from ⇒ http://spei.csic.es/map/maps.html#months=1%23month=2%23year=2018 ([50]).
Significant associations of global atmospheric circulation phenomena were determined by spectral wavelet coherence analysis using the biwavelet library of the “dplR” package in R ([46]).
Results and discussion
Dendrochronological series
The dendrochronological series available for the MRB were generated from the species Pseudotsuga menziesii and Pinus arizonica, both displaying conspicuous earlywood and latewood growth bands of std, res, and ars versions (Tab. 1).
Tab. 1 - Dendrochronological series in the Mayo River Basin. (RW): RW ring width; (EW): earlywood; (LW): latewood.
| No. | Site | Code | Period (no. of years) |
Species | Chronology type |
|---|---|---|---|---|---|
| 1 | Barrancas del Cobre | COB | 1644-2014 (371) | Pinus arizonica | RW, EW, LW |
| 2 | Bisaloachic | BIS | 1537-2002 (466) | Pseudotsuga menziesii | RW, EW, LW |
| 3 | Cebadillas de Ocampo | CDO | 1588-2002 (415) | Pseudotsuga menzisii | RW, EW, LW |
| 4 | Tutuaca | TUT | 1534-2012 (479) | Pseudotsuga menzisii | RW, EW, LW |
Considering the common period (years where all series data overlap in time: 1644-2002, i.e., 359 years) of the ring-width series (stdRW), similarities in interannual variation suggesting the same climatic signal were observed in the highly coincidental years of 1653, 1696, 1716, 1727, 1742, 1772, 1785, 1798, 1815, 1820, 1887, 1904, 1905, 1952, 1968, and 1974 (Fig. 2a).
Fig. 2 - (a) Dendrochronological series of stdRW. (b) Correlation matrix between the four dendrochronological series.
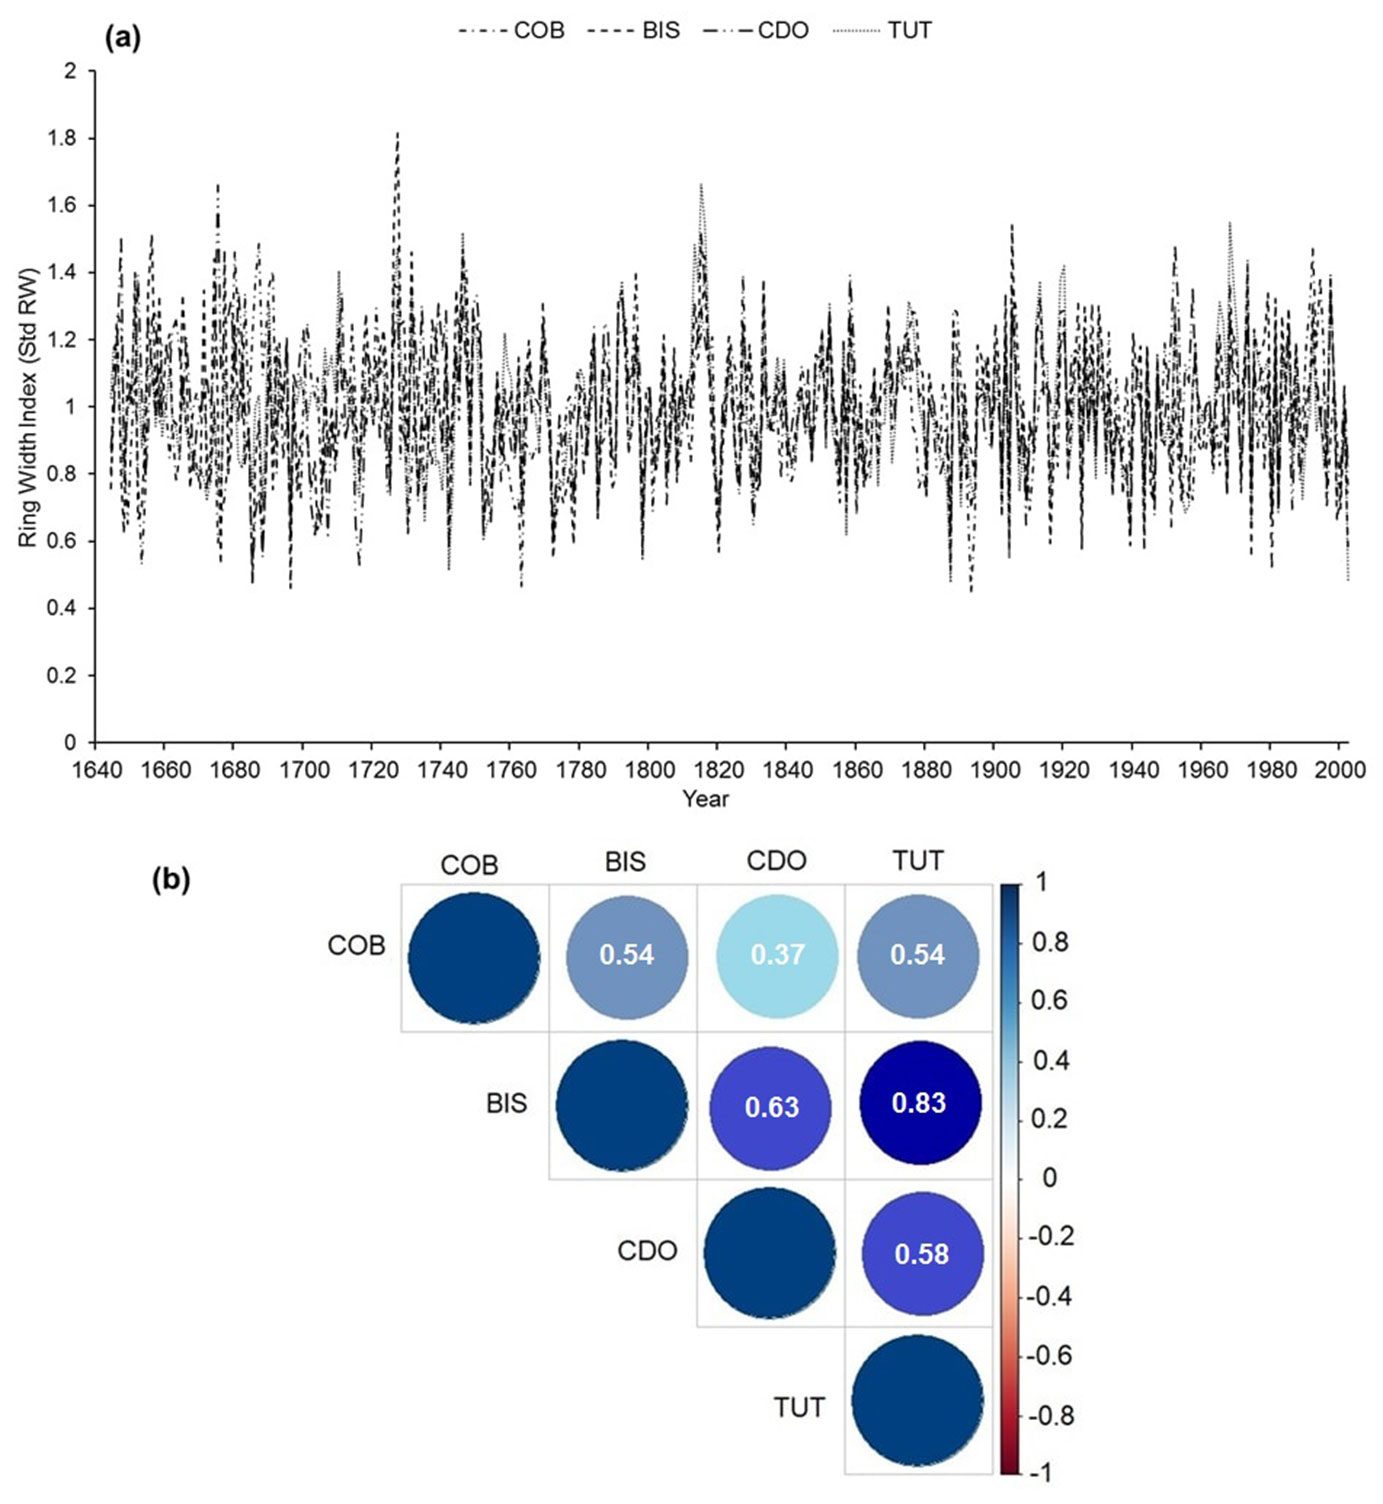
According to the matrix correlation analysis of the four series, the highest and more significant (p < 0.05) associations were found between the sites Bisaloachic (BIS) and Tutuaca (TUT - r = 0.83) separated by 10 km, followed by that between Cebadillas de Ocampo (CDO) and BIS (r = 0.63), separated by 62 km, while the lowest correlation was found between the Barrancas del Cobre (COB) and CDO (r = 0.36) series, separated by 50 km (Fig. 2b).
Principal component analysis
To obtain a climatic series that was representative of the MRB over the four dendrochronological series (BIS, COB, CDO, and TUT), PCA was used for the 359-year common period (Fig. S1 in Supplementary material). The PCA showed the stdRW value of the COB series in the first component (PC1) explained 66.21% of the total variance (p < 0.05), and the BIS, CDO, and TUT series in the second component (PC2) accounted for 14.25% of the variance. This result indicates that the COB series responds to a different aspect of climate, thus it is useful to represent the MRB climate variability. Therefore, the COB series was correlated with the climatic and hydrometric data for the analysis of the response function with precipitation and temperature and used for the reconstruction of runoff.
Climatic response analysis
The response function graph (Fig. 3) shows an association between the chronology of the stdRW at the COB site and climate variables precipitation and temperature. The chronology responded positively and significantly (p < 0.05) to precipitation in June, November, and December of the year previous to growth, and January and February of the year of growth, while a negative and significant response (p < 0.05) was observed with temperature of all months except December of the previous year, and October of the year of growth. We used the stdRW because it was the version that had a better response with the climate data, compared to the other versions (res and ars).
Fig. 3 - Climatic response between the dendrochronological serie COB standard version and the precipitation and temperature records. The values out of the horizontal dotted lines are significant (95%).
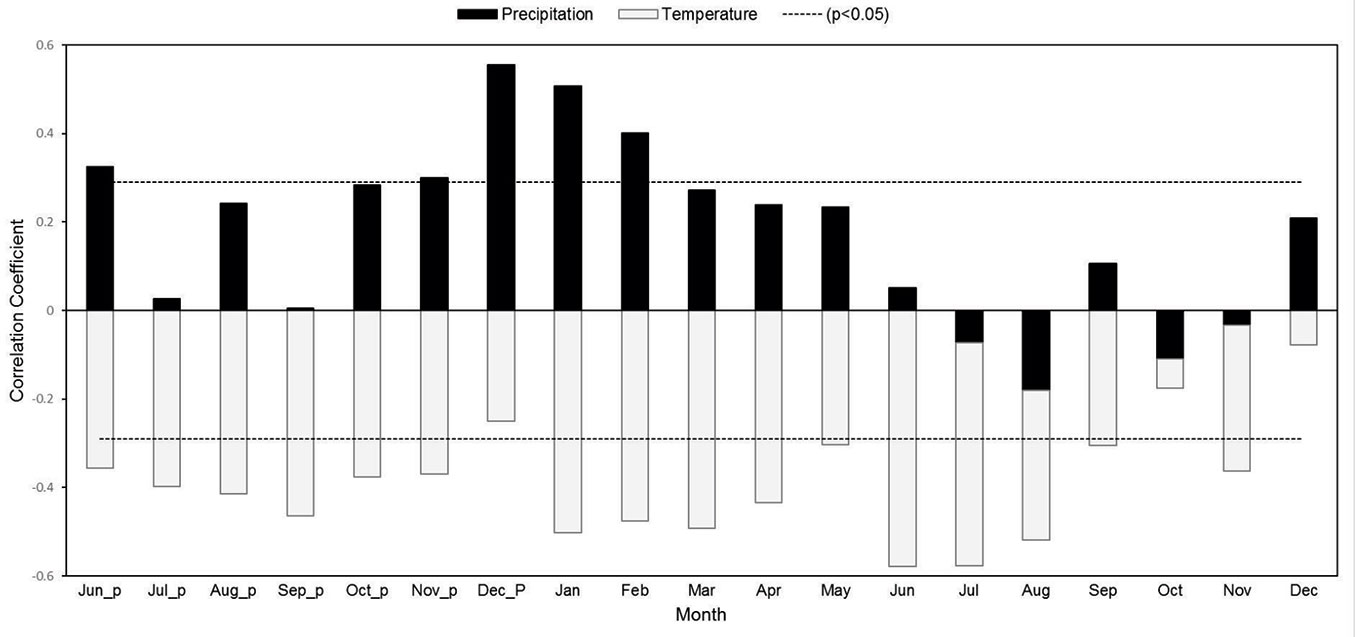
The correlation between stdRW in site COB and the monthly and seasonal records of mean temperature of the NLDAS-2 model was significant for all months, but weak in December of the previous year, and October and December of the year of growth. The best correlation was for the January-July seasonal period (r = -0.75, n = 36, p < 0.05), which explained 56.2% of the total seasonal variation. A negative correlation suggests that at a higher temperature there was less annual radial growth of Pinus arizonica and vice versa (Fig. 3).
This response is common to many forest tree species, in particular those susceptible of water stress ([1]). The high temperatures during that period caused a physiological response in trees by reducing stomatal opening, thereby affecting transpiration and CO2 diffusion and reducing the assimilation of photosynthates ([29]). According the location of the analyzed series, the forest of the Sierra Madre Occidental have a clear Holartic origin, for that the reason they have more appropriate adaptations to cold temperatures in the MRB ([13]).
A significant association was observed between the accumulated monthly precipitation and the standard earlywood chronology of the COB site for the months of June, November, and December of the previous year and February of the year of growth (Fig. 3), and seasonally, for the period from October of the previous year to May of the year of growth (r = 0.70, n = 35, p < 0.05).
The significant response to winter precipitation with earlywood growth is influenced by the warm phase of the ENSO ([43], [31]), particularly for the populations of conifers in the Sierra Madre Occidental ([43], [8]) where the Mayo River is born.
As it is characteristic in northern Mexico, the winter precipitation in the MRB is one fourth of the total annual volume. The winter season has a high interannual variability, although the presence of north winds favors winter rain and lowers the temperature in the Sonora region by increasing the incursion of polar air masses ([27]). The response of ring-width to winter precipitation has been amply documented by several paleoclimatic studies ([8], [37]).
Runoff volume response analysis
The data of runoff volume (in thousands of square meters) recorded by the San Bernardo hydrometric station was normalized through a log-normal transformation and compared with the earlywood series (stdEW) to improve its correlation ([3]). The highest correlation (r = 0.74, p < 0.05, n = 54) was found from October of the previous year to May of the year of growth (Fig. S2 in Supplementary material). The Durbin-Watson value 1.748 (p < 0.05) suggests no significant first-order autocorrelation in the residuals of the model ([18]).
This seasonal association at the end of the North American Monsoon System (NAMS - [23]) is related to the saturated condition of moisture in the soil profile caused by surface runoff after rainfall and water is available for the trees until the next growth phase ([35]). This high association is related to ENSO, specifically with the El Niño phase that impacts northern Mexico by bringing seasonal precipitation ([55]).
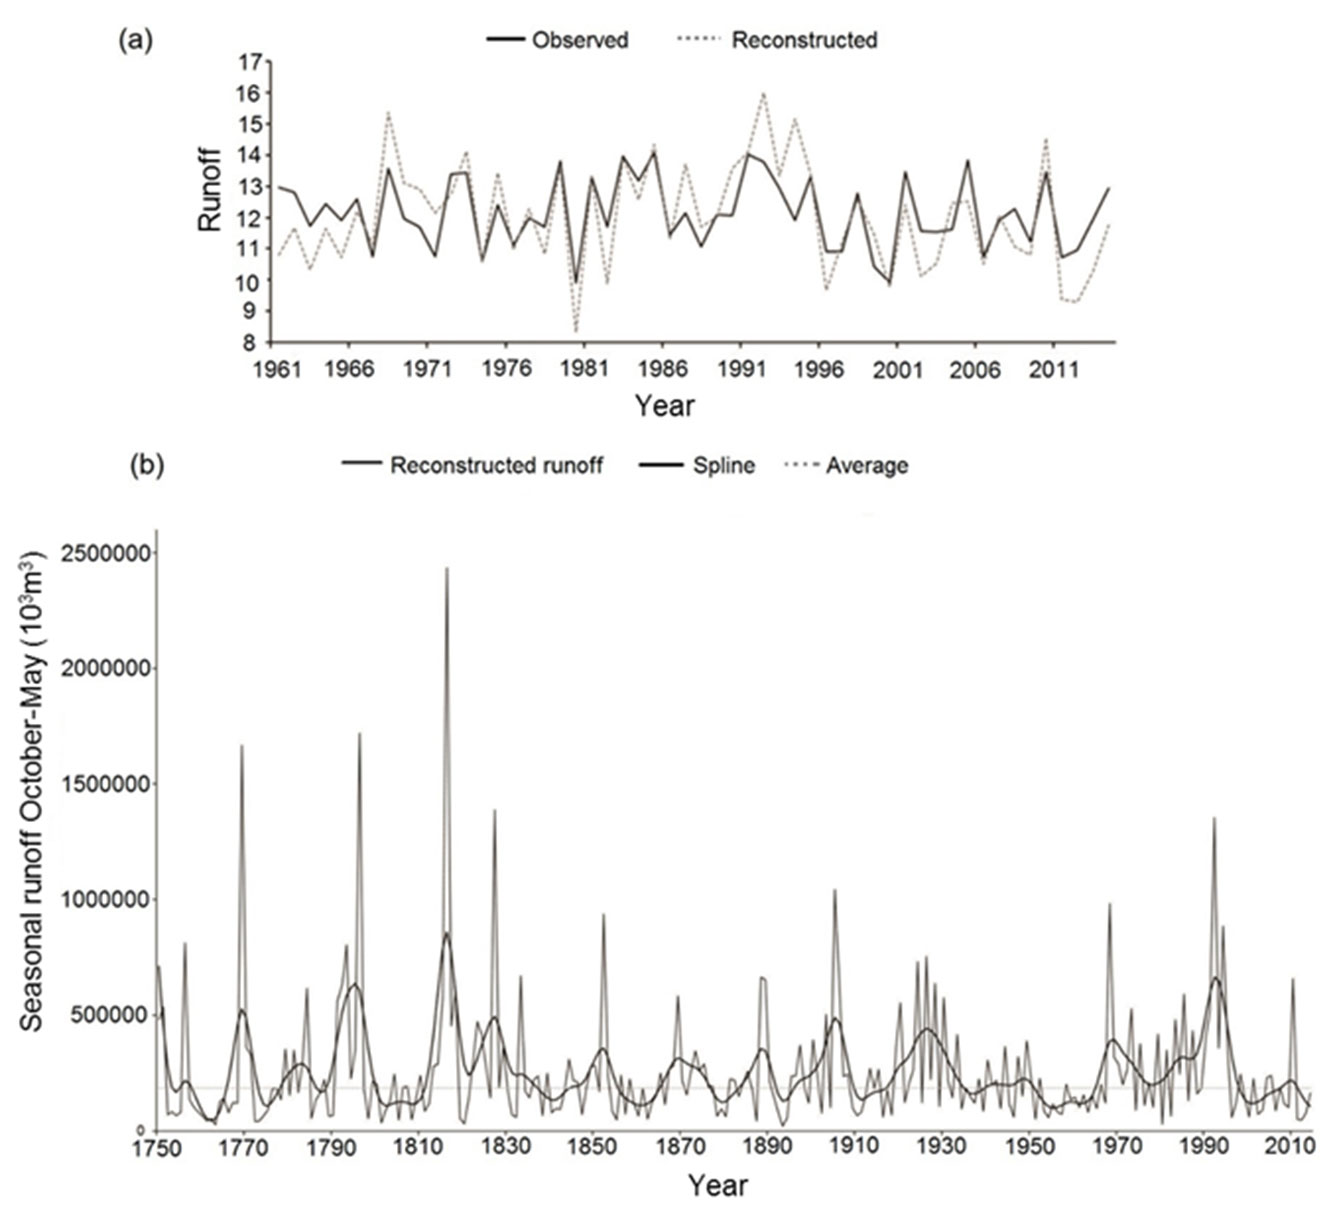
Fig. 4 - (a) Observed records at the hydrometric station in San Bernardo versus the reconstructed runoff. (b) Runoff volume reconstructed for the Mayo River from November of previous year to April of the current year of growth.
Tab. 2 - Validation of the seasonal runoff volume reconstruction model by comparison of the observed dataset and the reconstructed dataset based on tree-ring series. (1): No significance test is available for this statistics, but any positive result indicates that the reconstruction contributes unique paleoclimatic information ([18]); (2): first difference between the observed and the reconstructed data [t - (t-1)], the transformation removes the trends that may affect the correlation coefficient ([18]); (*): p < 0.05.
| Statistics | Period | |
|---|---|---|
| 1961-1987 | 1988-2014 | |
| Pearson’s correlation | 0.75 * | 0.73 * |
| Reduction of error (1) | 0.81 | -0.07 |
| t-test value | 3.11 * | 3.84 * |
| Non-parametric signs test | 7 * | 5 * |
| First negative difference (2) | 1 * | 7 * |
To validate the resulting reconstruction model, the recorded runoff data were divided into two sub-periods, one used for calibration (1961-1987), and another one for verification (1988-2014) using the “verify” subroutine of the Dendrochronological Program library ([24] - Fig. 4a). Because both verified sub-periods were significant for all parameters (Pearson correlation, reduction of the error, t-value, signs test and first negative difference - Tab. 2), the total period of available records (1961-2014) was used to generate the reconstruction model as follows (eqn. 4):
where Y (natural algorithmic) is the runoff volume for the seasonal period November-April and X is the stdEW index for a specific year.
Because the reconstruction was made by normalizing the runoff volumes (the antilogarithm was used to transform the values to 103 m3), a reconstruction that showed extraordinary values present from 1664 to 1749 may not reflect true conditions because of the reduced number of growth cores in that period. Therefore, the reconstruction was limited to the 265-year period between 1750 and 2014, during which the expressed population signal value was 0.85 (Fig. 4b).
The reconstruction showed high interannual and multiannual variation and periods of extraordinary drought were observed with flow volumes under one half of the mean standard deviation of the median (S2 · 0.5 = 140.353 · 103 m3) in the years 1763, 1772-1773, 1801, 1820, 1855, 1887, 1893, 1980, and 2012. The 1951-1967 period was remarkable as it shows 17 consecutive years of minimal runoff values (despite that 1951 was the only year with values significantly below the median) that generated a minimal flow in the Mayo River. The 1951-1967 event is considered to have had national impact, in particular in northern Mexico ([44]) and is similar to another event that occurred in 1890, also considered as an event of national scale ([45]). In contrast, extraordinary wet events occurred in the years 1750-1751, 1756, 1765, 1769-1771, 1779, 1781, 1791-1793, 1815-1818, 1823-1824, 1827, 1829, 1833, 1852, 1869, 1873, 1888-1889, 1897, 1900, 1903, 1905-1906, 1919-1920, 1924, 1926, 1928, 1930, 1933, 1944, 1949, 1968, 1973, 1975, 1979, 1981, 1983, 1985, 1987, 1990-1995, and 2010, of which 1769, 1796, 1816, and 1992 were noticeable for having maximum runoff flows that have been related to the ENSO warm phase ([32]), which favors above-average winter precipitation, as it occurred in our reconstruction for the MRB.
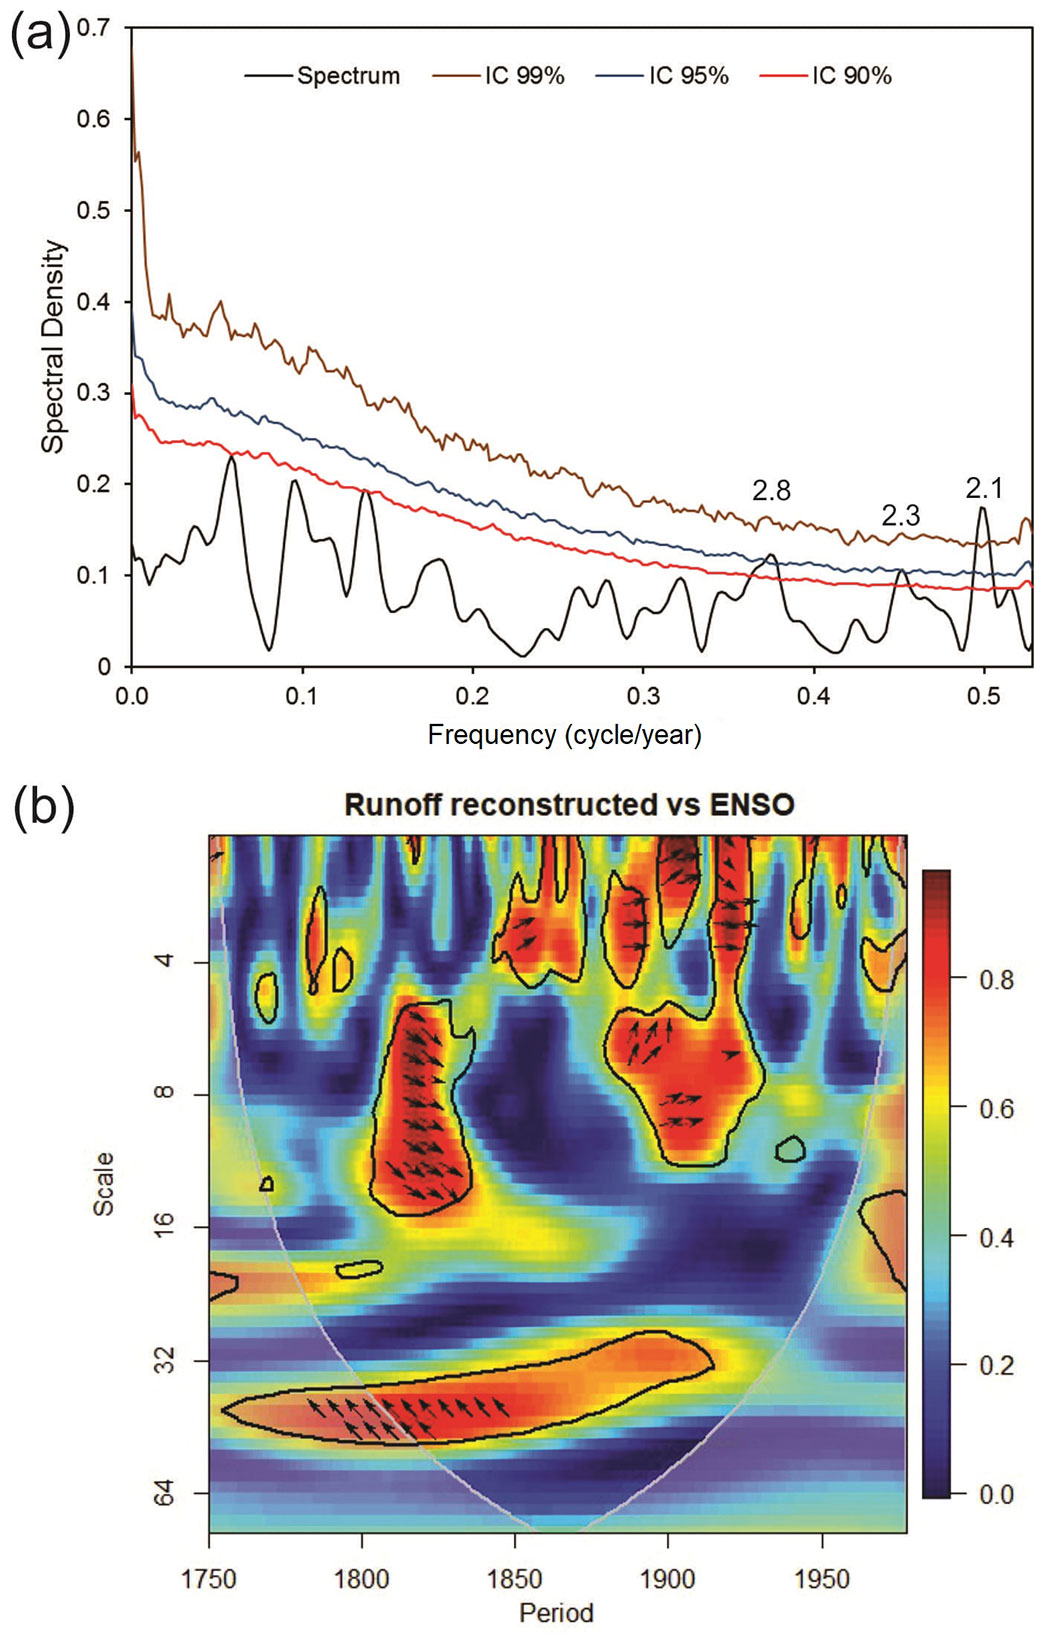
The spectral analysis showed significant (p < 0.05) frequencies of 2.1, 2.3, and 2.8 years in the earlywood series of the COB site (Fig. 5a) corresponding to the ENSO frequency occurring at 3-7 years ([45]). The results of the analysis of drought severity in the MRB (Tab. 3) showed significant events below the median (184,373.67 · 103 m3), one categorized as extraordinary and the rest as intense, among which periods of five or more consecutive years of low runoff were noticeable, such as the seven-year hydrological drought between 1959 and 1965, and the 12-year extraordinary drought period between 1757 and 1768 ([44]).
Fig. 5 - (a) Spectral analysis of early wood series. (b) Wavelet coherence analysis between seasonal runoff volume reconstructed and ENSO index.
Tab. 3 - Hydrological drought events for the runoff volume reconstruction in the Mayo River Basin.
| Period | Duration (No. years) |
Severity (× 103 m3) |
Relative Severity |
Type of Drought |
|---|---|---|---|---|
| 1752 - 1755 | 4 | -437,602.87 | 0.39 | Intense |
| 1840 - 1843 | 4 | -295,973.61 | 0.27 | Intense |
| 1891 - 1894 | 4 | -438,377.06 | 0.40 | Intense |
| 1909 - 1912 | 4 | -335,209.08 | 0.30 | Intense |
| 2011 - 2014 | 4 | -397,945.93 | 0.36 | Intense |
| 1772 - 1776 | 5 | -499,780.22 | 0.45 | Intense |
| 1953 - 1957 | 5 | -507,516.29 | 0.46 | Intense |
| 1959 - 1965 | 7 | -421,794.46 | 0.38 | Intense |
| 1757 - 1768 | 12 | -1,109,510.97 | 1.00 | Extraordinary |
Among the associations with different indices of general atmospheric circulation (ENSO, PDO) and drought severity (PDSI, SPEI - Tab. 4, Fig. S3), SOI was negative and significant (r = -0.42, n = 228, p < 0.05), and PDO was low but not significant (r = 0.16, n = 115, p = 0.073). This result corroborates what was observed in the spectral analysis because the latter phenomenon is characterized by high frequencies of up to 20-25 consecutive years ([33]). Climate studies indicate that the influence of the NAMS in the Sonora region is weak during El Niño summers, but higher during the winter in the warm phases of ENSO, which generates higher runoff volumes ([22]).
Tab. 4 - Association between general atmospheric circulation phenomena, drought index and reconstructed runoff volume. (SOI): Southern Oscillation Index reconstructed ([43]); (PDO): Pacific Decadal Oscillation ([33]); (PDSI): Palmer Drought Severity Index ([12]); (SPEI): Standardized Precipitation-Evapotranspiration Index ([50]); (r): Pearson’s correlation coefficient between the annual runoff for the seasonal period November-April and the index of general atmospheric circulation phenomena; (*): p<0.05; (ns): not significant.
| Index | Period (years) | r (p-value) |
|---|---|---|
| SOI | 1750-1977 (228) | -0.42 (0.000*) |
| PDO | 1900-2014 (115) | 0.16 (0.073 ns) |
| PDSI | 1750-2002 (253) | 0.56 (0.000*) |
| SPEI | 1951-2009 (59) | 0.41 (0.001*) |
A significant association between drought severity indices and the winter flow volumes was observed for the analyzed periods. Because the correlations found between PDSI (r = 0.56, n = 253, p < 0.05) and SPEI (r = 0.41, n = 59, p < 0.05; an index associated with drought based on precipitation and evapotranspiration - [51]), the latter result suggests the runoff volumes accumulated in the Mayo River during the winter are indicators of the hydrological drought conditions possible in the basin during the summer.
The results of the wavelet coherence analysis between the reconstruction of winter runoff volumes and the ENSO series index during the 1750-1978 period (Fig. 5b) showed significant (p < 0.05) associations (red spots) with events in phase (arrows to the right) and out of phase (arrows to the left), such as in the periods 1750-1760 with frequencies of 1-2 years, 1800-1820 with frequencies of 6-16 years, and in-phase events that favor higher winter precipitation and therefore higher runoff volumes in the MRB ([39]). Climate studies have shown that the ENSO significantly modulates winter precipitation in northern Mexico ([43], [32]), which is reflected in the growth of earlywood and ring-width of tree species from the Sierra Madre Occidental, as it was evident in our reconstructions of precipitation and runoff in this region of the country ([53]).
The drought events recorded in the MRB are coincident with episodes recorded for most of northern and central Mexico, having variable intensity between regions, which conforms to the idea that climate is strongly modulated by common climate phenomena with a periodicity of droughts of approximately 50-60 years ([47]).
The decade of the 1950s had several years of below average observed and reconstructed runoff, and was characterized by several strong La Niña events. This decade presented a negative phase of PDO ([14]) due a cooling in the Pacific Ocean ([33]), which can enhance the La Niña effect through the interaction between both phenomena ([21]). A La Niña event causes storm tracks to move northwards, leaving Mexico and the United States of America (USA) in dry conditions ([42]), and this impacts NAMS rainfall production in the summer ([5]).
The relationship between PDO and reconstructed runoff presented a lesser but still significant correlation than the ENSO, which means the PDO affects the runoff and the precipitation in the MRB. As seen in other studies, the positive warm phase of PDO increases the winter rainfall in northern Mexico and southwestern USA ([40]), and it is associated with positive sea surface temperature anomalies across the central and eastern Tropical Pacific. According to Easterbrook ([16]), the warm (positive) phase of PDO was from 1915 to 1945 and from 1977 to 1998; however, our reconstruction showed the warm phase of POD occurred in 8 separate years between 1919 and 1934, and 11 years between 1978 and 1995, producing extraordinary wet events in the MRB.
The NAMS is the atmospheric circulation phenomenon that favors summer rains between the months of June and July, sometimes extending to September, generating a convergence of warm and humid air from the Pacific Ocean and the Gulf of Mexico. The arrival of these converging currents propagate about 75% of the annual precipitation on the windward slope of the Sierra Madre Occidental, but the interannual variability of precipitation is of lesser magnitude ([15]). In this study, we found no significant (p < 0.05) correlation of runoff volumes with the summer season, which can be due to most of the precipitation occurring when the annual growth is almost over, or to the intensity of these rains (often being torrential) surpassing the soil’s capacity for infiltration and therefore generating excess runoff that is used by the trees ([19]).
In the MRB, the contribution of rainfall from the influence of tropical cyclones and hurricanes generated in the Pacific Ocean - with maximum activity recorded in September and October - appears to be the main cause of the reconstructed high volumes of runoff during years in which tropical cyclones occurred, such as 1971 (Storm Katrina), 1977 (Hurricane Doreen), 1979 (Typhoon Tip), and 2001 (Hurricane Juliette - [6]). According to climatological studies of the ENSO phenomenon, it influences the periodicity of tropical cyclones in the Atlantic Ocean but does not seem to affect their frequency in the Pacific Ocean, where the historical occurrence is 15.2 cyclones per year ([31]).
Conclusions
The results from our study determined associations between earlywood growth response and records of precipitation and temperature. We observed significant correlation between precipitation from October to April and the standardized earlywood series in COB; that is, earlywood growth responds to the water from winter rainfall that is stored in the soil. Also, we found a significant negative correlation between the standardized ring width and the mean monthly temperature between January and July, meaning that higher mean monthly temperatures inhibit annual radial growth. This result is also shown in other studies around the world where the rise in temperature due to global warming reduces growth. The reconstruction of seasonal runoff from October to May in the MRB spanned the years 1750-2014 and indicated the occurrence of extraordinary drought that had not been recorded in the instrumental records, which cover the last 55 years only.
The climate change trend might exacerbate the availability of water in the MRB, which would have severe social and economic impacts. it is therefore advisable to establish management plans that take into consideration the occurrence of long severe droughts not evidenced by meteorological records but observed in historical reconstructions. Broad-impact climate phenomena like ENSO and NAMS have a strong influence on water availability in northern Mexico. Although we found no significant correlation between the dendrochronological series and the NAMS, summer precipitation produces the highest runoffs in this region of Mexico and is responsible for dam filling. While the winter runoff accounts for only 25% of the total annual volume, winter rain is highly significant in the radial growth of trees and allows the analysis of the significant influence of the association with the ENSO, considered as better defined in North America.
The use of modern technologies to access climate information represents a high-resolution alternative to obtain climate variable series through the use of assimilated data, as in the specific case of the NLDAS-2. Using such technology, we were able to establish that the earlywood series are significantly correlated to the winter-spring seasonal precipitation, making it possible to model and predict volumes of biomass that could be produced by forests.
The use of assimilated data is still in the initial stages in Mexico and its broader application could, in the short term, allow the production of better prediction models using the available dendrochronological series, and the development of more reliable hydroclimatological reconstructions, which can help to achieve a more sustainable management of forest resources and of the runoff volumes generated in basins, which are essential for food production in this region of northern Mexico.
Acknowledgments
This study was carried out through funds provided by CONACyT (Consejo Nacional de Ciencia y Tecnología, DF, Mexico), with the project 283134 “Red dendrocronológica mexicana: aplicaciones hidroclimáticas y ecológicas”.
References
CrossRef | Gscholar
Online | Gscholar
Online | Gscholar
CrossRef | Gscholar
Online | Gscholar
CrossRef | Gscholar
CrossRef | Gscholar
CrossRef | Gscholar
CrossRef | Gscholar
Authors’ Info
Authors’ Affiliation
Universidad Juárez del Estado de Durango, Facultad de Agricultura y Zootecnia, km 30 Carretera Gómez Palacio a Tlahualilo, 35000 Gómez Palacio, Durango (México)
Juan Estrada-Ávalos 0000-0001-5345-459X
Instituto Nacional de Investigaciones Forestales, Agrícolas y Pecuarias, Centro Nacional de Investigación Disciplinaria en Relación Agua, Suelo, Planta y Atmósfera, km. 6.5 Margen Derecha Canal de Sacramento, 35150 Gómez Palacio, Durango (México)
Corresponding author
Paper Info
Citation
Martínez-Sifuentes AR, Villanueva-Díaz J, Estrada-Ávalos J (2020). Runoff reconstruction and climatic influence with tree rings, in the Mayo river basin, Sonora, Mexico. iForest 13: 98-106. - doi: 10.3832/ifor3190-013
Academic Editor
Carlotta Ferrara
Paper history
Received: Jul 10, 2019
Accepted: Jan 08, 2020
First online: Mar 11, 2020
Publication Date: Apr 30, 2020
Publication Time: 2.10 months
Copyright Information
© SISEF - The Italian Society of Silviculture and Forest Ecology 2020
Open Access
This article is distributed under the terms of the Creative Commons Attribution-Non Commercial 4.0 International (https://creativecommons.org/licenses/by-nc/4.0/), which permits unrestricted use, distribution, and reproduction in any medium, provided you give appropriate credit to the original author(s) and the source, provide a link to the Creative Commons license, and indicate if changes were made.

Web Metrics
Breakdown by View Type
Article Usage
Total Article Views: 43843
(from publication date up to now)
Breakdown by View Type
HTML Page Views: 35632
Abstract Page Views: 3392
PDF Downloads: 3947
Citation/Reference Downloads: 2
XML Downloads: 870
Web Metrics
Days since publication: 2295
Overall contacts: 43843
Avg. contacts per week: 133.73
Article Citations
Article citations are based on data periodically collected from the Clarivate Web of Science web site
(last update: Mar 2025)
Total number of cites (since 2020): 12
Average cites per year: 2.00
Publication Metrics
by Dimensions ©
Articles citing this article
List of the papers citing this article based on CrossRef Cited-by.
Related Contents
iForest Similar Articles
Research Articles
Response to climate and influence of ocean-atmosphere phenomena on annual radial increments of Pinus oocarpa Schiede ex Schltdl. & Cham in the Lagunas de Montebello National Park, Chiapas, Mexico
vol. 16, pp. 174-181 (online: 30 June 2023)
Short Communications
Climate effects on growth differ according to height and diameter along the stem in Pinus pinaster Ait.
vol. 11, pp. 237-242 (online: 12 March 2018)
Research Articles
The effect of provenance of historical timber on tree-ring based temperature reconstructions in the Western Central Alps
vol. 13, pp. 351-359 (online: 25 August 2020)
Research Articles
Influence of tree density on climate-growth relationships in a Pinus pinaster Ait. forest in the northern mountains of Sardinia (Italy)
vol. 8, pp. 456-463 (online: 19 October 2014)
Research Articles
Contrasting resin-tapped and untapped Pinus pinaster Ait. trees of central Spain in a dendroclimatic research
vol. 17, pp. 148-155 (online: 30 May 2024)
Research Articles
Climatic fluctuations trigger false ring occurrence and radial-growth variation in teak (Tectona grandis L.f.)
vol. 9, pp. 286-293 (online: 28 September 2015)
Research Articles
The effects of fire on Pinus sylvestris L. as determined by dendroecological analysis (Sierra de Gredos, Spain)
vol. 15, pp. 171-178 (online: 09 May 2022)
Research Articles
Role of photosynthesis and stomatal conductance on the long-term rising of intrinsic water use efficiency in dominant trees in three old-growth forests in Bosnia-Herzegovina and Montenegro
vol. 14, pp. 53-60 (online: 28 January 2021)
Research Articles
Impact of climate change on radial growth of Siberian spruce and Scots pine in North-western Russia
vol. 1, pp. 13-21 (online: 28 February 2008)
Research Articles
Historical fire ecology and its effect on vegetation dynamics of the Lagunas de Montebello National Park, Chiapas, México
vol. 14, pp. 548-559 (online: 01 December 2021)
iForest Database Search
Search By Author
Search By Keyword
Google Scholar Search
Citing Articles
Search By Author
Search By Keywords
PubMed Search
Search By Author
Search By Keyword


