First vs. second rotation of a poplar short rotation coppice: leaf area development, light interception and radiation use efficiency
iForest - Biogeosciences and Forestry, Volume 8, Issue 5, Pages 565-573 (2015)
doi: https://doi.org/10.3832/ifor1457-008
Published: Apr 27, 2015 - Copyright © 2015 SISEF
Research Articles
Abstract
Given the high expectations for lignocellulosic biomass as one of the potential solutions for energy security and climate change mitigation, commercial scale studies over several rotations are crucial to assess the potential and the sustainability of short rotation coppice (SRC) cultures for bioenergy. The first and the second rotation of the SRC poplar (Populus) plantation of the present study differed significantly in biomass yield and in productivity determinants and their relationships. Coppicing enhanced leaf area development, radiation interception and woody biomass productivity. High total leaf area and radiation use efficiency (RUE) equally contributed to the high biomass yield during the establishment rotation, while RUE became the most important determinant of biomass yield after coppice. The study confirmed the significant genotypic variation in biomass productivity and its underlying determinants, also among more recently selected poplar genotypes. The absence of a correlation between intercepted radiation and RUE suggests the potential of selecting for genotypes combining high total leaf area and photosynthetic carbon uptake in future breeding programs for yield maximization towards sustainable bioenergy cultivation.
Keywords
Genotypic Variation, Leaf Area Index, Aboveground Woody Biomass Productivity, Bioenergy, Populus, POPFULL
Introduction
Energy security and greenhouse gas emission reductions are major challenges to meet the global energy demand and to mitigate climate change ([30]). In the light of these global concerns bioenergy could play a crucial role to achieve the EU’s energy and climate targets ([23]). The cultivation of lignocellulosic biomass, mostly poplar and willow in short rotation coppice (SRC) systems, has a high potential for the production of renewable electricity and the generation of “green” heat ([24]). Despite the long-term experience with the commercial production in northern Europe ([46], [32]), the implementation of SRC as a renewable energy crop is limited in European agriculture ([1], [20], [21]).
Productivity is determined by light interception and by the efficiency of converting the intercepted radiation into biomass, i.e., the radiation use efficiency (RUE), as reported for both herbaceous ([50]) and woody (tree) species ([13], [39]). The crop’s capacity to intercept radiation is determined by its photosynthetic area, generally assessed via the leaf area index (LAI), which is linearly related to the biomass production in poplar and willow plantations ([34], [13], [51]). In SRC systems, faster canopy closure and increased growth rates of sprouts from an established root system result in enhanced productivity of coppiced versus non-coppiced tree stands ([16]). Substantial genotypic variation exists in aboveground woody biomass productivity (AGWB) of SRC cultures in poplar ([15], [19], [41], [3]). Variation in AGWB has been explained by variation in light interception, in biomass allocation, in leaf physiological factors related to RUE or in a combination of the aforementioned ([13], [26], [52]), suggesting inconclusive results on the relative importance of productivity determining factors in SRC. The quantification of genetic diversity and of genetic control contributes to future tree improvement and to yield maximization efforts towards sustainable bioenergy cultivation.
In the present study, we analyzed the leaf area development, light interception and RUE of 12 poplar genotypes in a high-density SRC culture, before and after the first coppice of an experimental plantation. Assessment of LAI and woody biomass productivity was performed in a single versus a multi-stem culture, to analyze the effect of coppicing. We hypothesized significant genotypic, parentage and provenance variation in LAI, in leaf area duration (LAD), in RUE, in intercepted radiation (Iint) and AGWB. The objectives of this study were: (i) to determine the main differences between the first (R1) and the second rotation (R2) in the above mentioned parameters and in their relationships, i.e., before and after coppice, and (ii) to determine the relative importance of the variation in LAI, LAD, Iint and RUE in explaining the variation in AGWB during both rotations of two years.
Materials and ethods
Site description
Within the framework of the POPFULL project (⇒ http://uahost.uantwerpen.be/popfull) an 18.4 ha large bio-energy plantation was established in Lochristi (Belgium) in April 2010. The former land use was a combination of agricultural uses, consisting of cropland and extensively grazed pasture. The long-term average annual temperature and precipitation at the site are 9.5 °C and 726 mm, respectively. Meteorological parameters as air temperature, precipitation, incident solar radiation, etc. were recorded half-hourly from a meteorological station located within the plantation’s boundary. Soil analyses prior to planting characterized the soil as sandy with deeper clay layers. An area of 14.5 ha was planted with dormant hardwood cuttings at a density of 8000 ha-1. A double-row design was used, with alternating distances of 0.75 and 1.50 m between the rows and 1.1 m between the individual trees within the row. No irrigation or fertilization was applied. The plantation was monitored during two consecutive rotations of two years (2 + 2). A first harvest was performed in February 2012, creating a multi-stem coppice culture, and a second harvest was performed in February 2014. Only after the first harvest a chemical treatment was applied in the spring to reduce the impact of poplar beetles on the young leaves of the resprouts. Pathogen attacks or other biotic influences were not monitored, but no significant impacts of pests or diseases were noticed during the four years of the study. More detailed information on site and soil characteristics, as well as on plantation management can be found in Broeckx et al. ([6]) and Verlinden et al. ([55]).
Twelve selected poplar (Populus) genotypes, all commercially available, were planted in large monoclonal blocks of eight double-rows wide. The replicated blocks covered both former land use types and varied in length between 90 and 340 m. The genotypes represented different species and hybrids of Populus deltoides Bartr. (ex Marsh), P. maximowiczii Henry, P. nigra L. and P. trichocarpa Torr & Gray (ex Hook - Tab. 1).
Tab. 1 - Synoptic description of the twelve poplar (Populus) genotypes planted in the operational short rotation coppice (SRC) plantation of the study. Parentage, place of origin, botanical section, year of the cross and of the commercialization and gender are presented. (D): Populus deltoides; (M): Populus maximowiczii; (N): Populus nigra; (T): Populus trichocarpa. (1): Genotypes produced by the Institute for Nature and Forest Research (INBO, Geraardsbergen, Belgium); (2): genotypes produced by the Research Institute for Forestry and Landscape Planning “De Dorschkamp” (Wageningen, The Netherlands); (3): genotype originating from an open-pollinated P. deltoides tree, first commercialized by the nursery Simon-Louis Frères (Metz, France).
| Genotype | Parentage | Place of origin | Section | Year of cross/ commercialization |
Gender |
|---|---|---|---|---|---|
| Bakan1 | T × M | (Washington US × Oregon US) × Japan | Tacamahaca | 1975/2005 | male |
| Skado1 | T × M | (Washington US × Oregon US) × Japan | Tacamahaca | 1975/2005 | female |
| Muur1 | D × N | (Iowa US × Illinois US) × (Italy × Belgium) | Aigeiros | 1978/1999 | male |
| Oudenberg1 | D × N | (Iowa US × Illinois US) × (Italy × Belgium) | Aigeiros | 1978/1999 | female |
| Vesten1 | D × N | (Iowa US × Illinois US) × (Italy × Belgium) | Aigeiros | 1978/1999 | female |
| Ellert2 | D × N | Michigan US × France | Aigeiros | 1969/1989 | male |
| Hees2 | D × N | Michigan US × France | Aigeiros | 1969/1989 | female |
| Koster2 | D × N | Michigan US × The Netherlands | Aigeiros | 1966/1988 | male |
| Robusta3 | D × N | Eastern US × Europe | Aigeiros | 1885/1890 | male |
| Grimminge1 | D × (T × D) | (Michigan US × Connecticut US) × (Washington US × (Iowa US × Missouri US)) |
Aigeiros × (Tacamahaca × Aigeiros) |
1976/1999 | male |
| Brandaris2 | N | The Netherlands × Italy | Aigeiros | 1964/1976 | male |
| Wolterson2 | N | The Netherlands | Aigeiros | 1960/1976 | female |
Leaf area development
Leaf area development was assessed throughout each of the four growing seasons using regular indirect measurements of the leaf area index (LAI). The LAI-2000 (first growing season, GS1) and LAI-2200 (growing seasons two to four, GS2-4) Plant Canopy Analyzers (LiCor, Lincoln, NE, USA) were used to measure plant area index (PAI), by comparison of above- and below-canopy readings with a 45° view cap. The measurements were performed in 48 (GS1) and 96 (GS2-4) plots, representing two and four replicates respectively per genotype and per former land use type. In each plot, two diagonal transects of four (GS1) and three (GS2-4) readings each, were made crossing the different row distances and representing the different degrees of canopy closure. Along each transect, measurements were taken with the sensor parallel and perpendicular to the row, according to the measurement protocol for row crops described in the instrument instruction manual (LAI-2200, version 1.0).
PAI was converted to LAI, by correcting for the branch area index (BAI). BAI was derived from PAI measurements of the winter status of the trees. Increment of the BAI throughout the growing season was assumed linear, between the start of leaf area development and the end of leaf fall, i.e., the period of leaf expansion. The calculated BAI was subtracted from each corresponding PAI measurement, yielding the effective LAI.
Indirect LAI measurements were validated by direct assessments of seasonal maximum LAI (LAImax). Leaf litter was collected in three 0.57 × 0.39 m litter traps, placed along a diagonal transect in all (GS1) and half (GS2-4) of the measurement plots of the indirect LAI measurements. The litter traps were emptied every two weeks, and leaf dry mass was cumulated for each plot. Specific leaf area (SLA, m2 kg-1), defined as the ratio between fresh leaf area and leaf dry mass, was determined per genotype for each growing season around the time of LAImax ([55]). LAImax was determined from the cumulated dry mass of the leaf litter using the genotype specific SLA. Direct LAImax values were linearly correlated to LAImax reached in the corresponding plots based on indirect LAI measurements.
Leaf area duration (LAD, m2 day m-2) was calculated as the integrated area below the seasonal LAI curve of each plot ([15], [22]). The starting point of the curve, representing the beginning of the growing season, was based on visual phenological observations of bud break, using previously described arbitrary discrete classes ([54], [42]). The end of the growing season was determined by fitting a (non-linear) curve through the gradual collection of leaf fall, until 100% leaf fall.
Light interception and radiation use efficiency (RUE)
Radiation use efficiency (RUE, g MJ-1) was calculated as the quotient of aboveground woody biomass productivity (AGWB - see below) and incoming short-wave radiation (I0). In addition, RUE was expressed in terms of percentage using an energy density of 19.5 GJ Mg-1 dry mass of wood ([49]). The intercepted short-wave radiation (Iint) was calculated based on the Beer-Lambert equation (eqn. 1):
where Itr is the radiation transmitted through the canopy and k is the extinction coefficient. Incoming short-wave radiation (0.3-3 µm) was continuously recorded with a pyranometer (CNR1, Kipp & Zonen, Delft, The Netherlands) and half-hourly averages were logged (W m-2), multiplied by 1800 s (J m-2) and summed over the growing season. Direct LAImax (GS1-2) and indirect LAImax corrected for BAI (GS3-4) were used to calculate k from the converted Beer-Lambert equation (eqn. 2):
where Itr/I0 was taken from the LAI-2200 measurements at LAImax, using the proportion of incoming radiation on the sensor angled between 7° and 53° zenith ([55]). Iint was expressed as the percentage of total incoming radiation during the growing season (Iint/I0 ·100).
Woody biomass
At the end of each growing season, the standing woody biomass was estimated from a diameter inventory of the winter habitus of the trees (described in detail by [55]). Genotype specific allometric relationships between stem diameter at 22 cm height and (harvestable) stem biomass were established at the end of each rotation, in December 2011 and in January 2014 ([7]). To this end, ten stems per genotype covering the frequency distribution of the stem diameter inventory of the entire plantation were harvested at 15 cm above soil level. This corresponded to the mean harvesting height at the plantation ([4]). Stem diameter at 22 cm (D) was plotted against stem dry mass (DM), after oven drying at 70 °C until constant weight, and an exponential curve was fitted for each genotype (eqn. 3):
resulting in genotype specific regression coefficients a and b, used to estimate the standing biomass. Trees closest to the location of the LAI-measurement plots were selected from the diameter inventory.
Aboveground woody biomass productivity (AGWB) was defined as the annual woody biomass dry mass in each growing season studied (Mg ha-1 year-1). The biomass yield was defined as the standing (harvestable) woody biomass at the end of each rotation, representing the sum of AGWB of two consecutive growing seasons for each plot (Mg ha-1 rotation-1).
Statistical analysis
Linear and non-linear relationships between the studied parameters (LAImax, LAD, Iint, RUE and AGWB) were fitted in SigmaPlot® version 12.5 (Systat Software, San Jose, CA, USA). Non-parametric Spearman’s rank correlation analyses were used to test for significant correlations between genotypic averages of the studied parameters for each growing season. Averages per genotype were used, which were normally distributed, according to a Shapiro-Wilk normality test. Nevertheless, non-parametric tests were used because the sample size was only twelve (one average value per genotype), which was considered not trustworthy for a parametric test. Relationships between production related characteristics and yield (plot averages per rotation) were analyzed using Pearson’s correlation coefficients. A generalized linear model (GLM) was fitted in SPSS® (IBM Corp., SPSS Statistics for Windows, Armonk, NY) as a non-parametric test to study significant differences between genotypes and parentage groups in the studied parameters.
Results
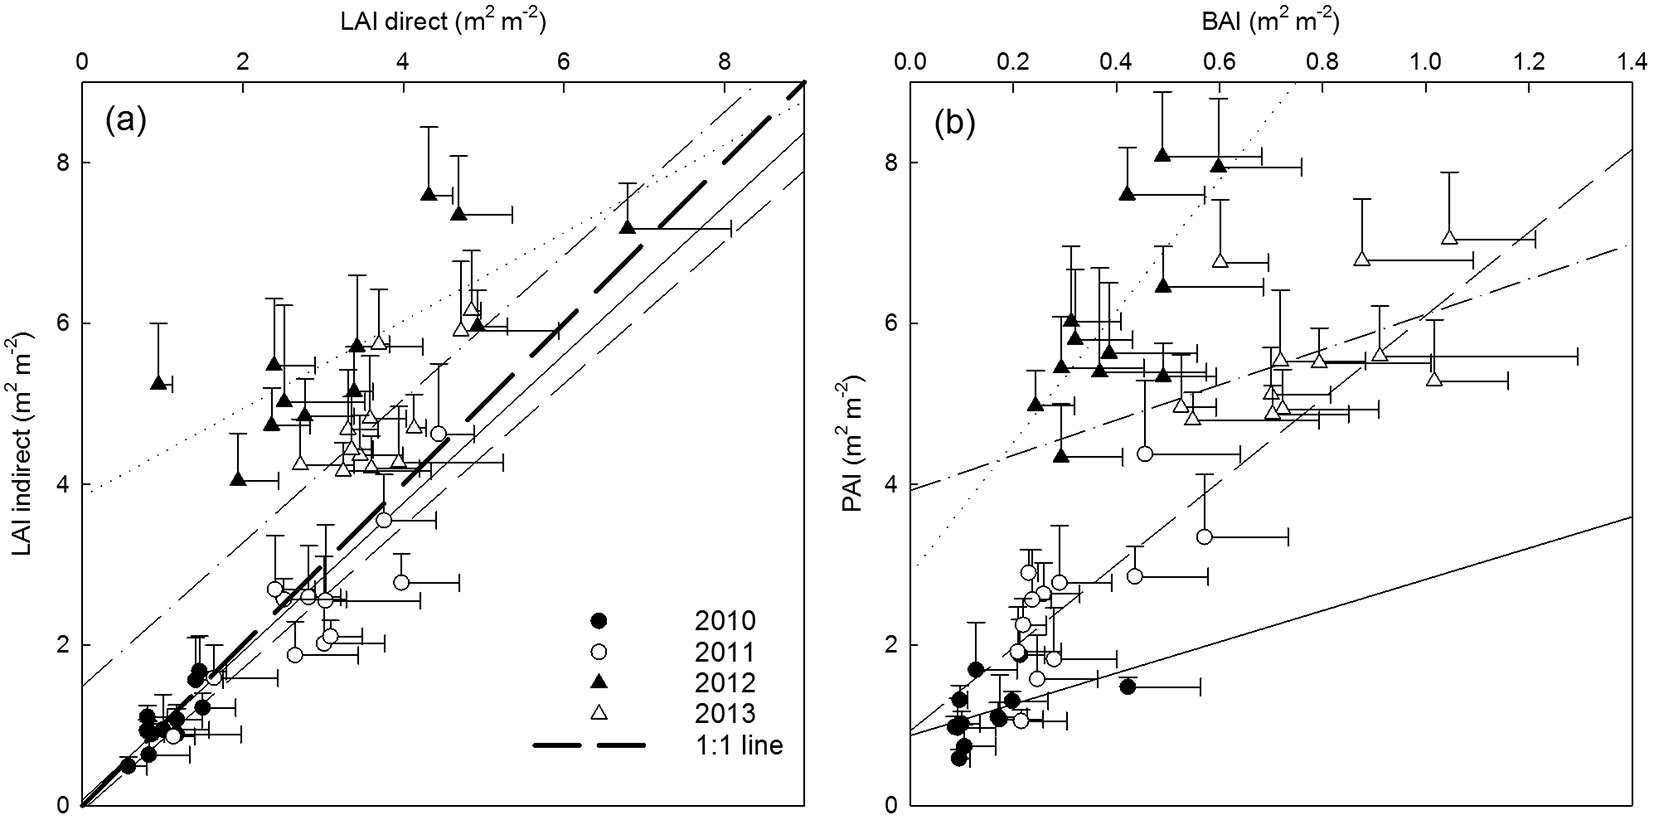
Direct and indirect assessments of LAImax were closely related as shown in Fig. 1a. Before coppice (GS1-2) there was a strong correlation (R² values of 0.69 and 0.74, respectively) between both methodologies, with a minor underestimation of the indirect method for larger LAI values. After coppice (GS3-4) the correlations between direct and indirect measurements were weaker but still significant (R² values of 0.60 and 0.58, respectively), with an overall overestimation of the indirect method. Several potential causes explain the small discrepancies between the direct and indirect LAI measurements: (i) the rapid canopy closure in the multi-stem culture after coppice could have caused early leaf fall due to shading of the lower crown parts, that were not collected in the leaf litter traps installed only near the end of the growing season; (ii) larger amounts of leaf fall in the litter traps after coppice enhanced leaf decomposition before emptying the litter traps; (iii) the multi-stem coppice structure hampered placement of the litter traps close to the stump of the tree, which might have reduced the representativeness of the plot area covered by the litter traps; (iv) the multi-stem coppice structure increased the risk of shading the sensor by lower leaves/branches close to the sensor in the dense canopy. Although both methods have their inherent limitations, we considered the indirect LAI values a validated representation of the effective LAI. Therefore, indirect assessments of LAI were used in all further analyses. BAI - at the time of LAImax - increased throughout the consecutive growing seasons (Fig. 1b) from 0.16 (on average) in 2010 to 0.76 (on average) in 2013. However, the relative contribution of BAI to maximum PAI was reduced in the first growing season after coppice (6.4% in GS3) as compared to the other growing seasons (13.4%, 12.9% and 14.1% in GS1, GS2 and GS4, respectively - Fig. 1b).
Fig. 1 - Genotypic averages (a) of direct vs. indirect maximum leaf area index (LAImax), and (b) of branch area index (BAI) in relation to plant area index (PAI) in four consecutive growing seasons: first rotation before coppice (GS1 and GS2) and second rotation after coppice (GS3 and GS4). Error bars indicate standard deviations, regression lines represent significant Spearman’s rank correlations (p<0.05; solid line = GS1, dashed line = GS2, dotted line = GS3, and dash-dotted line = GS4).
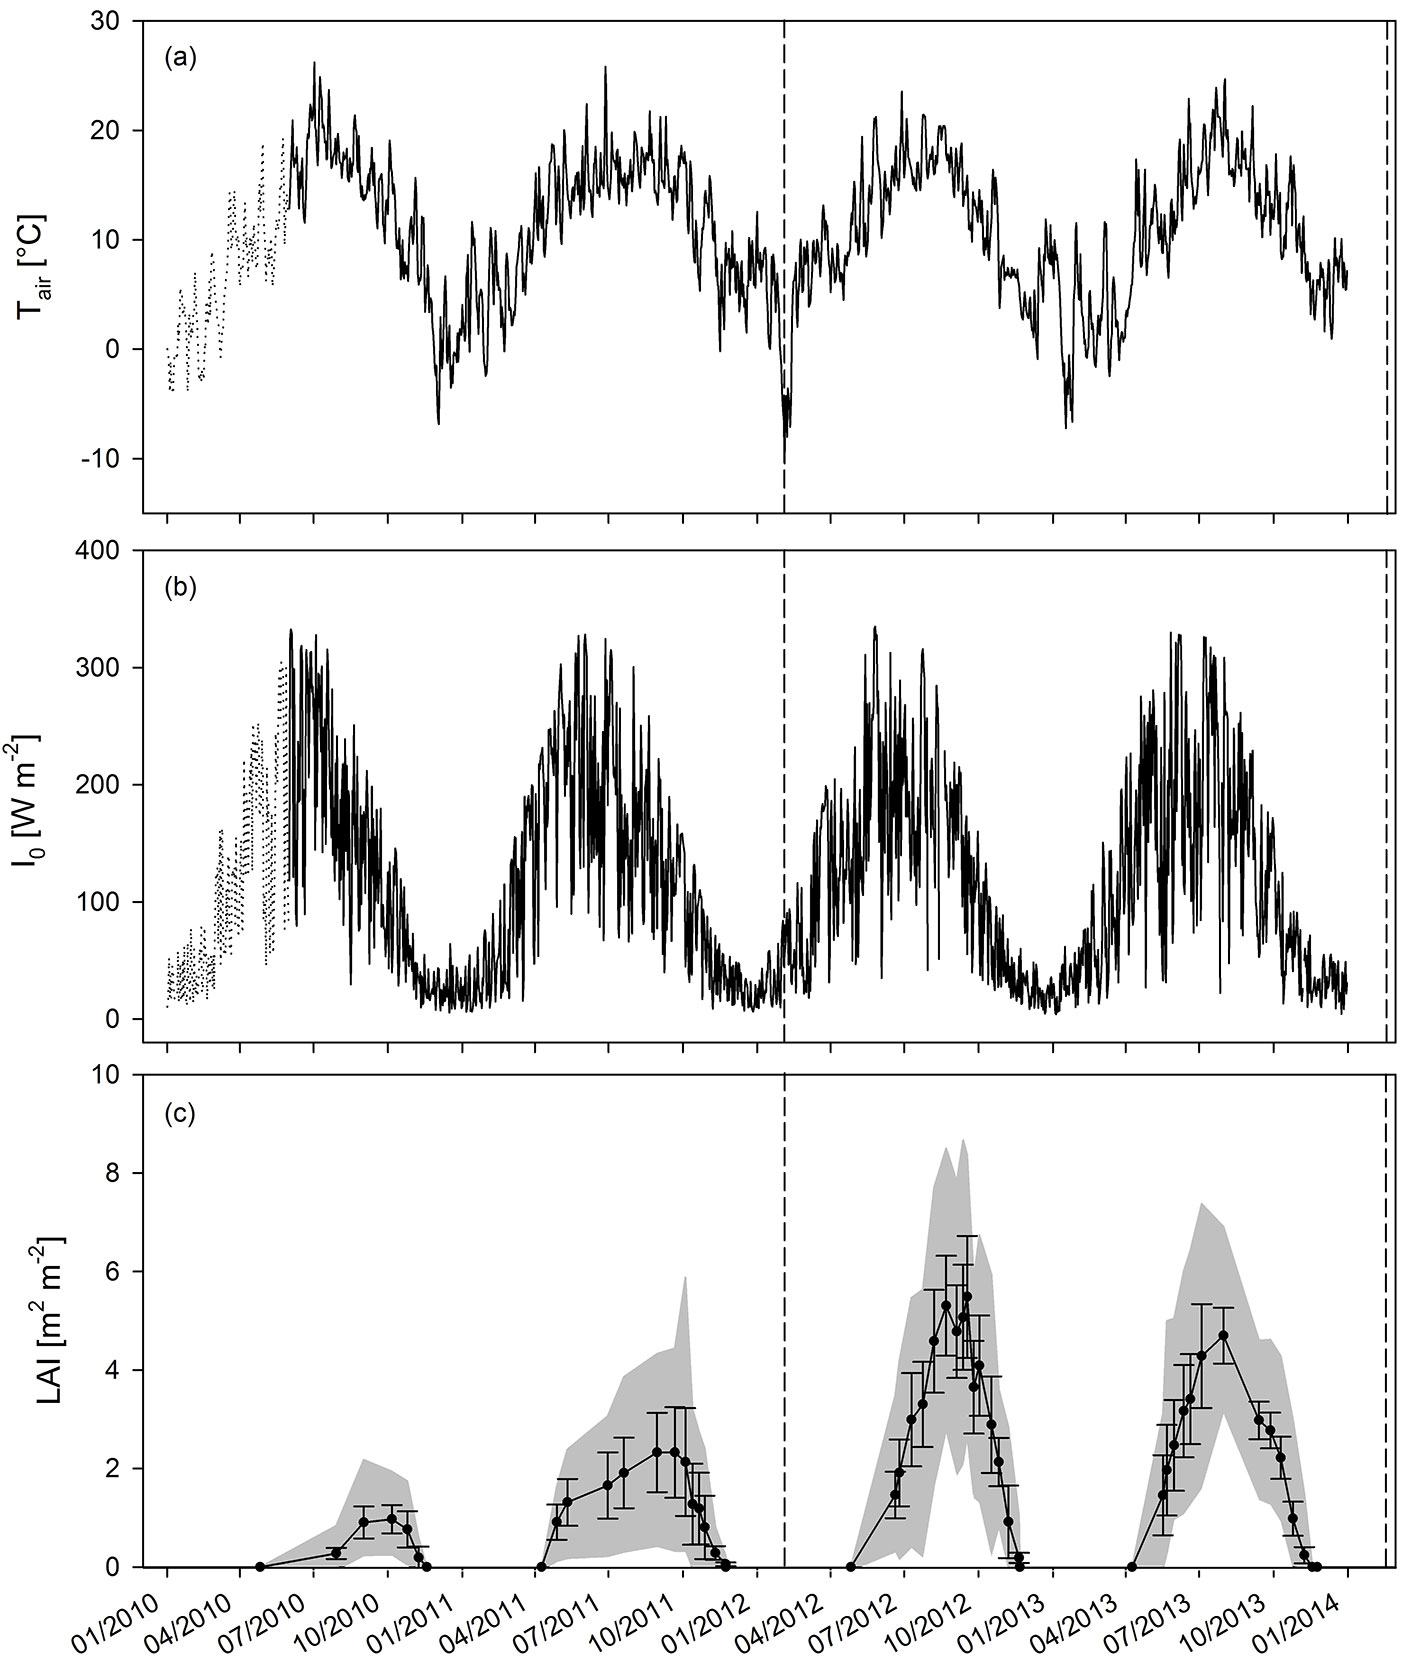
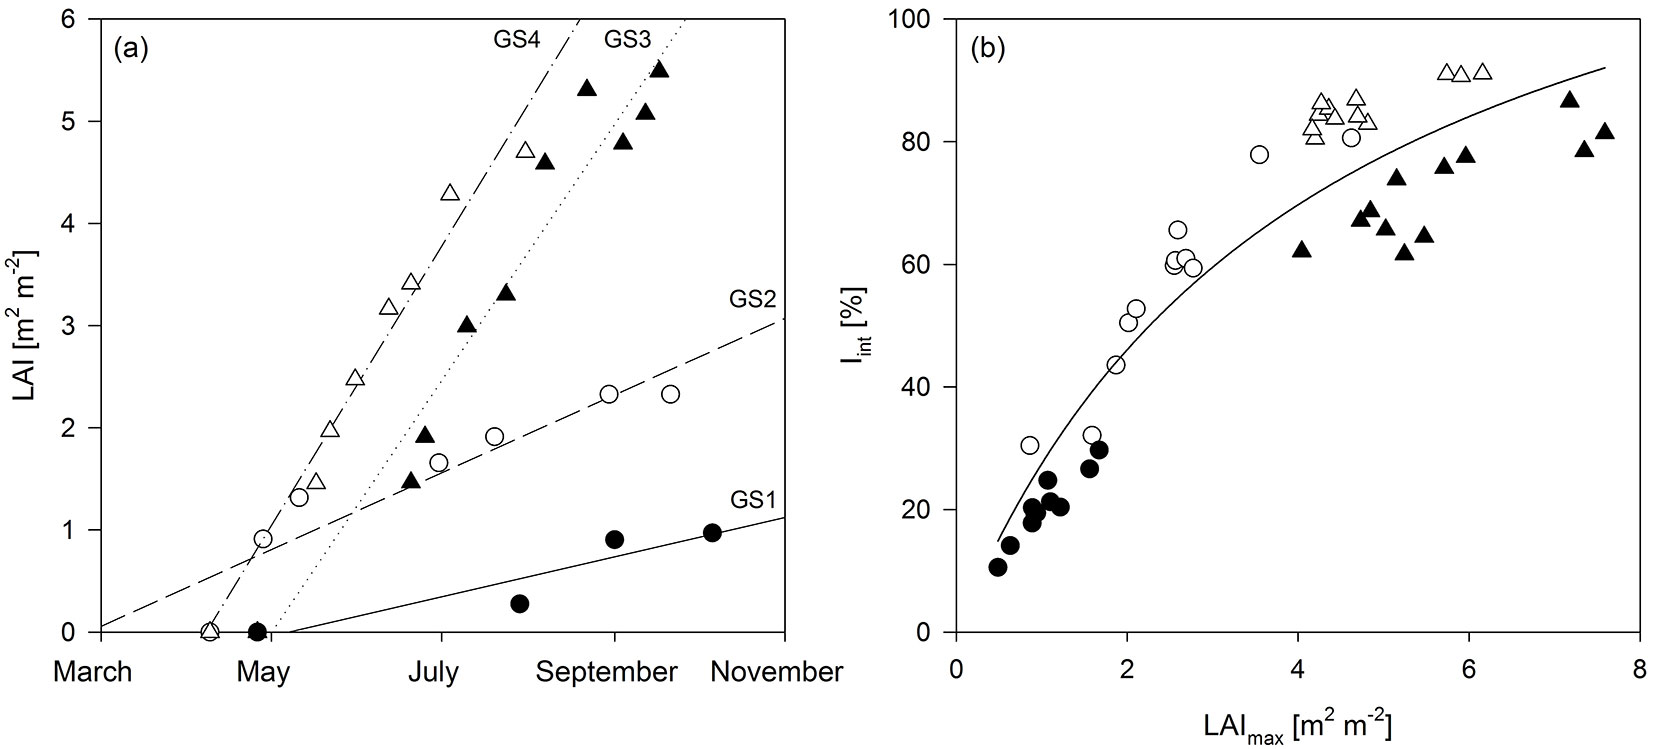
The time course of Tair, I0 and LAI for the four years of observation is shown in Fig. 2. The four years were similar in terms of the average temperature and incident radiation. The average annual and average growing season Tair were 9.8 and 14.5 °C in 2010; 11.5 and 14.9 °C in 2011; 10.5 and 14.3 °C in 2012; and 10.1 and 13.8 °C in 2013, respectively. The annual and growing season sums of I0 were 37 and 28 TJ ha-1 in 2010; 38 and 31 TJ ha-1 in 2011; 37 and 28 TJ ha-1 in 2012; and 37 and 30 TJ ha-1 in 2013, respectively. The development of leaf area during the growing season closely followed the evolution of Tair and I0 as presented in Fig. 2. The LAI reached maxima of 0.97 and 2.33 (averaged over the entire plantation) in GS1 and GS2 (before coppice), respectively, and of 5.49 and 4.70 in GS3 and GS4 (after coppice), respectively. Therefore, LAImax increased up to the third growing season, and reached a plateau during R2. The rate of LAI increment over time strongly increased in R2 (Fig. 3a) as a result of the coppicing. Within each rotation, a similar slope of LAI increment rate was observed between the two growth years. The curve was shifted upward due to an earlier start of leaf area development in the non-coppice years within each rotation (i.e., second growing season of each rotation - Fig. 3a). The slope of the curves strongly increased from R1 to R2, thus in the coppiced culture the leaf area increment rate was higher as compared to the non-coppiced culture. With increasing LAImax over the course of the different growing seasons, also Iint increased (Fig. 3b). As expected from the Beer-Lambert equation, this correlation was well described by a common logarithmic pattern.
Fig. 2 - Seasonal time course of (a) air temperature (Tair), (b) incoming short-wave radiation (I0) and (c) leaf area index (LAI ± standard deviation and genotypic maximum and minimum values) during four growing years (two rotations; GS1-4). Dashed vertical lines indicate the time of coppice of the entire plantation.
Fig. 3 - (a) Evolution of leaf area index (LAI) until maximum LAI was reached, and (b) the overall (hyperbolic) relationship between maximum leaf area index (LAImax) and intercepted radiation (Iint) over four years of the short-rotation coppice (Iint = 143.13 · LAImax/(4.21 + LAImax) - R² = 0.88). Solid and open circles indicate the first and second growing seasons (GS1 and GS2, respectively), before coppice; solid and open triangles indicate GS3 and GS4, respectively, after coppice. The slopes of the fitted curves in (a) indicate leaf area increment rate. Intercepts and R² were 0.0063 and 0.86 in GS1; 0.0123 and 0.87 in GS2; 0.0404 and 0.95 in GS3; 0.0448 and 0.97 in GS4, respectively.
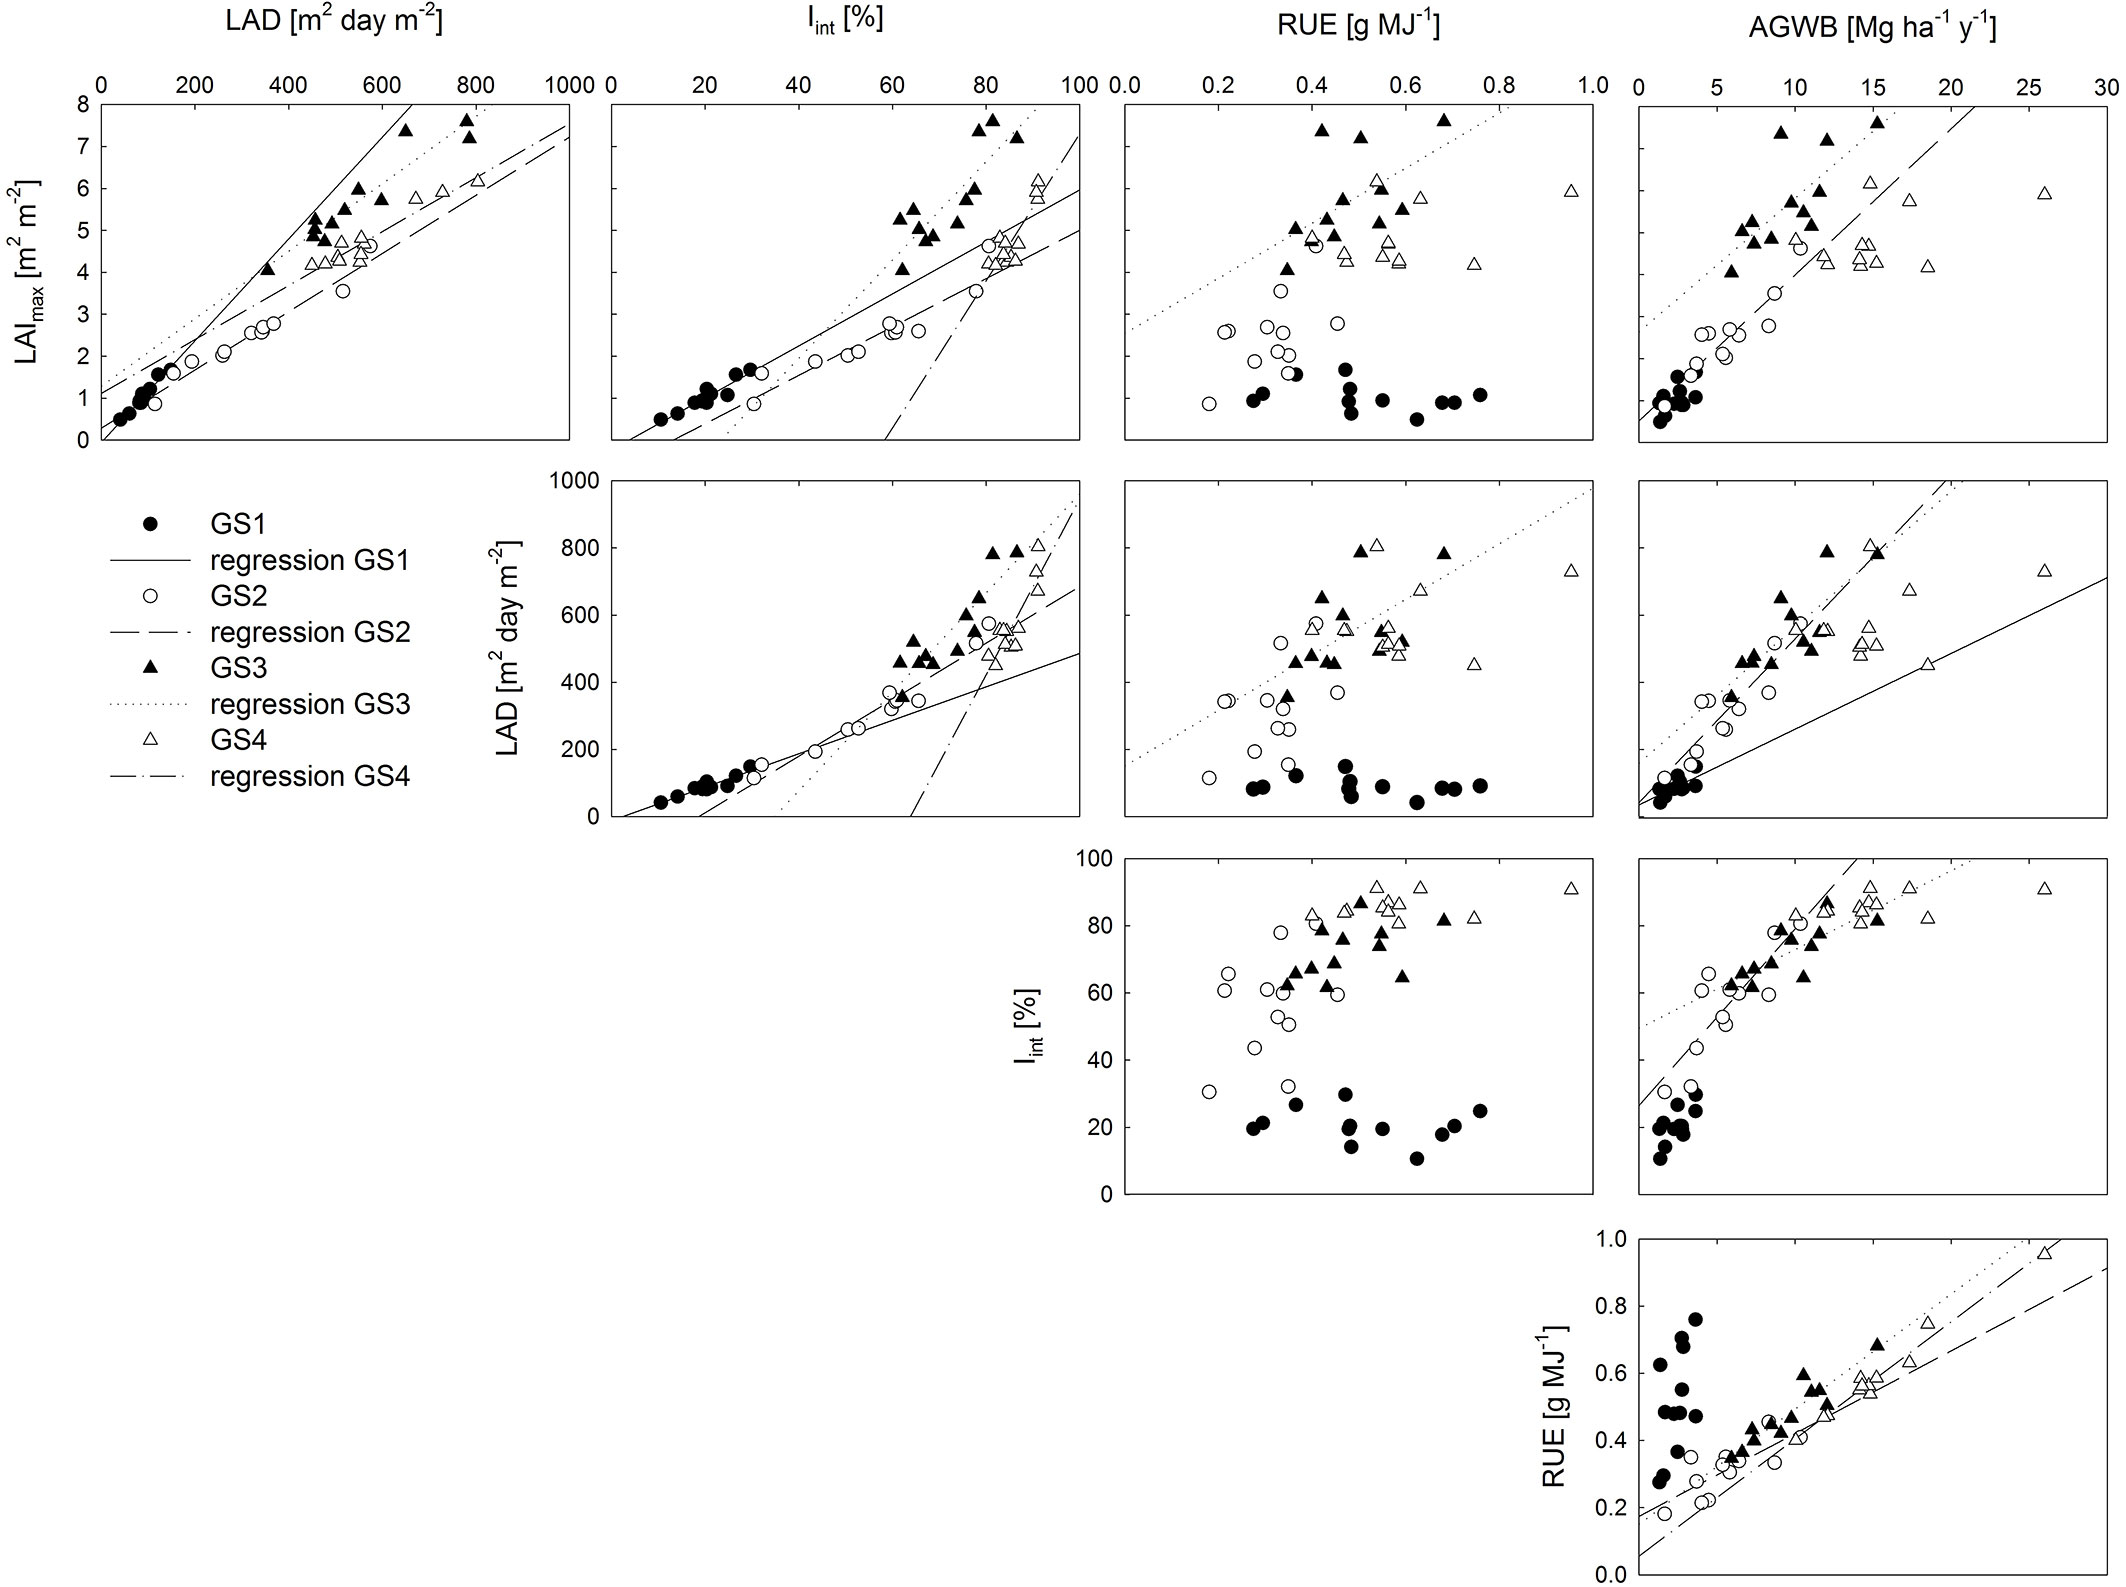
The correlation among the studied parameters, as well as their relationship to AGWB, varied among the different years of observation (Fig. 4). The (semi-auto) correlation between LAImax and LAD was significant in all growing seasons, as was the correlation between LAImax (and hence LAD) and Iint. Overall, the variation in LAI and LAD explained the variation in Iint better than the variation in AGWB. LAImax and LAD were significantly related to RUE in GS3 only, i.e., the first year after coppice. No significant correlation was found between Iint and RUE in any of the studied growing seasons. LAImax and Iint were significantly correlated to AGWB in GS2 and GS3, while LAD was significantly correlated to AGWB in GS1 as well, in addition to GS2 and GS3. A significant correlation was found between RUE and AGWB in all growing seasons except in the establishment year (GS1 - Fig. 4). The biomass yield at the end of both rotations was significantly and positively related with the rotation sums of LAD and Iint as well as with the RUE averaged over each rotation (Tab. 2). The Pearson correlation coefficients with biomass yield were similar for the studied parameters in R1, while RUE was the strongest determinant of biomass yield in R2 (Tab. 2).
Fig. 4 - Correlation matrix of production-related characteristics: maximum leaf area index (LAImax, m2 m-2), leaf area duration (LAD, m2 day m-2), intercepted radiation (Iint, %), radiation use efficiency (RUE, g MJ-1) and aboveground dry woody biomass production (AGWB, Mg ha-1). Data points represent genotypic averages; regression lines represent significant Spearman’s Rank correlations (p<0.05).
Tab. 2 - Pearson correlation coefficients between production related characteristics and biomass yield of the first (R1, n = 48) and second (R2, n = 96) rotation. (LAD): leaf area duration; (RUE): radiation use efficiency; (Iint): intercepted radiation.
| Rotation | Parameter | Yield R1 |
Yield R2 |
|---|---|---|---|
| R1 | LAD | 0.764*** | - |
| RUE | 0.768*** | - | |
I int |
0.721*** | - | |
| R2 | LAD | - | 0.563*** |
| RUE | - | 0.973*** | |
I int |
- | 0.570*** |
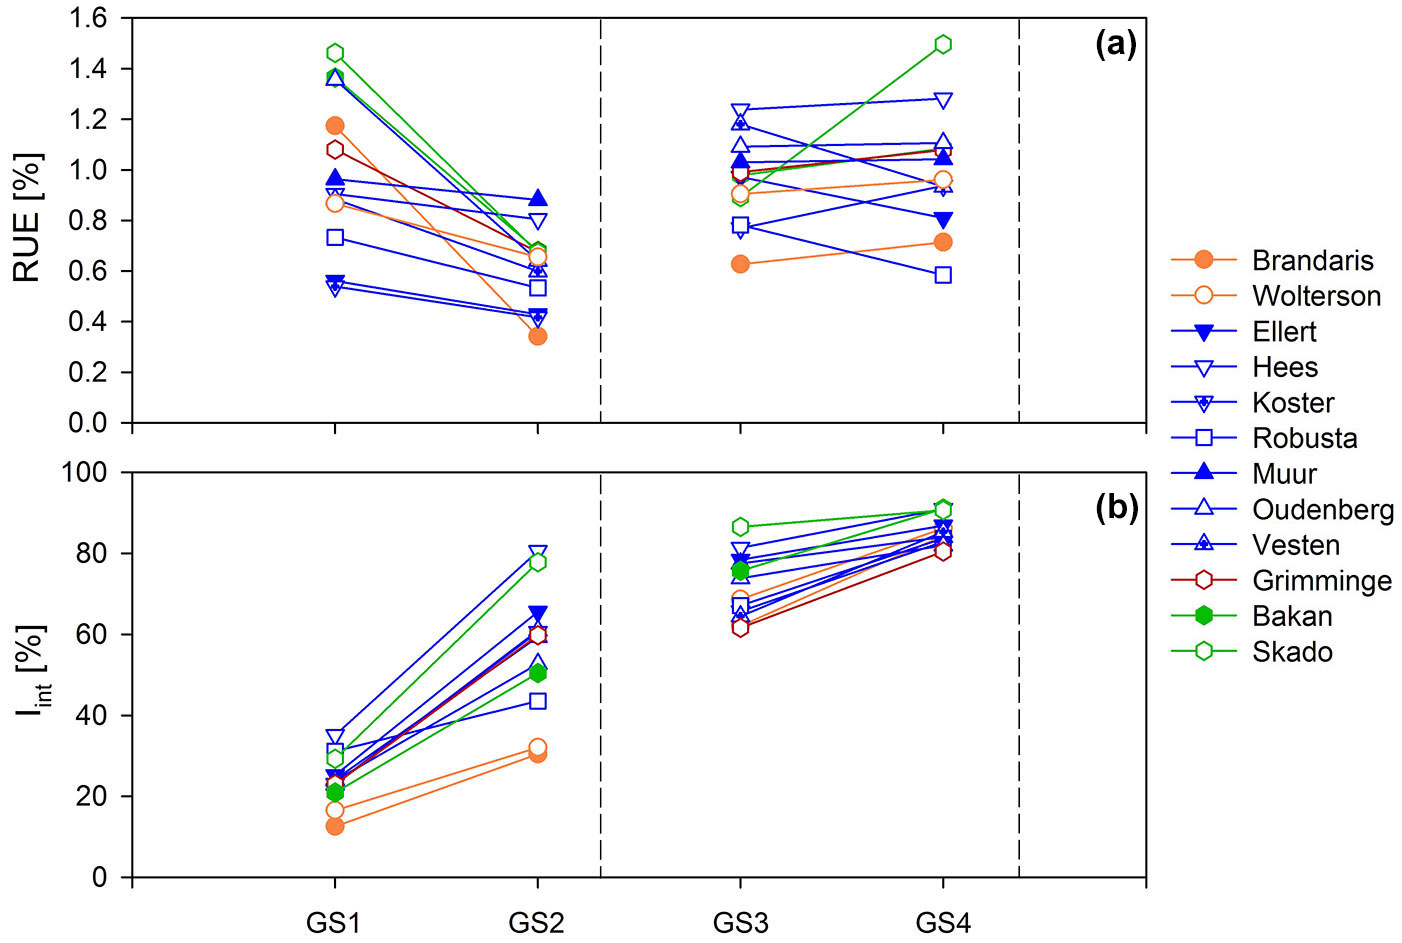
Significant genotypic and parentage variation was observed in all studied parameters (Fig. 5, Appendix 1). In R1 a threefold variation in LAImax (0.49-1.68 m2 m-2) and LAD (40.5-148.1 m2 day m-2) was found among the different genotypes during the establishment year, which even increased in GS2 (0.87-4.63 m2 m-2 and 114.4-574.1 m2 day m-2, respectively). This was in line with the genotypic variation in AGWB (1.37-3.65 Mg ha-1 in GS1 and 1.65-10.36 Mg ha-1 in GS2) as well as in Iint (10.6-29.7% in GS1 and 30.43-80.59% in GS2). Genotype Hees was the best performing genotype, showing the highest values for LAImax, LAD, AGWB and Iint throughout R1. Genotype Brandaris performed weakest (Appendix 1). When all genotypes were considered, RUE ranged from 0.54 to 1.46% (0.28-0.76 g MJ-1) in GS1 and from 0.34 to 0.88% (0.21-0.45 g MJ-1) in GS2 (Fig. 5, Appendix 1). A change in genotypic ranking was observed from GS1 to GS2.
Fig. 5 - Genotypic annual averages of (a) radiation use efficiency (RUE), and (b) intercepted radiation (Iint) for twelve poplar genotypes during two consecutive two-year rotations of short rotation coppice. Colors indicate parentage groups (explained in Tab. 1), dashed lines indicate the time of coppice of the entire plantation.
Overall, genotypic as well as within-genotype variability decreased towards R2, as indicated by a decreasing coefficient of variation for all studied parameters (Appendix 1). For example, the genotypic variation in Iint gradually decreased with a progressively closing canopy (Fig. 5). The genotypic variation in LAImax (4.05-7.59 m2 m-2 in GS3 and 4.17-6.16 m2 m-2 in GS4) and in LAD (355.0-785.8 m2 day m-2 in GS3 and 449.5-803.8 m2 day m-2 in GS4) was considerable (almost twofold). The variation in LAImax and LAD was smaller than the threefold variation in AGWB in GS3 (5.93-15.28 Mg ha-1), but corresponded to the twofold variation in AGWB in GS4 (11.83-26.00 Mg ha-1). In contrast to R1, this was not in line with the variation in Iint which varied only 5% in GS4 (Fig. 5, Appendix 1). Genotypes Hees and Skado were among the best performers in GS3 (highest biomass yield); genotypes Bakan and Skado performed best in GS4. The lowest growth performance was observed in genotype Brandaris in GS3, in line with R1. In GS4, genotypes Oudenberg and Grimminge scored lowest in terms of LAI development; genotypes Koster and Robusta had the lowest AGWB and RUE (Appendix 1). The range of genotypic average RUE increased from GS3 (0.63-1.24% or 0.35-0.68 g MJ-1) to GS4 (0.58-1.50% or 0.40-0.95 g MJ-1), with shifts in genotypic ranking (Fig. 5).
Significant differences among parentage groups were found for all the studied parameters, with the exception of RUE in GS2 (Appendix 1). After the establishment year, the T × M genotypes showed the highest growth performance, but the difference with D × N and D × (T × D) genotypes was only significant in GS4. The lowest growth performance was observed for the N genotypes, but AGWB was significantly lower than for all other parentage groups in GS2 only.
Discussion
Determinants of biomass yield
The average LAI close to 1 during the establishment year was within the range of values reported for one-year old high density poplar plantations ([40], [48]). The values of LAImax observed during the consequent growing seasons were comparable to values reported for various willow ([38], [52], [43]) and poplar SRC cultures ([16], [35], [2], [25]). The seasonal evolution of leaf area development with a maximum near the end of the summer reflects the indeterminate deciduous growth habit of poplar and confirmed earlier reports for poplar ([16], [29], [25]) and willow ([38], [27], [52]). LAI and leaf area increment rate increased significantly after coppice, from the first to the second rotation confirming the positive effect of coppicing on leaf area development and canopy closure ([45], [52]). Reduced LAI after coppice has only been observed in poplar as a result of insect damage ([44]). Insect damages were not actively monitored in our experiment, but neither insect populations nor other leaf pathogens exerted a significant influence.
LAImax increased during the first rotation but saturated during the second rotation. This suggests that a stable LAI was reached during the second rotation in contrast to previous observations in poplar SRC ([2]). This could be potentially explained by increasing self-shading and leaf shedding in the lower crown parts after canopy closure in the multi-stem culture (after coppice). From our observations, the crown depth moved upwards with the growing trees from GS3 to GS4, confirming this hypothesis. The leaves or canopy reached almost until soil level in GS3, while a considerable leafless part of the stems was observed in the lower crown parts in GS4. When radiation interception was higher than 90% LAI decreased after canopy closure in a willow SRC ([9]). A saturating Iint with LAI confirmed that a further increase of LAI did not contribute to a higher radiation interception ([5]). In SRC the annual radiation interception is influenced by early leaf display (spring leaf area development - [44]). The reduced LAI at the start of the growing season after coppice was, however, largely compensated for by the accelerated leaf area development, explaining the increasing Iint over the four years of the two rotations.
Since the RUE values were based on the interception of total solar radiation, the values should be multiplied by two approximately in order to be compared to RUE values based on the interception of photosynthetically active radiation (PAR, 0.4-0.7 µm; [12], [16]), as frequently reported in the literature. Doubled values observed in this study were very high during the establishment year as compared with the establishment year of another poplar SRC ([17]). This difference could be partly explained (i) by the favorable growth conditions (i.e., high nutrient availability of former agricultural land - [55]) and hence the high survival and growth rates; and (ii) by to different below- vs. aboveground biomass allocation, which potentially favored aboveground more in the present study due to the high nutrient status of the soil ([6]). However, the RUE observed in this study was in the lower end of the range reported for well-established poplar ([16], [28], [26]) and willow SRC cultures ([47], [9], [52]). Overall, the plantation average radiation use efficiency of 0.7% in R1 and 1% in R2 was in line with the energy use efficiencies of less than 1% for most woody species reported by Larcher ([33]).
We see two possible explanations for the decrease in RUE from GS1 to GS2, both in absolute numbers and in the genotypic range: (i) a few short periods of dry soil conditions at high solar radiation in GS2 ([7]) might have limited leaf area development; (ii) the high genotypic variation in RUE during GS1 could also be attributed to genotypic differences in cutting quality (diameter, water content, rooting capacity, etc.). The latter might have resulted in a different allocation to the various tree compartments. After coppice (in GS3-GS4) RUE increased as compared to GS2. This increase is potentially the result of the higher carbon stocks in the roots, the high photosynthetic rates of the resprouting stumps and the limited self-shading shortly after coppice ([16]).
Genotypic variation
Across genotypes, LAD, Iint and RUE were all strong and reliable determinants of biomass yield during the first rotation. The relative importance of RUE in explaining the variation in biomass yield increased during the second rotation, when LAI and Iint saturated. These results confirm previous observations of a strong correlation between RUE and AGWB, whereas Iint was unrelated to AGWB in high density poplar plantations ([26]). Similarly, lower AGWB rather than reduced LAI and Iint negatively affected RUE in willow SRC in Sweden ([37]). The relative importance of both factors, Iint and RUE, varies with levels of competition within the canopy in willow ([9], [52]). Maximum AGWB was achieved by a combination of high Iint and a high RUE after coppice ([52]).
The fraction of intercepted radiation is determined by LAI, LAD and canopy structure (leaf and branch morphology and orientation - [11]). Canopy structure seemed less important than the amount of foliage in high density plantations ([16]). The strong correlations of both LAI and LAD with Iint reported here were in line with these findings. Besides LAI, LAD and canopy structure, RUE is also influenced by leaf photosynthetic capacity and by the allocation pattern of photosynthates to different tree compartments ([31], [53]). As we found no correlation between genotypic means of Iint and RUE, there might have been an effect of photosynthesis and/or partitioning of assimilates on the conversion efficiency of radiation energy in woody biomass. Superior growth of poplar SRC is, however, not always associated with different allocation patterns, as shown for different hybrids and P. deltoides clones ([22]). Genotypic variation in photosynthesis is related to leaf structural (e.g., leaf mass per area, LMA) and biochemical (e.g., leaf N concentration) parameters ([14], [56], [8]). Significant genotypic differences have already been documented for LMA, leaf N concentration, maximum carboxylation rate (Vc max) and other photosynthetic parameters ([14], [55], [6], [8]).
The significant genotypic and parentage variation in leaf area development (LAI and LAD - [36], [18], [42]) and light use efficiency (Iint, RUE and AGWB - [17], [26], [10], [19], [41]) confirmed previous observations in poplar, although for other interspecific hybrids and genotypes. Smaller variation within related genotypes suggests a genetic control of the studied parameters. The above mentioned relationships with AGWB indicate shifts in the relative contribution of these parameters to yield over the years and rotations of the plantation. For example, during the establishment year genotypic variation in LAImax, Iint and RUE did not explain variation in AGWB. These results suggest that yield improvement by selecting genotypes for specific growth parameters should take planting density, and consequently canopy light penetration, into account.
Conclusions
Coppicing enhanced leaf area development, radiation interception and woody biomass productivity of the studied SRC poplar plantation. High total leaf area and RUE equally contributed to the high biomass yield during the establishment phase, while RUE became the most important determinant of biomass yield after coppice. The absence of a correlation between Iint and RUE suggests the potential of selecting for genotypes combining high LAI and photosynthetic capacity, to maximize yield and sustainability of poplar SRC cultures.
Acknowledgements
This research has received funding from the European Research Council under the European Commission’s Seventh Framework Programme (FP7/2007-2013) as ERC grant agreement no. 233366 (POPFULL), as well as from the Flemish Hercules Foundation as Infrastructure contract ZW09-06. Further funding was provided by the Flemish Methusalem Programme and by the Research Council of the University of Antwerp. We gratefully acknowledge Joris Cools for excellent technical support, Kristof Mouton for logistic support at the field site, thesis students Raphaël Vossen (University of Antwerp, Belgium) and Kübra Sönmezoglu (Marmara University, Turkey) as well as Dr. Isabele Sarzi Falchi (Instituto Florestal, Secretaria do Meio Ambiente/Governo do Estado de São Paulo, Brazil) for invaluable assistance with field work.
LS Broeckx and SPP Vanbeveren have equally contributed to this work.
References
Gscholar
CrossRef | Gscholar
Gscholar
Gscholar
Gscholar
CrossRef | Gscholar
Gscholar
CrossRef | Gscholar
Gscholar
Authors’ Info
Authors’ Affiliation
Stefan PP Vanbeveren
Melanie S Verlinden
Reinhart Ceulemans
Department of Biology, Research Group of Plant and Vegetation Ecology, University of Antwerp, Universiteitsplein 1, Wilrijk B-2610 (Belgium)
Corresponding author
Paper Info
Citation
Broeckx LS, Vanbeveren SPP, Verlinden MS, Ceulemans R (2015). First vs. second rotation of a poplar short rotation coppice: leaf area development, light interception and radiation use efficiency. iForest 8: 565-573. - doi: 10.3832/ifor1457-008
Academic Editor
Giorgio Matteucci
Paper history
Received: Sep 25, 2014
Accepted: Mar 10, 2015
First online: Apr 27, 2015
Publication Date: Oct 01, 2015
Publication Time: 1.60 months
Copyright Information
© SISEF - The Italian Society of Silviculture and Forest Ecology 2015
Open Access
This article is distributed under the terms of the Creative Commons Attribution-Non Commercial 4.0 International (https://creativecommons.org/licenses/by-nc/4.0/), which permits unrestricted use, distribution, and reproduction in any medium, provided you give appropriate credit to the original author(s) and the source, provide a link to the Creative Commons license, and indicate if changes were made.
Web Metrics
Breakdown by View Type
Article Usage
Total Article Views: 53895
(from publication date up to now)
Breakdown by View Type
HTML Page Views: 44792
Abstract Page Views: 3339
PDF Downloads: 4209
Citation/Reference Downloads: 40
XML Downloads: 1515
Web Metrics
Days since publication: 3902
Overall contacts: 53895
Avg. contacts per week: 96.69
Article Citations
Article citations are based on data periodically collected from the Clarivate Web of Science web site
(last update: Mar 2025)
Total number of cites (since 2015): 16
Average cites per year: 1.45
Publication Metrics
by Dimensions ©
Articles citing this article
List of the papers citing this article based on CrossRef Cited-by.
Related Contents
iForest Similar Articles
Research Articles
A comparative study of four approaches to assess phenology of Populus in a short-rotation coppice culture
vol. 9, pp. 682-689 (online: 12 May 2016)
Research Articles
Influence of inorganic salts on biomass production, biochemical composition, and bioethanol production of Populus alba
vol. 13, pp. 566-574 (online: 07 December 2020)
Research Articles
Preliminary study on genetic variation of growth traits and wood properties and superior clones selection of Populus ussuriensis Kom.
vol. 12, pp. 459-466 (online: 29 September 2019)
Research Articles
Nutritional, carbon and energy evaluation of Eucalyptus nitens short rotation bioenergy plantations in northwestern Spain
vol. 9, pp. 303-310 (online: 05 October 2015)
Research Articles
Effective woody biomass estimation in poplar short-rotation coppices - Populus nigra × P. maximowiczii
vol. 16, pp. 202-209 (online: 25 July 2023)
Research Articles
Comparison of alternative harvesting systems for selective thinning in a Mediterranean pine afforestation (Pinus halepensis Mill.) for bioenergy use
vol. 14, pp. 465-472 (online: 16 October 2021)
Research Articles
Tree aging does not affect the ranking for water use efficiency recorded from δ13C in three Populus deltoides × P. nigra genotypes
vol. 12, pp. 272-278 (online: 21 May 2019)
Research Articles
Carbon emission reduction potentials through thinned wood in Japan
vol. 4, pp. 107-112 (online: 01 June 2011)
Research Articles
Growth dynamics and productivity of pure and mixed Castanea sativa Mill. and Pseudotsuga menziesii (Mirb.) Franco plantations in northern Portugal
vol. 7, pp. 92-102 (online: 18 December 2013)
Research Articles
Estimation of forest leaf area index using satellite multispectral and synthetic aperture radar data in Iran
vol. 14, pp. 278-284 (online: 29 May 2021)
iForest Database Search
Search By Author
Search By Keyword
Google Scholar Search
Citing Articles
Search By Author
Search By Keywords
PubMed Search
Search By Author
Search By Keyword

